Article

Methanotrophic Inoculation Reduces Methane Emissions from Rice Cultivation Supplied with Pig-Livestock Biogas Digestive Effluent

1
United Graduate School of Agricultural Science, Tokyo University of Agriculture and Technology, Tokyo 183-8509, Japan
2
College of Environment and Natural Resources, Can Tho University, 3/2 Street, Can Tho City 900000, Vietnam
3
College of Agriculture, Ibaraki University, 3-21-1 Chuou, Ami-machi 300-0393, Ibaraki, Japan
4
Department of Microbial Technology, Institute of Food and Biotechnology, Can Tho University, 3/2 Street, Can Tho City 900000, Vietnam
*
Author to whom correspondence should be addressed.
Agronomy 2024, 14(6), 1140; https://doi.org/10.3390/agronomy14061140
Submission received: 10 May 2024 / Revised: 22 May 2024 / Accepted: 23 May 2024 / Published: 27 May 2024
(This article belongs to the Section Farming Sustainability)

Abstract

:
Biogas digestive effluent (BDE) is a nutrient-enriched source that can be utilized as an organic fertilizer for rice cultivation without synthetic fertilizer (SF) application. However, a primary concern is the stimulation of methane (CH4) emissions due to the enrichment of the labile organic carbon, a favorite substrate of methanogenic archaea. Methanotrophs potentially reduce greenhouse gas (GHG) emissions from rice fields owing to metabolizing CH4 as a carbon source and energy. We therefore examined the effect of the application of methanotroph-inoculated BDE to the rice cultivated paddy soil on GHG emissions and rice productivity under a pot experiment. Methanotrophs (Methylosinus sp. and Methylocystis sp.), isolated from the Vietnamese Mekong Delta’s rice fields, were separately inoculated to the heated BDE, followed by a 5-day preincubation. Methanotroph-inoculated BDE was supplied to rice cultivation to substitute SF at 50% or 100% in terms of nitrogen amount. The results showed that the total CH4 emissions increased ~34% with the application of BDE. CH4 emissions were significantly reduced by ~17–21% and ~28–44% under the application of methanotroph-inoculated BDE at 100% and 50%, respectively. The reduction in CH4 was commensurate with the augmentation of pmoA transcript copy number under methanotroph-inoculated BDE. In addition, methanotroph-inoculated BDE application did not increase nitrous oxide (N2O) emissions and adversely affect rice growth and grain productivity. This study highlighted the BDE-recirculated feasibility for a lower CH4 emission rice production based on methanotrophs where high CH4-emitting fields were confirmed.

1. Introduction

Rice production is a significant source of anthropogenic net methane (CH4) and nitrous oxide (N2O) emissions [1]. The global warming potential (GWP) of CH4 and N2O is about 34 and 298 times higher than that of carbon dioxides (CO2) over a 100-year period [2]. Among food crops, rice crops have the highest area-scaled and yield-scaled emissions [3]. Moreover, agriculture practices, such as the application of straw biomass and synthetic fertilizer (SF) in high temperatures or rainfall, can lead to increased CH4 and N2O emissions due to the increasing availability of substrates for methanogens and substrates in the nitrification and denitrification process [1,4]. As such, climate change, combined with the expansion of rice production area, is significantly contributing to the increase in greenhouse gas (GHG) emissions. Therefore, sustainable rice production requires appropriate agriculture practice strategies.
Biogas digestive effluent (BDE) is produced through the anaerobic digestion of livestock wastes or biodegradable materials [5,6]. It is estimated that Vietnam has a total of 500,000 digesters installed to treat approximately 80 Mt year−1 of animal wastes, of which small-scale digesters (<50 m3) account for the largest proportion [7,8]. The effluent provides an appropriate nutrient source for plants [9]. However, BDE is typically discharged into the external environment [10]. As BDE is a nutrient-enriched cascading digestate, pushing the effluent into water bodies causes environmental pollution (i.e., eutrophication and water-borne diseases) [11]. Eutrophication has been raised in several countries due to the excessive organic carbon, nitrogen (N) and phosphorus (P) from livestock wastes, which has consequences for public health [11,12]. This issue has been noticed in Vietnam, where 50% of animal wastes are untreated properly [8]. Hence, the effective use of BDE nutrients to minimize environmental loads is currently encouraged.
The BDE application for crops reduces not only ecological and environmental contamination but also relatively or absolutely substitutes for SF and saves on farming costs [9,13]. Moreover, reusing BDE for rice paddy fields can improve soil fertility by enriching organic matter, amino acids, bioactive substances, and various nutrients [9,14,15]. In fact, the cascade utilization of digestate for rice cultivation has recently been noticed in terms of its nutrient availability and yield-unsacrificed feasibility [16,17,18]. However, a major concern in employing BDE for rice crops has been remarked as potential risks of higher CH4 flux. Although there is considerable heterogeneity in CH4 flux magnitude among studies, the average augmentation of CH4 emissions from rice fields applied with BDE/slurry varies from ~19.4 to 85.9% compared to conventional cultivation [19,20,21]. In contrast, the application of BDE for rice cultivation does not promote N2O emissions compared to SF-applied fields. In fact, cattle BDE applied to rice fields in the Vietnamese Mekong Delta (VMD) reduced N2O emissions by 52% compared to conventional rice cultivation [20]. However, N2O emissions are a minor contribution to GWP from rice production compared to CH4 emissions (~94%) [1]. Therefore, the application of the BDE for rice agriculture is unsustainable without the appropriate CH4 emissions mitigation measurements.
Higher CH4 emissions from fields applied with BDE could be attributable to the expansion of organic matter, especially the intensification of soil labile or dissolved organic carbon [1,22,23]. Indeed, BDE/slurry remains ~0.4–1.8 g carbon per litter [17,20]. Therefore, the BDE irrigation fuels anaerobic carbon mineralization, which is a substrate preferred by methanogens (CH4-producing archaea), resulting in higher CH4 emissions [1]. Meanwhile, CH4 emission mitigation strategies for fields applied with BDE have not been fully developed. To date, only a handful of studies have examined water management practices by alternative wetting and drying (AWD) and midseason drainage followed by intermittent irrigation (MiDi) on reducing CH4 emissions from fields applied with cattle BDE in rice fields of the VMD [20] and Fuchu, Tokyo, Japan [24]. The CH4 emission AWD reduction under such water management could be attributed to the amelioration of reductive soil conditions relative to continuous flooding [20]. However, CH4 emissions and GWP remain higher in the BDE-applied fields than in SF-applied fields. The lower N2O emissions from BDE-applied fields could be due to the lower content of N-NH4+, which is a substrate for nitrification versus SF-fertilized fields [20]. Thus, developing effective methods to decrease CH4 flux from fields irrigated with BDE has generated considerable research interest.
The methanotrophs (CH4-oxidizing bacteria) use CH4 as their sole carbon and energy source [25], which regulates CH4 emissions from rice paddy ecosystems [26]. In rice paddy fields, CH4 is oxidized mainly aerobically by methanotrophs in the topsoil and rhizosphere, where O2 and CH4 correspond [1]. The aerobic methanotrophic population can oxidize ~60–80% of CH4 before it is released into the atmosphere [27]. Of which, anaerobic methanotrophs consume 10–20% of CH4 through the alternative electron acceptors (NO3, NO2, Mn4+, Fe3+, SO42− and organic substances) [28,29]. Consequently, aerobic methanotrophs could behave as the most critical biotic carbon sink in the paddy fields. Increasing the aerobic conditions or aerobic methanotrophic inoculation could also be a promising approach in CH4 flux reduction strategies from high CH4-emitting rice cultivation owing to BDE irrigation.
The enhancement of the methanotroph population determines the efficacy of CH4 emission reduction and raises rice yield. Rani et al. [30] demonstrated that the co-inoculation of aerobic CH4-oxidizing bacteria (Methylobacterium oryzae MNL7) and plant growth-promoting bacteria (Paenibacillus polymyxa MaAL70) reduced the total CH4 emissions from 6.92 to 12.03% and increased the rice yield from 11.08 to 14.04%. Another study also revealed that methanotroph inoculation on rice fields reduced CH4 emissions by 60% and increased the rice yield by 35% [26]. The augmentation of rice yields, known as several methanotrophs, can increase the soil N availability, enhancing photosynthate allocation to grains [26,31,32]. However, the studies above examined the potential of CH4 emission reductions by inoculating methanotrophs on rice fields under the difference of fertilizer application dosages or fertilizer types, while fields amended with external organic carbon or higher dissolved organic carbon remains uncertain with methanotroph inoculation.
Two strains of methanotrophs, including (i) Methylocinus sp. (access. No. PP218672) and (ii) Methylocystis sp. (access. No. PP218659), have recently been isolated in fields applied with SF and BDE of the VMD, respectively. These strains are affiliated with type II methanotrophs, which adapt to a fluctuating environment and high CH4 concentration, indicating the potential for reducing GHG emission based on methanotroph inoculation in rice fields of the VMD. Although the efficacy of methanotroph inoculation in reducing GHG emissions and promoting grain yield has been observed by several strains in previous studies [26,31,32], the CH4 oxidation potential of methanotrophic strains isolated in the VMD’s rice fields has not been examined. In addition, the utilization of BDE for rice fields has recently been popularized in the VMD, particularly in small-scale livestock farming. This increases growing concerns about promoting higher GHG emissions in the VMD, where rice production accounts for approximately 53.5% of the national productivity [33]. Thus, developing GHG emission reduction strategies based on indigenous methanotrophs is critical for rice in the VMD. This approach contributes to sustainable agriculture production and effectively addresses the challenges posed by increased CH4 emissions from BDE usage. With the expectation of unutilized nutrient-enriched BDE recirculation for rice practices where higher CH4 emissions were observed, we hypothesized that the inoculation of Methylosinus sp. and Methylocystis sp. strains reduce CH4 and GHG emissions from rice cultivation applied with wholly or partly BDE without the trade-off of grain productivity. In order to test the hypothesis, we investigated the impact of inoculating two strains of methanotrophs on CH4 and N2O emissions, rice growth, and yields. This was performed by substituting 50% and 100% of nitrogen fertilizers with the methanotroph-inoculated BDE under a pot experiment.

2. Materials and Methods

2.1. Study Site

The experiment was conducted in a screen house at Can Tho University, Vietnam (10°1′48.058″ N, 105°46′14.19″ E). The screenhouse was covered with a translucent roof and wrapped with an insect net on the sides. Inside the screen house, rat-proof weirs were installed around the experimental area. Experimentation was performed from April to July 2023. The means of temperature, precipitation, wind speed, atmospheric pressure, and solar radiation outside the experiment were 28.9 °C, 0.25 mm h−1, 0.7 m s−1, 100.9 kPa, and 192.9 W m−2, respectively (Figure S1).

2.2. Soil Preparation

The soil was collected at a rice paddy field with ~20 cm plough layer of a typically triple-rice cropping field of the VMD. At the time of collection, the soil was prepared for sowing in the spring-summer season. Previously, the field had been used to grow rice in the winter–spring season. As such, the soil was incorporated with rice straw biomass. The collected soil was then removed from straw biomass and mixed manually. Following this step, the soil was allocated into each plastic container (0.6 m × 0.4 m × 0.3 m) with 20 cm soil height. Thenceforward, the soil was flooded with ~8 cm of tap water for 10 days. The soil texture was 56.4% clay, 38.2% silt, and 5.4% sand. Soil characteristic before sowing was as follows: pH, 5.23; electrical conductivity (EC), 0.28 mS cm−1; total organic carbon (TOC), 41.35 g C kg−1; total nitrogen (TN), 2.48 g N kg−1; ammonium (NH4+), 18.87 mg N kg−1; nitrate (NO3), 0.764 mg N kg−1; available phosphorous (AP), 28.1 mg P kg−1; and cation exchange capacity (CEC), 15.84 meq 100 g−1.

2.3. Biogas Digestive Effluent

BDE was collected from a pig farm in Can Tho city, which had 10 pigs (two sows and eight fattening hogs). The farm installed a high-density polyethylene (HDPE) biogas digester with 9.8 m3. The digester’s hydraulic retention time (HRT) was estimated to be approximately eight days. The collected BDE was stored in a 1000 L tank for utilization during the experimentation. The BDE was heated using a thermistor for an hour to sterilize pathogens [20]. The mean of physiochemical characteristics of heated BDE was used for the experiment as follows: pH, 6.54; EC, 22.36 mS cm−1; total amonia nitrogen (TAN), 163 mg N L−1; NO3, 12.8 mg N L−1; NO2, 8.13 mg N L−1; PO43−, 78.3 mg P L−1; TOC, 325 mg C L−1; and TN 326 mg N L−1 (Table 1).

2.4. Methanotroph

Methanotrophs applied for the experiment were isolated in the VMD rice paddy soil. Two strains of methanotroph, including (i) Methylosinus sp. (access. No. PP 218672) and (ii) Methylocystis sp. (access. No. PP 218659), were used. These methanotrophs were classified as type II methanotrophs. The methanotrophs were enriched in Mineral Nitrate Salts with 0.5% (v/v) methanol for five days. The optical density (OD) value was approximately ~0.20 (~108 cells mL−1). It was then inoculated into the heated BDE at a 1:100 ratio (1 mL of enriched culture in 100 mL heated BDE). Thenceforth, methanotroph-inoculated BDE was preincubated in a 60 L tank covered with a lid for five days before irrigating for rice.

2.5. Rice Cultivar

The rice seed used for the experiment was IR50404, provided by Cuu Long Rice Research Institute (CLRRI), Can Tho City, Vietnam. The variety is dominantly used in intensive rice production systems of the VMD. Rice seeds were soaked in tap water for eight hours and then incubated for two days.

2.6. Experimental Design

The experiment examined the effects of 2 strains of methanotrophs on methane emission and greenhouse gas emission patterns under conventional rice cultivation. The experiment was accomplished with six treatments, comprising (i) 100% synthetic fertilizers (treatment SF), (ii) 100% biogas digestive effluent (treatment BDE), (iii) 50% Methylosinus sp.-inoculated BDE + 50% SF (treatment MS1), (iv) 50% Methylocystis sp.-inoculated BDE + 50%SF (MP1), (v) 100% Methylosinus sp.-inoculated BDE (MS2), and (vi) 100% Methylocystis sp.-inoculated BDE (MP2). The experiment was performed in a completely randomized design with three reproductions. A total of 18 containers were arranged on four flat-bed trollies covered with a 1 mm thick HDPE film. Five containers were lined up on each trolly with a 20 cm distance. The space of each trolly was arranged by 100 cm (Figure S2). Before sowing, supernatant water was eliminated, followed by mixing and levelling the soil surface homogeneously. Pre-germinated rice seeds were then sown at 10 g m−2 on saturated soil.
In the SF, the total amount of NPK fertilizers applied was 15 g N m−2, 4 g P2O5 m−2, and 6 g K2O m−2. The N–P2O5–K2O fertilization was supplied three times on days 10 (3.0-1.3-0 g m−2), 25 (7.0-1.3-3.0 g m−2), and 44 (5.0-1.3-3.0 g m−2) (Table 2). In the BDE, heated BDE was supplied to paddy soil to substitute SF at 100% in terms of N amount without the addition of exogenous fertilizers. For treatments inoculated with methanotrophs, heated BDE inoculated with Methylosinus sp. and Methylocystis sp., following a 5-day preincubation, was directly irrigated to rice to replace 50% or 100% of the amount of N applied to the SF treatment. The remaining portion of N fertilizer for MS1 or MP1 was employed with synthetic fertilizers. The SF and BDE were applied simultaneously. The initial irrigation was carried out ten days after sowing (DAS), following the multiple drainage method [20,34]. These methods enable AWD conditions that facilitate the reductive soil condition versus conventional continuous flooding.

2.7. Measurements

2.7.1. Weather Data

The temperature, precipitation, wind speed, atmospheric pressure, and solar radiation outside the experiment were recorded using the weather station (z6-18426, ATMOS 41, Meter Japan Co., Ltd., Tokyo, Japan) installed outside the screenhouse.

2.7.2. Physiochemical Characteristics of BDE, Soil and Soil water solution

The chemical properties of BDE were determined before application. pH and EC were measured using a portable meter (TOA-DKK cooperation, MM-41DP, Tokyo, Japan). NH4+, NO3, NO2, and PO43− was analyzed using flow injection analyzer (FIALYZER-100, FIA lab, Seattle, WA, USA). TOC and TN were detected simultaneously using a total nitrogen unit for TNML TOC-L Series with Autosampler ASI-L (TOC-L CPH, Shimadzu, Kyoto, Japan).
The Pipette Robinson method determined soil texture collected from the paddy field [35]. Soil samples were collected separately from each pot at 0, 25, 39, 60, 67, and 80 DAS using a 2 cm diameter auger with a 20 cm length. Soil solutions for the measurement of pH and EC were extracted at a 1:5 ratio (1 g of soil: 5 mL of distilled water) and detected using a portable pH/EC meter (TOA-DKK cooperation, MM-41DP, Tokyo, Japan). TOC was detected using Wet Oxidation (TOC and TN) [36]. NH4+ and NO3 were extracted using 2 mol L−1 KCl and measured using the Indophenol blue method and Vanadium (III) reduction method [37]. CEC was detected, according to Houba et al. [38]. Available P was detected using the Bray II method [39]. Soil redox potential (Eh) was measured daily using two platinum-tipped electrodes anchored into the soil at 5 and 15 cm and connected with a handheld Eh meter (TOA-DKK cooperation, PRN-41, Tokyo, Japan). Mean values recorded from two electrodes represented the soil Eh variation of each treatment. Water levels were recorded daily in PVC-perforated tubes preinstalled in each pot.
The soil water solution was also directly extracted from the soil at 39, 60, and 67 DAS using a 0.45 µm pore-sized filter vertically inserted into the soil. The filter was connected to a 50 mL syringe, followed by creating negative pressure to extract soil water. The solution was then analyzed TOC and TN using a total nitrogen unit for TNML TOC-L Series with Autosampler ASI-L (TOC-L CPH, Shimadzu, Kyoto Japan).

2.7.3. CH4 and N2O Analysis

Gas samples were collected using the closed chamber method following the National Agriculture Research Organization (NARO) guidelines [40]. A chamber base (0.65 cm × 52 cm) with a groove of 4.5 cm depth was preinstalled and sealed onto the ground surface of the trolly covering the container to collect gas samples. A transparent chamber (0.65 m × 0.52 m × 1.22 m) made from acrylic sheet with 4 mm thickness was deployed. The chamber was equipped with an air-sampling port, an air-mixing fan, and an electronic thermometer. Before sampling, the chamber was placed on the base and sealed with water. A 50 mL syringe was connected to the gas-sampling port through a three-way lock. The fan was linked to a power bank to homogenize air inside the chamber. A thermometer was also inserted to record the temperature change over time. Gas samples were collected 1, 11, and 21 min after chamber closure. At each collecting time, the air was mixed three times and then injected into pre-vacuumed 10 mL vials. Air samples were taken weekly from day 3 until the harvest (12 times). Collecting time ranged between 8:00 and 10:00 AM. The concentration of CH4 and N2O was analyzed using a gas chromatograph (Shimadzu GC-2014, Kyoto, Japan) equipped with a flame ionization detector (FID) and an electron capture detector (ECD) for analyzing CH4 and N2O, respectively (Table S1). Gas fluxes and area-scaled GHG emissions were calculated according to Minamikawa et al. [40]. GWP was multiplied by the conversion coefficient (34 for CH4 and 298 for N2O) for a 100-year time horizon, including climate–carbon feedback, as reported by the Intergovernmental Panel on Climate Change (IPCC) [2]. The yield-scaled GWP (yGWP) was calculated by dividing the GWP by grain yield.

2.7.4. Plant Height, SPAD, Yield Components

Plant height and Soil and Plant Analysis Development (SPAD) (SPAD-502, Konica Minolta, Tokyo, Japan) were measured weekly for 10 plants per replication. These plants were randomly selected for measurement. The number of panicles was detected by counting the whole panicle for each pot. Above-ground biomass (AG biomass) was harvested from all the rice plants in each pot and dried at 105 °C for 72 h. Rice yield was separated from biomass and adjusted to 14% moisture content. The weight of 1000 grains was detected. The harvest index was calculated by dividing yield by AG biomass.

2.7.5. RNA Extraction and qPCR of pmoA Transcript Copy Number

Soil samples for RNA extraction were taken at 39, 60, and 67 DAS and stored at −80 °C. Soil RNA was extracted from 54 samples with 2.0 g of fresh soil for the Rneasy PowerSoil Total RNA kit (QIAGEN) following the manufacturer’s protocols. TURBO DNA-freeTM kit (Thermo Fisher Scientific, Waltham, MA, USA) was then used to eliminate DNA contamination, DNase and divalent cations from the RNA preparations. RNA concentration was measured using Qubit methods. PrimeScriptTM Reverse Transcriptase (Takara Bio, Kusatsu, Japan) was then utilized to synthesize cDNA from DNA-free soil RNA according to the producer’s protocols as well as Sakoda et al. [41]. Quantitative PCR was conducted using Thermal cycler Dice Realtime System II systems (Takara BIO, Kusatsu, Japan). The qPCR conditions were as follows: initial denaturation at 95 °C for 30 s followed by 2-step PCR with 40 cycles of denaturation at 95 °C for 5 s and annealing at 60 °C for 10 s. Melting curve data were carried out at 95 °C for 15 s, 60 °C for 30 s, and 95 °C for 15 s. The total mixture volume was prepared in 25 µL mixture as follows: TB Green® Fast qPCR Mix, 12.5 µL; primers (10 µM), 0.5 µL A189f and 0.5 µL mb661r; and cDNA template and sterilized MiliQ water, (11.5 µL). The volume of the cDNA template was used less than 10% of the mixture as recommended by the manufacturer. A serial standard curve was constructed based on the DNA mixture of Methylosinus sp. and Methylocystis sp. Soil samples used for extracting RNA were dried to compute the copy number by dry soil [41].

2.8. Data Processing

Two-way ANOVA was used to evaluate the difference in soil physiochemical properties, soil water solution, and relative abundance of methanotrophs under examination conditions of SF, BDE, and the combination of methanotroph-inoculated BDE. The main factors included treatments and rice-growing stages. One-way ANOVA was also used to examine the significant variances of treatments for panicle, plant height, yield, AG biomass, 1000 grains, and harvest index. Tukey multiple comparisons of means were performed to test the difference at a 95% family-wise confidence level. Principle component analysis (PCA) was used to identify key environmental factors and treatments relative to GHG emissions, GWP, and yGWP. Pearson correlation was also used to test the relationship between environmental variables, genus levels of pmoA transcript copy number, and CH4 and N2O emissions. All analyses were performed using R version 4.3.2 (R Core Team (2023)–R Foundation for Statistical Computing, Vienna, Austria).

3. Results

3.1. Physiochemical Characteristics of Soil and Soil Water Solution

The soil properties marginally varied among treatments, resulting in non-significant discrepancies in pH, NH4+, NO3, TOC, AP, and CEC (Table 3). However, contrarily to the treatment of SF, a higher EC was observed in the BDE or MS2 treatment. Irrespective of methanotroph-inoculated BDE treatments, NH4+, TOC, and CEC were more likely higher than the treatment SF. It was observed that the dynamic of pH, EC, NH4+, NO3, and AP significantly differed in response to the rice-growing periods. However, the interaction between treatments and rice-growing stages on soil properties was insignificant.
The variation in the DN of soil water solution (DNsw) was negligible between treatments and rice-growing stages (Table 4). On the other hand, the variation in the DOC of soil water solution (DOCsw) was significantly different among treatments or rice-growing stages. The DOCsw in the BDE, MS2, or MP2 treatment was significantly higher than those in the SF treatment. The interaction between treatments and rice-growing stages on DNsw and DOCsw was insignificant.

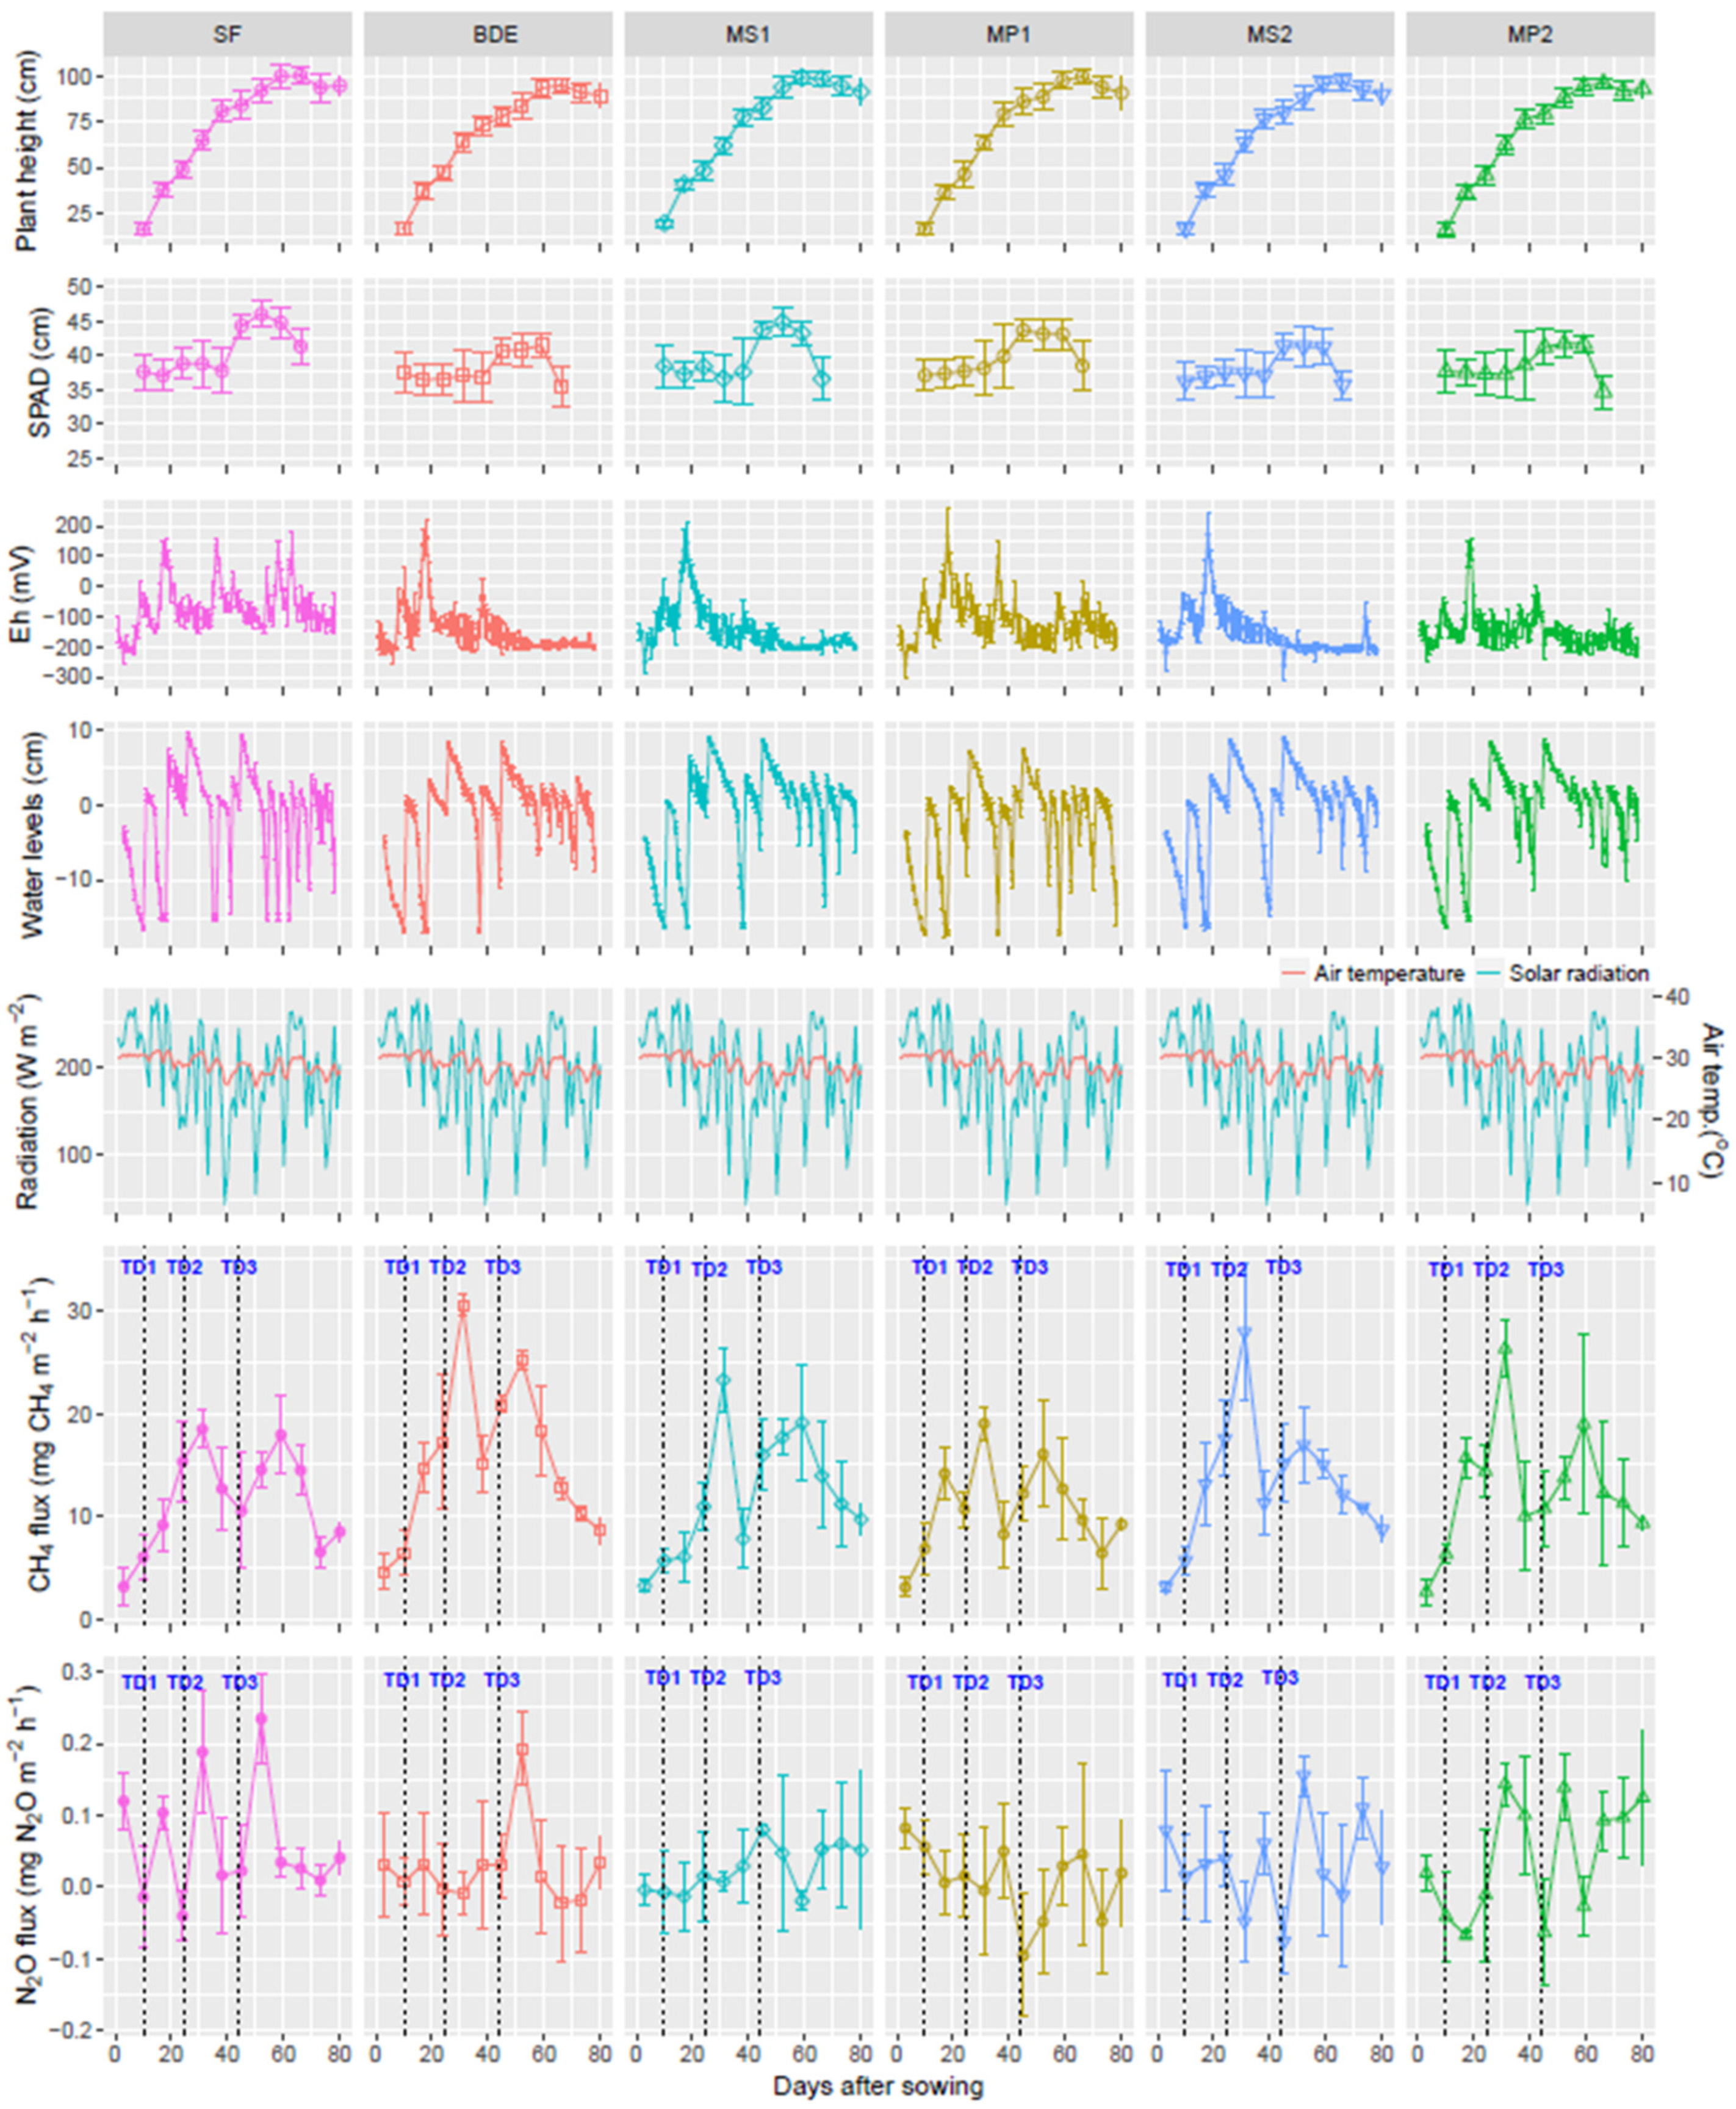
3.2. Eh, Water Levels, CH4, and N2O Emissions

The Eh values fluctuated highly in response to water level variations (Figure 1). The soil Eh maintained conditions for reduction rather than oxidation despite lowering the water levels below 0 cm. In addition, the treatment of BDE with and without methanotrophs retained a lower Eh condition than the SF treatments. The surface water level was maintained within the range of −15 to 8 cm under multiple drainages. Although there was a water level variation between treatments owing to a wide range of inconsistent evaporation, those patterns were primarily uniform. The number of irrigations varied between 10 and 12 times.
The CH4 flux gradually increased after sowing and exhibited a sizable temporal variability (Figure 1). Notably, after irrigating with BDE, CH4 emission surged and peaked on 31 DAS for all treatments. The magnitude of these peaks was determined in the BDE, MS2, and MP2 treatments. Interestingly, the MS1 and MP1 treatments showed a CH4 emission pattern comparable to SF treatments, while the BDE, MS2, and MP2 treatments were markedly similar pattern.
The total CH4 emission level was significantly different among treatments (Table 5). The highest CH4 flux was identified with the BDE treatment, which was substantially different from the SF, MS1, and MP1 treatments. The total CH4 emissions in the treatment BDE were 34% higher than the SF (Figure 2a; Table 5). In contrast, the MS1 and MP1 treatments, despite showing comparable emissions to the SF, had total CH4 emissions that were 28% to 44% lower than the BDE treatment. The high variation in CH4 flux caused an insignificant difference among the BDE, MS2, and MP2 treatments, but the total CH4 emission reduction in the MS2 and MP2 treatments was in the range of 17 to 21% compared to the BDE treatment. CH4 emission levels between MS and MP showed a marginal divergence (7.9%) (Table 5; Figure 2b). Applying BDE with methanotrophs substantially reduced CH4 emissions by 12% (Table 5; Figure 2c).
The N2O flux pattern was generally small irrespective of treatments, with an average of less than 0.1 mg N2O m−2 h−1 (Figure 1). The temporal variation was more noticeable than spatial fluctuation due to performing fertilization or drainages. The maximum peak of 0.23 mg N2O m−2 h−1 was observed in the SF treatment after the second topdressing. The application of methanotroph-inoculated BDE generally resulted in lower peaks compared to the SF treatment. Notably, combining methanotroph-inoculated BDE and SF (MS1 and MP1) in a ratio of 50:50 reduced N2O emissions compared to the application of 100% methanotroph-inoculated BDE.
The total N2O flux was significantly higher in the SF treatment than in MP1, while the difference was insignificant in BDE, MS1, MP1, MS2, and MP2 treatments (Table 5). The difference in N2O emission between MS and MP was negligible. The percentage of N-N2O flux/N-TN was between 0.04 and 0.48% (Figure 3). The SF treatment promoted a higher N-N2O flux/N-TN ratio than the MS1, MS2, MP1, and MP2 treatments. The fraction of differences between those treatments was insignificant between MS and MP.
GWP and yGWP showed a similar pattern to total CH4 emissions (Table 5). BDE treatment increased the GWP by 30.5% compared to the SF treatment. The GWP of the treatment was higher than that of MS1 and MP1 by 27.1 and 45.1%, respectively. Although there was an insignificant difference in the GWP amongst BDE, MS2, and MP2 treatments, a lower GWP trend was revealed in MS2 and MP2 treatments compared to BDE. The yGWP was insignificant between SF, MS1, and MP1 treatments, while it was significantly lower than that of BDE, MS2, and MP2 at 25.0–33.1%. Similarly, a lower yGWP trend (14.2–15.0%) was observed in the MS2 and MP2 treatments versus BDE.

3.3. Rice Growth, SPAD, and Yield Components

Plant height and SPAD followed a similar pattern irrespective of treatments (Figure 1). The difference in plant height and SPAD of treatments were marginal at the same rice-growing period. A higher SPAD was observed under the SF, MS1, and MP1 treatments during the period of 45–60 DAS. The maximum plant height was recorded on 66 DAS for all treatments. The number of panicles, panicle length, yield, weight of 1000 grains, and harvest index were not significantly different among treatments (Table 6). The MP1 treatment showed the highest biomass, which was significantly higher than that of BDE, MS2, and MP2 treatment.

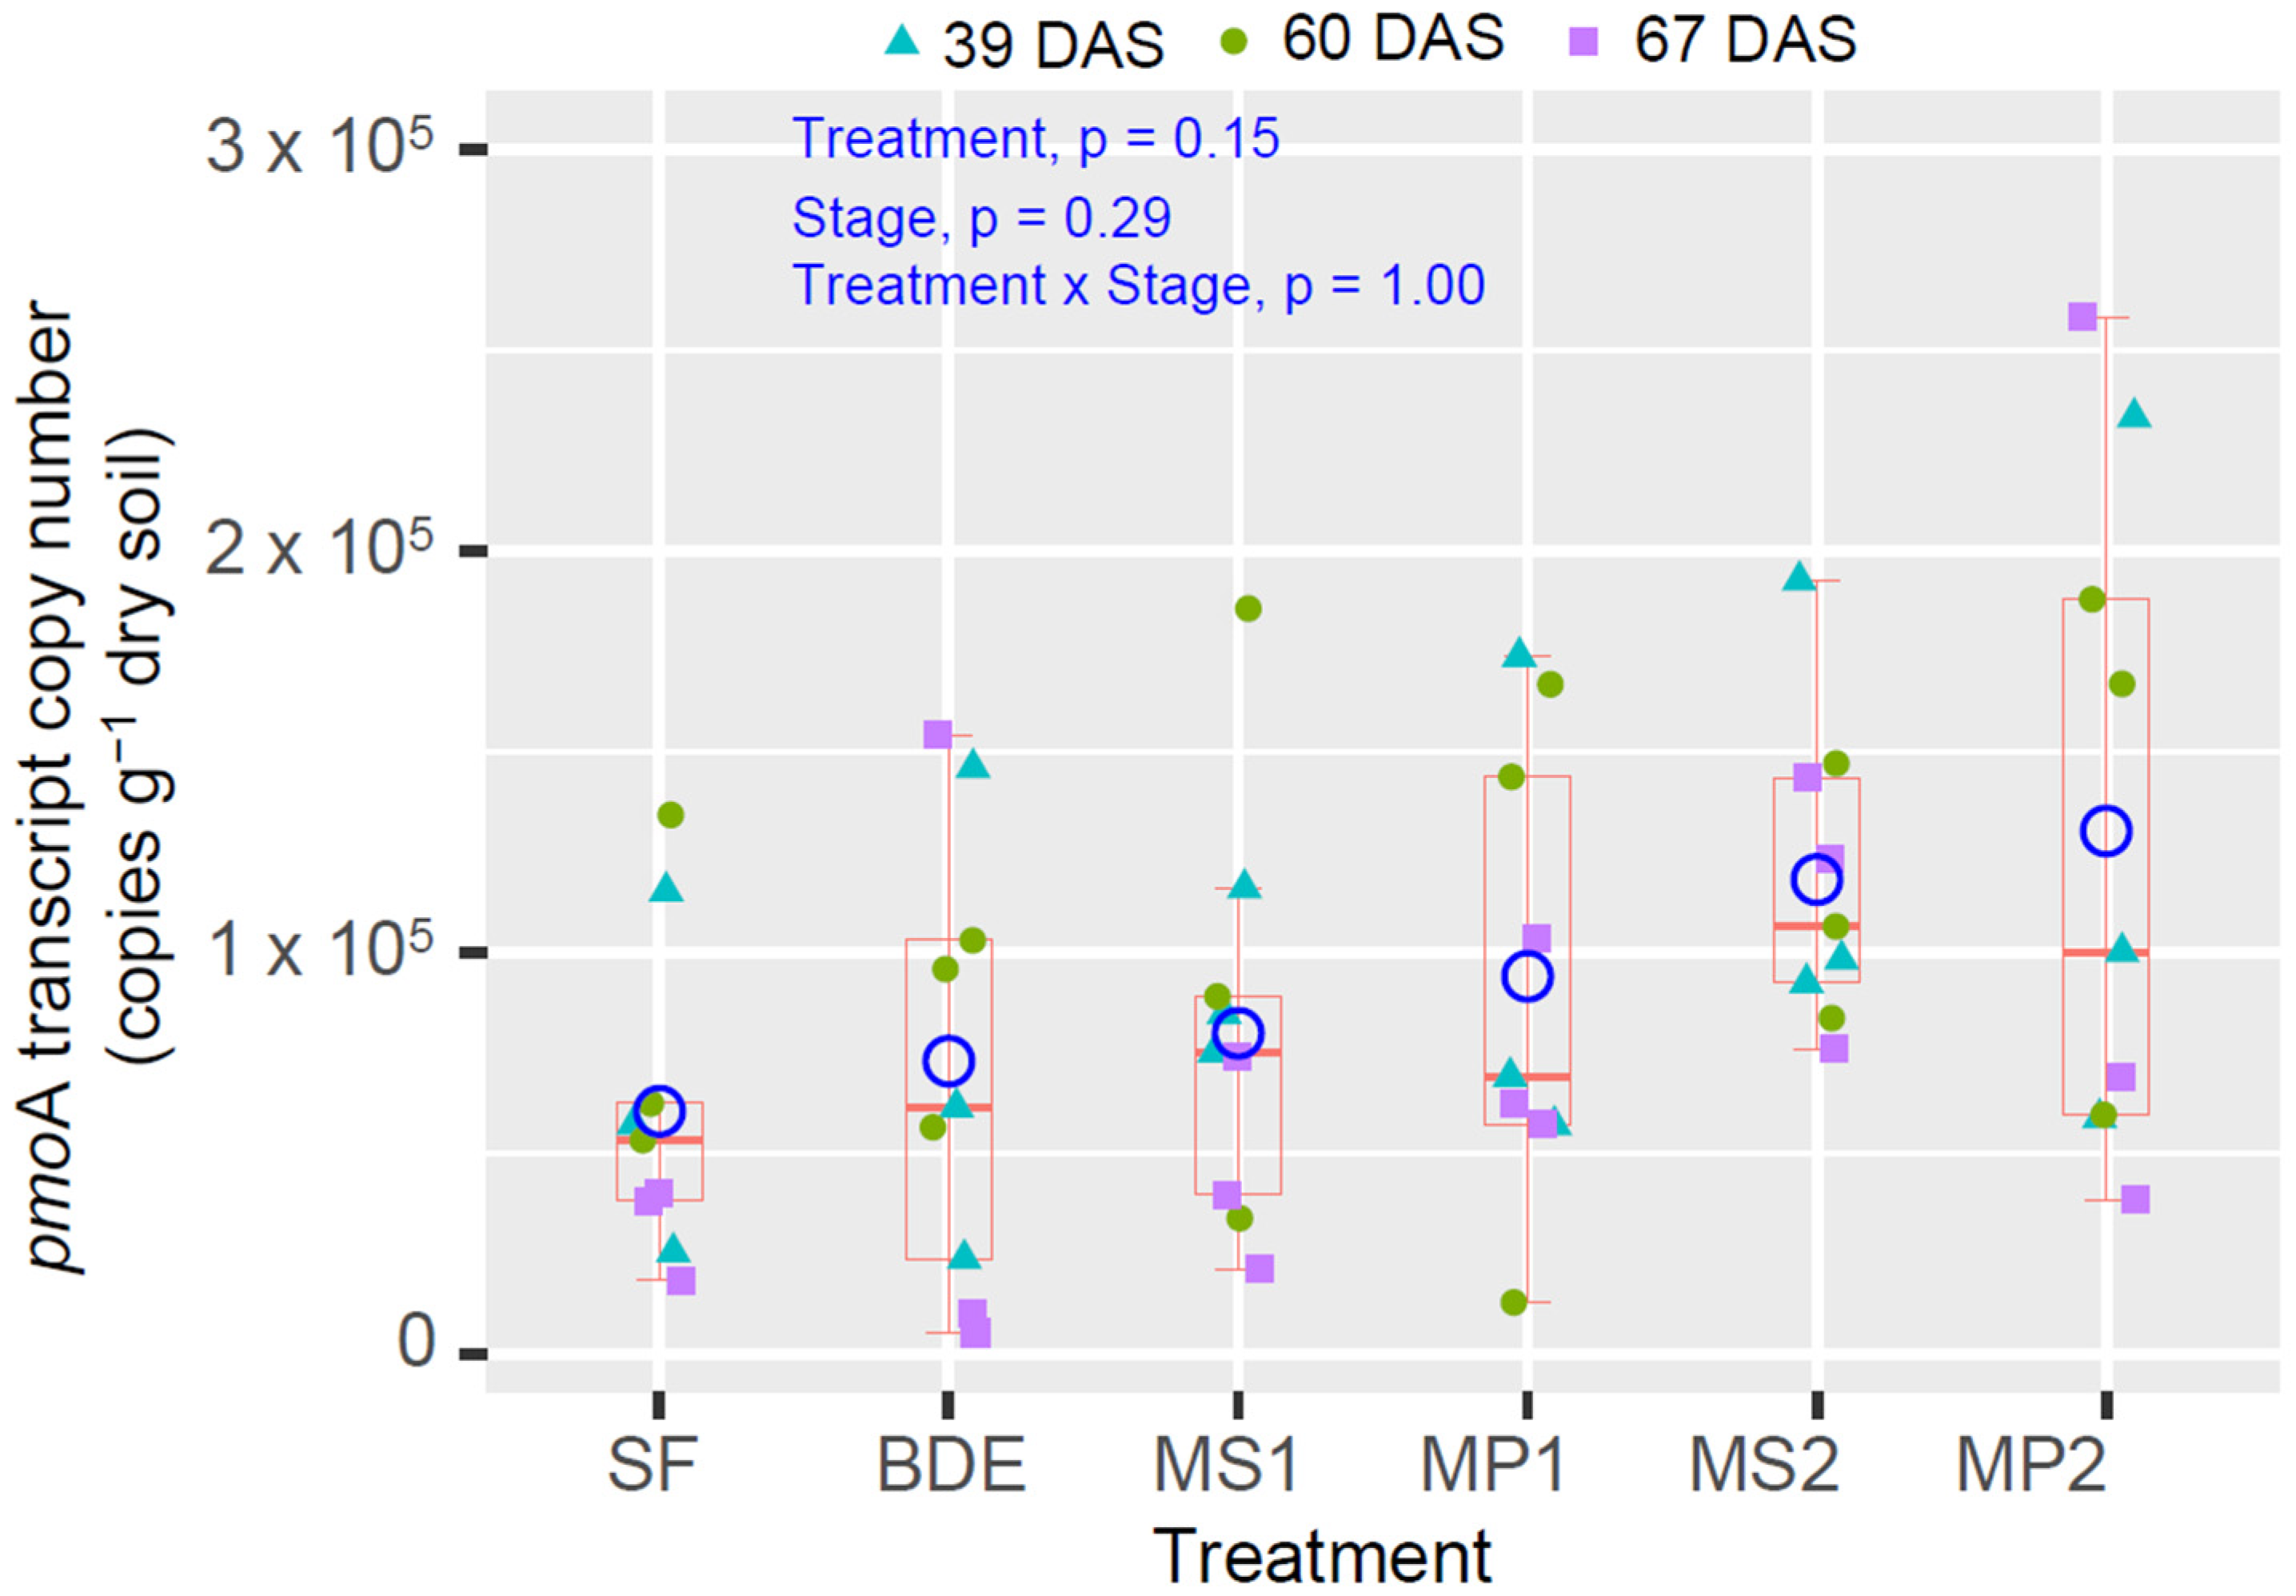
3.4. pmoA Transcript Copy Number

The mean transcript copy number of pmoA varied from 6.04 × 10⁴ to 1.30 × 10⁵ copies g−1 (dry soil) (Figure 4). Applying BDE without methanotroph inoculation slightly increased pmoA compared to SF treatments. The application of methanotroph-inoculated BDE tended to increase the transcript copy number of pmoA compared to SF and BDE treatments. Moreover, increasing the dosages of methanotroph-inoculated BDE was more likely to boost the transcript copy number of pmoA. This study found that the transcript copy number of pmoA largely fluctuated between treatments and rice-growing stages, resulting in insignificant differences among treatments and rice-growing stages, as well as the interaction between treatments and stages (p > 0.05).

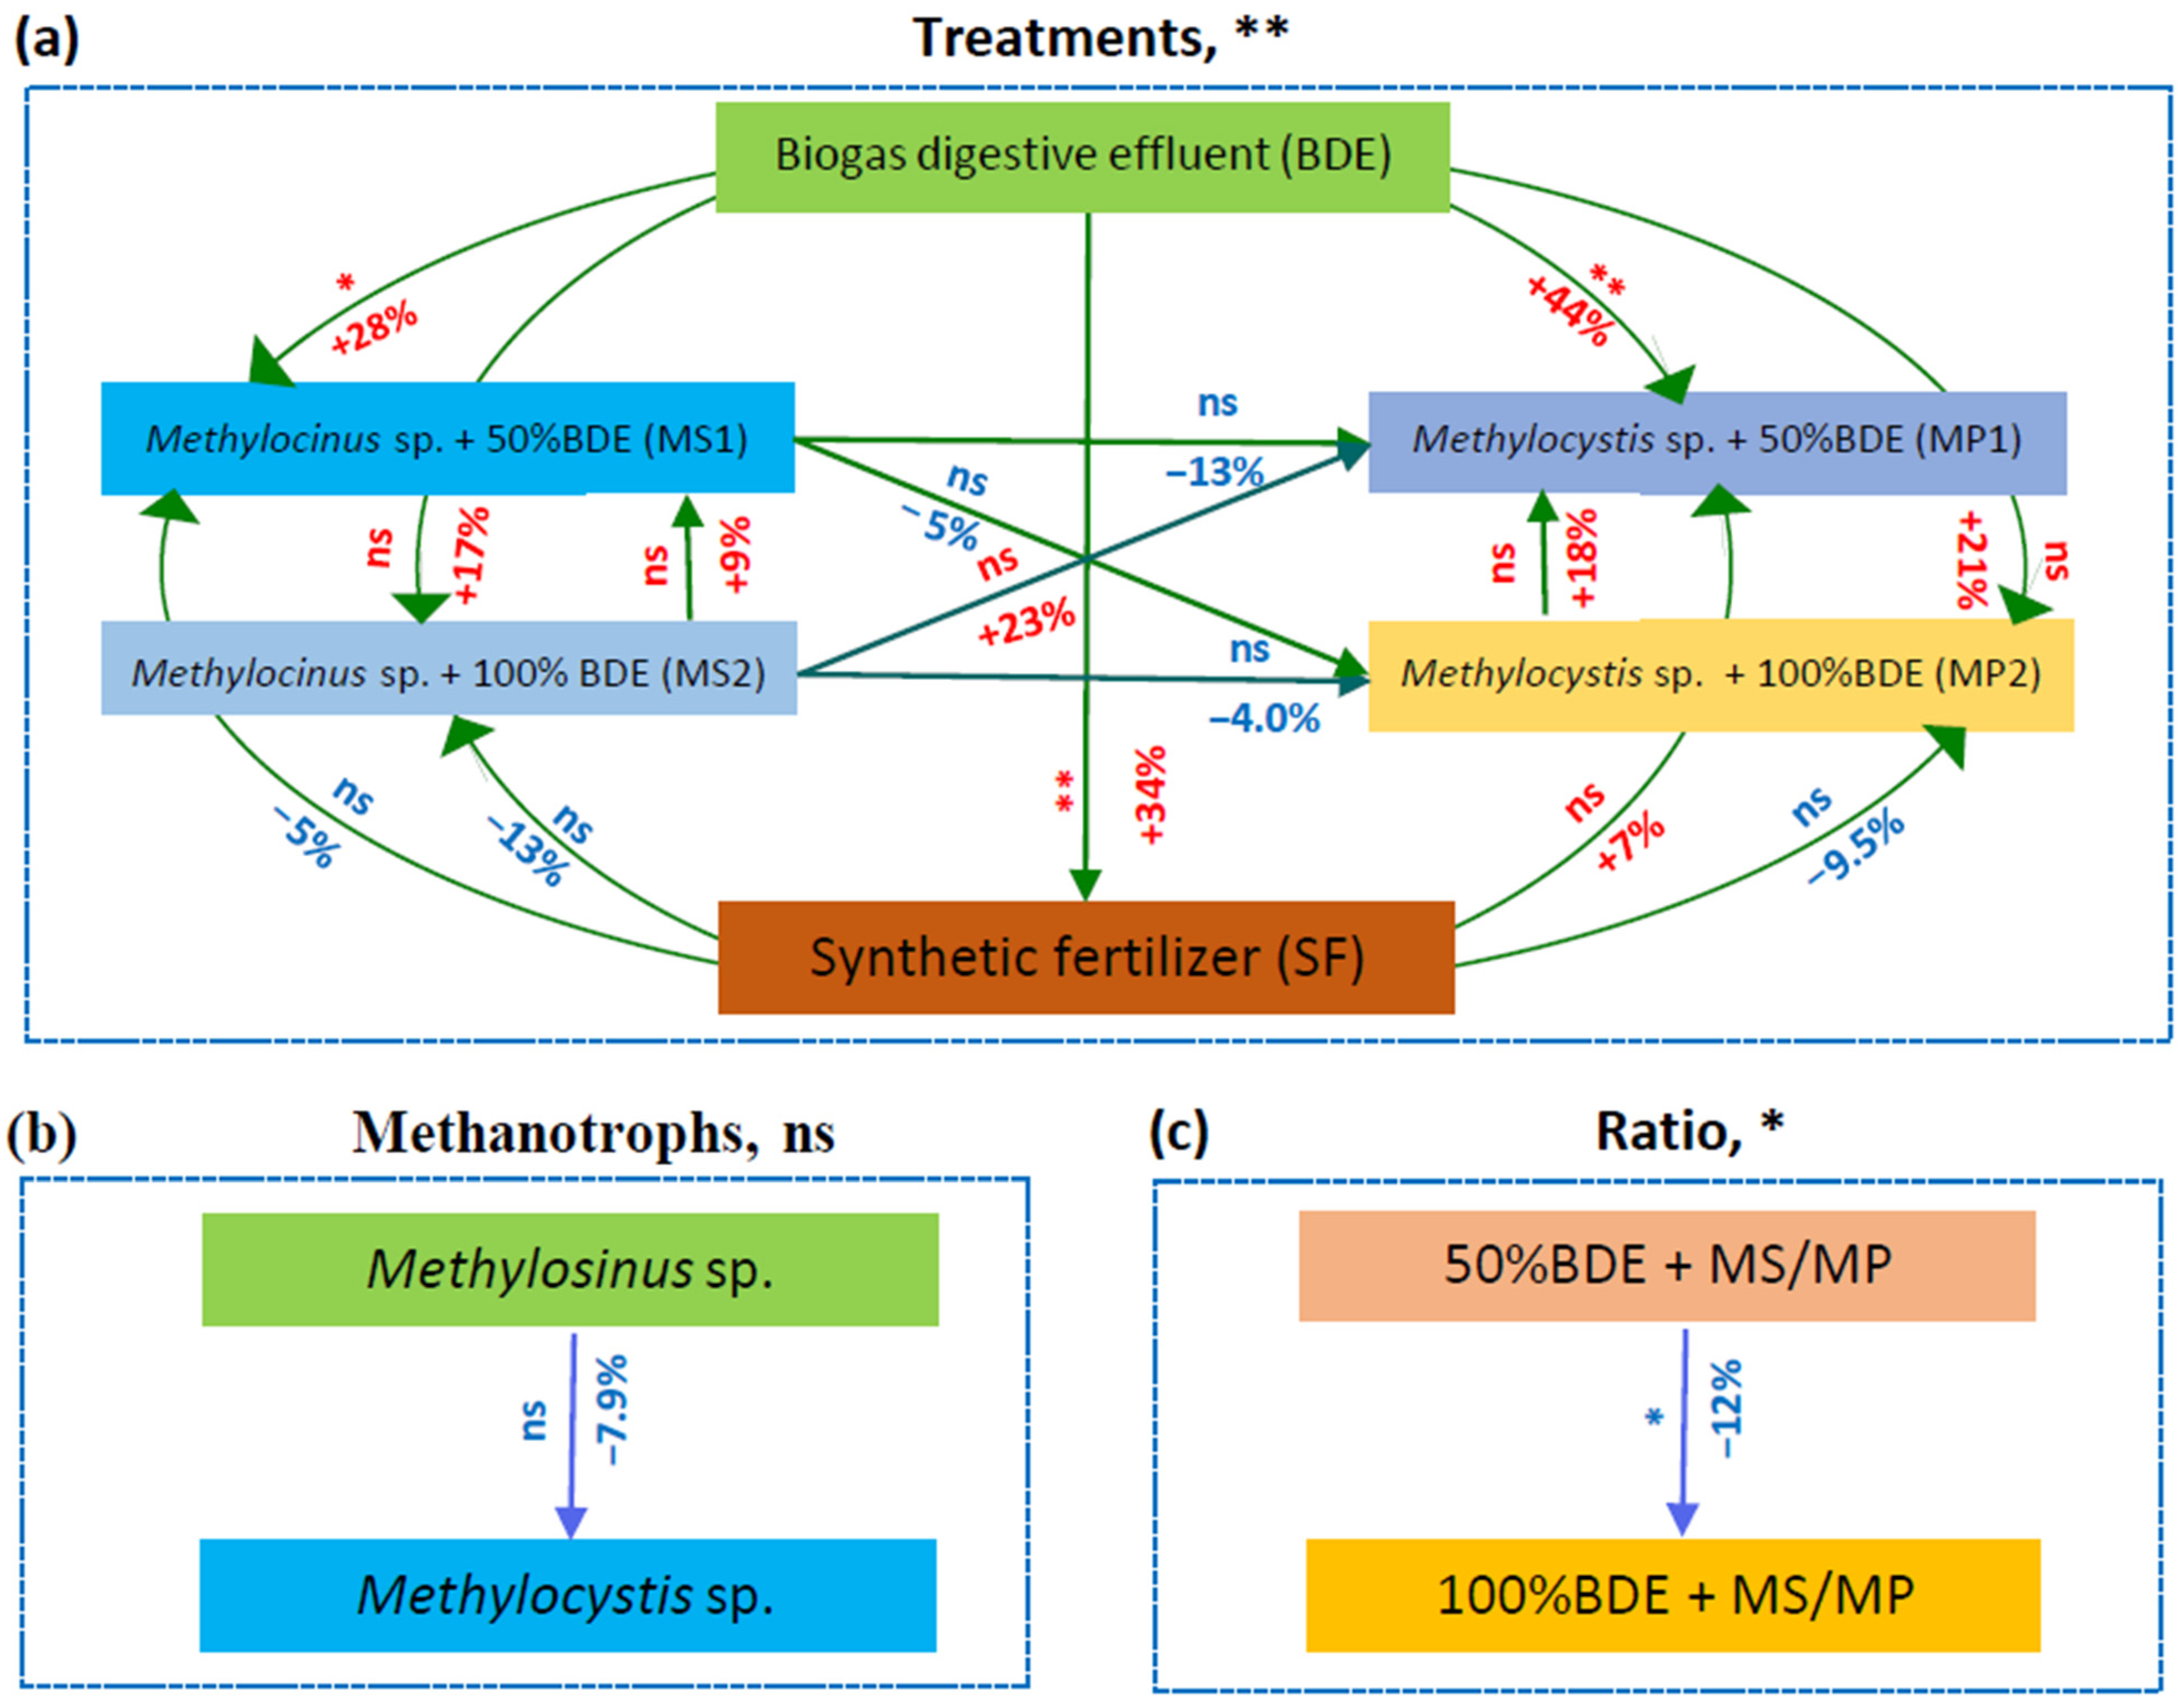
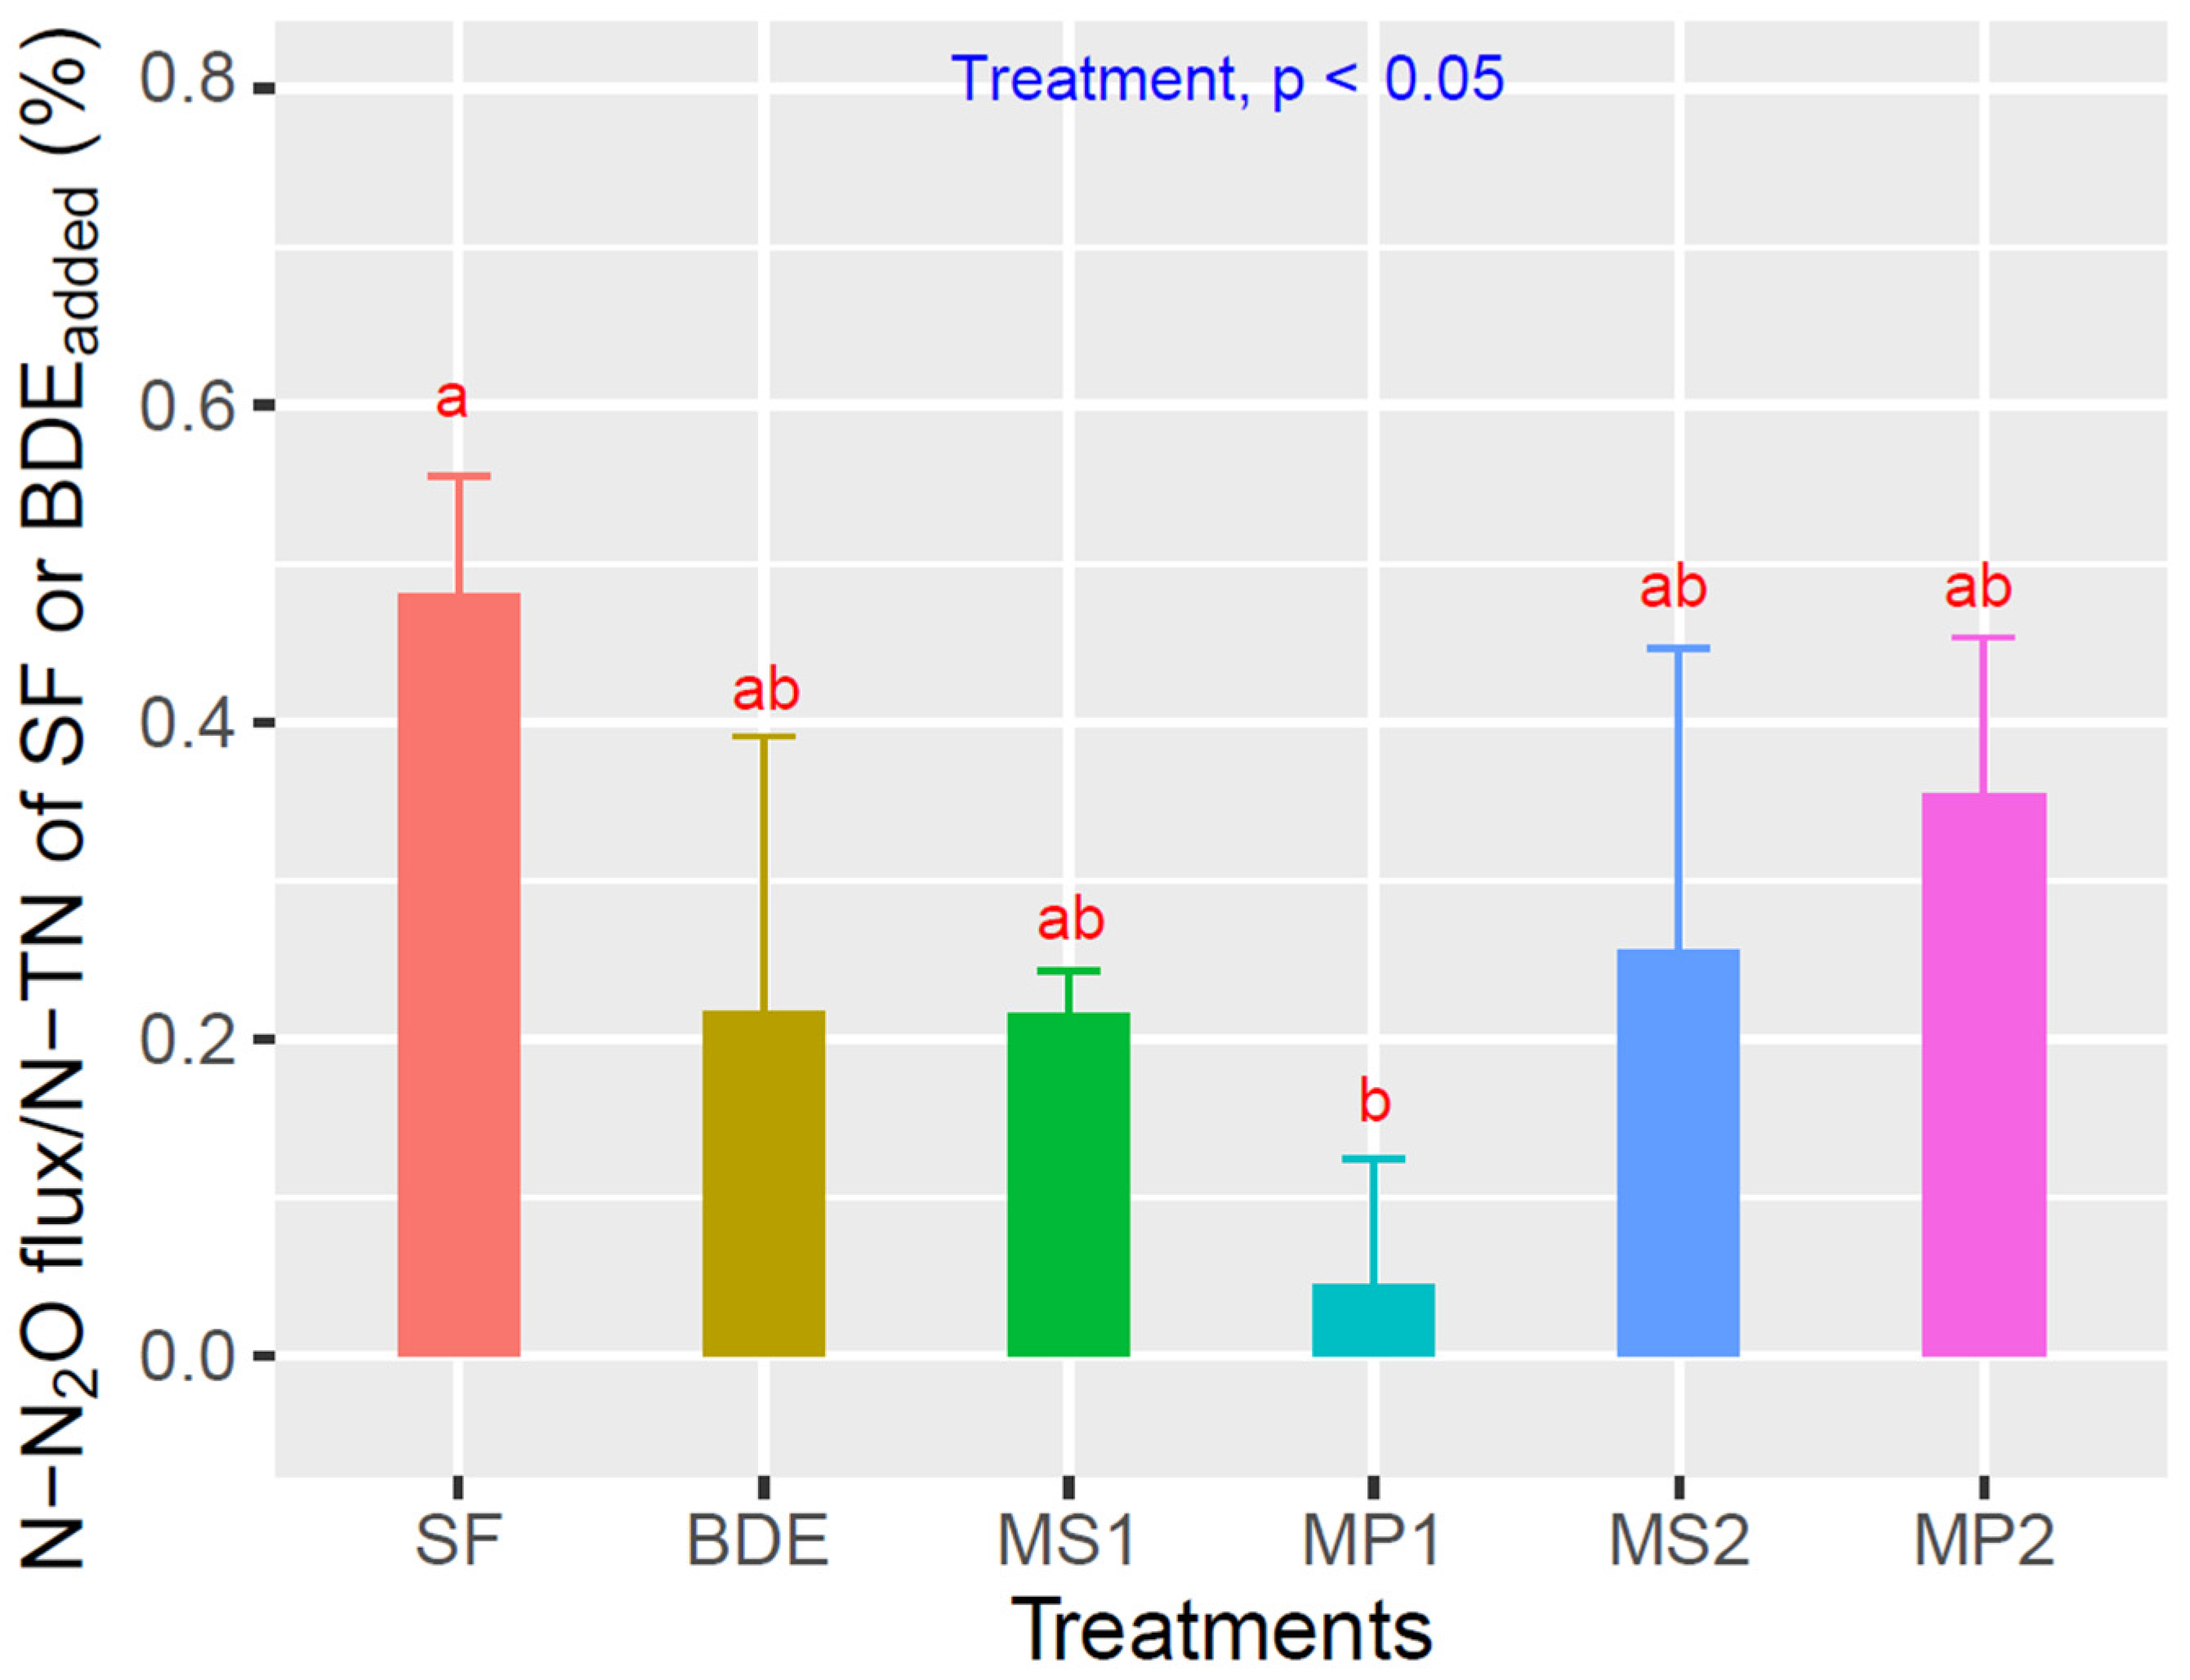
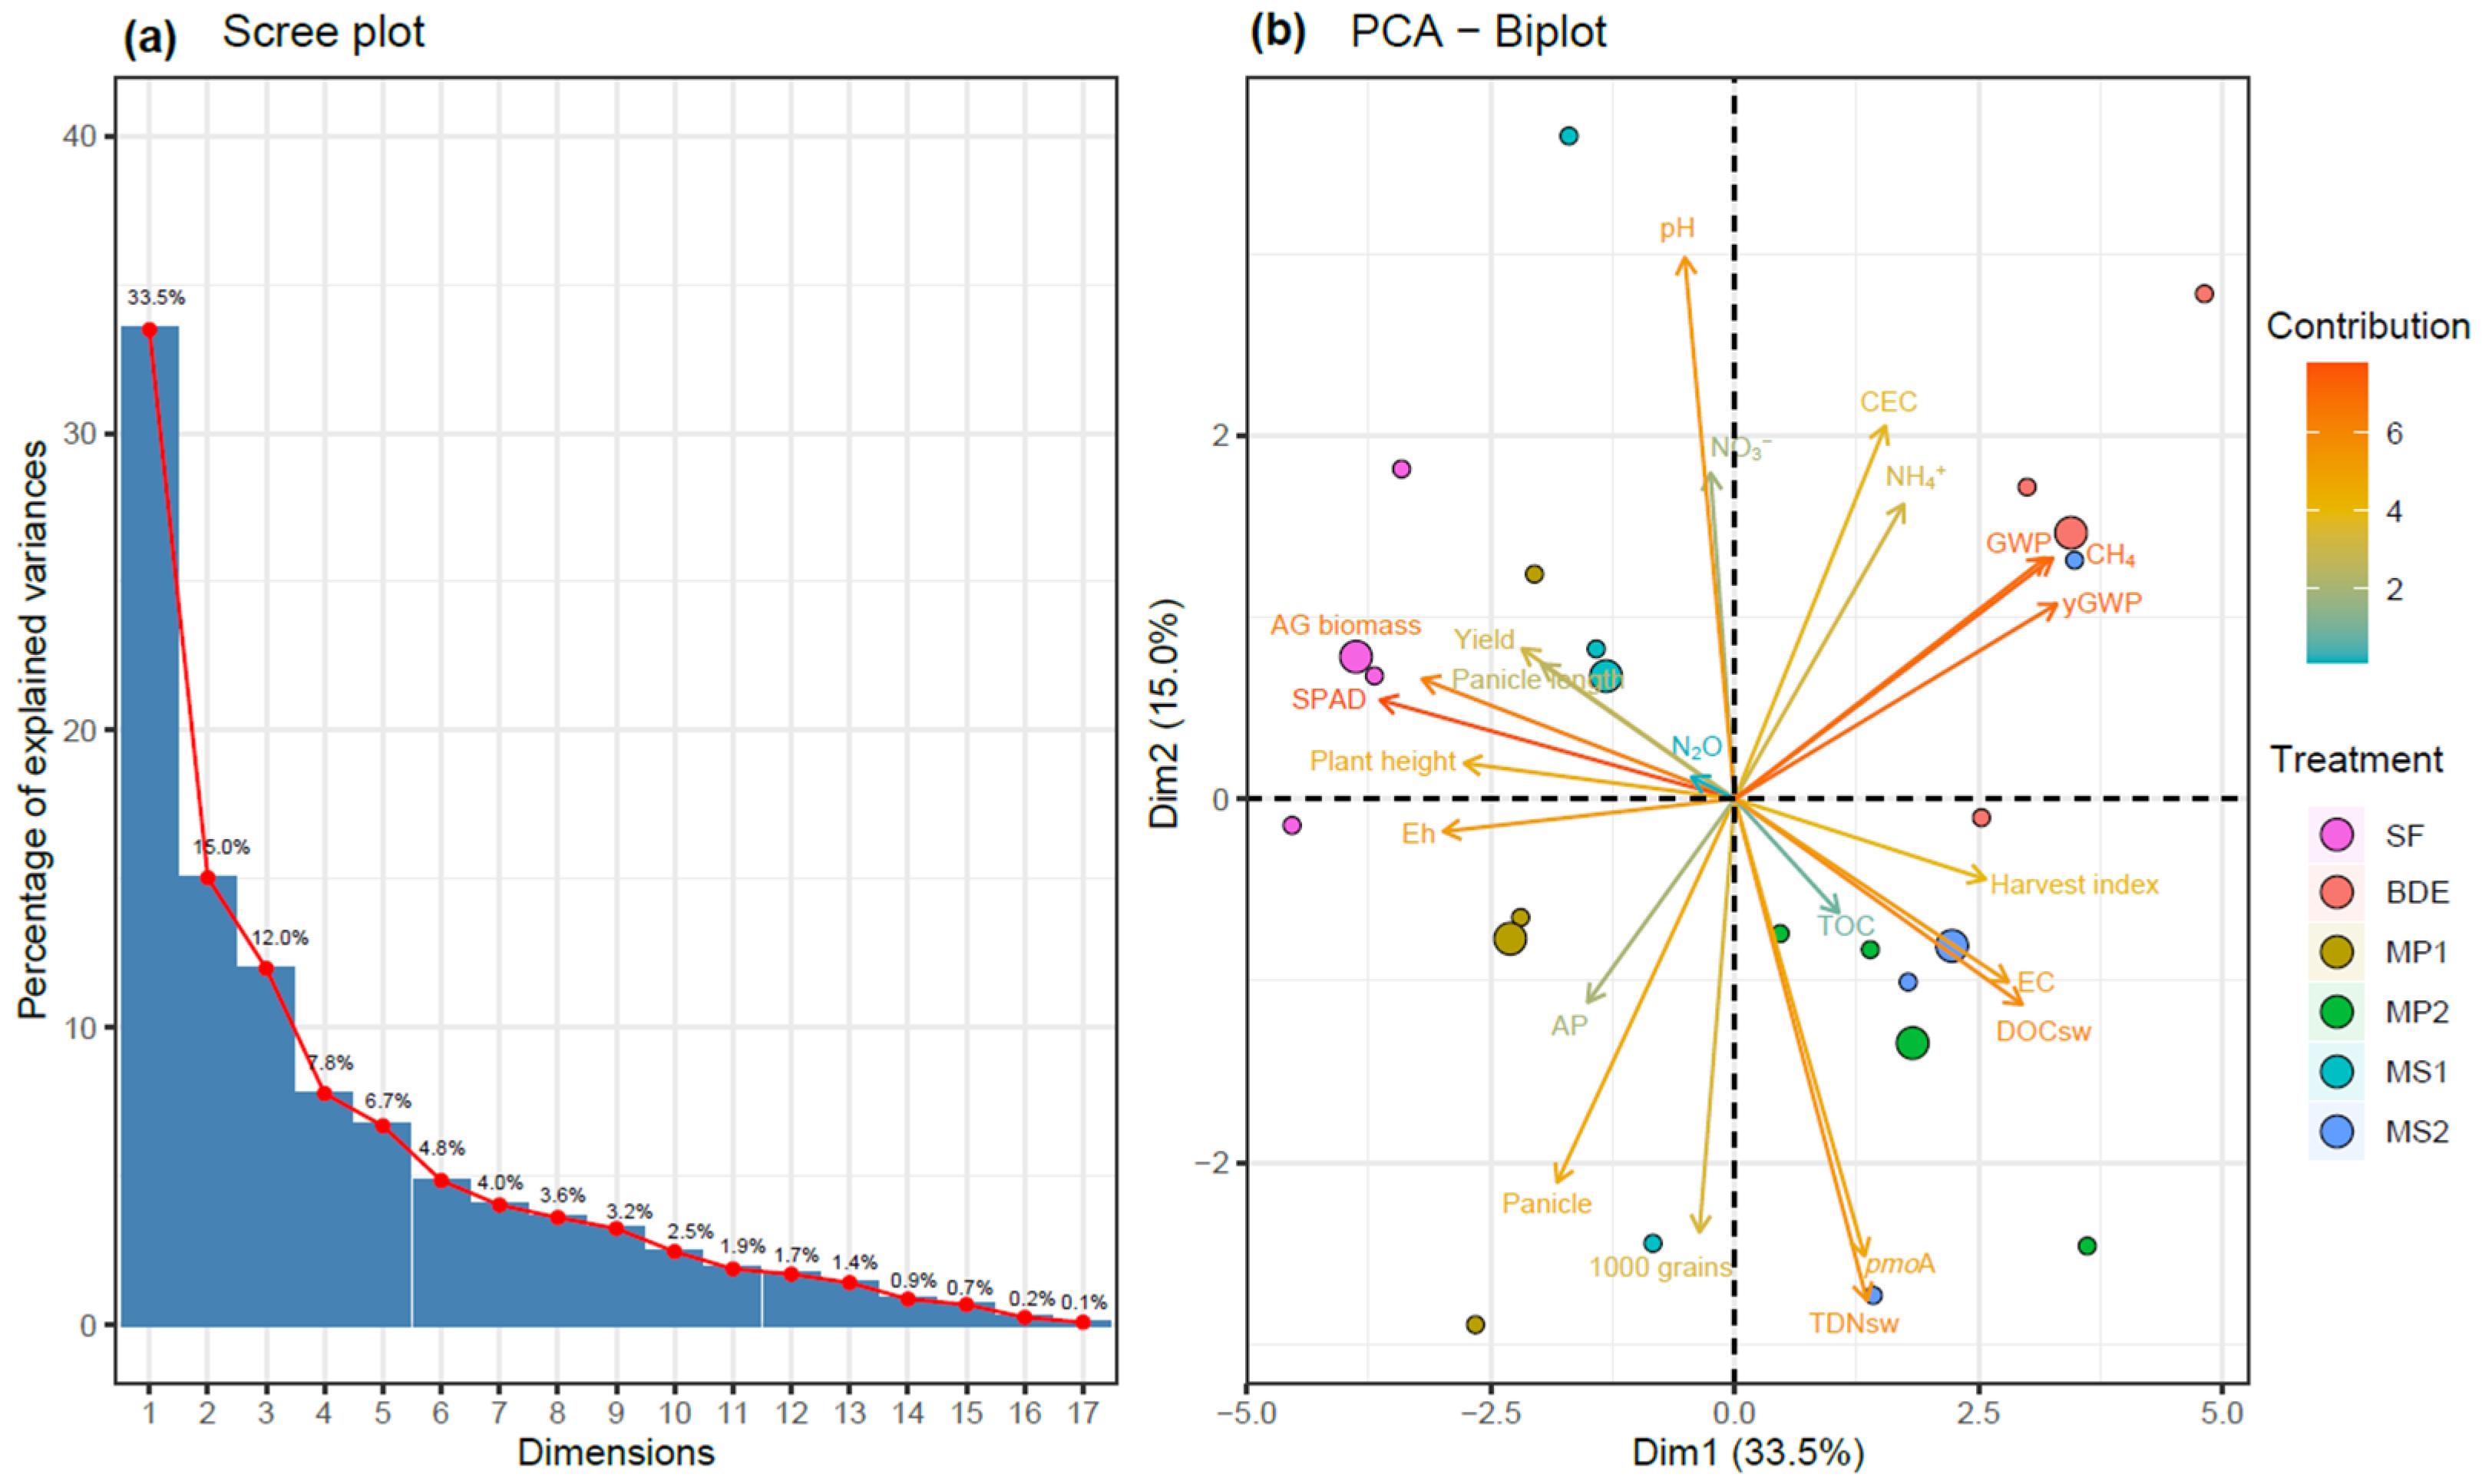
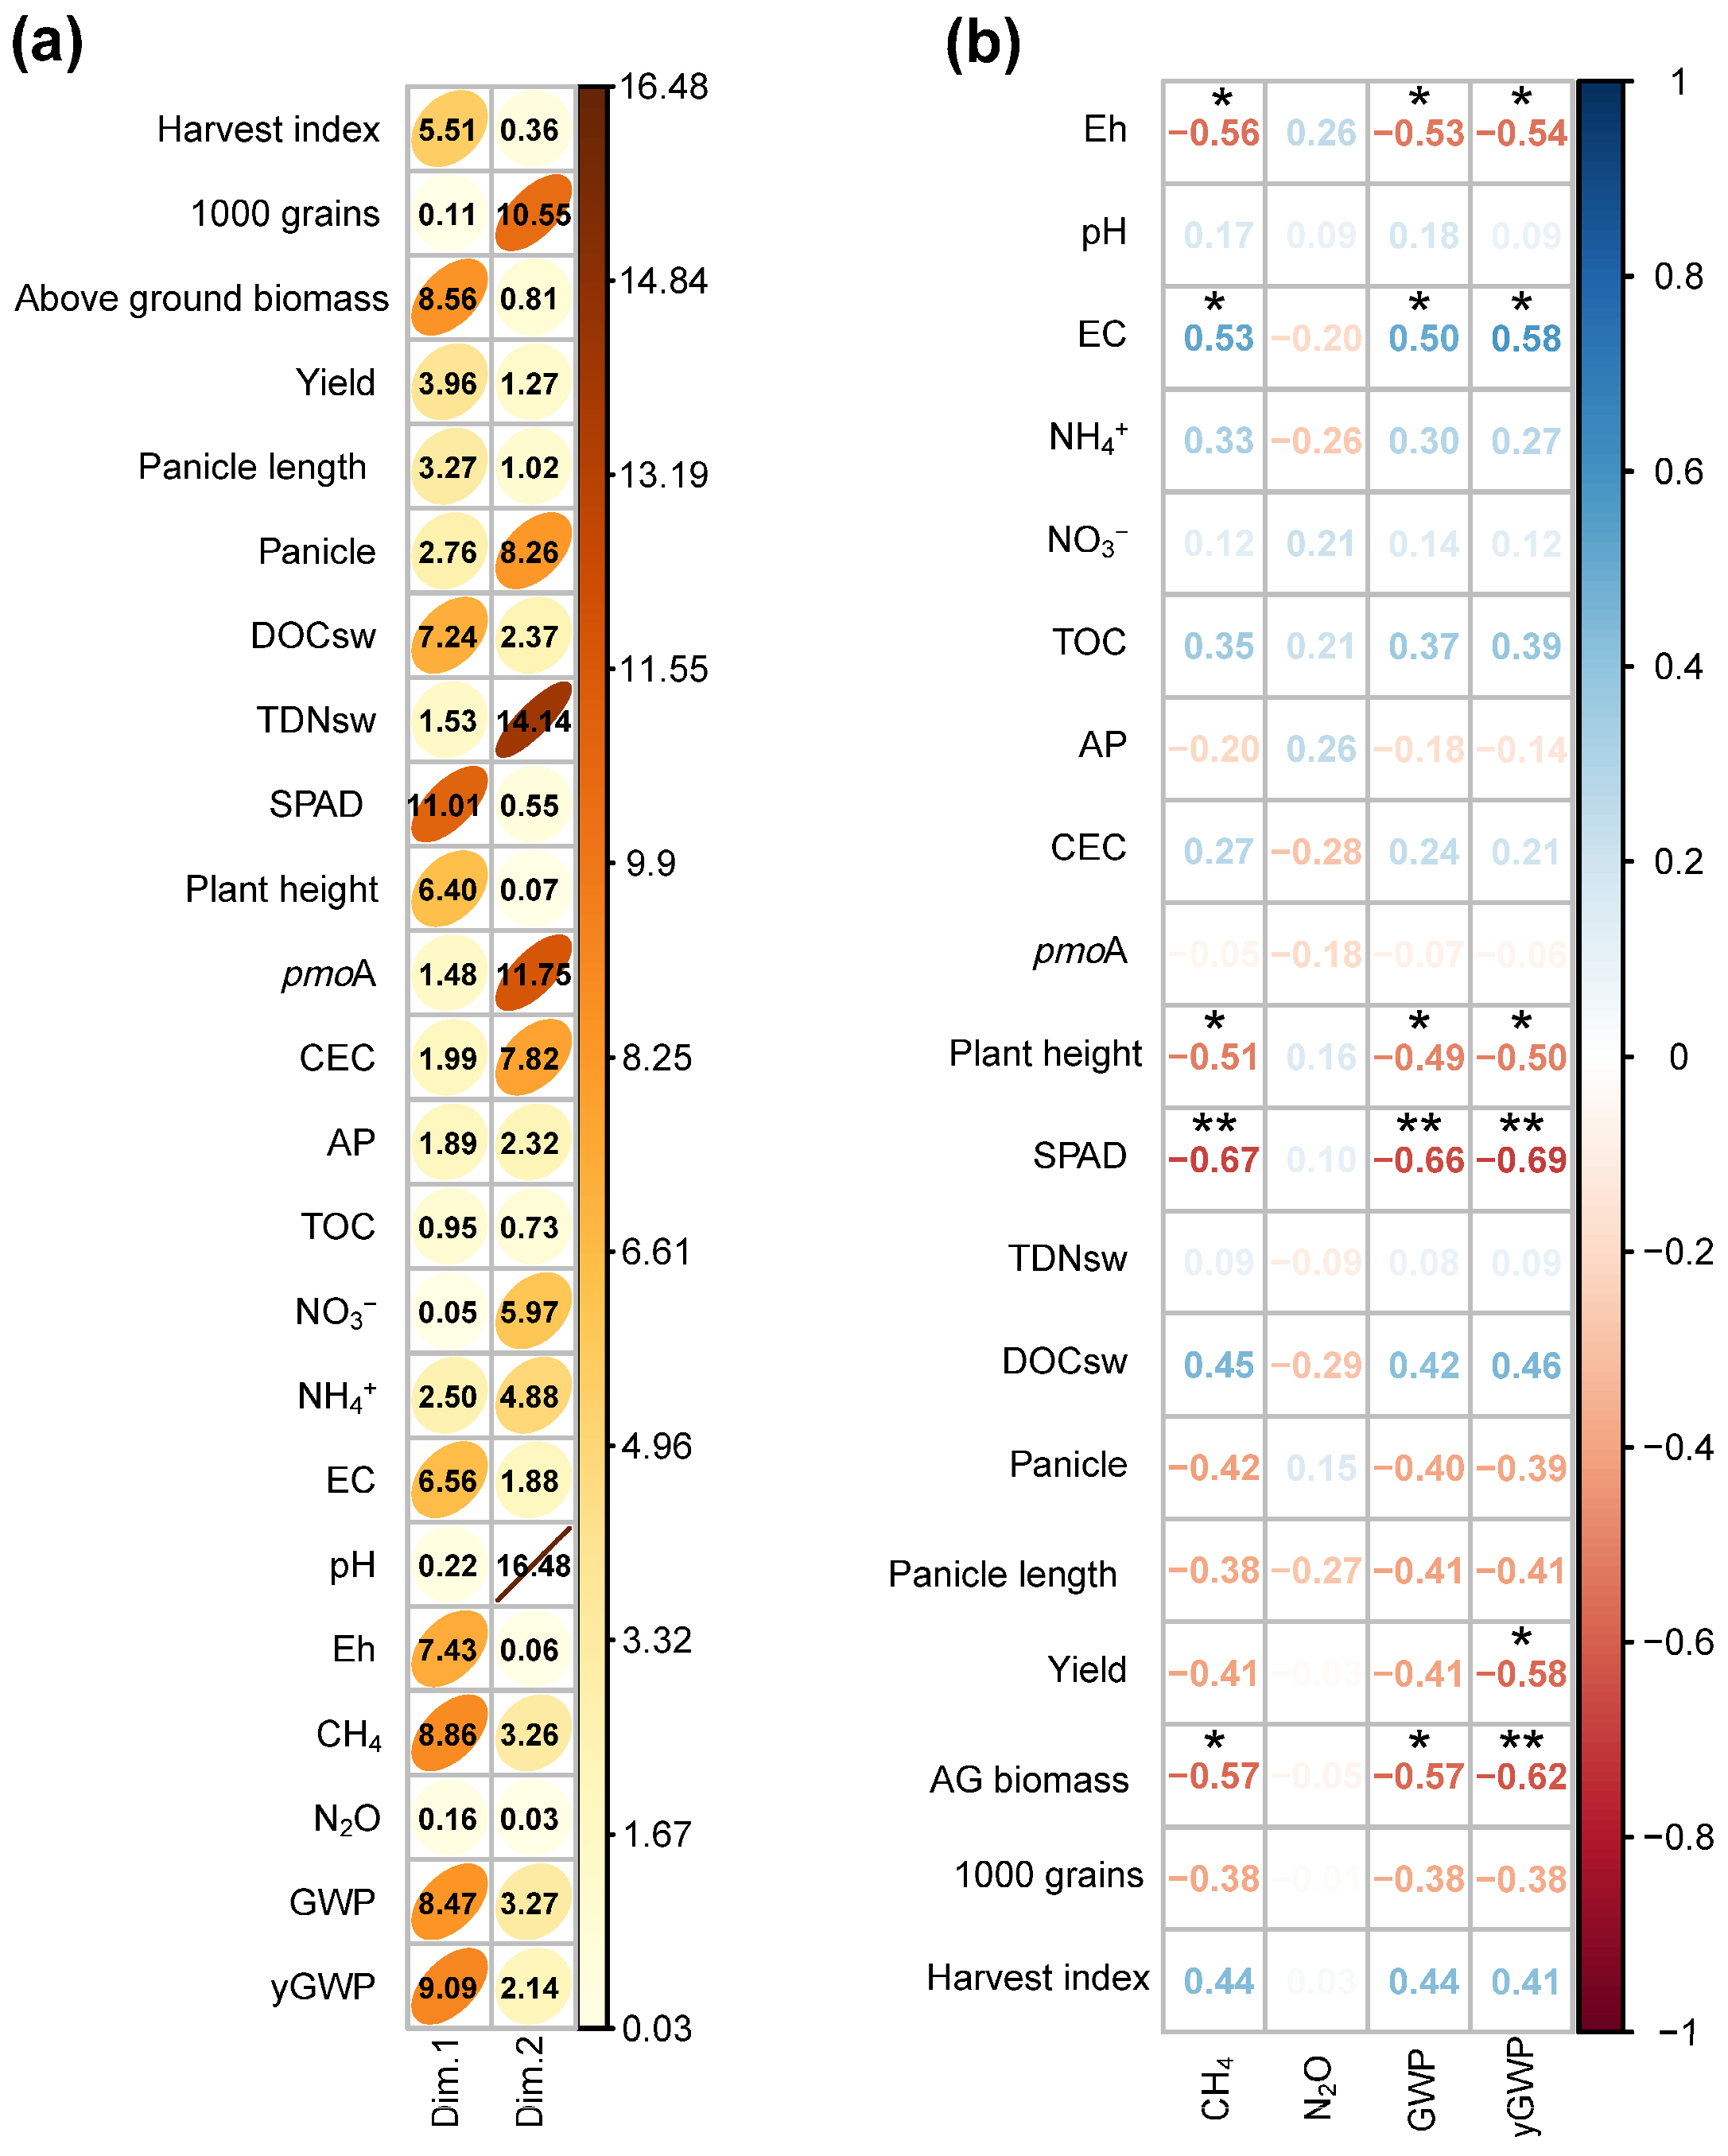
3.5. Factors Affecting Greenhouse Gas Emissions

A PCA was conducted for environmental variables, such as rice growth, biomass, yield, and GHG emissions (Figure 5). Two Dims were extracted based on the Scree plot (Elbow method) that explained 48.5% of variables, of which Dim1 and Dim2 can be explained by 35.5% and 15.0%, respectively. In Dim1, treatments of BDE, MS2, and MP2 revealed an identical direction with CH4 emission, GWP, and yGWP, while SF, MS1, and MP1 showed a reverse direction. Dim2, SF, BDE, and MS1 treatments exhibited the same direction with CH4 emission, GWP and yGWP, while a reverse direction was observed for the MS2, MP1, and MP2 treatments. The critical variables that contributed to the PCA included (i) Dim1 (harvest index, AG biomass, DOCsw, SPAD, plant height, EC, Eh, CH4, GWP, and yGWP) and (ii) Dim2 (weight of 1000 grains, panicle, TNDsw, pmoA, CEC, NO3, and NH4+) (Figure 6a). Figure 6b shows the Pearson relationship between the explanatory variables (environmental and rice growth factors) and emission factors. It was found that CH4 had a positive correlation with EC (p < 0.05), whilst a negative relationship between CH4 and Eh (p < 0.05), plant height (p < 0.05), SPAD (p < 0.01), and AG biomass (p < 0.05) was identified. GWP and yGWP showed a similar trend of CH4 emission in terms of Pearson correlation. No significant relationship between N2O emission and explanatory factors was observed.

4. Discussion

4.1. Soil and Soil Water Changes under Methanotroph-Inoculated BDE Application

Several studies exhibited agronomic benefits from BDE application on soil properties [9,20,42,43,44,45]. However, the effect of irrigating methanotroph-inoculated BDE on paddy fields remains unclear. This study found that the application of methanotroph-inoculated BDE did not influence the soil pH, AP, NH4+, TOC, and CEC (Table 3), but an increase in EC was observed in the treatments of BDE or methanotroph-inoculated BDE (MS1, MP1, MS2, and MP2). The increase in soil EC could be attributable to the high EC value of BDE (Table 1) and the accumulation of applied BDE over time. In addition, no leaching or runoff occurred under the pot experiment. However, the elevated EC scale (<0.75 mS cm−1) was in the range of rice plant preference (<3 mS cm−1) [46]. Although there were insignificant differences in NH4+, TOC, and CEC contents among treatments, their concentration tended to increase in treatments applied with methanotroph-inoculated BDE. The increase could be explained by the availability of inorganic nitrogen and organic matter enrichment from BDE (Table 1), which previous findings reported [21,42,47]. NH4+ proliferation provides a more plant-available nitrogen source due to its high assimilation capacity [48,49], while the increment of TOC and CEC can improve soil structure [50]. Moreover, improving NH4+, TOC, and CEC could promote soil biological processes and carbon sequestration [44,51]. Substantially, the results demonstrated that irrigating BDE with methanotroph inoculation slightly improves soil properties and nutrients under a pot experiment.
The effects of irrigating methanotroph-inoculated BDE on DNsw were relatively low, although a higher DNsw tendency was observed. As such, risks related to excessive nutrient accumulation when exerting BDE were moderate [20]. The increase in DOCsw in the soil water in the BDE or MS2 and MP2 treatments could be attributable to the highest dosage of BDE (Table 1) and rhizodeposition owing to the photosynthate conversion [41,52]. A tendency of DOCsw extension in soil water solution owing to BDE application possibly implies the enhancement of substrates for methanogens [1,41].

4.2. Effects of Methanotroph-Inoculated BDE Application on Rice Growth and Yield Components

The time course changes in plant height and SPAD were similar, irrespective of treatments. Thus, methanotroph-coupled BDE irrigation did not compromise rice growth [16,53]. Moreover, no rice plant injuries were observed due to the application of methanotroph-inoculated BDE. Also, this study revealed that the difference in the number of panicles, panicle length, yield, weight of 1000 grains, and harvest index were insignificant among treatments, although SF, MS1, and MP1 treatments gained slightly better biomass. The non-significant difference could be attributable to the total nitrogen similarity as well as the NPK composition of methanotroph-inoculated BDE to provide sufficient nutrients for rice plants. The slightly higher biomass could be explained by the response of rice plants to N from SF or the combination between SF and methanotroph-inoculated BDE better than the single use of BDE [53]. In this study, the application of methanotroph-inoculated BDE obtained a similar yield to the treatment SF as well as IR50404 cultivar productivity reported in the VMD (498–863 g m−2) [16,20,34,53,54]. As a result, the application of methanotroph-inoculated BDE in terms of N substitution did not compromise rice production.

4.3. Effects of Methanotroph-Inoculated BDE on Methane and Nitrous Oxide Emissions

This study found that the total CH4 emission varied from 21.3 to 30.6 g CH4 m−2, which was in line with previous reports using cascade effluent for rice fields [17,19,20,21,24] (Table 4) as well as referring to the VMD’s rice fields [34,54,55,56]. However, the CH4 emission varied between study sites and livestock’s BDE. For example, the application of cattle BDE (150 g m−2 based on N-TKN) increased CH4 emission by ~19% compared to fields applied with exogenous fertilizers in the VMD [20]. Another study that utilized pig biogas slurry for rice fields in China revealed a maximum of 84% higher CH4 emission than in chemically fertilized fields [19]. Other study performed in Japan’s rice fields (Fuchu, Tokyo) discovered CH4 emission from fields applied with pig biogas slurry (10–30 g N m−2 based on N-NH4+) augmented from 53.5 to 115.3% compared to conventional fields [21]. This study revealed that additional absolute BDE without methanotroph inoculation caused ~34% of CH4 emission larger than SF (Figure 2a), which was higher than cattle BDE but lower than biogas slurry. These studies indicated a high risk of GHG emission augmentation for recirculating effluent exclusive of appropriate emission reduction measures. Recent endeavors in reducing CH4 emissions were also conducted in terms of technical irrigation approaches for fields applied with BDE by a handful of studies, such as multiple drainages and water saving [20,24]. Although lower GHG emissions were achieved in the field where these technologies were applied compared to continuous flooding fields, higher CH4 emissions were observed when BDE or biogas slurry was applied versus chemical fertilization. Therefore, the CH4 emission reduction for fields applied with BDE must be considered.
Previous studies have recently reported co-inoculation of aerobic CH4-oxidizing bacteria (Methylobacterium oryzae MNL7) and plant growth-promoting bacteria (Paenibacillus polymyxa MaAL70) reduced total CH4 emission from 6.92 to 12.03% and increased the rice yield by 11.08–14.04%. Another study also revealed that methanotroph inoculation on rice fields lowered CH4 emissions by 60% and augmented rice yield by 35% [26]. The augmentation of rice yields, known as several methanotrophs, can increase the soil N availability, enhancing photosynthate allocation to grains [26,31,32]. However, these studies examined differences in chemical fertilizer dosages or types of methanotrophs. The present study focused on the CH4 emission mitigation by the application of BDE inoculated with Methylosinus sp. and Methylocystis sp. for rice. We found that the CH4 emission reduction efficacy in the MS2 and MP2 treatments was 17–21%, although a higher CH4 flux (9.5–13.7%) was still observed compared to SF (Figure 2a). Methanotrophs acted effectively in the MS1 and MP1 treatments. The CH4 emission was comparable with the SF treatment and significantly lower than the BDE by 28% and 44%, respectively (Figure 2a). Notably, we found that the effects of methanotroph strains on soil CH4 emission were marginally different (7.9%), while increasing methanotroph-inoculated BDE in terms of N replacement stimulated significantly higher CH4 flux by 12%. This indicated that the methanotroph application was more suitable for combining SF and BDE. As such, we recommended that further works optimize the proportion between SF and methanotroph-inoculated BDE to maximize the use of cascade digestate that does not accelerate CH4 emissions.
This study exhibited that N2O emissions from the paddy field applied with BDE or a combination of methanotroph-inoculated BDE and SF was relatively lowers (10.6–83.6 mg N2O m−2) than with SF sole applications, which was consistent with the variation in previous findings (Table 5) [20]. In line with the current study, Minamikawa et al. [20] showed more significant N2O emission levels in the fields subjected to SF rather than BDE application. The lower N2O emissions could be attributed to the lower substrates for nitrification and denitrification in BDE than SF and the nitrogen availability for N2O-producing bacteria [1,20].
Only a few studies performed the N2O emission measurement from fields applied with BDE (Table 7), as the primary concern is the high CH4 emission augmentation and its elevated percentage contribution to net GHG emission. This study divulged that the application of methanotroph-inoculated BDE (MS2 and MP2 treatments) was prone to higher N2O emissions when compared to only BDE, MS1, and MP1 treatments. In contrast, the combination of SF and methanotroph-inoculated BDE (MS1 and MP1 treatments) was marginal compared to the BDE treatment. However, a significant standard deviation resulted in insignificant differences among the treatments. The mechanisms of the lower N2O emissions from rice applied with BDE or methanotroph-inoculated BDE treatments have remained unclear, but it is logical to expect the higher substrate (N-NH4+ and DNsw) for nitrification (Table 3 and Table 4) would stimulate N2O emissions when N presence a higher level in soil [1].
We applied BDE based on N-TN, while several studies used N-NH4+ [17,21,24,57] and N-TKN [20]. The N-NH4+ content generally accounted for around 86–96% of TN in BDE [16], while TKN and TN are comparable as the NOx content in BDE is relatively low [58]. If the N-NH4+ ratio is low in BDE, the N-NH4+-based BDE application for rice could increase the BDE volume and raise substrates for methanogens or the nitrifier nitrification–denitrification process. The increase in substrates could potentially enlarge CH4 and N2O emissions-related risks.
This study found no risks concerning N2O emission expansion when inoculating methanotrophs to BDE to irrigate rice plants. However, N2O emissions increased after fertilizing or drainage. This trend was observed in the treatment SF, even under flooded conditions [20]. Although this mechanism remains unclear in this study, several studies have demonstrated that N chemical fertilizer provides substrates for nitrification–denitrification processes in low pH soil or N surplus that promote higher N2O emission [1,59,60]. The different scales of N fertilizer doses resulted in an expansion of N2O emission by ~182% [61]. This study found that the ratio of N-N2O flux to input N-TN varied between 0.04 and 0.48%, slightly lower than the range of the IPCC’s guidelines (0.5%) for multiple drainages. In comparison, it is equivalent to the range for fields applied with cattle BDE (0.14–0.65%) [20] and 0.52% (0.15–1.13%) for typical rice fields [1].
Table 7. Type of digestate, experimental condition, water management, amount of nitrogen applied, and GHG emissions from paddy field applied with BDE or slurry.
DigestateExperimental ConditionWater ManagementN Applied
(g N m−2)
CH4 Emission
(g CH4 m−2)
N2O Emission
(mg N2O m−2)
Reference
Cattle BDEApplying 100% BDE based N-TKN, direct seeding, field experiment in VMDAWD, MiDi, CF153744[20]
Pig biogas slurryCombination of chemical fertilizers and BDE (25–100%), transplanting, a field experiment in Jiangsu, ChinaMD2416–54.4NA[19]
Pig biogas slurryApplying slurry based on N-NH4+, transplanting, a field experiment in Fuchu, Tokyo, JapanNA10–3032–43.7−0.16–0.26[21]
Pig biogas slurryApplying slurry based on N-NH4+-effects of rice cultivars, transplanting, a field experiment in Fuchu Tokyo, JapanNA10–3052–80NA[62]
Cattle slurryMixing slurry with wood vinegar, transplanting, Lysimeter experiment in Fuchu Tokyo, JapanCF3060–1500.01–0.23[57]
Pig biogas slurryApplying slurry based on N-NH4+-effects of rice cultivars and Eh control, transplanting, field experiment in Fuchu Tokyo, JapanCF, WS308.4–23.80.11–0.14[24]
Cattle slurryMixing biogas slurry and urea, transplanting, a field experiment in New Delhi, India CF122.21NA[63]
Cattle slurryFertilizing slurry based on N-NH4+, transplanting, a field experiment in Osaka, Japan.CF, MiDi1217.1–31.4NA[17]
Pig BDE inoculated with methanotrophsFertilizing effluent based on N-TN-methanotroph inoculation, Direct seeding, a pot experiment in the VMDMD1521.3–30.610.6–83.6Current study
NA: not applicable; AWD, alternative wetting and drying; CF, continuous flooding; MiDi, midseason drainage followed by intermittent irrigation; MD, multiple drainage; WS, water-saving irrigation.

4.4. The Role of Methanotrophs in CH4 Emission Reduction

This study achieved a lower CH4 emission in rice fields applied with methanotroph-inoculated BDE, thus indicating that the strains of Methylocinus sp. and Methylocystis sp. effectively work in the rice soil. Although the pmoA transcript copy number was a non-significant difference among treatments (Figure 4), the application of methanotroph-inoculated BDE enhanced the transcript copy number of pmoA compared to the SF and BDE treatments, thus indicating the methanotroph inoculation plays a crucial role in mitigating CH4 emission from rice fields. We did not find a significant relationship between pmoA transcript copy number and CH4 emission (Figure 5 and Figure 6b). The dynamic of the pmoA transcript copy number has yet to be revealed in fields inoculated with methanotrophs. However, several studies have found the positive effects of methanotroph inoculation on CH4 emission reduction [26,30]. To find the relationship between pmoA transcript copy number and CH4 emission (without methanotroph inoculation), Sakoda et al. [41] found no relationship between these variables. However, mcrA/pmoA (methanogens/methanotrophs) had a negative relationship with CH4 emission, therefore indicating that the CH4 emission is more likely related to the balance between methanotrophs and methanogens. The findings suggest that mcrA/pmoA is an important parameter when examining the effectiveness of CH4 emission reduction in rice fields.
A PCA revealed the same direction of the BDE, MS2, and MP2 treatments versus CH4 emissions, GWP and yGWP, indicating that GHG emissions were higher in the case of 100% BDE application, although the inoculation of methanotrophs could alleviate the fluxes. An inverse direction of the SF, MS1, and MP1 treatments showed the effectiveness of the combined application of methanotroph-inoculated BDE and SF at 50:50. Moreover, those treatments also displayed a positive correlation with SPAD, biomass, yield, panicle, panicle length, and Eh. This study found that EC had a positive relationship with CH4 emissions, GWP, and yGWP (Figure 6b), indicating that the application of BDE increased CH4 emissions owing to the enrichment of methanogenic substrates. Eh had a negative relationship with CH4 emissions, indicating that the ameliorating soil aeration condition possibly mitigates CH4 emissions in fields applied with methanotroph-inoculated BDE. It is well known that reducing soil redox fuels for CH4 production owing to the donation of oxygen solubility stimulates the consumption of oxygen and electron acceptors by microbes [64]. Although Eh values showed mostly reduction status (Figure 3), the efficiency of CH4 emission reduction was also achieved under fields applied with methanotrophs regardless of soil reduction condition. We found that CH4 emission, GWP, and yGWP had a negative relationship between plant height, SPAD, and above-ground biomass, indicating that a high chlorophyll content and plant biomass suggest the prospect of a reduction in CH4 emissions as the leaf photosynthesis and biomass effects to oxygen transportation [65]. On the other hand, applying methanotroph-inoculated BDE with the best rice varieties is a practical approach for mitigating CH4 emissions that could be considered for further research, offering a promising solution to the global challenge of GHG emissions.

5. Conclusions

With its promising findings, this study examined the impact of applying methanotroph-inoculated BDE to paddy fields on CH4 and N2O emissions and grain yield under a pot experiment in the VMD. The BDE application increased CH4 emissions by ~34% compared to SF. Applying 100% and 50% methanotroph-inoculated BDE for rice decreased CH4 emission by 28–44% and 17–21%, respectively. The combination of 50% SF and 50% methanotroph-inoculated BDE resulted in better CH4 emission reduction, offering a promising solution for reducing GHG emissions in rice production. The application of methanotroph-inoculated BDE did not increase N2O emissions compared to SF-applied treatments. N2O emissions were found to be a minor contribution to the GHG emission pattern and showed an insignificant difference among treatments. As a result, this study achieved a lower GWP and yGWP of rice irrigated with methanotroph-inoculated BDE, without a trade-off in yield. Although Methylocinus sp. and Methylocystis sp. showed insignificant GHG emissions, a higher potential of GHG emission reduction was found for Methylocystis sp. in relation to reducing both CH4 and N2O emissions. These findings provide information and optimism for developing rice production systems with lower GHG emissions and the reuse of unutilized nutrient-enriched BDE based on methanotrophs in VMD.

Supplementary Materials

The following supporting information can be downloaded at: https://www.mdpi.com/article/10.3390/agronomy14061140/s1, Figure S1: Weather data recorded during the experimentation. The weather data (z6-18426, ATMOS 41, Meter Japan Co., Ltd., Tokyo, Japan) was installed outside the screenhouse; Figure S2: Experimental design under a pot experiment; Figure S3: Collecting air samples using closed-chamber method under a pot experiment; Table S1: Specification for the gas chromatographs (GCs) equipped with a flame ionization detector (FID) and Electron Capture Detector (ECD).

Author Contributions

Conceptualization, H.V.T., M.T., H.T. and T.N.; methodology, H.V.T., M.T., H.T., T.N., T.S.N., N.V.C. and D.T.X.; software, H.V.T. and M.T.; validation, H.V.T., M.T., H.T. and T.N.; formal analysis, H.V.T. and M.T.; investigation, H.V.T., M.T., T.S.N., N.V.C. and D.T.X.; data curation, H.V.T. and M.T.; writing—original draft preparation, H.V.T. and M.T.; writing—review and editing, H.V.T., M.T., H.T., T.N., T.S.N., N.V.C. and D.T.X.; visualization, H.V.T. and M.T.; supervision, M.T., H.T. and T.N. All authors have read and agreed to the published version of the manuscript.

Funding

This research received no external funding.

Data Availability Statement

The original contributions presented in the study are included in the article/Supplementary Materials, and further inquiries can be directed to the corresponding author.

Acknowledgments

We would like to thank the Laboratory of Environmental Toxicology and Advanced Environmental Microbiology, Soil and Water Environment, and Environmental Biology, Can Tho University, Vietnam, for supporting equipment and analysis. We also thank Tran Hoang Kha, Dinh Thai Danh, Huynh Tuyet Nhu—Researchers at Can Tho University; Doan Hung Minh, Tran Thi Thanh Truc, Tran Minh Tien, Trinh Van Dat, Huynh Dinh Tam, Le My Xuyen students of Can Tho University for supporting the experiment. We would like to thank Taro Izumi and Kazunori Minamikawa (Japan International Research Center for Agricultural Sciences–JIRCAS, Japan) for their valuable comments on the experiment.

Conflicts of Interest

The authors declare no conflicts of interest.

References

  1. Qian, H.; Zhu, X.; Huang, S.; Linquist, B.; Kuzyakov, Y.; Wassmann, R.; Minamikawa, K.; Martinez-Eixarch, M.; Yan, X.; Zhou, F.; et al. Greenhouse Gas Emissions and Mitigation in Rice Agriculture. Nat. Rev. Earth Environ. 2023, 4, 716–732. [Google Scholar] [CrossRef]
  2. Myhre, G.; Shindell, D.; Bréon, F.M.; Collins, W.; Fuglestvedt, J.; Huang, J.; Koch, D.; Lamarque, J.F.; Lee, D.; Mendoza, B.; et al. Anthropogenic and Natural Radiative Forcing. In Climate Change 2013: The Physical Science Basis. Contribution of Working Group I to the Fifth Assessment Report of the Intergovernmental Panel on Climate Change; Stocker, T.F., Qin, D., Plattner, G.-K., Tignor, M.M.B., Allen, S.K., Boschung, J., Nauels, A., Xia, Y., Bex, V., Midgley, P.M., Eds.; Cambridge University Press: Cambridge, UK; New York, NY, USA, 2013; pp. 659–740. [Google Scholar]
  3. Carlson, K.M.; Gerber, J.S.; Mueller, N.D.; Herrero, M.; MacDonald, G.K.; Brauman, K.A.; Havlik, P.; O’Connell, C.S.; Johnson, J.A.; Saatchi, S.; et al. Greenhouse Gas Emissions Intensity of Global Croplands. Nat. Clim. Chang. 2017, 7, 63–68. [Google Scholar] [CrossRef]
  4. Yan, X.; Yagi, K.; Akiyama, H.; Akimoto, H. Statistical Analysis of the Major Variables Controlling Methane Emission from Rice Fields. Glob. Chang. Biol. 2005, 11, 1131–1141. [Google Scholar] [CrossRef]
  5. Nam, T.S.; Van Cong, N.; Van Thao, H. Enhancing Renewable Energy Production from Water Hyacinth (Eichhornia crassipes) by a Biogas-Aerating Recirculation System: A Case Study in the Vietnamese Mekong Delta. Case Stud. Chem. Environ. Eng. 2023, 7, 100340. [Google Scholar] [CrossRef]
  6. Rajendran, K.; Aslanzadeh, S.; Taherzadeh, M.J. Household Biogas Digesters—A Review. Energies 2012, 5, 2911–2942. [Google Scholar] [CrossRef]
  7. Thoa, L.T. Lack of Overall Strategy on the Expansion of Biogas Production. Biogas J. 2020, 1–3. Available online: https://gizenergy.org.vn/wp-content/uploads/Biogas_Journal_Aug-2020_ENG-1.pdf (accessed on 22 May 2024).
  8. Dinh, T.X. An Overview of Agricultural Pollution in Vietnam: The Livestock Sector; World Bank: Washington, DC, USA, 2017. [Google Scholar]
  9. Xu, M.; Xian, Y.; Wu, J.; Gu, Y.; Yang, G.; Zhang, X.; Peng, H.; Yu, X.; Xiao, Y.; Li, L. Effect of Biogas Slurry Addition on Soil Properties, Yields, and Bacterial Composition in the Rice-Rape Rotation Ecosystem over 3 Years. J. Soils Sediments 2019, 19, 2534–2542. [Google Scholar] [CrossRef]
  10. Nguyen Vo Chau, N.; Huynh Van, T.; Nguyen Cong, T.; Kim, L.; Pham, D.V. Water Lettuce ( Pistia stratiotes L.) Increases Biogas Effluent Pollutant Removal Efficacy and Proves a Positive Substrate for Renewable Energy Production. PeerJ 2023, 11, e15879. [Google Scholar] [CrossRef]
  11. Wang, H.; Xu, J.; Liu, X.; Sheng, L.; Zhang, D.; Li, L.; Wang, A. Study on the Pollution Status and Control Measures for the Livestock and Poultry Breeding Industry in Northeastern China. Environ. Sci. Pollut. Res. 2018, 25, 4435–4445. [Google Scholar] [CrossRef] [PubMed]
  12. Biagini, D.; Lazzaroni, C. Eutrophication Risk Arising from Intensive Dairy Cattle Rearing Systems and Assessment of the Potential Effect of Mitigation Strategies. Agric. Ecosyst. Environ. 2018, 266, 76–83. [Google Scholar] [CrossRef]
  13. Chen, S.; Yu, W.; Zhang, Z.; Luo, S. Soil Properties and Enzyme Activities as Affected by Biogas Slurry Irrigation in the Three Gorges Reservoir Areas of China. J. Environ. Biol. 2015, 36, 513–520. [Google Scholar] [PubMed]
  14. Ding, W.; Niu, H.; Chen, J.; Du, J.; Wu, Y. Influence of Household Biogas Digester Use on Household Energy Consumption in a Semi-Arid Rural Region of Northwest China. Appl. Energy 2012, 97, 16–23. [Google Scholar] [CrossRef]
  15. Yang, W.-J.; Shao, D.-D.; Zhou, Z.; Xia, Q.-C.; Chen, J.; Cao, X.-L.; Zheng, T.; Sun, S.-P. Carbon Quantum Dots (CQDs) Nanofiltration Membranes towards Efficient Biogas Slurry Valorization. Chem. Eng. J. 2020, 385, 123993. [Google Scholar] [CrossRef]
  16. Minamikawa, K.; Khanh, H.C.; Hosen, Y.; Nam, T.S.; Chiem, N.H. Variable-Timing, Fixed-Rate Application of Cattle Biogas Effluent to Rice Using a Leaf Color Chart: Microcosm Experiments in Vietnam. Soil Sci. Plant Nutr. 2020, 66, 225–234. [Google Scholar] [CrossRef]
  17. Tanaka, T.S.T.; Nitta, Y.; Kido, K.; Nishikawa, T.; Matoh, T.; Inamura, T. Effect of the Long-Term Application of Anaerobically Digested Residual Slurry on Methane Emissions in a Rice Paddy Field. Soil Sci. Plant Nutr. 2017, 63, 300–305. [Google Scholar] [CrossRef]
  18. Wang, Q.; Chen, Z.; Zhao, J.; Ma, J.; Yu, Q.; Zou, P.; Lin, H.; Ma, J. Fate of Heavy Metals and Bacterial Community Composition Following Biogas Slurry Application in a Single Rice Cropping System. J. Soils Sediments 2022, 22, 968–981. [Google Scholar] [CrossRef]
  19. Huang, H.-Y.; Cao, J.-L.; Wu, H.-S.; Ye, X.-M.; Ma, Y.; Yu, J.-G.; Shen, Q.-R.; Chang, Z.-Z. Elevated Methane Emissions from a Paddy Field in Southeast China Occur after Applying Anaerobic Digestion Slurry. GCB Bioenergy 2014, 6, 465–472. [Google Scholar] [CrossRef]
  20. Minamikawa, K.; Huynh, K.C.; Uno, K.; Tran, N.S.; Nguyen, C.H. Cattle Biogas Effluent Application with Multiple Drainage Mitigates Methane and Nitrous Oxide Emissions from a Lowland Rice Paddy in the Mekong Delta, Vietnam. Agric. Ecosyst. Environ. 2021, 319, 107568. [Google Scholar] [CrossRef]
  21. Win, A.T.; Toyota, K.; Win, K.T.; Motobayashi, T.; Ookawa, T.; Hirasawa, T.; Chen, D.; Lu, J. Effect of Biogas Slurry Application on CH4 and N2O Emissions, Cu and Zn Uptakes by Whole Crop Rice in a Paddy Field in Japan. Soil Sci. Plant Nutr. 2014, 60, 411–422. [Google Scholar] [CrossRef]
  22. Lu, Y.; Wassmann, R.; Neue, H.U.; Huang, C.; Bueno, C.S. Methanogenic Responses to Exogenous Substrates in Anaerobic Rice Soils. Soil Biol. Biochem. 2000, 32, 1683–1690. [Google Scholar] [CrossRef]
  23. Wassmann, R.; Tölg, M.; Papen, H.; Rennenberg, H.; Seiler, W.; Cheng, D.X.; Wang, M.X. Spatial and Seasonal Distribution of Organic Amendments Affecting Methane Emission from Chinese Rice Fields. Biol. Fert. Soils 1996, 22, 191–195. [Google Scholar] [CrossRef]
  24. Win, K.T.; Nonaka, R.; Win, A.T.; Sasada, Y.; Toyota, K.; Motobayashi, T. Effects of Water Saving Irrigation and Rice Variety on Greenhouse Gas Emissions and Water Use Efficiency in a Paddy Field Fertilized with Anaerobically Digested Pig Slurry. Paddy Water Environ. 2015, 13, 51–60. [Google Scholar] [CrossRef]
  25. Jiang, H.; Chen, Y.; Jiang, P.; Zhang, C.; Smith, T.J.; Murrell, J.C.; Xing, X.-H. Methanotrophs: Multifunctional Bacteria with Promising Applications in Environmental Bioengineering. Biochem. Eng. J. 2010, 49, 277–288. [Google Scholar] [CrossRef]
  26. Davamani, V.; Parameswari, E.; Arulmani, S. Mitigation of Methane Gas Emissions in Flooded Paddy Soil through the Utilization of Methanotrophs. Sci. Total Environ. 2020, 726, 138570. [Google Scholar] [CrossRef]
  27. Singh, J.S.; Pandey, V.C.; Singh, D.P.; Singh, R.P. Influence of Pyrite and Farmyard Manure on Population Dynamics of Soil Methanotroph and Rice Yield in Saline Rain-Fed Paddy Field. Agric. Ecosyst. Environ. 2010, 139, 74–79. [Google Scholar] [CrossRef]
  28. Fan, L.; Schneider, D.; Dippold, M.A.; Poehlein, A.; Wu, W.; Gui, H.; Ge, T.; Wu, J.; Thiel, V.; Kuzyakov, Y.; et al. Active Metabolic Pathways of Anaerobic Methane Oxidation in Paddy Soils. Soil Biol. Biochem. 2021, 156, 108215. [Google Scholar] [CrossRef]
  29. Thauer, R.K. Functionalization of Methane in Anaerobic Microorganisms. Angew. Chem. Int. Ed. 2010, 49, 6712–6713. [Google Scholar] [CrossRef]
  30. Rani, V.; Bhatia, A.; Kaushik, R. Inoculation of Plant Growth Promoting-Methane Utilizing Bacteria in Different N-Fertilizer Regime Influences Methane Emission and Crop Growth of Flooded Paddy. Sci. Total Environ. 2021, 775, 145826. [Google Scholar] [CrossRef]
  31. Auman, A.J.; Speake, C.C.; Lidstrom, M.E. nifH Sequences and Nitrogen Fixation in Type I and Type II Methanotrophs. Appl. Environ. Microbiol. 2001, 67, 4009–4016. [Google Scholar] [CrossRef]
  32. Cui, J.; Zhang, M.; Chen, L.; Zhang, S.; Luo, Y.; Cao, W.; Zhao, J.; Wang, L.; Jia, Z.; Bao, Z. Methanotrophs Contribute to Nitrogen Fixation in Emergent Macrophytes. Front. Microbiol. 2022, 13, 851424. [Google Scholar] [CrossRef]
  33. Statistical Yearbook of Vietnam. General Statistics Office, Statistical Publishing House. 2022. Available online: https://www.gso.gov.vn/wp-content/uploads/2023/06/Sach-Nien-giam-TK-2022-update-21.7_file-nen-Water.pdf (accessed on 25 February 2024). (In Vietnamese)
  34. Uno, K.; Ishido, K.; Nguyen Xuan, L.; Nguyen Huu, C.; Minamikawa, K. Multiple Drainage Can Deliver Higher Rice Yield and Lower Methane Emission in Paddy Fields in An Giang Province, Vietnam. Paddy Water Environ. 2021, 19, 623–634. [Google Scholar] [CrossRef]
  35. Carter, M.R.; Gregorich, E.G. Soil Sampling and Methods of Analysis; CRC Press: Boca Raton, FL, USA, 2008; p. 1240. [Google Scholar] [CrossRef]
  36. Walkley, A.J.; Black, I.A. Estimation of soil organic carbon by the chromic acid titration method. Soil Sci. 1934, 37, 29–38. [Google Scholar] [CrossRef]
  37. APHA. Standard Methods for the Examination of Water and Wastewater, 20th ed.; American Public Health Association, American Water Works Association and Water Environmental Federation: Washington, DC, USA, 1998. [Google Scholar]
  38. Houba, J.; van der Lee, J.; Novozamsky, I.; Walinga, I. Soil analysis procedures. In Soil and Plants Analysis; Novozamski, I., van der Lee, J.J., Houba, V.J.G., Walinga, I., van Vark, W., Temminghoff, E., Eds.; Wageningen University: Wageningen, The Netherlands, 1988; pp. 25–27. [Google Scholar]
  39. Bray, R.A.; Kurtz, L.T. Determination of Total Organic and Available Forms of Phosphorus in Soils. Soil Sci. 1945, 59, 39–45. [Google Scholar] [CrossRef]
  40. Minamikawa, K.; Tokida, T.; Sudo, S.; Padre, A.; Yagi, K. Guidelines for Measuring CH4 and N2O Emissions from Rice Paddies by a Manually Operated Closed Chamber Method; National Institute for Agro-Environmental Sciences: Tsukuba, Japan, 2015. [Google Scholar]
  41. Sakoda, M.; Tokida, T.; Sakai, Y.; Senoo, K.; Nishizawa, T. Mitigation of Paddy Field Soil Methane Emissions by Betaproteobacterium Azoarcus Inoculation of Rice Seeds. Microb. Environ. 2022, 37, ME22052. [Google Scholar] [CrossRef] [PubMed]
  42. Cao, Y.; Wang, J.; Wu, H.; Yan, S.; Guo, D.; Wang, G.; Ma, Y. Soil Chemical and Microbial Responses to Biogas Slurry Amendment and Its Effect on Fusarium Wilt Suppression. Appl. Soil Ecol. 2016, 107, 116–123. [Google Scholar] [CrossRef]
  43. Chen, R.; Blagodatskaya, E.; Senbayram, M.; Blagodatsky, S.; Myachina, O.; Dittert, K.; Kuzyakov, Y. Decomposition of Biogas Residues in Soil and Their Effects on Microbial Growth Kinetics and Enzyme Activities. Biomass Bioenergy 2012, 45, 221–229. [Google Scholar] [CrossRef]
  44. Insam, H.; Gómez-Brandón, M.; Ascher, J. Manure-Based Biogas Fermentation Residues—Friend or Foe of Soil Fertility? Soil Biol. Biochem. 2015, 84, 1–14. [Google Scholar] [CrossRef]
  45. Yan, L.; Liu, C.; Zhang, Y.; Liu, S.; Zhang, Y. Effects of C/N Ratio Variation in Swine Biogas Slurry on Soil Dissolved Organic Matter: Content and Fluorescence Characteristics. Ecotoxicol. Environ. Saf. 2021, 209, 111804. [Google Scholar] [CrossRef] [PubMed]
  46. Hussain, S.; Zhang, J.; Zhong, C.; Zhu, L.; Cao, X.; Yu, S.; Allen Bohr, J.; Hu, J.; Jin, Q. Effects of Salt Stress on Rice Growth, Development Characteristics, and the Regulating Ways: A Review. J. Integr. Agric. 2017, 16, 2357–2374. [Google Scholar] [CrossRef]
  47. Wentzel, S.; Schmidt, R.; Piepho, H.-P.; Semmler-Busch, U.; Joergensen, R.G. Response of Soil Fertility Indices to Long-Term Application of Biogas and Raw Slurry under Organic Farming. Appl. Soil Ecol. 2015, 96, 99–107. [Google Scholar] [CrossRef]
  48. Chen, P.; Xu, J.; Zhang, Z.; Nie, T. “Preferential” Ammonium Uptake by Rice Does Not Always Turn into Higher N Recovery of Fertilizer Sources under Water-Saving Irrigation. Agric. Water Manag. 2022, 272, 107867. [Google Scholar] [CrossRef]
  49. Zhu, C.Q.; Zhang, J.H.; Zhu, L.F.; Abliz, B.; Zhong, C.; Bai, Z.G.; Hu, W.J.; Sajid, H.; James, A.B.; Cao, X.C.; et al. NH4+ Facilitates Iron Reutilization in the Cell Walls of Rice (Oryza sativa) Roots under Iron-Deficiency Conditions. Environ. Exp. Bot. 2018, 151, 21–31. [Google Scholar] [CrossRef]
  50. Nkoa, R. Agricultural Benefits and Environmental Risks of Soil Fertilization with Anaerobic Digestates: A Review. Agron. Sustain. Dev. 2014, 34, 473–492. [Google Scholar] [CrossRef]
  51. Abubaker, J.; Risberg, K.; Pell, M. Biogas Residues as Fertilisers—Effects on Wheat Growth and Soil Microbial Activities. Appl. Energy 2012, 99, 126–134. [Google Scholar] [CrossRef]
  52. Lu, Y.; Wassmann, R.; Neue, H.-U.; Huang, C. Dynamics of Dissolved Organic Carbon and Methane Emissions in a Flooded Rice Soil. Soil Sci. Soc. Amer J. 2000, 64, 2011–2017. [Google Scholar] [CrossRef]
  53. Huynh, K.C.; Minamikawa, K.; Nguyen, N.V.C.; Nguyen, C.H.; Nguyen, C.V. Effects of Cattle Biogas Effluent Application and Irrigation Regimes on Rice Growth and Yield: A Mesocosm Experiment. Jpn. Agric. Res. Q. JARQ 2022, 56, 341–348. [Google Scholar] [CrossRef]
  54. Tran Sy, N.; Huynh Van, T.; Nguyen Huu, C.; Nguyen Van, C.; Mitsunori, T. Rice Husk and Melaleuca Biochar Additions Reduce Soil CH4 and N2O Emissions and Increase Soil Organic Matter and Nutrient Availability. F1000Res 2021, 10, 1128. [Google Scholar] [CrossRef] [PubMed]
  55. Arai, H. Increased Rice Yield and Reduced Greenhouse Gas Emissions through Alternate Wetting and Drying in a Triple-Cropped Rice Field in the Mekong Delta. Sci. Total Environ. 2022, 842, 156958. [Google Scholar] [CrossRef] [PubMed]
  56. Vo, T.B.T.; Wassmann, R.; Mai, V.T.; Vu, D.Q.; Bui, T.P.L.; Vu, T.H.; Dinh, Q.H.; Yen, B.T.; Asch, F.; Sander, B.O. Methane Emission Factors from Vietnamese Rice Production: Pooling Data of 36 Field Sites for Meta-Analysis. Climate 2020, 8, 74. [Google Scholar] [CrossRef]
  57. Win, K.T.; Nonaka, R.; Toyota, K.; Motobayashi, T.; Hosomi, M. Effects of Option Mitigating Ammonia Volatilization on CH4 and N2O Emissions from a Paddy Field Fertilized with Anaerobically Digested Cattle Slurry. Biol. Fertil. Soils 2010, 46, 589–595. [Google Scholar] [CrossRef]
  58. Kumar, A.; Verma, L.M.; Sharma, S.; Singh, N. Overview on Agricultural Potentials of Biogas Slurry (BGS): Applications, Challenges, and Solutions. Biomass Conv. Bioref. 2022, 13, 13729–13769. [Google Scholar] [CrossRef] [PubMed]
  59. Linquist, B.A.; Adviento-Borbe, M.A.; Pittelkow, C.M.; Van Kessel, C.; Van Groenigen, K.J. Fertilizer Management Practices and Greenhouse Gas Emissions from Rice Systems: A Quantitative Review and Analysis. Field Crops Res. 2012, 135, 10–21. [Google Scholar] [CrossRef]
  60. Yao, Z.; Wang, R.; Zheng, X.; Mei, B.; Zhou, Z.; Xie, B.; Dong, H.; Liu, C.; Han, S.; Xu, Z.; et al. Elevated Atmospheric CO2 Reduces Yield-scaled N2O Fluxes from Subtropical Rice Systems: Six Site-years Field Experiments. Glob. Chang. Biol. 2021, 27, 327–339. [Google Scholar] [CrossRef] [PubMed]
  61. Liao, P.; Sun, Y.; Zhu, X.; Wang, H.; Wang, Y.; Chen, J.; Zhang, J.; Zeng, Y.; Zeng, Y.; Huang, S. Identifying Agronomic Practices with Higher Yield and Lower Global Warming Potential in Rice Paddies: A Global Meta-Analysis. Agric. Ecosyst. Environ. 2021, 322, 107663. [Google Scholar] [CrossRef]
  62. Win, A.T.; Toyota, K.; Ito, D.; Chikamatsu, S.; Motobayashi, T.; Takahashi, N.; Ookawa, T.; Hirasawa, T. Effect of Two Whole-Crop Rice (Oryza sativa L.) Cultivars on Methane Emission and Cu and Zn Uptake in a Paddy Field Fertilized with Biogas Slurry. Soil Sci. Plant Nutr. 2016, 62, 99–105. [Google Scholar] [CrossRef]
  63. Debnath, G.; Jain, M.C.; Kumar, S.; Sarkar, K.; Sinha, S.K. Methane Emissions from Rice Fields Amended with Biogas Slurry and Farm Yard Manure. Clim. Chang. 1996, 33, 97–109. [Google Scholar] [CrossRef]
  64. Wei, L.; Ge, T.; Zhu, Z.; Luo, Y.; Yang, Y.; Xiao, M.; Yan, Z.; Li, Y.; Wu, J.; Kuzyakov, Y. Comparing Carbon and Nitrogen Stocks in Paddy and Upland Soils: Accumulation, Stabilization Mechanisms, and Environmental Drivers. Geoderma 2021, 398, 115121. [Google Scholar] [CrossRef]
  65. Honda, S.; Ohkubo, S.; San, N.S.; Nakkasame, A.; Tomisawa, K.; Katsura, K.; Ookawa, T.; Nagano, A.J.; Adachi, S. Maintaining Higher Leaf Photosynthesis after Heading Stage Could Promote Biomass Accumulation in Rice. Sci. Rep. 2021, 11, 7579. [Google Scholar] [CrossRef]
Figure 1. Time course changes in plant height, soil and plant analysis development (SPAD), soil redox potential (Eh), water levels, solar radiation, air temperature, CH4, and N2O fluxes in each treatment. Error bars indicate the standard deviation (n = 3). Vertical dotted lines denote the application of chemical fertilizers or methanotroph-inoculated BDE. TD, top dressing.
Agronomy 14 01140 g001
Figure 2. Multiple comparison matrix of CH4 emission proportion among treatments (a) by one-way ANOVA (n = 3), difference in methanotroph strains (b) and ratio of Methylosinus-/methylocystis-inoculated BDE (c) by two-way ANOVA (n = 3). Red and blue values on the arrows indicate the larger (+) and lower (−) percentage difference in CH4 emissions between treatments, respectively. Significant codes: **, p < 0.01; *, p < 0.05; ns p > 0.05. MS, Methylosinus sp. MP Methylocystis.
Agronomy 14 01140 g002
Figure 3. The ratio of N2O emission versus total nitrogen input (N-N2O flux/N-TN) in each treatment. Significant difference by one-way ANOVA (n = 3). Different letters in each treatment indicate a significant difference at p = 0.05 by Tukey’s HSD test. Error bars indicate the standard deviation (n = 3).
Agronomy 14 01140 g003
Figure 4. pmoA transcript copy number in each treatment. Two-way ANOVA test indicates an insignificant difference at p = 0.05 by Tukey’s HSD test. The blue circles indicate the mean values (n = 9).
Agronomy 14 01140 g004
Figure 5. Scree plot (a) and principal component analysis (b) of variables of treatments. The selection of Dims was based on the Elbow of Scree plot, in which Dim1 and Dim2 are important for the explanation of the relationship among variables. The difference in arrow colors denotes the contributions of response variables in each Dim.
Agronomy 14 01140 g005
Figure 6. Corrplot of contribution percentage of variables in principle component analysis, in which two Dims were extracted to explain the relationship among variables (a), and Pearson correlation between explanatory variables versus CH4 and N2O emissions, GWP, and yGWP (b). Values in the plots (b) indicate Pearson correlation (r) with significant codes: ** p < 0.01, * p < 0.05. “−” indicates a negative relationship.
Agronomy 14 01140 g006
Table 1. Physicochemical characteristics of heated BDE used for the pot experiment.
ParametersUnitBDE Applied
FirstSecondThird
pH6.54 ± 0.136.79 ± 0.166.82 ± 0.23
ECmS cm−123.0 ± 0.0822.3 ± 0.1921.8 ± 0.08
TANmg N L−1172 ± 25.3165 ± 24.1152 ± 18.3
NO3mg N L−112.2 ± 2.2113.5 ± 1.3212.7 ± 1.17
NO2mg N L−17.60 ± 1.238.86 ± 1.767.93 ± 2.14
PO43−mg P L−184.3 ± 6.5678.2 ± 5.3272.5 ± 6.38
TOCmg C L−1333 ± 32.1326 ± 36.3316 ± 28.7
TNmg N L−1334 ± 16.2325 ± 22.4320 ± 17.9
Data are presented as average ± standard deviation (n = 3); “–” not applicable. The first, second, and third indicate the characteristics of BDE applied for rice on 10, 25, and 44 days after sowing, respectively.
Table 2. Application pattern of synthetic fertilizer, BDE, and methanotroph-inoculated BDE (MS1, MP1, MS2, and MP2) during the rice cultivation experiment.
TreatmentsTD1 (10 DAS)TD2 (25 DAS)TD3 (44 DAS)
N-P2O-K2O
(g m−2)
BDE
(L m−2)
N-P2O-K2O
(g m−2)
BDE
(L m−2)
N-P2O-K2O
(g m−2)
BDE
(L m−2)
SF3-1.3-07.0-1.3-3.05.0-1.3-3.0
BDE9.021.515.6
MS11.5-0.65-04.53.5-0.65-1.510.82.5-0.65-1.57.8
MP11.5-0.65-04.53.5-0.65-1.510.82.5-0.65-1.57.8
MS29.021.515.6
MP29.021.515.6
“–” not applied; TD, top dressing; DAS, days after sowing. SF; synthetic fertilizer; BDE, biogas digestive effluent; MS and MP are Methylosinus-/Methylocystis-inoculated BDE, respectively.
Table 3. Soil physicochemical characteristics of each treatment and cultivation stage.
ItemspH (2)EC (2)
(mS cm−1)
NH4+ (2)
(mg N kg−1)
NO3− (2)
(mg N kg−1)
TOC
(mg C kg−1)
AP (2)
(mg P kg−1)
CEC
(meq 100g−1)
Treatments (T)
SF5.17 ± 0.130.44 ± 0.21 b18.57 ± 5.130.76 ± 0.1741.98 ± 0.8930.14 ± 6.3915.64 ± 0.63
BDE5.18 ± 0.140.57 ± 0.23 a 20.73 ± 8.570.73 ± 0.2042.54 ± 1.3627.74 ± 4.9716.15 ± 0.87
MS15.15 ± 0.110.45 ± 0.18 b20.47 ± 7.530.75 ± 0.2141.79 ± 1.1527.93 ± 7.8916.11 ± 1.04
MP15.13 ± 0.130.51 ± 0.21 ab20.90 ± 7.820.72 ± 0.1241.81 ± 0.8829.03 ± 6.7015.83 ± 1.07
MS25.14 ± 0.070.60 ± 0.23 ab21.60 ± 8.230.70 ± 0.2942.33 ± 0.7827.34 ± 7.1316.09 ± 0.90
MP25.09 ± 0.090.54 ± 0.23 ab21.56 ± 7.010.74 ± 0.2042.34 ± 0.8328.80 ± 8.1416.09 ± 1.04
Stages (S)
0 DAS5.24 ± 0.13 a0.28 ± 0.05 d18.87 ± 3.42 b0.76 ± 0.15 ab41.55 ± 0.9328.17 ± 6.19 ab15.85 ± 0.86
25 DAS5.08 ± 0.06 b0.35 ± 0.03 cd17.96 ± 3.21 b0.73 ± 0.08 ab42.21 ± 1.3432.22 ± 7.19 a16.28 ± 1.02
39 DAS5.12 ± 0.07 b0.45 ± 0.11 c11.71 ± 1.92 c0.57 ± 0.21 b42.03 ± 0.8127.31 ± 5.60 ab15.82 ± 0.77
60 DAS5.19 ± 0.12 ab0.58 ± 0.15 b32.29 ± 4.66 a0.75 ± 0.07 ab42.15 ± 1.0229.28 ± 6.11 ab16.10 ± 0.99
67 DAS5.15 ± 0.10 ab0.68 ± 0.19 ab21.05 ± 4.43 b0.78 ± 0.32 a42.22 ± 0.9030.63 ± 6.93 a16.03 ± 1.15
80 DAS5.08 ± 0.12 b0.77 ± 0.20 a21.94 ± 5.76 b0.81 ± 0.18 a42.63 ± 0.8723.36 ± 6.24 b15.84 ± 0.78
p-value (1)
T0.20***0.290.960.190.790.58
S**********0.10**0.69
T × S0.990.540.770.930.990.280.88
(1) T, S, and T × S indicate p-values in treatments, rice growth stage, and interaction between T and S by two-way ANOVA, respectively (n = 3). ***, p < 0.001; **, p < 0.01; *, p < 0.05. (2) Different bold letters among rows in each factor indicate a significant difference at p < 0.05 by Tukey’s HSD test.
Table 4. DN and DOC of soil water solution (DNsw and DOCsw, respectively) of each treatment and rice cultivation stage.
ItemsDNsw (mg N L−1)DOCsw (mg C L−1) (2)
Treatments (T)
SF1.01 ± 0.889.26 ± 3.25 b
BDE1.42 ± 0.4822.15 ± 7.64 a
MS11.53 ± 0.9114.25 ± 5.36 ab
MP11.59 ± 0.8717.69 ± 13.29 ab
MS21.81 ± 0.7821.23 ± 12.27 a
MP21.71 ± 0.6921.80 ± 8.46 a
Stages (S)
39 DAS1.46 ± 0.8711.45 ± 4.36 b
60 DAS1.34 ± 0.5218.88 ± 8.99 a
67 DAS1.72 ± 0.9122.86 ± 11.52 a
p-value (1)
T0.32**
S0.32***
T × S0.270.16
(1) T, S, and T × S indicate p values in treatments, rice growth stage, and interaction between T and S by two-way ANOVA (n = 3), respectively. ***, p < 0.001; **, p < 0.01. (2) Different bold letters among rows indicate a significant difference at p < 0.05 by Tukey’s HSD test.
Table 5. The total GHG emissions, GWP, and yGWP in each treatment.
ItemsCH4 (3)
(g CH4 m−2)
N2O (3)
(mg N2O m−2)
GWP (3)
(g CO2-eq m−2)
yGWP (3)
(g CO2-eq g−1)
Treatments (T)
SF22.8 ± 1.4 b113 ± 17.7 a808 ± 55.0 b1.09 ± 0.10 b
BDE30.6 ± 1.8 a51.2 ± 40.8 ab1055 ± 73.4 a1.48 ± 0.12 a
MS124.0 ± 0.73 b50.7 ± 6.40 ab831 ± 26.2 b1.11 ± 0.07 b
MP121.3 ± 1.39 b10.6 ± 18.7 b727 ± 41.7 b0.99 ± 0.04 b
MS226.2 ± 3.72 ab60.5 ± 44.8 ab908 ± 119 ab1.27 ± 0.19 ab
MP225.2 ± 2.0 ab83.6 ± 23.1 ab883 ± 70.7 ab1.25 ± 0.09 ab
p-value (1)*******
Methanotrophs (M)
MS25.09 ± 2.6855.7 ± 29.2870 ± 88.01.19 ± 15.2
MP23.26 ± 2.6547.1 ± 44.2805 ± 1001.12 ± 0.16
Methanotroph-inoculated BDE rates (MR)
50% BDE22.64 ± 1.79 b30.7 ± 25.4 b779 ± 65.2 b1.05 ± 0.08 b
100% BDE25.71 ± 2.72 a72.1 ± 34.3 a896 ± 88.6 a1.26 ± 0.13 a
p-value (2)
M0.200.600.160.33
MR****
M × MR0.510.080.380.43
GWP, global warming potential; yGWP, yield-scaled GWP. (1) Significant difference by one-way ANOVA (n = 3). **, p < 0.01; *, p < 0.05. (2) M, MR and M × MR indicate p-values in methanotrophs, the ratio of methanotroph-inoculated BDE application and interaction between M and MR by two-way ANOVA, respectively (n = 3). *, p < 0.05. (3) Different bold letters among rows in each factor indicate a significant difference at p = 0.05 by Tukey’s HSD test.
Table 6. Factors indicating rice growth in each treatment.
TreatmentsPanicle
(panicle m−2)
Panicle Length
(cm)
Grain Yield
(g m−2)
AG Biomass
(g m−2)
Weight of 1000 Grains
(g m−2)
Harvest Index
SF573 ± 6.9320.5 ± 0.30740 ± 21.11718 ± 49.2 ab24.0 ± 0.260.43 ± 0.02
BDE555 ± 13.419.4 ± 0.61713 ± 24.81534 ± 114 b23.8 ± 0.330.47 ± 0.02
MS1565 ± 25.020.6 ± 1.04749 ± 24.51657 ± 117 ab24.1 ± 0.300.47 ± 0.04
MP1570 ± 23.320.4 ± 1.00733 ± 13.01750 ± 37.9 a24.2 ± 0.210.42 ± 0.01
MS2566 ± 18.920.0 ± 0.75718 ± 26.81530 ± 45.2 b24.2 ± 0.010.47 ± 0.01
MP2560 ± 22.820.0 ± 0.61704 ± 15.41525 ± 39.1 b24.3 ± 0.110.46 ± 0.01
p-value0.870.5280.171**0.197
AG, above-ground biomass. Significant difference by one-way ANOVA (n = 3): **, p < 0.01; † p < 0.1. Different bold letters between rows in each factor indicate a significant difference at p = 0.05 by Tukey’s HSD test.
Disclaimer/Publisher’s Note: The statements, opinions and data contained in all publications are solely those of the individual author(s) and contributor(s) and not of MDPI and/or the editor(s). MDPI and/or the editor(s) disclaim responsibility for any injury to people or property resulting from any ideas, methods, instructions or products referred to in the content.

