Article

Analysis of Microbial Diversity in Rhizosphere Soil of Panax notoginseng under Different Water and Microbial Fertilizer Conditions

1
Faculty of Modern Agricultural Engineering, Kunming University of Science and Technology, Kunming 650500, China
2
Seasonal Arid Region, Water-Soil-Crop System Observation and Research Station of Yunnan Province, Kunming University of Science and Technology, Kunming 650500, China
3
Yunnan Provincial Key Laboratory of High-Efficiency Water Use and Green Production of Characteristic Crops in Universities, Kunming University of Science and Technology, Kunming 650500, China
4
Faculty of Life Science and Technology, Kunming University of Science and Technology, Kunming 650500, China
5
Yunnan Technology Innovation Center of Phosphorus Resource, Kunming 650500, China
*
Authors to whom correspondence should be addressed.
These authors contributed equally to this work.
Agronomy 2024, 14(5), 922; https://doi.org/10.3390/agronomy14050922
Submission received: 25 March 2024 / Revised: 25 April 2024 / Accepted: 25 April 2024 / Published: 27 April 2024
(This article belongs to the Section Soil and Plant Nutrition)

Abstract

:
Panax notoginseng is a highly regarded medicinal plant that has obstacles associated with continuous cropping. Understanding soil microorganisms is crucial, as they play a major role in this regard. However, soil microorganisms are affected by multiple factors; therefore, we need to conduct more in-depth research. This study investigated the combined effects of irrigation and microbial fertilizer treatments (J1F1, J1F2, J2F1, J2F2, J3F1, J3F2, and CK) on the diversity of bacterial and fungal microbial communities in the rhizosphere of Panax notoginseng. The bacterial 16S rRNA genes and fungal internal transcribed spacer (ITS) sequences were sequenced using Illumina HiSeq. The results showed that, without microbial fertilizer (CK), the microbial community abundance and diversity were significantly lower than in the other treatments; moreover, among the microbial fertilizer treatments, the microbial abundance in F1 was higher than that in F2. Under the same microbial fertilizer application, the incidence rate of Panax notoginseng root rot was J2 > J1 > J3, and the yield of Panax notoginseng was J3 > J2 > J1. Under the same irrigation conditions, the incidence rate of Panax notoginseng root rot was F1 > F2, and the yield of Panax notoginseng was F2 > F1. This study provides important guidance for Panax notoginseng plant microbiota and sustainable agriculture.

1. Introduction

Soil is a key component of the earth system, which regulates hydrological processes, supports terrestrial ecosystems, and affects biological activities and biogeochemical cycles. Soil microorganisms play a considerable role in soil self-purification, transformation of toxic compounds and the soil environment, and the cycle of the biogeochemical systems [1,2]. The rhizosphere is an area with strong microbial activity in the soil. As compared with the surrounding loose soil, the rhizosphere contains special microbial communities, and it is also the focus of the study of plant stress responses [3,4]. In the process of plant growth, the roots of plants growing in the soil can secrete a variety of chemicals and nutrients, and various microorganisms, such as bacteria, fungi, algae, and protozoa, can be attracted by these substances [5]. These rhizosphere microorganisms directly or indirectly affect the composition and productivity of natural plant communities, while plants stimulate the surrounding soil to form a unique rhizosphere microbiota [6,7,8]. However, there are still elusive questions about how soil microbial diversity specifically affects aboveground plant growth.
Panax notoginseng is mainly produced in Yunnan, Guangxi, and other places in China, of which Yunnan accounts for a large part of the national planting area. Panax notoginseng is a highly respected medicinal herb, which has the effect of dispelling blood stasis, relieving bleeding, detumescence, pain relief, and plays a significant role in the prevention and treatment of cardio-cerebrovascular diseases [9,10,11]. However, Panax notoginseng is very picky about its growth environment, averse not only to cold and heat but also to water; it is most suitable to be grown in loose red or brown–red acidic soil and other places, and it likes warm, shady, and wet environments [12]. With the understanding of Panax notoginseng, the market demand for Panax notoginseng is increasing, and the planting area of Panax notoginseng is also expanding, so obstacles associated with continuous cropping and root rot diseases have become increasingly prominent, limiting the development of the Panax notoginseng industry [13]. Although there are many issues associated with continuous cropping, the most fundamental ones include promoting an imbalance in soil microbiota and diversity, a reduction in beneficial microorganisms, and an enrichment of pathogenic microorganisms and various soil-borne plant diseases [12].
The rhizosphere microbiota is a key environmental factor affecting plant health and fitness [9], and soil moisture is a crucial factor affecting Panax notoginseng’s rhizosphere soil microbiota environments [14]. Irrigation is a pivotal driver in the regulation of soil moisture, and during Panax notoginseng’s growth, unreasonable irrigation will necessarily cause significant abnormal soil moisture changes in the rhizosphere, leading to changes in the soil microbial environment in the rhizosphere [15,16,17]. Previous studies [18,19] have shown that soil microbial diversity showed a pattern of first increasing and then decreasing with the increase in the amount of irrigation water. Soil microbial community abundance was also sensitive to the irrigation amount, where increased irrigation resulted in a decline in the species and proportion of δ-amoebae and an increase in the proportion of α-amoebae [20]. In addition, microbial fertilizer application is also a commonly used way to improve the rhizosphere micro-ecological environment of Panax notoginseng [21]. Microbial fertilizer refers to soil fertilizers containing a variety of useful microorganisms, through life activities and growth metabolites to adjust the plant growth environment, improve nutritional conditions, stimulate plant growth and development, and resist the harm of diseases and insect pests to accelerate the transformation of soil nutrients, improve the status of soil nutrients, and improve the yield and quality of corresponding agricultural products [10].
Different plant species, soil types, growth stages, and agricultural treatments will result in different root microbial community structures [22,23,24]. Therefore, the composition and structure of microorganisms in Panax notoginseng planting soil are diverse and complex. Deciphering plant microflora is essential for identifying microorganisms that can be used to improve plant growth and health. While examining a particular factor combination may provide mechanistic insights, we propose that it is also useful to ask how soil microorganisms might alter when exposed to two factors. In this study, we hypothesized that irrigation and application of microbial fertilizers could improve the structure of the soil microbial community in the Panax notoginseng rhizosphere. Therefore, we changed the irrigation and microbial fertilization conditions and assessed their effects on soil bacterial and fungal microbial communities.

2. Materials and Methods

2.1. Soil Sample Collection

Seven soil samples were collected from the Panax notoginseng planting base in Wenshan Prefecture, Yunnan Province, in November 2018. The abbreviation J represents different irrigation treatments, while the abbreviation F represents different microbial fertilizer treatments. Microbial fertilizer was purchased from Shandong Hanbang Bio-technology Co., Ltd. (Qingzhou, China)—specifically, the Wolipu Positive Energy Fruit Love Series Compound Microbial Fertilizer, composed of a variety of beneficial microorganisms and organic matter composites. Seven disparate treatments were carried out in J1F1, J1F2, J2F1, J2F2, J3F1, J3F2, and CK (Table 1). The soil sampling locations were selected by a five-point sampling method. In each treatment, five healthy Panax notoginseng plants were randomly dug up with their roots, and the surrounding soil was retained. We carefully chose the soil near the roots as the rhizosphere soil, and we thoroughly mixed the rhizosphere soil of the five Panax notoginseng plants in the same treatment as a composite soil sample.

2.2. Illumina HiSeq Sequencing

The study of microbial diversity is mainly carried out in the conserved region of the nucleic acid sequence encoding ribosomal RNA. Microbial diversity is determined based on the Illumina HiSeq platform, using the method of paired-end sequencing to construct a small fragment library for sequencing. After quality evaluation of raw sequence libraries, a pyrosequencing-based analysis was performed to detect the bacterial 16s rRNA gene regions and the fungal ITS (internal transcribed spacer) regions through read splicing and filtering, OTU (operational taxonomic unit) clustering, species annotation, and abundance analysis, revealing the species composition of the samples can be revealed; further, alpha diversity, beta diversity, and significant species difference analysis were used to mine the differences between the seven samples.

2.2.1. OTU Analysis

UCLUST [13] in QIIME [14] (version1.8.0) software was used to cluster tags at a 97% similarity level to obtain OTUs, and taxonomic annotation of OTUs was carried out based on the Silva (bacteria) and UNITE (fungus) taxonomic databases. The species richness tables at different classification levels were generated by QIIME software, and then the community structure map of the samples at different taxonomic levels was drawn by the R language tool.

2.2.2. Alpha and Beta Diversity Analysis

Mothur (version v.1.30) software was used to evaluate the alpha diversity index of the samples. To compare the multiplicity index between samples, the number of sequences contained in the samples was standardized in the analysis. Beta diversity analysis was carried out by using QIIME software to compare the similarity of species diversity among different samples.

3. Results

3.1. Bacteria

3.1.1. Bacterial OTU Analysis

We obtained 355,579 effective sequences (Table S1) and 1781 operational taxonomic units (OTUs) affiliated with 16s rRNA gene regions. At the level of 97% similarity, the number of OTUs of each sample was acquired [15]. For bacteria, the number of OTUs of each sample was diverse; the smallest number of OTUs was CK, with 481, while J1F2 ranked second-last, with 1029. The largest number of OTUs was J2F1 (1364), and there was no significant deviation between the other four treatments (about 1200). In general, the difference between CK and the other six treatments was obvious, and the number of OTUs in the other treatments was more than twice that in CK (Figure 1A and Table 2); under the same irrigation levels, the number of bacterial OTUs in the microbial fertilizer treatments was F1 > F2.
A Venn [16] diagram was used to represent the numbers of common and unique OTUs among the samples. Combined with the species represented by OTUs, we could observe the common microbes in different treatments. In the Venn diagram (Figure 1B), we can see that the number of common overlapped OTUs for the seven treatments was 138, and the number of independent OTUs for each treatment was 57, 11, 18, 16, 3, 13, and 26 (CK, J1F1, J1F2, J2F1, J2F2, J3F1, and J3F2, respectively). Among the treatments, CK had the greatest number of independent OTUs, indicating that CK differed the most from the other treatments. Conversely, the minimum number of OTUs indicated that this treatment had the highest similarity with other treatments, while there were only three in J2F2.

3.1.2. Bacterial Alpha Diversity Analysis

Alpha diversity is a ubiquitous approach to analyzing community surveys, with metrics summarizing the structure of an ecological community concerning its richness, evenness, or both [17]. It reflects a single sample’s species richness diversity and has a variety of metrics as indicators: Chao1, ACE, Shannon, and Simpson.
The ACE and Chao1 indices reflect the microbial community richness, and these two indices were larger, indicating that the microbial communities were richer [18]. The value of both indices for J2F1 was over 1400, the highest of all treatments, which indicated that J2F1 had the most species in its bacterial community. The number of species of J1F1 was the second-highest (about 1300), there was no evident disparity between J2F2 and J3F1, and the number of species in J3F2 and J1F2 was lower in the microbial fertilizer treatments. Under the same irrigation levels, the bacterial community richness of the microbial fertilizer treatments was F1 > F2. The bacterial richness of CK was the lowest among all treatments—less than 50% (Table 2).
The Simpson and Shannon indices reflect the degree of species diversity, and they are inversely related [18]. J1F1 had the lowest Simpson index and the highest Shannon index, indicating the highest community diversity under this treatment. J2F2’s community diversity was second only to that of J1F1, and J3F1 ranked third, with the Shannon index above 6 in all three treatments. Secondly, the Shannon index of J3F2, J2F1, and J1F2 ranged from 5 to 6. However, the Simpson index of CK was 0.0635, which was much higher than in the other treatments, and the Shannon index of CK was 4.1825, which was much lower than in the other treatments; this shows that the community diversity of CK was also extremely low. Moreover, statistics show that the higher the value of OTU coverage, the higher the probability of species being detected in the sample, while the lower the probability of not being detected (Table 2).

3.1.3. Bacterial Beta Analysis

Beta diversity, here defined as community compositional changes among sites within a defined geographical area of interest, has been widely used to understand the ecological processes determining biodiversity patterns across spatial scales [10]. Principal component analysis (PCA) [19] is usually chosen for the analysis, which uses variance decomposition to reflect the differences between multiple treatments of data on two-dimensional coordinate graphs, and the coordinate axis takes two eigenvalues that can best reflect the variance.
For the percentage of bacterial variation (Table S2), PC1 was 57.11%, PC2 was 20.23%, and PC3 was 11.27%.
In PC1 vs. PC2, the red dot (CK) and gray dot (J2F1) were farthest from the origin and farther away from each other. The distance between the orange point (J1F2) and other points was the third-greatest. J1F1, J2F2, J3F1, and J3F2 were close to each other (Figure 2A). In PC1 vs. PC3, it was evident that CK existed independently in the fourth quadrant, farthest from the origin. The distance ranked second was J1F2, and the distance ranked third was J2F1, while the other four treatments were closer (Figure 2B). In PC2 vs. PC3, J2F1 was the farthest dot from the other treatments. CK and J1F2 were also far away. The remaining four treatments were similar to the first two figures (Figure 2C). We found that the CK, J1F2, and J2F1 treatments were far apart from the other four treatments, and the distance between these three treatments themselves was very long, indicating that the bacterial composition of the three treatments was greatly different. The closer the distance between two samples, the more similar the composition of those two samples. J1F1, J2F2, J3F1, and J3F2 are all near to each other in the figure, indicating that the bacterial composition of the four experimental treatments was similar (Figure 2).

3.1.4. Bacterial Community Composition

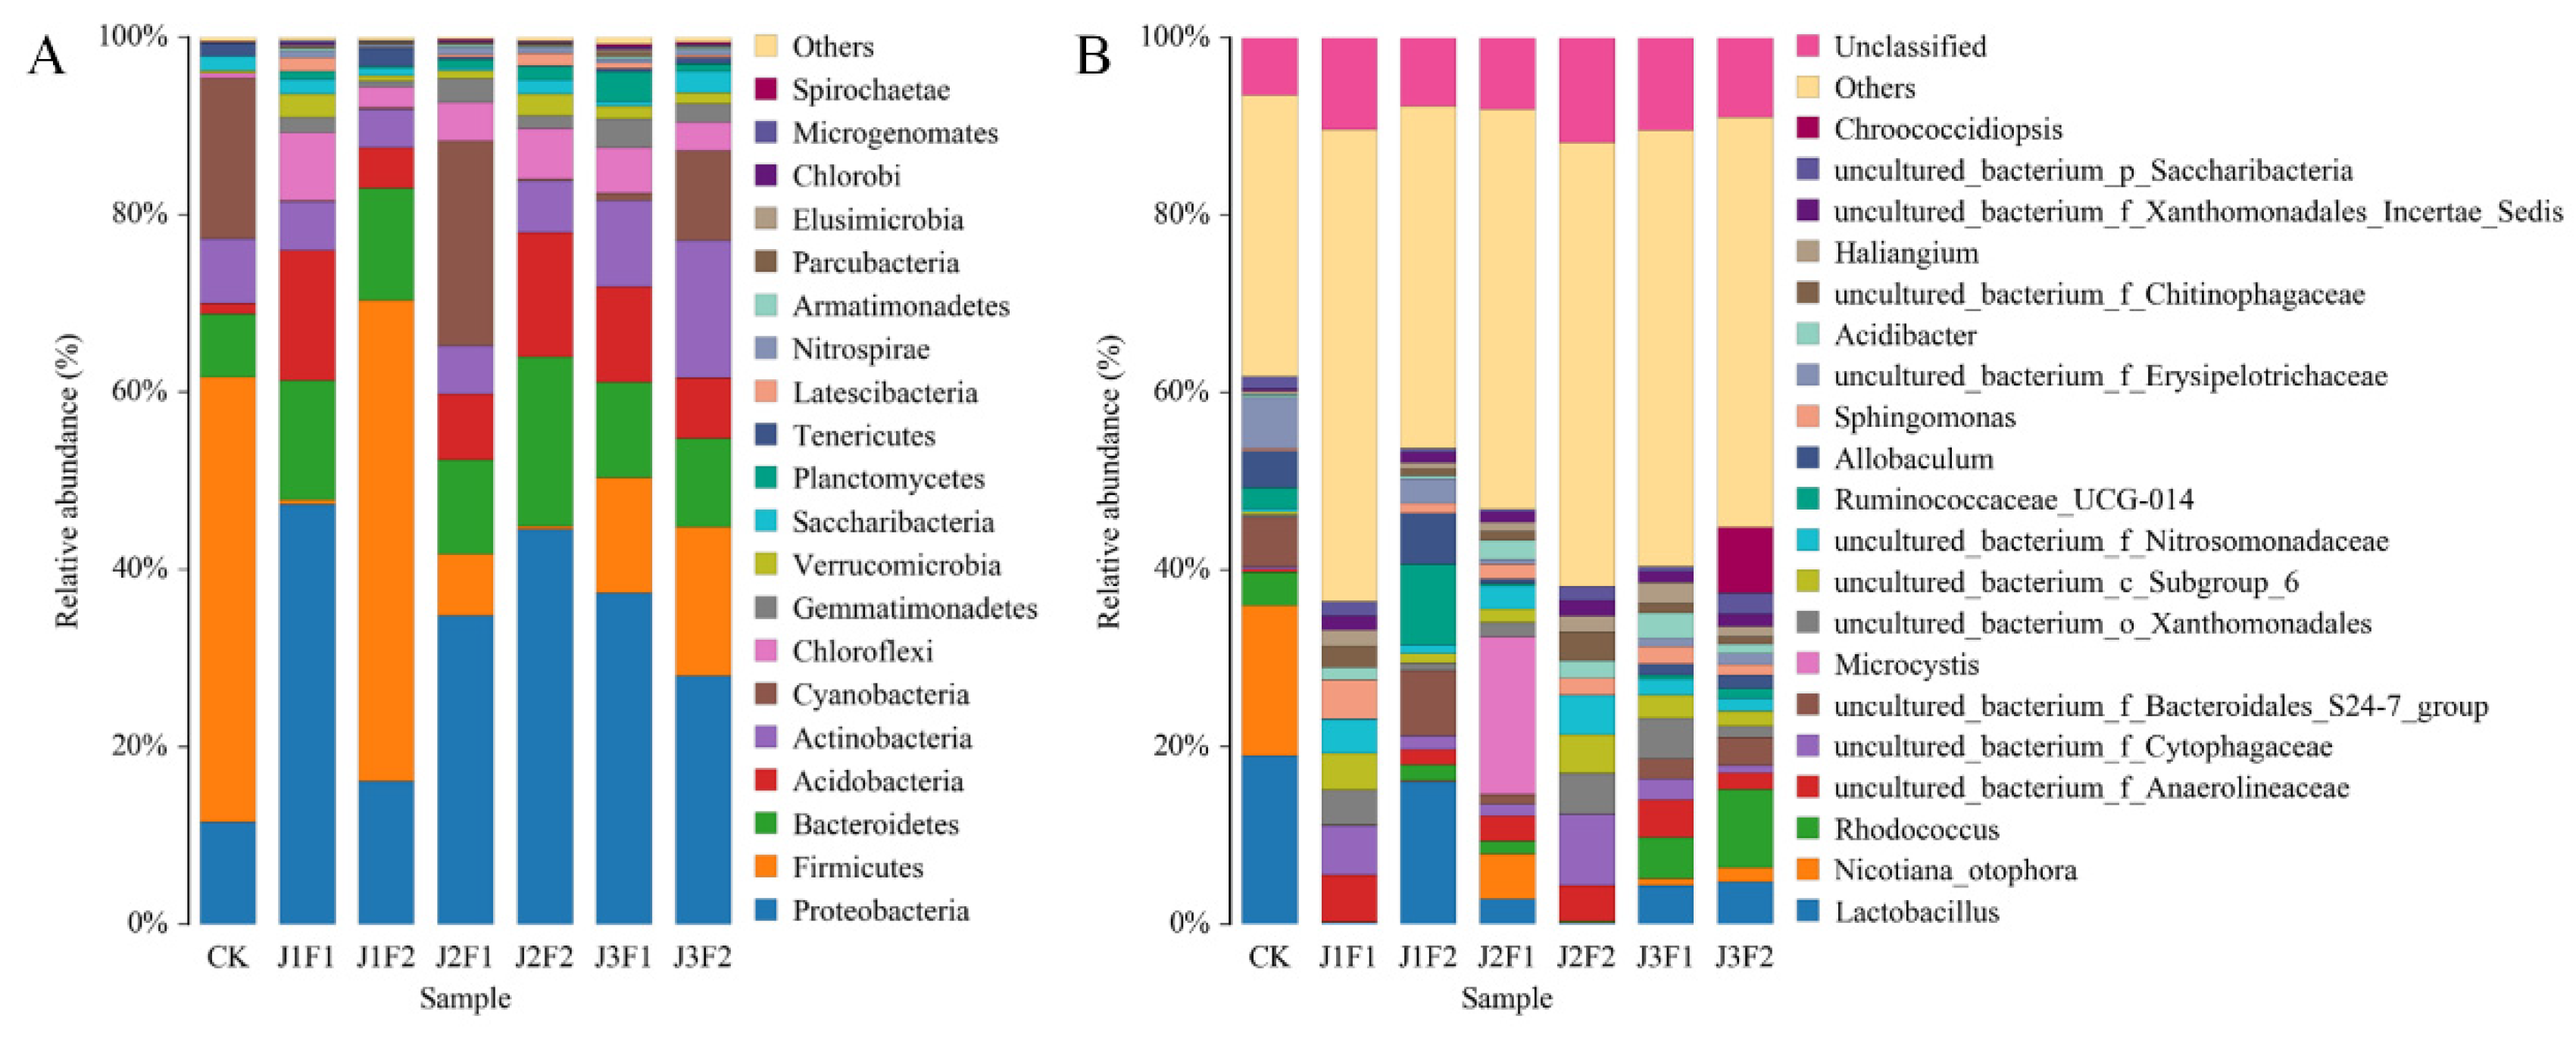
To further analyze the bacterial microbial community structure of the seven sample treatments, the abundance distribution of each sample at the phylum and genus levels was developed.
At the phylum level, Proteobacteria, Firmicutes, Bacteroidetes, Acidobacteria, Actinobacteria, Cyanobacteria, Chloroflexi, Gemmatimonadetes, Verrucomicrobia, Saccharibacteria, and Planctomycetes were the dominant phyla, with over 1% abundance in the soil samples (Table S3a). Firmicutes accounted for more than 50% of CK, followed by Cyanobacteria (18%) and Proteobacteria (11%). Similarly, the highest percentage in J1F2 was Firmicutes, with 54%, followed by Proteobacteria (16%) and Bacteroidetes (12%). However, the abundance of each phylum in the remaining five treatments was different from the two treatments mentioned earlier. Proteobacteria was the most abundant phylum in these five treatments: J1F1 (47%), J2F1 (34%), J2F2 (44%), J3F1 (37%), and J3F2 (27%). Firmicutes accounted for less than 0.5% of J1F1 and J2F2, 6% of J2F1, 13% of J3F1, and 16% of J3F2. Bacteroidetes accounted for an average of about 7–19% in the seven treatments and slightly less in CK. In addition to their high proportion in CK, Cyanobacteria were up to 23% in J2F1, 10% in J3F2, and less than 1% in the remaining four treatments. Acidobacteria were greater than 10% in the J1F1, J2F2, and J3F1 treatments, with 14%, 14%, and 10%, respectively. Actinobacteria were particularly abundant in J3F2 (15%), and among the seven sample treatments, J1F1 was most similar to J2F2, while CK and J1F2 differed most from the other treatments in composition (Figure 3A). The results showed that there was a competitive effect between Firmicutes and Proteobacteria in the CK, J1, and J2 treatments—where one of them was significantly higher, the other would be lower—while J3 made the competition between the two weaker. Compared to CK, the application of microbial fertilizers contributed to a significant increase in Proteobacteria, Acidobacteria, Chloroflexi, Gemmatimonadetes, and Verrucomicrobia. For Actinobacteria, the J1 and J2 treatments decreased their relative abundance, while J3 significantly increased the Actinobacteria abundance. For Cyanobacteria, J2F2 increased their abundance, which was much lower than CK in the other treatments.
The top 20 dominant bacterial genera (Table S3b) were Lactobacillus, Nicotiana_otophora, Rhodococcus, Anaerolineaceae, Cytophagaceae, Bacteroidales_S247_treatment, Microcystis, Xanthomonadales, Subtreatment_6, Nitrosomonadaceae, Ruminococcaceae_UCG-014, Allobaculum, Sphingomonas, Erysipelotrichaceae, Acidibacter, Chitinophagaceae, Haliangium, Xanthomonadales_Incertae_Sedis, Saccharibacteria, and Chroococcidiopsis. Unclassified and others accounted for the largest proportion in each treatment, with 38% in CK being the lowest, 46% in J1F2, and 53% to 63% in the other five treatments. Lactobacillus ranked first in CK and J1F2 (19% and 16%, respectively), while it accounted for 4% in the J3 treatment, 2% in the J2F1 treatment, and less than 0.2% in the other two treatments. More than 5% of the genera in CK were Nicotiana_otophora (16%), Bacteroidales_S247_treatment (5%), and Erysipelotrichaceae (5%). The abundance of genera varied greatly among treatments, with Anaerolineaceae and Cytophagaceae accounting for about 5% in J1F1, Ruminococcaceae_UCG-014 and Bacteroidales_S247_treatment accounting for more than 7% in J2F1, Cytophagaceae accounting for 8% in J2F2, and Rhodococcus accounting for 8% in J3F2. Notably, Microcystis accounted for 17% in J2F1, and Chroococcidiopsis for 7% in J3F2, while both genera were almost 0% in the other treatments. We concluded that the genera were more evenly distributed than in the other CK treatments. Among the seven sample treatments, J1F1 and J2F2 were the most similar, while CK and J1F2 were the most different from the other treatments (Figure 3B).

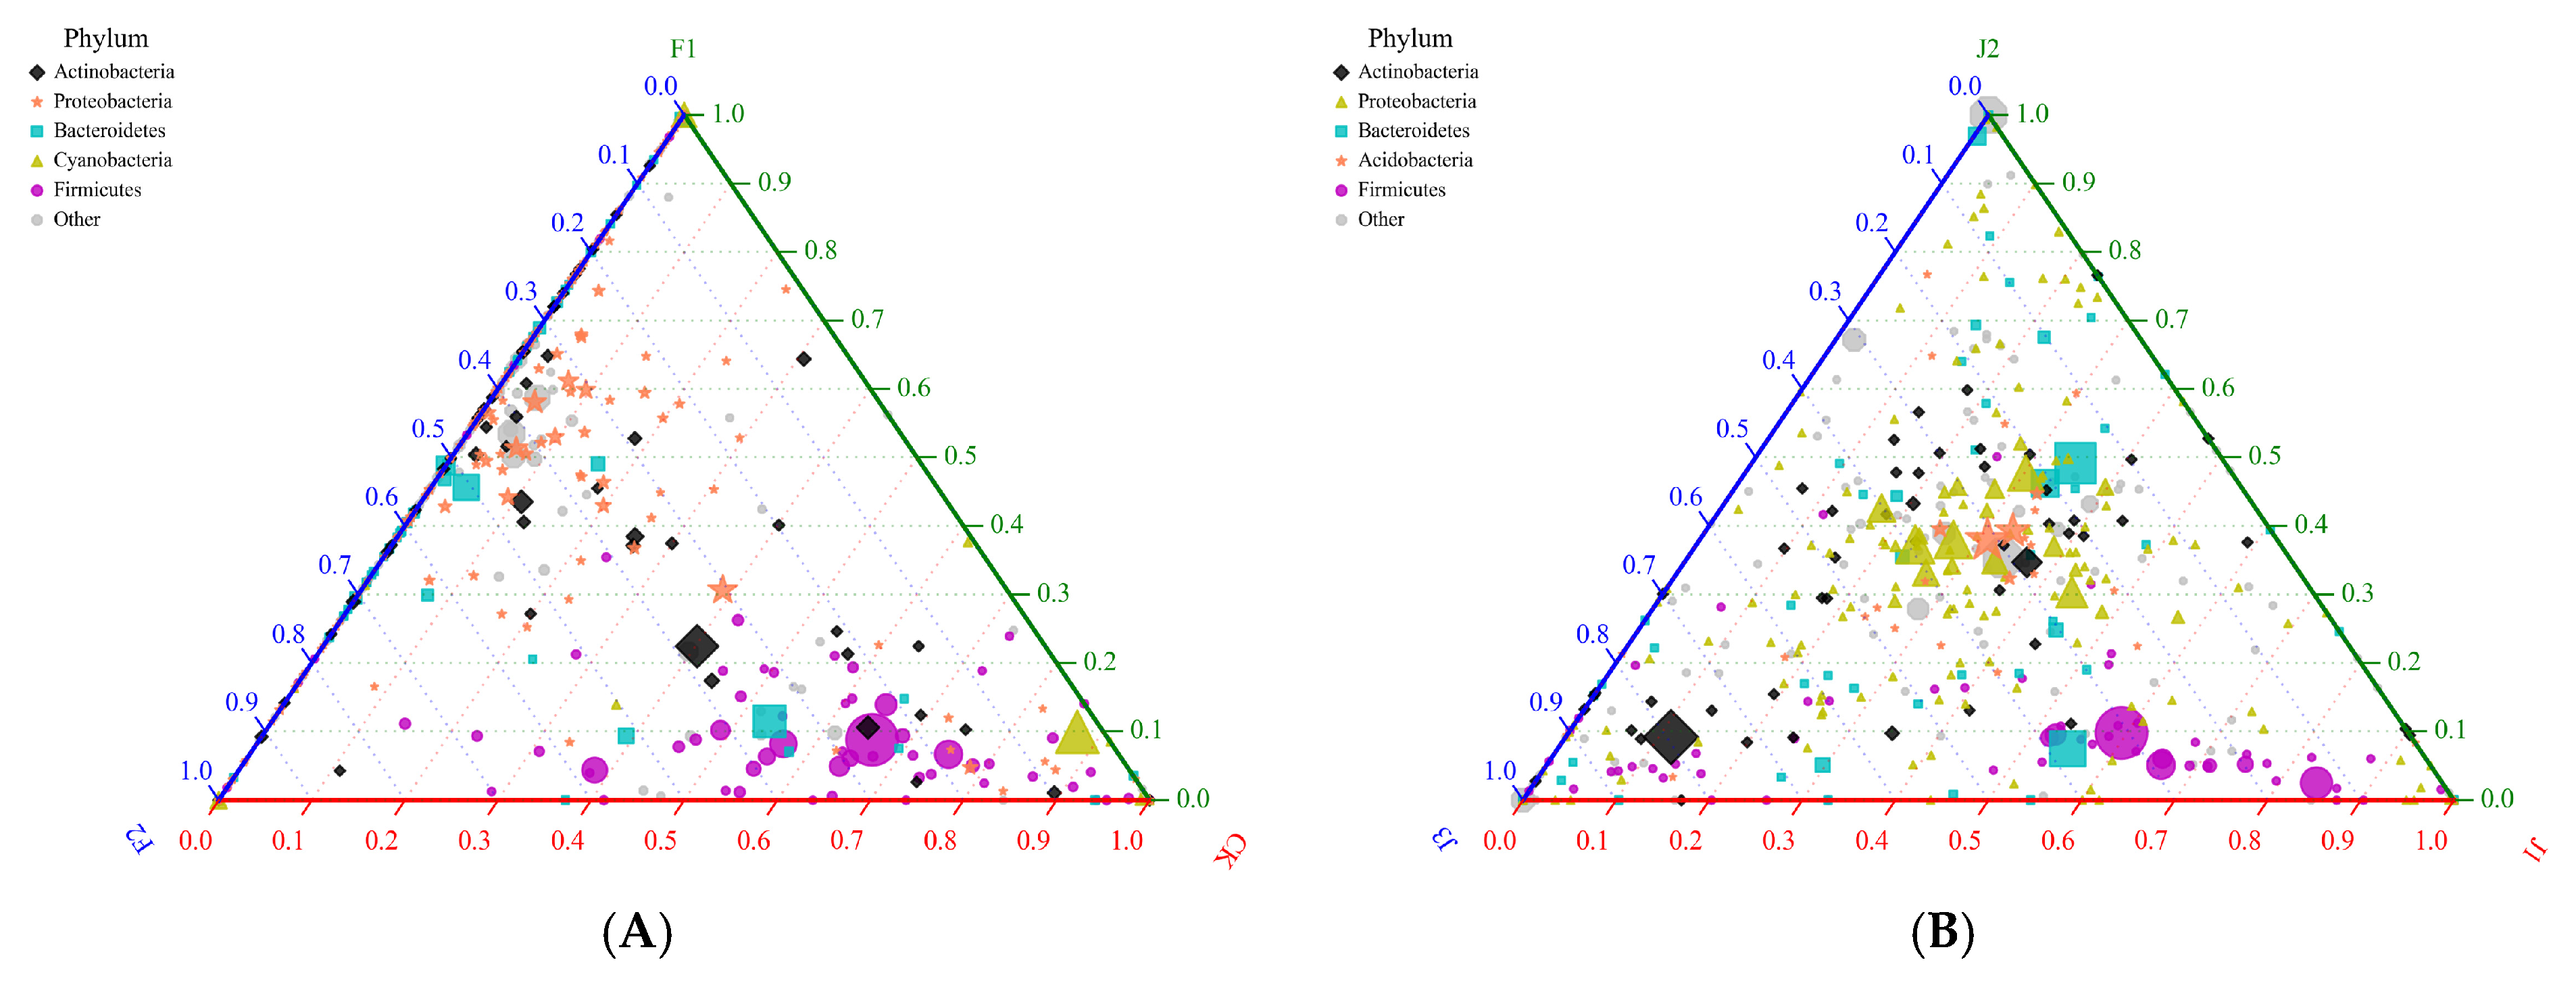
3.1.5. Bacterial Ternary Diagram

Although the ternary diagram is a three-dimensional plot, it is usually presented in a two-dimensional form for ease of drawing and interpretation [20]. The diagram is an equilateral triangle to describe the ratio relationships of different attributes of three variables. In the analysis, the species composition of three or more sample treatments can be compared and analyzed according to the species classification information. The proportions and relationships of different species in the sample can be shown directly through the triangle diagram.
Under different microbial fertilizer treatments, the proportion of Proteobacteria without microbial fertilizer (CK) was very small (<10%), and the value was similar in the F1 and F2 treatments (40–50%), with many points in this interval. Firmicutes have the largest area in the figure; without microbial fertilizer (CK), the content of bacteria was very high (60–80%). At the same time, it was concentrated in the range of 20–40% in F1 and 0–20% in F2. There are fewer Cytophagaceae in the figure, but it is clear that there is a point where the content of CK accounts for 90% (Figure 4A and Table S4). Under different irrigation treatments, J1 and J2 were more abundant than J2 and J3. The proportions of Proteobacteria and Acidobacteria were similar under three different water treatments, and the figures were located in the middle of the triangle, but the number of Proteobacteria was much greater than that of Acidobacteria. Firmicutes in the J1 treatment were very high (60–90%), and the ratio in the J2 treatment was slightly lower than that in the J3 treatment. The percentage of Actinobacteria in J3 was as high as 80%, and the proportions in the other two treatments were very low (Figure 4B and Table S5).

3.2. Fungi

3.2.1. Fungal OTU Analysis

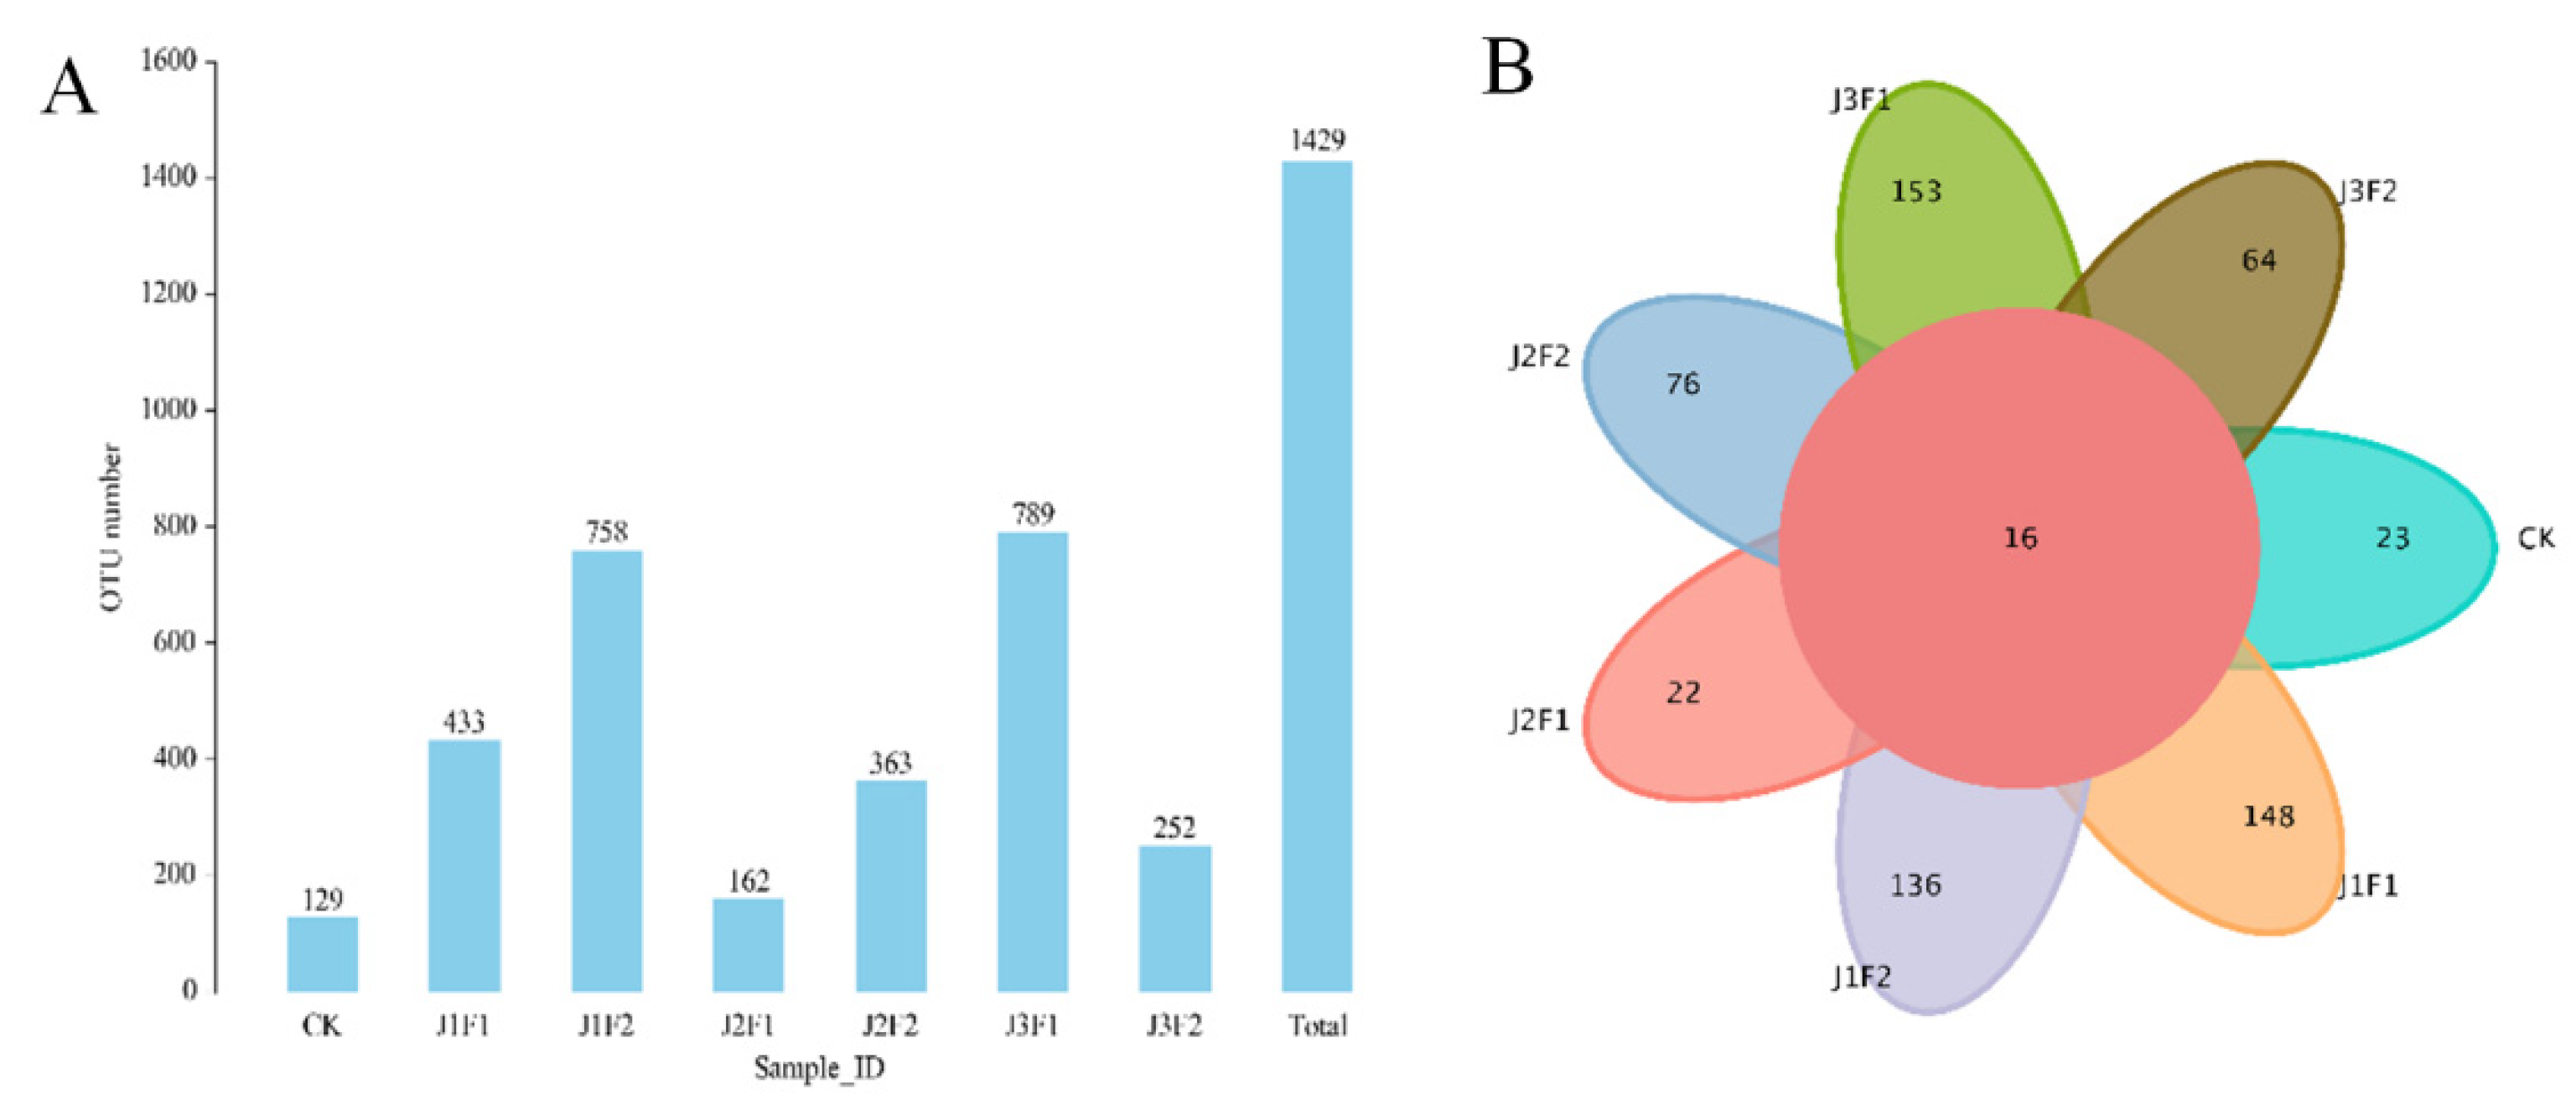
A total of 479,493 valid fungal sequences were obtained from the seven samples (Table S6), and the total number of OTUs obtained for fungi was 1429. The number of fungal OTUs in J3F1 and J1F2 was 789 and 758, respectively, making them significantly different from the other treatments. J1F1 (433), J2F2 (363), and J3F2 (252) ranked third to fifth, respectively, and their number of OTUs was significantly different from the other treatments. The lowest number of OTUs was in CK, with 129, while J2F1 ranked second-last, with 162; this indicates that these treatments contained the fewest fungal species among all treatments (Figure 5A), showing that the application of microbial fertilizers increased the number of fungal OTUs to varying degrees. Under different amounts of microbial fertilizer application, the number of fungal OTUs in F1 was smaller than that in F2, except for alternate irrigation (J3), showing that alternate irrigation changed the action of microbial fertilizers on soil fungi.
In the Venn diagram, we can observe that the number of common overlapped OTUs for the seven treatments was 16, indicating that the number of overlapping fungi in each treatment was less and the species of each treatment were more different. The maximum number of independent OTUs, found in the J3F1 treatment, was 153, while the number of independent OTUs in J1F1 and J1F2 was 148 and 136, respectively. The smallest numbers of independent OTUs were for J2F1 and CK, with only 22 and 23, respectively. The number of independent OTUs in each part of the Venn diagram was positively correlated with the total number of OTUs (Figure 5). In conclusion, for the different irrigation treatments, the trend in the number of fungal OTUs was J1 > J3 > J2.

3.2.2. Fungal Alpha Diversity Analysis

For fungi, the alpha diversity significantly differed from that of bacteria. In the light of the ACE and Chao1 indices, the J3F1 and J1F2 treatments had much higher numbers of fungal species (all more than 750) compared to the other treatments. J1F1, J2F2, and J3F2 ranked third, fourth, and fifth, respectively, with their numbers of species in the middle. Meanwhile, the ACE index of J2F1 (194.7184) was the lowest, and the Chao1 index of CK (175.4286) was the lowest, indicating that the species richness of CK and J2F1 was much lower than that of the other treatments (Table 3).
For the Simpson and Shannon indices, the Shannon values of J3F1 and J1F2 were both more than 5.7, and these two treatments had the highest community diversity (Table 3). J2F2, J1F1, J3F2 were in the middle section, with values ranging from 4 to 5. In particular, the Simpson value of J2F1 was about 30 times higher than that of J3F1, and the community diversity of J2F1 was the lowest. The community diversity of CK was slightly higher than that of J2F1. We deduced that the fungal community diversity at 37.5% irrigation (J2) was the lowest. Nevertheless, there was no observable rule for different fertilization (F) treatments, and the alpha diversity of fungi might have been more dependent on the combined effect of water and fertilizer.

3.2.3. Fungal Beta Analysis

For the percentage of fungal variation (Table S7), PC1 was 73.91%, PC2 was 22.55%, and PC3 was 1.83%.
In PC1 vs. PC2, the distance between J3F2 and other points was the farthest, and the distance between J1F1 and other treatments was the second-farthest. In addition to these two treatments, the other five treatments were very close (Figure 6A). In PC1 vs. PC3, it was evident that J3F2 remained independently on the far-right side of the graph, farthest from the origin. The distance ranked second was J2F1, and third was CK, while the remaining four treatments, although not far away, were dispersed (Figure 6B). In PC2 vs. PC3, J1F1 was the farthest point from the other treatments; CK and J2F1 were also far away. The remaining four treatments were close to the origin, but also in different directions (Figure 6C). Combining the three graphs, the composition of the purple point (J3F2) was the most different, and J1F1 was also significantly different. The fungal compositions of the seven treatments were very similar, and each treatment had its own independent composition.

3.2.4. Fungal Community Composition

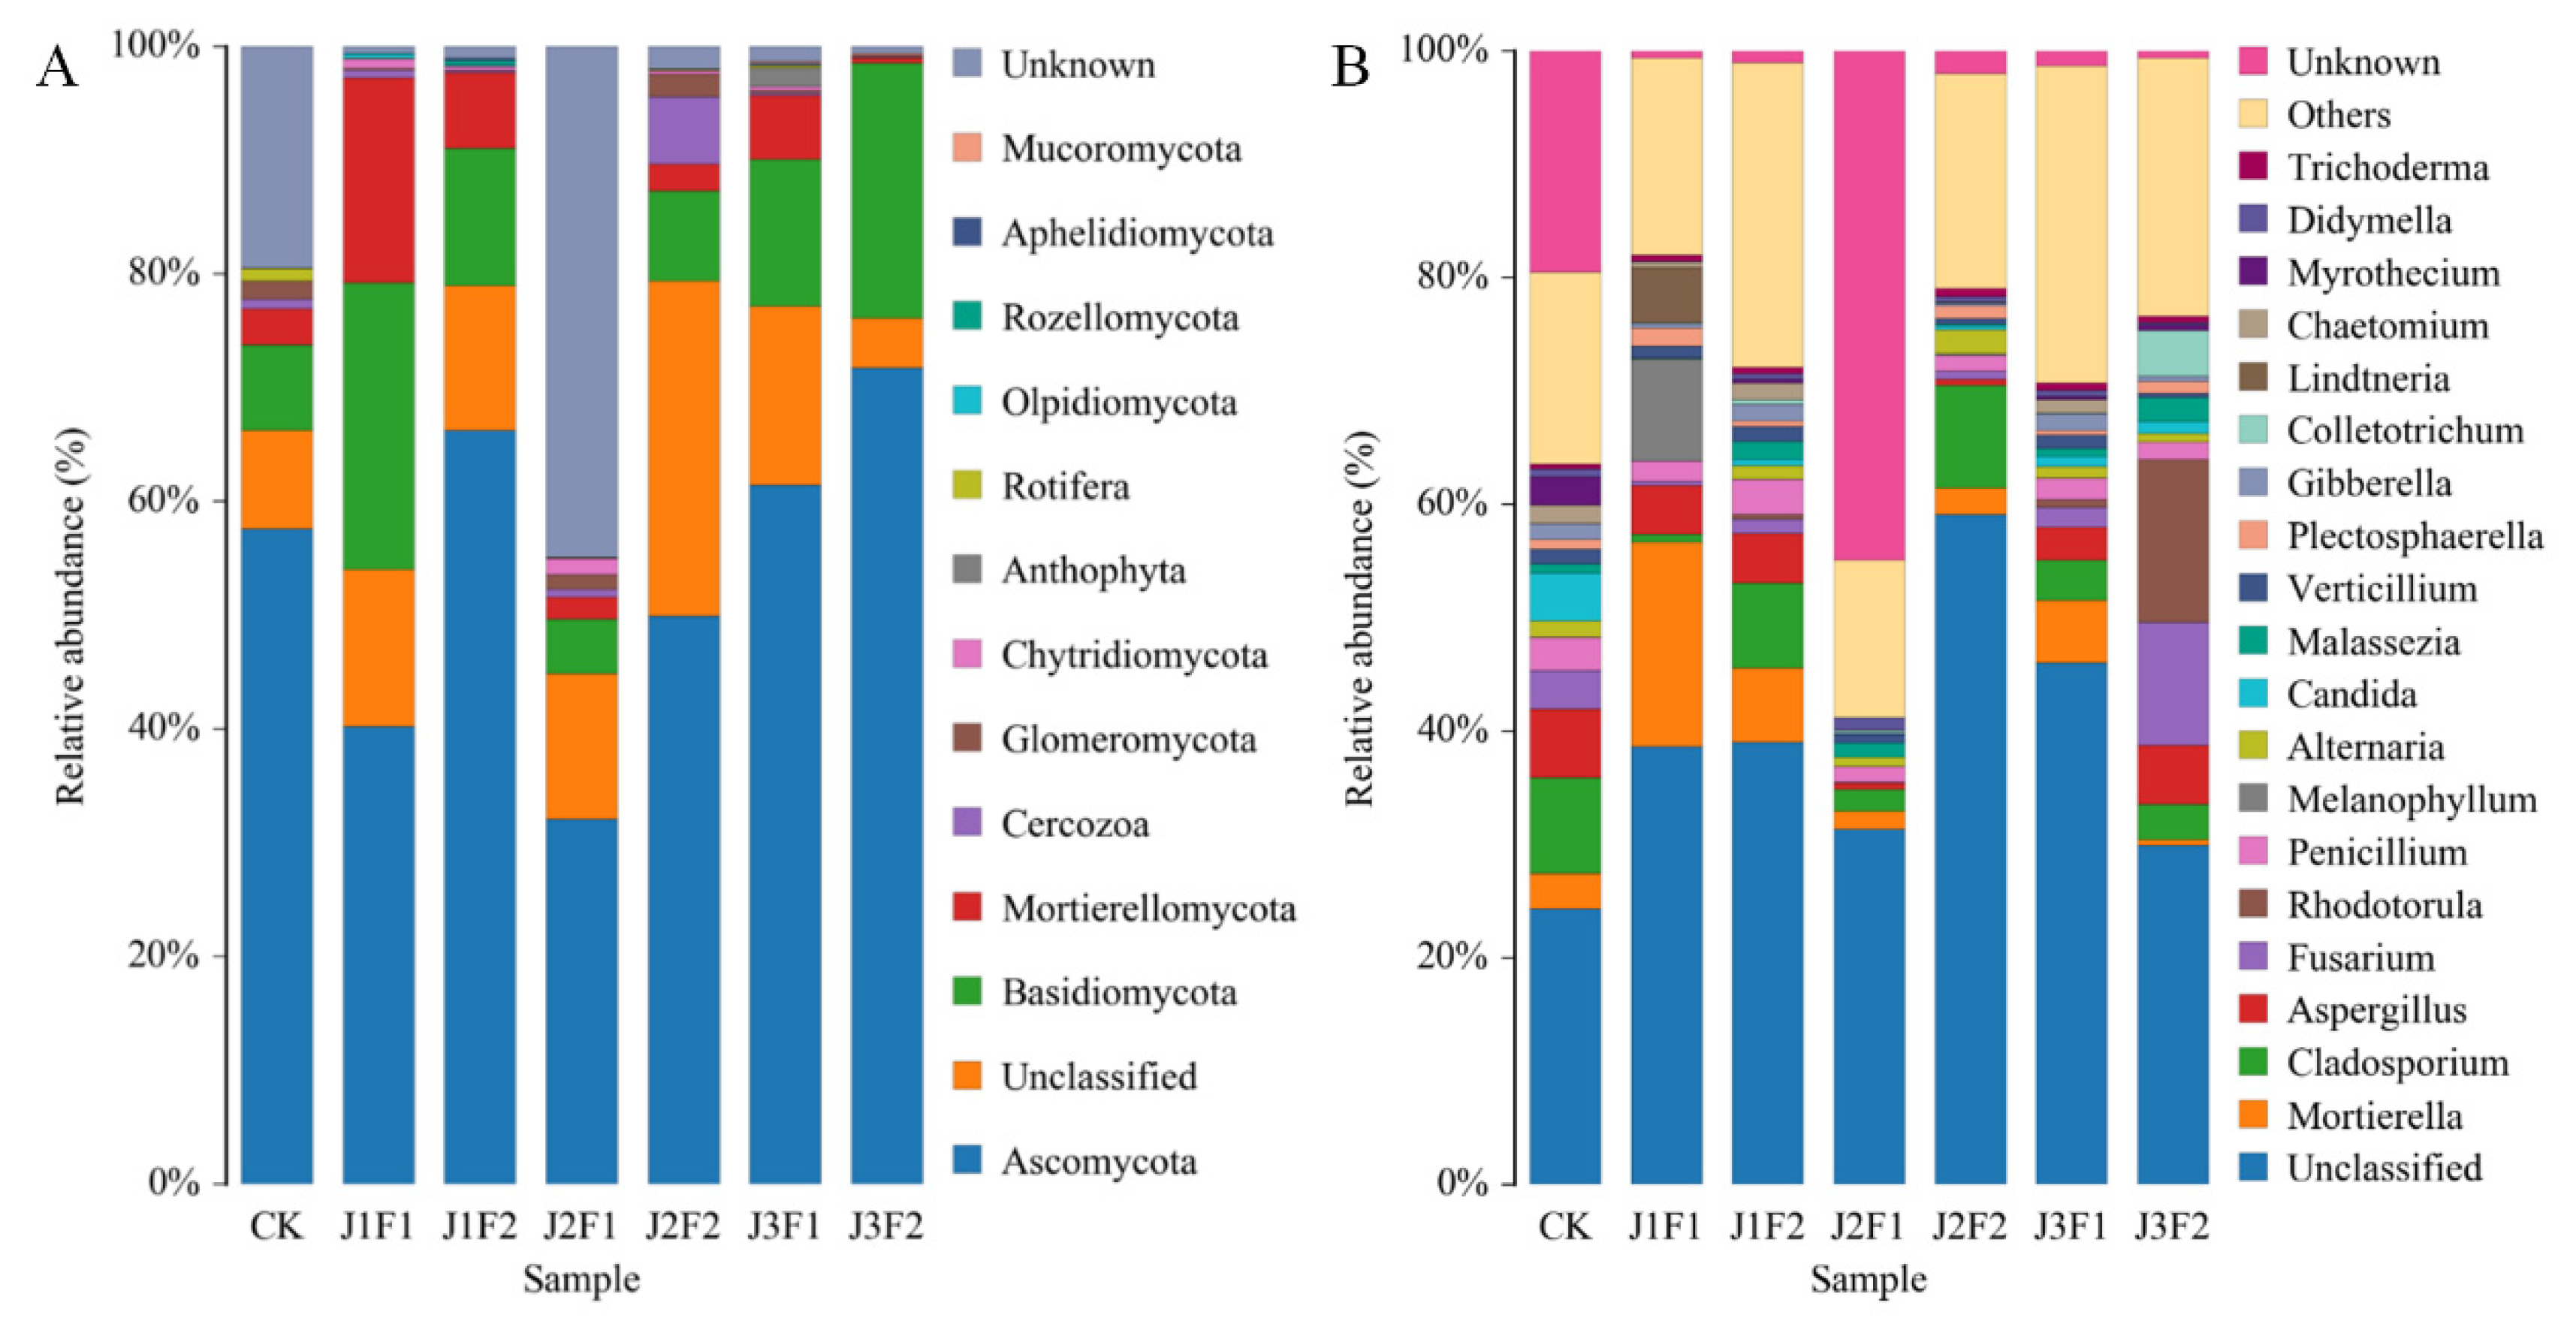
At the phylum level, twelve fungal phyla were identified: Ascomycota, Basidiomycota, Mortierellomycota, Cercozoa, Glomeromycota, Chytridiomycota, Anthophyta, Rotifera, Olpidiomycota, Rozellomycota, Aphelidiomycota, and Mucoromycota. Ascomycota were distributed in all treatments, and were highly abundant. Except for the J2F1 treatment, their contents were more than 40%, and the lowest content of 31% was found in the J2F1 treatment (Table S8a). From the image, we can see that Ascomycota, Basidiomycota, and Mortierellomycota have obvious advantages. Ascomycota ranked first, accounting for 31% to 71%; Basidiomycota were second, accounting for 4% to 25%. Mortierellomycota were 18% in the J1F1 treatment, which was their largest representation (Figure 7A). The study showed that a total of twelve phyla were detected in all treatments; only the J3F1 treatment included all twelve phyla, CK and J3F2 included six of them, the J2 treatment included seven phyla, and J1F1 and J1F2 included eight and nine phyla, respectively, indicating that the fungal phylum levels were reduced by J3F2. Ascomycota were the dominant phylum in each treatment, and J2 and J3 were beneficial to Basidiomycota, while the changing water and fertilizer treatments contributed to the production of Chytridiomycota.
At the genus level, Mortierella, Cladosporium, Aspergillus, Fusarium, Rhodotorula, Penicillium, Melanophyllum, Alternaria, Candida, Malassezia, Verticillium, Plectosphaerella, Gibberella, Colletotrichum, Lindtneria, Chaetomium, Myrothecium, Didymella, and Trichoderma were the 20 most abundant genera (Table S8b). At the genus level, the proportion of unclassified genera was generally higher than 20%. The proportion of known strains detected by J2F1 was the smallest, and the other 19 species were found across the seven treatments. Cladosporium and Aspergillus were dominant in CK, and Aspergillus and Melanophyllum accounted for the highest proportions in J1F1. Mortierella and Cladosporium were abundant in J1F2 and J3F1. However, the dominant strains in J3F2 (Fusarium and Rhodotorula) were significantly different from those in the other treatments (Figure 7B).

3.2.5. Fungal Ternary Diagram

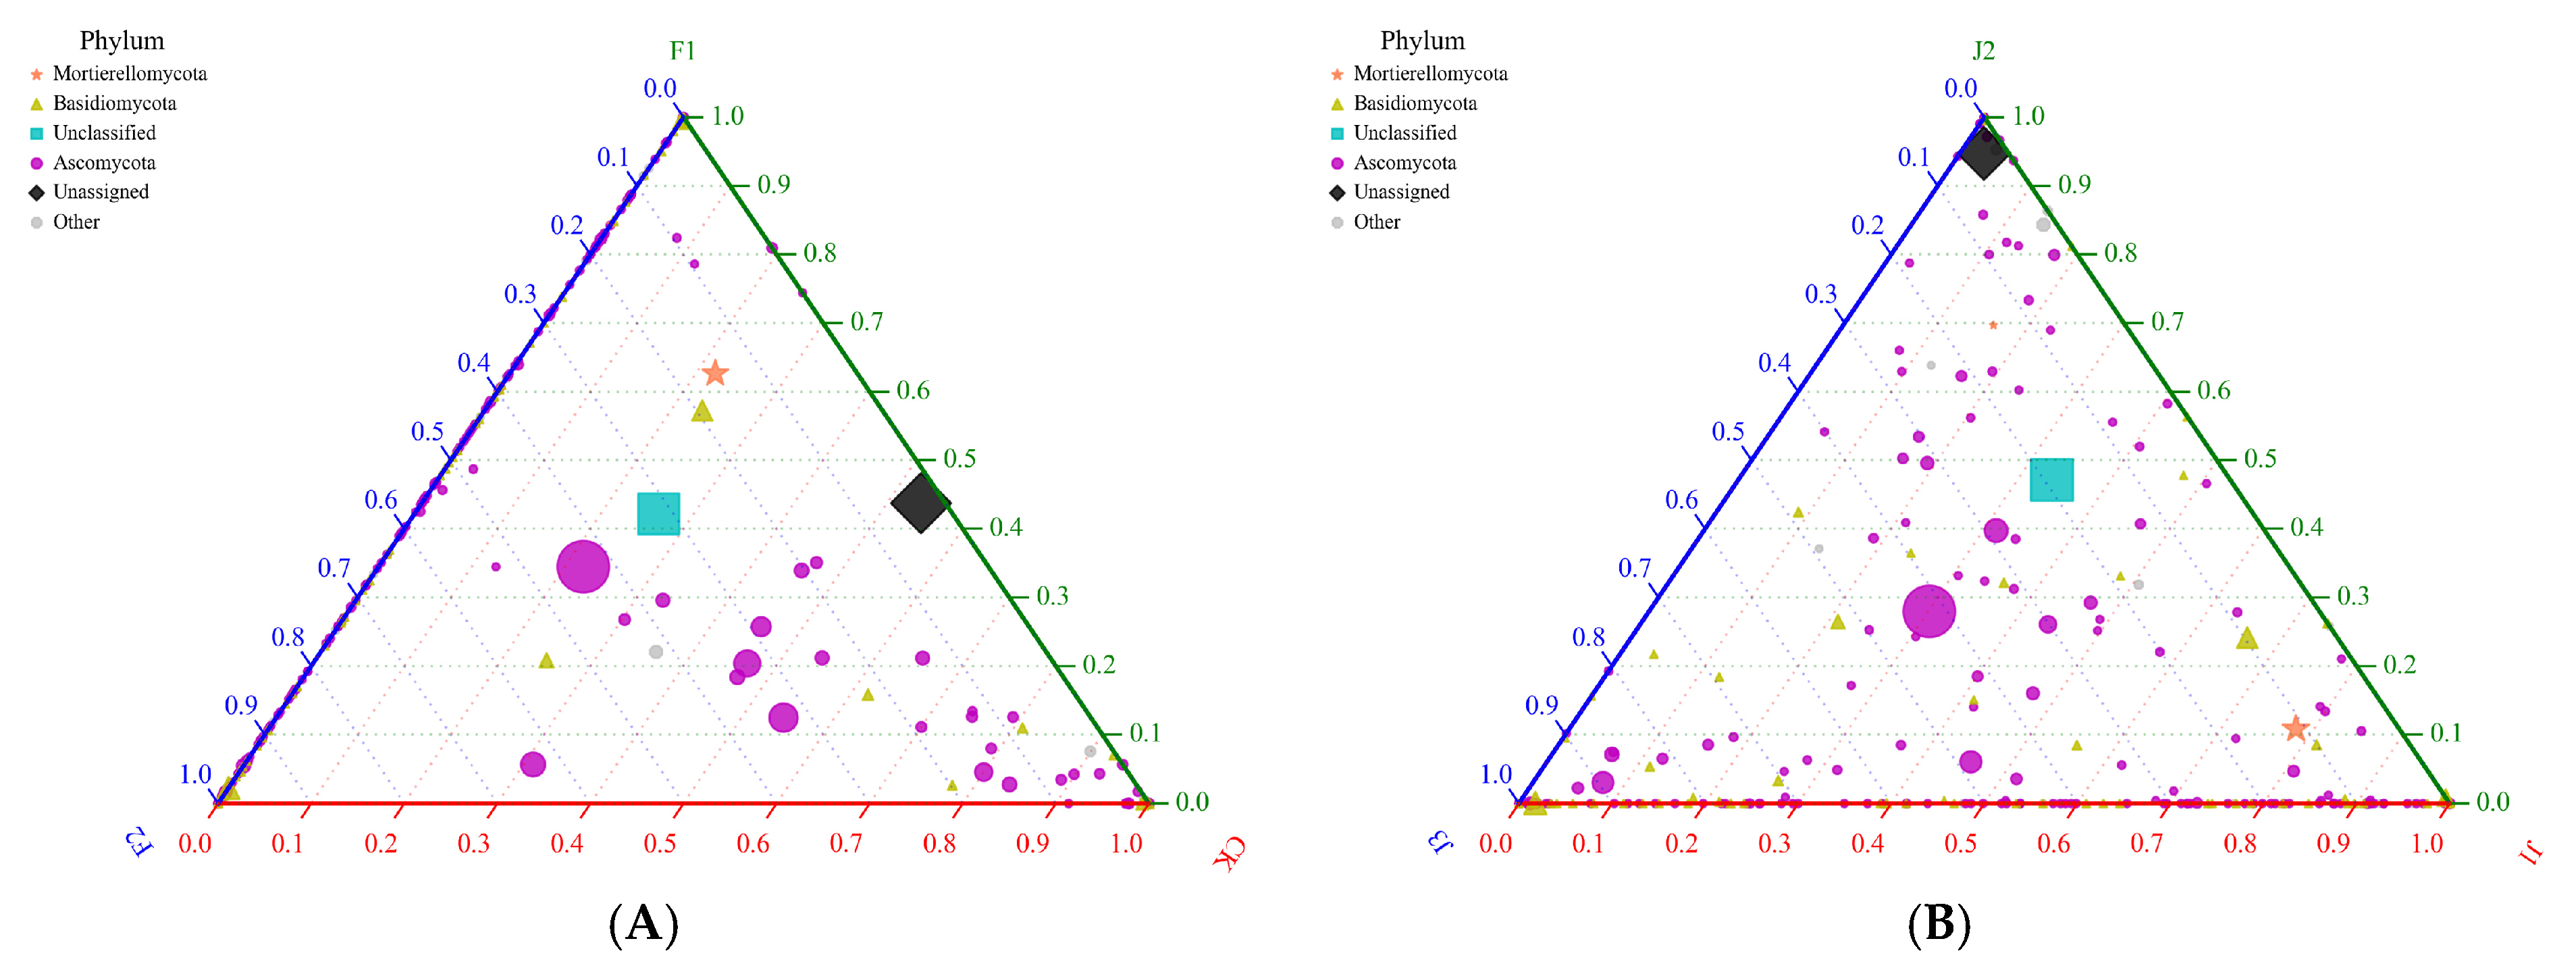
Ascomycota had the most points in the diagram, and various proportions existed in the three treatments; the proportion of this genus in CK was higher than in the F1 and F2 treatments. Basidiomycota was the second-most common point, which tended to be similar to Ascomycota (Figure 8A and Table S9). Comparing the different water treatments, the abundance of Ascomycota was still the greatest, and there were various proportions. In general, the abundance of Ascomycota in the J2 treatment was lower than that in J1 and J3 (Figure 8B and Table S10).

3.3. Panax Notoginseng Root Rot Incidence

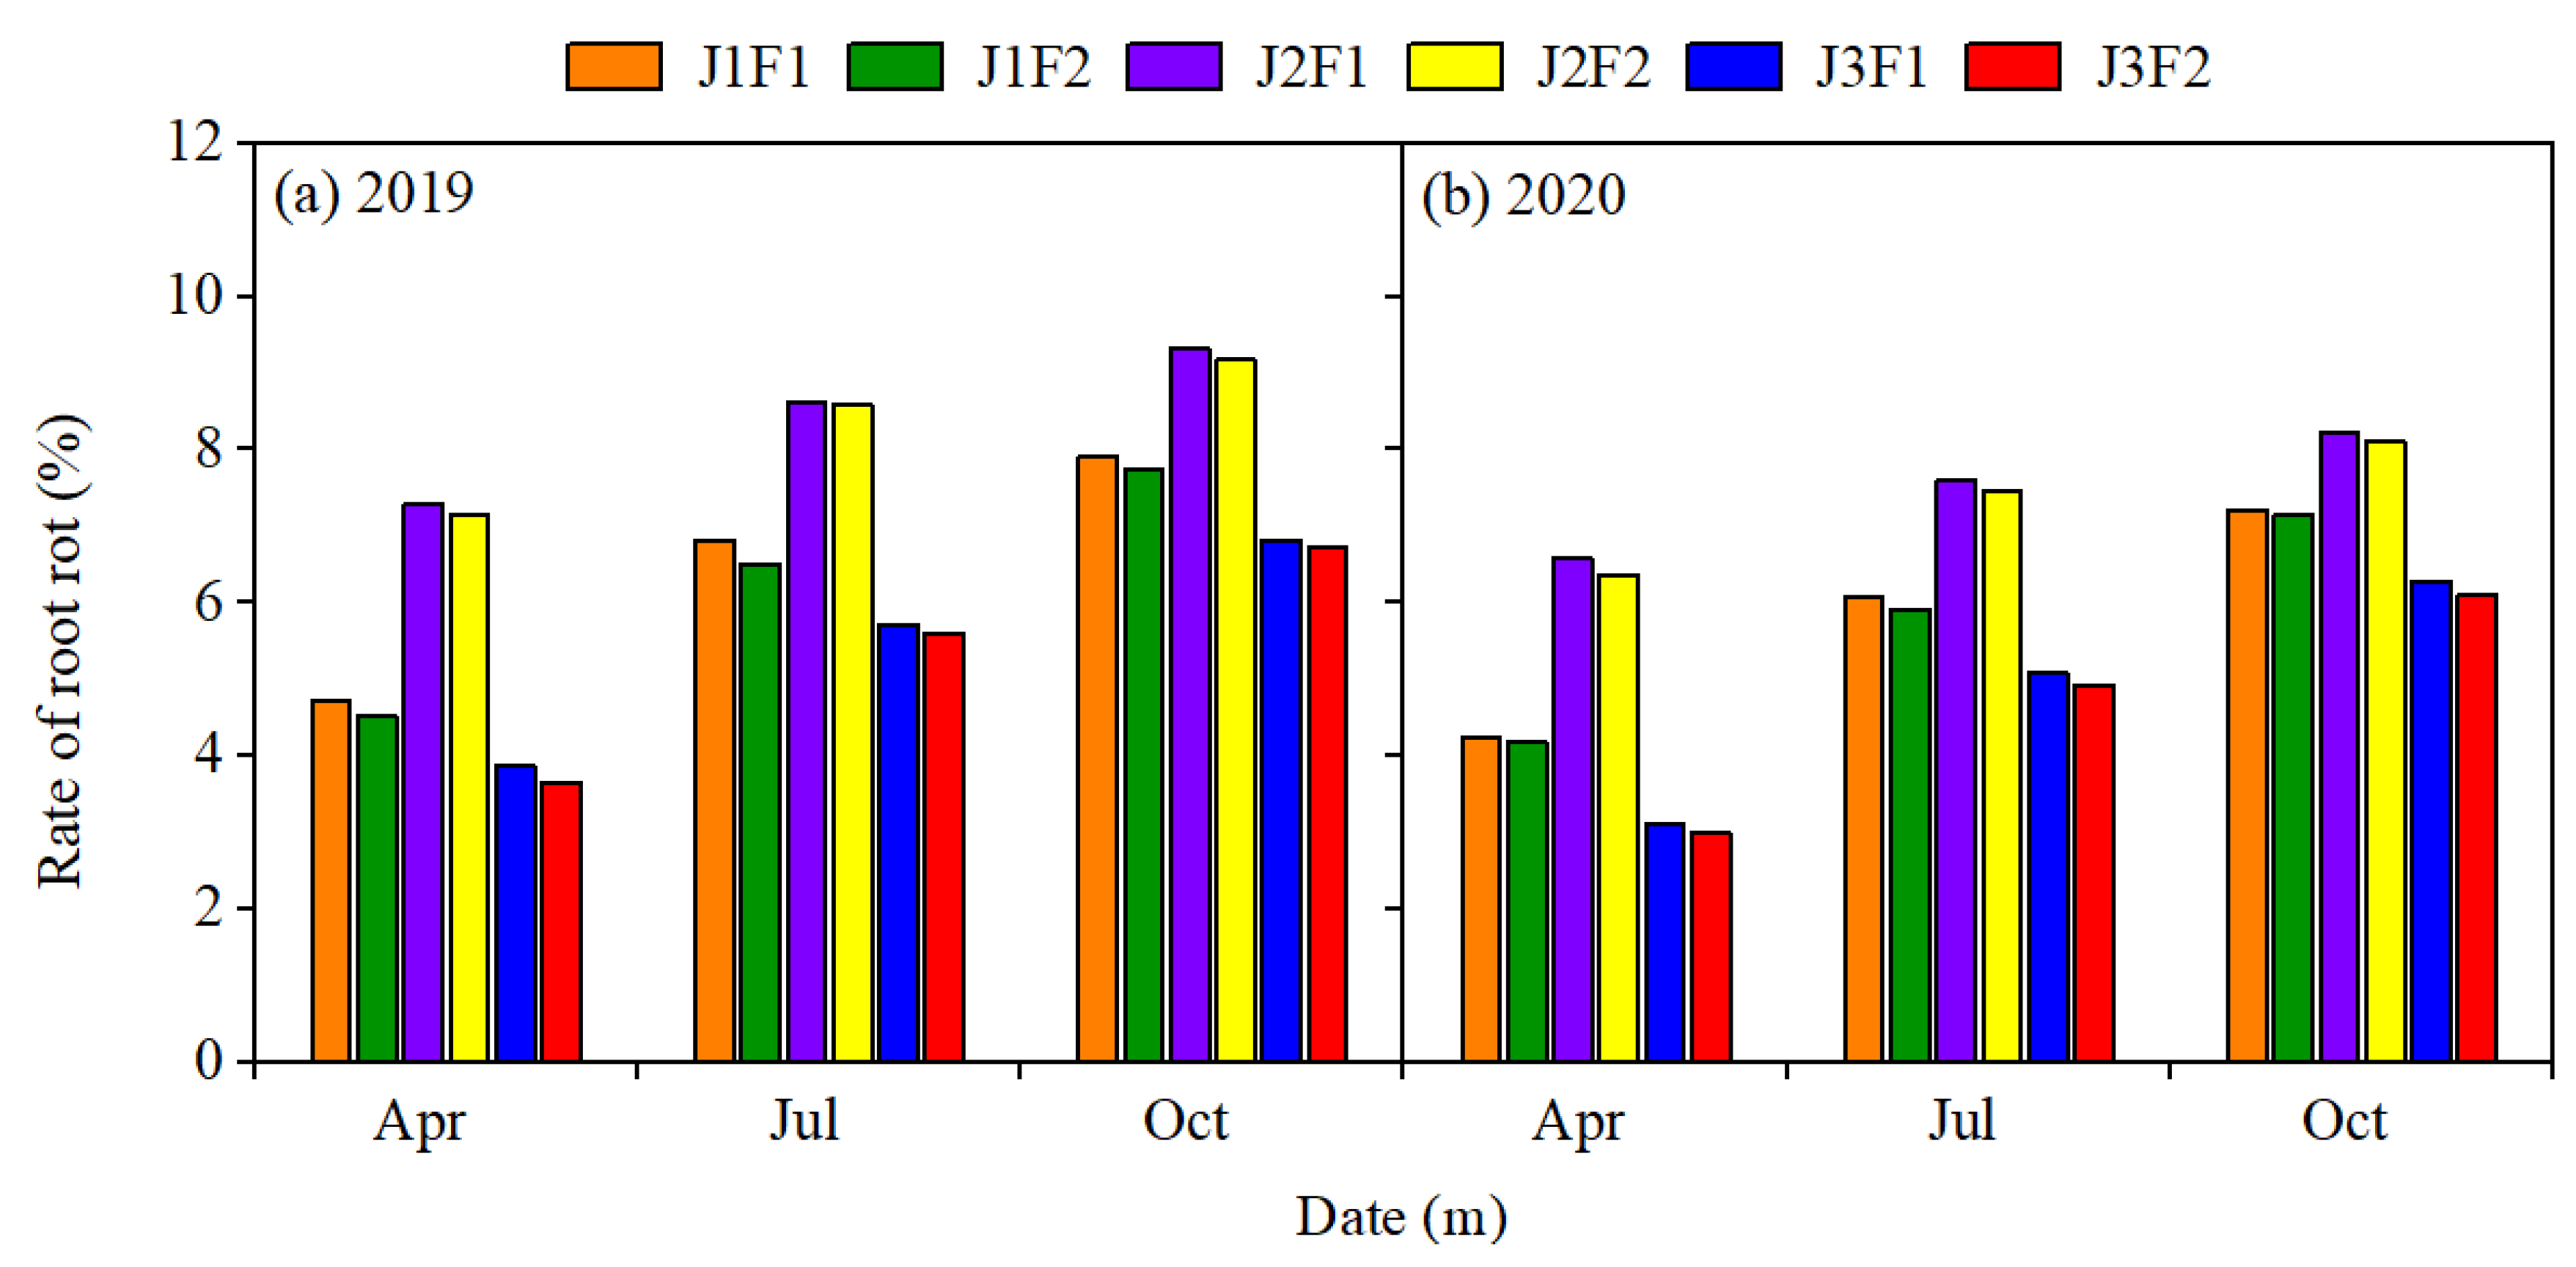
In 2019 and 2020, different irrigation treatments and microbial fertilizers had significant effects on the incidence of Panax notoginseng root rot (Figure 9). Under the same irrigation conditions, the incidence of Panax notoginseng root rot in all F1 treatments was slightly higher than that in F2. Under the same microbial fertilizer application, the root rot incidence by irrigation method was J2 > J1 > J3. The incidence rate of Panax notoginseng root rot showed a decreasing tendency with the increase in the number of planting years; the incidence rate under the J3F2 treatment in 2020 was low, and its average incidence rate was 12.14% lower than that of the J3F2 treatment in 2019.

3.4. Panax Notoginseng Yield

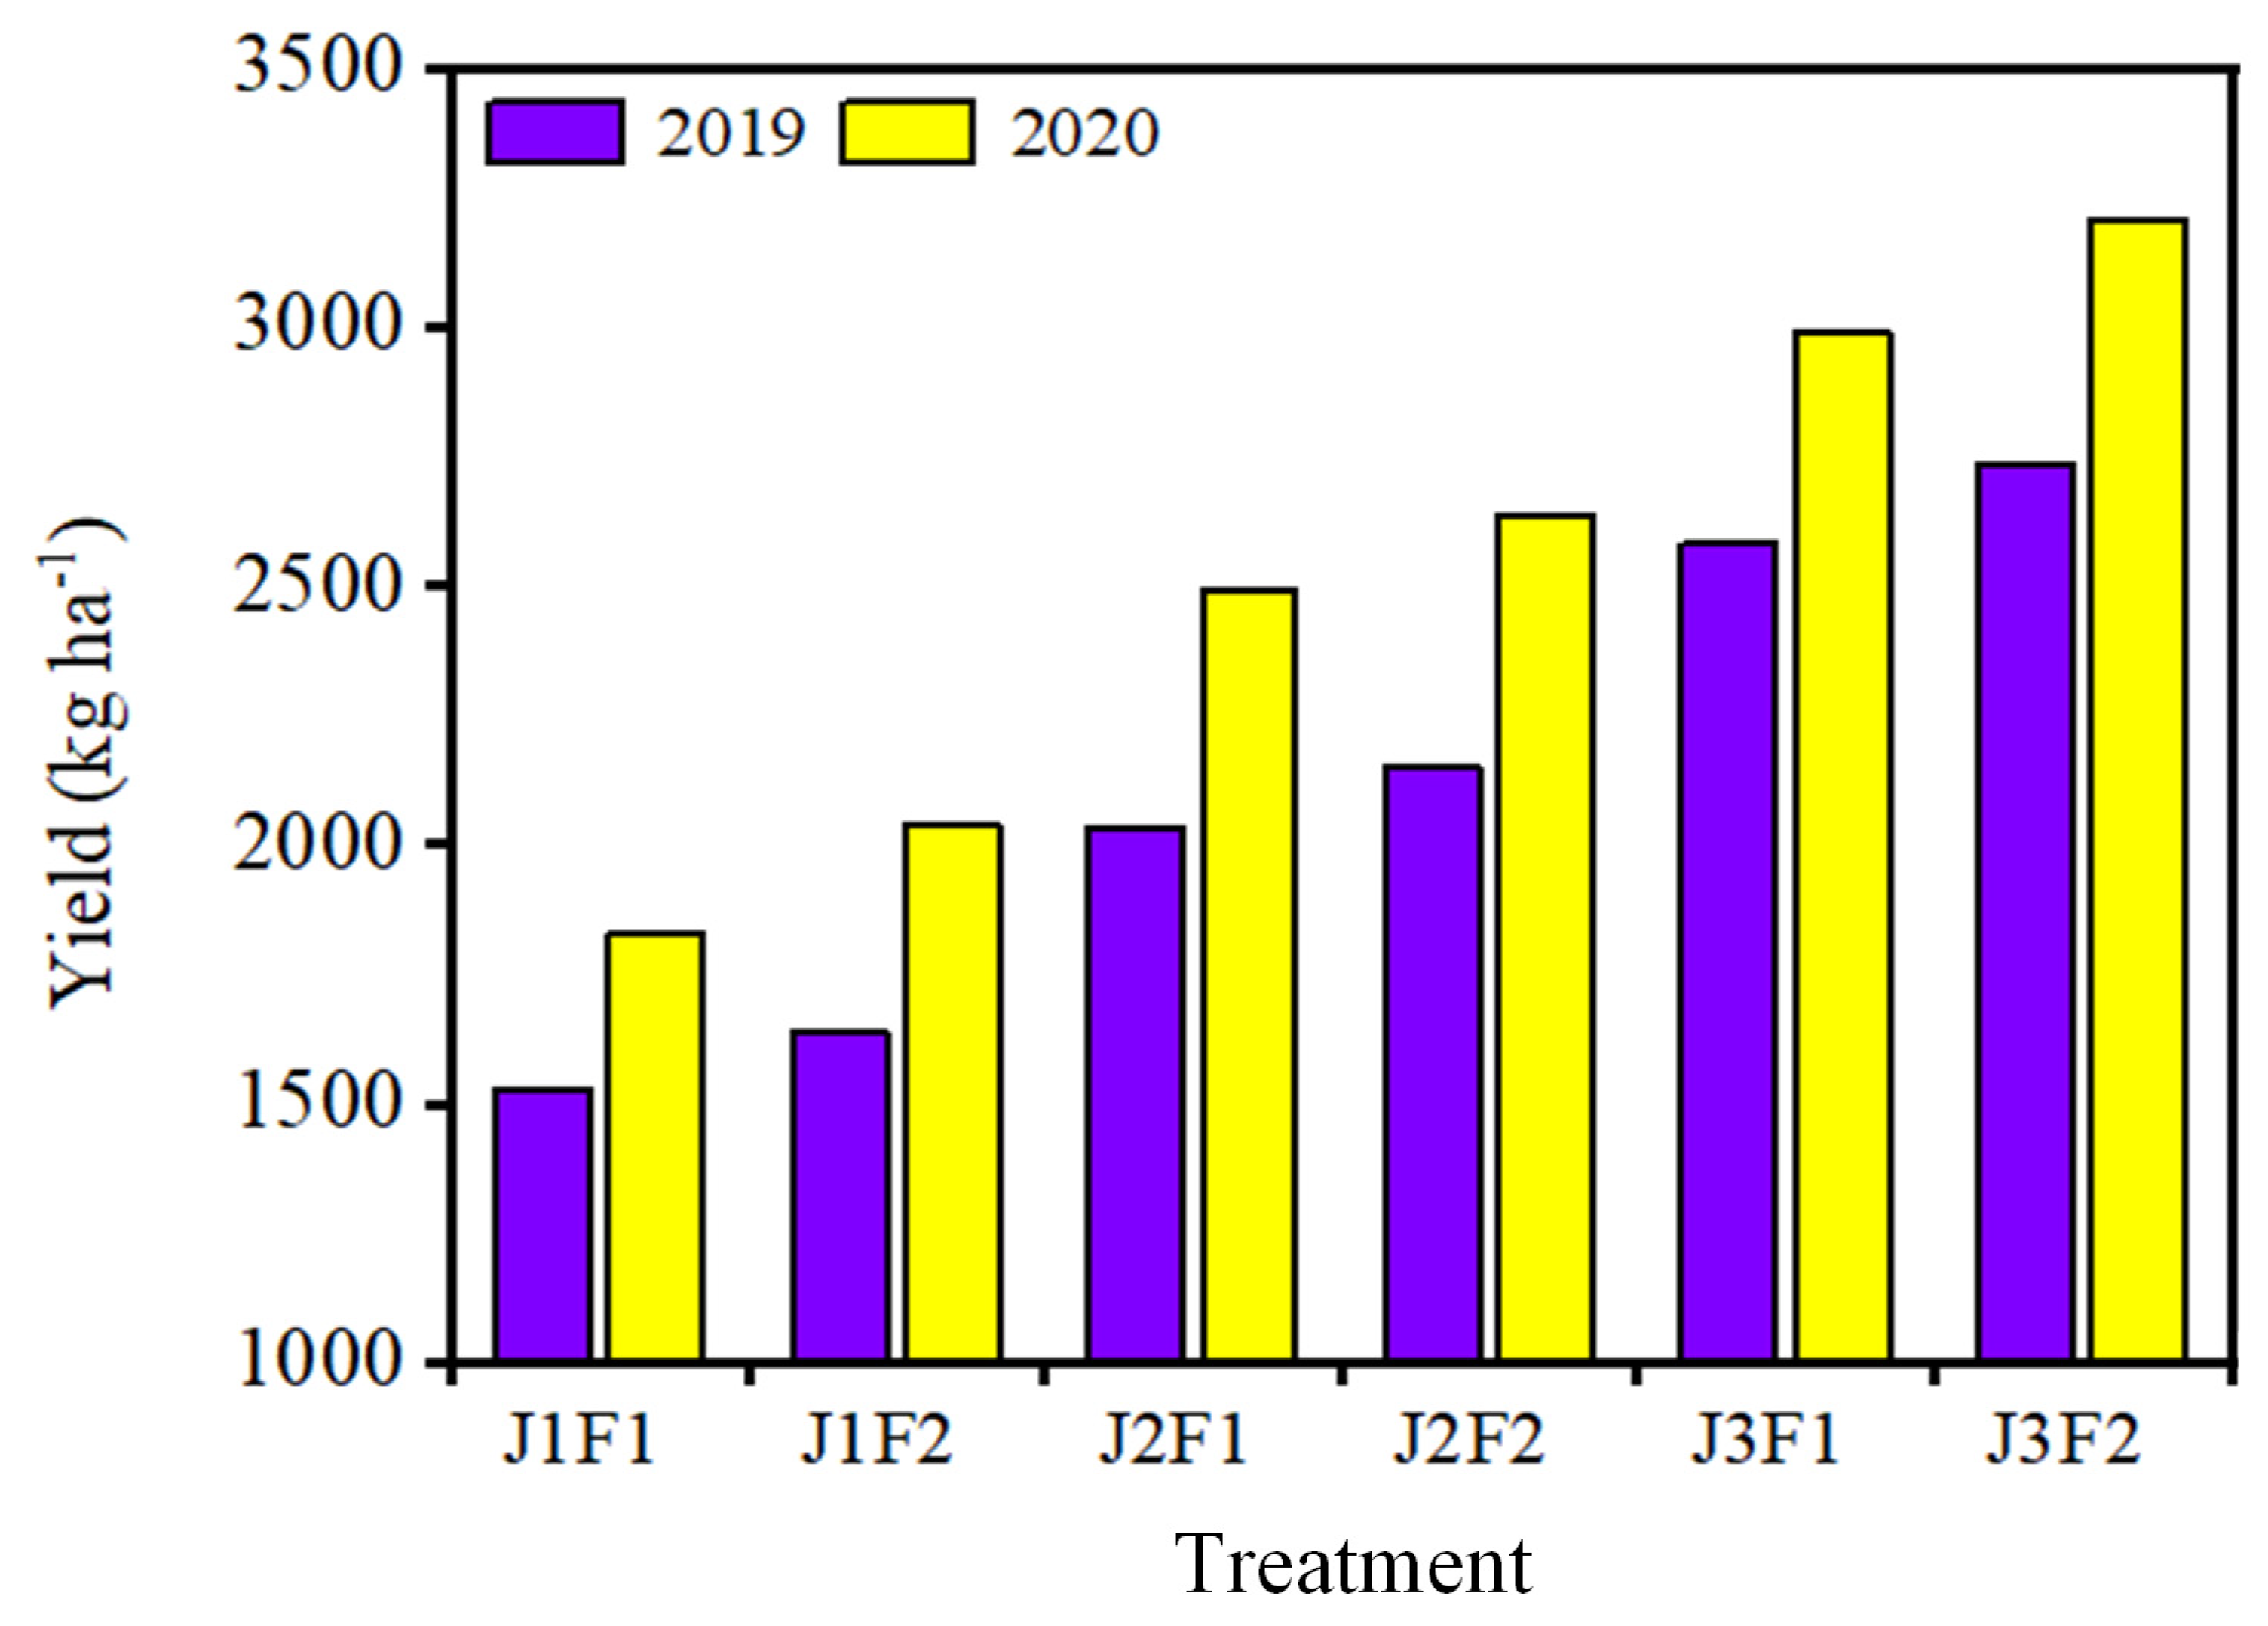
In 2019 and 2020, different irrigation conditions and microbial fertilizers had significant effects on the Panax notoginseng yield (Figure 10). Under the same irrigation conditions, the yield of Panax notoginseng was slightly higher in all F2 treatments than in F1. Under the same microbial fertilizer application, the yield according to irrigation was J3 > J2 > J1.

4. Discussion

As an important Chinese herbal medicine, Panax notoginseng needs a special environment for its growth. To evaluate the effects of different irrigation amounts and different amounts of microbial fertilizer on soil microorganisms, our experiment proved that there are great differences. With the development of standardized cultivation of traditional Chinese herbs, it has been found that soil water content plays a key role in the yield and quality of rhizome medicinal materials and is an effective environmental factor influencing the plasticity of plant roots [21]. In high-input modern industries, single cultivation would lead to a reduction in soil microbial diversity with the application of microbial fertilizers, which would be a good option to increase the diversity of the microbiota [22]. During the growth and evolution of Panax notoginseng, microorganisms can affect the growth and health of the plants, some of which are beneficial, while others are pathogens that can induce plant diseases [23].
In this study, under different degrees of microbial fertilizer application, the number of bacterial OTUs in F1 was slightly higher than in F2, but the number of fungal OTUs in F1 was smaller than in F2, except for alternate irrigation (J3), showing that alternate irrigation could effectively suppress the fungal numbers. In 2019 and 2020, the incidence of Panax notoginseng root rot under the J2 irrigation treatments was higher; J3F2’s incidence was the least, and this treatment was the most productive, suggesting that alternate irrigation (J3) with F2 microbial fertilizer application was more beneficial for Panax notoginseng cultivation. Firmicutes and Proteobacteria were the two most common phyla of bacteria, and they also had the highest proportions in Panax notoginseng soil. In CK and J2F1, Cyanobacteria accounted for a greater proportion, at about 20%, while they were less abundant in the other treatments. Cyanobacteria are significant suppliers of nitrogen in the soil ecosystem [24]. Their nitrogen fixation process is not limited by the high deficiency of soil organic matter but can increase the organic matter in soil and improve soil fertility [25]. Among the seven treatments, Bacteroidetes occupied the most similar proportion: about 10%. Bacteroidetes are highly efficient degraders of complex carbohydrates. The decomposition of polysaccharides enables soluble sugars to be utilized by other organisms and recovers carbon, nitrogen, and water, which have a wide impact on the environment [26] and can be used as sensitive biological indicators for agricultural soil utilization [27]. Acidobacteria has a wide range of metabolic [28] and genetic functions [29] and may play an important ecological role by degrading polysaccharides from plants and fungi [30]. Actinobacteria were unique and abundant in J3F2 (15%), have high metabolic and physiological diversity [31], can prevent the harm of most plant pathogens (including fungi and oomycetes), increase nutrient supply, promote plant growth, and are potential biocontrol sources [32]. Lactobacillus had the highest proportion among all genera, and as a natural biological preservative they can produce a variety of antifungal metabolites [33,34].
For fungi, the diversity of the soil fungal community was comparatively lower than that of bacteria, and the treatments without microbial fertilizer had no apparent differences from the other treatments. These results suggest that the presence of microbial fertilizer cannot directly affect fungal diversity. Climate, especially temperature and precipitation, affects the growth and distribution of fungi [35]. When contrasted with different irrigation amounts, J3 can make the species abundance and diversity of fungal microorganisms lower. In this study, Ascomycota (40–60%) and Basidiomycota were the most abundant among the two treatments. Ascomycota are important drivers of carbon and nitrogen cycling in ecosystems [36], with broad application prospects in the biological control of plant pathogens, promotion of plant growth [37], soil stability of enzyme production [38], decomposition of plant biomass, and endogenous interaction with plants [39]. However, several fungal genera with high abundance among the differentiated strains are common pathogens in many crops, such as Alternaria [40], Verticillium [41], Plectosphaerella, Gibberella [42], Colletotrichum, and Cucumerina [43]. Although these fungal genera were low in abundance among the seven treatments, the presence of pathogenic bacteria can be harmful to plants. Alternaria and Didymellazcan cause leaf diseases and even necrosis [44], and infection of horticultural and food crops [45] can cause necrotic leaf diseases [46]. Colletotrichum infects potatoes, while Verticillium and Trichoderma ranked last among all of the annotated fungi, Trichoderma is widely used as a fungicide [47], with antifungal activity against several rhizosphere and leaf circle pathogens, along with nutrient competition, direct antagonism, fungal parasitism, and mechanisms of inducing plant resistance [48]. Mortierella accounted for 24%–59% of the fungi in this experiment and was the most abundant fungus. This genus contains a large number of effective species (nearly 100), which can be found on almost any substrate and often appear as saprophytes in the soil [49].
Combined, the roots of plants are symbiotic with a variety of beneficial fungi, which promote the absorption of mineral nutrients by plants [50], Rhizosphere bacteria that promote plant growth can induce systemic resistance in plants [51] while minimizing the severity of root and leaf diseases [52], and phytohormones released by microorganisms can also activate plant immunity [53]. During the growth of Panax notoginseng, there are interactions between Panax notoginseng and soil. Although soil has different effects on the growth and suitability of Panax notoginseng, how soil microorganisms assemble and regulate Panax notoginseng requires our attention.

5. Conclusions

There have been few reports on soil microorganisms growing in Panax notoginseng under varying conditions at present. In this study, seven different water and microbial fertilizer treatments were used to gather the soil around the rhizosphere of Panax notoginseng and compare its relevant information. We found that the bacterial community abundance and diversity in the control treatment (CK) without microbial fertilizer were much lower than those in the other treatments. In the microbial fertilizer treatments, the bacterial abundance in F1 was higher than that in F2. Meanwhile, the number of fungal OTUs in F1 was smaller than that in F2, except for alternate irrigation (J3), showing that alternate irrigation could effectively suppress the fungal numbers. In 2019 and 2020, the incidence of Panax notoginseng root rot under the J2 irrigation level was higher, while the incidence under J3F2 was the least, and this treatment was the most productive. Therefore, this study suggests that alternate irrigation (J3) and F2-level microbial fertilizer application is more beneficial for Panax notoginseng cultivation. The number and species of bacteria and fungi sequenced in this experiment were very large; however, whether (and if so, which) specialized soil microorganisms can direct the specific healthy growth and disease resistance of Panax notoginseng has not been further verified. The effects of different water and microbial fertilizer conditions on the yield, quality, and effective components of Panax notoginseng, and whether they are valuable to the growth of medicinal plants and the accumulation of effective components, are also unknown. Managing rhizosphere microorganisms and maintaining a balance of microorganisms in soil is essential for the effectiveness of Panax notoginseng cultivation methods. Ultimately, understanding the impact behind the application of different water and microbial fertilizer treatments will open up avenues for engineering plant microbiota for sustainable agriculture in Panax notoginseng.

Supplementary Materials

The following supporting information can be downloaded at: https://www.mdpi.com/article/10.3390/agronomy14050922/s1, Table S1: Bacterial Statistics of sample sequencing data processing results; Table S2: Bacterial Principal Component Analysis; Table S3: Bacterial microbial community; Table S4: Ternary Diagram, CK, J1 and J2 groups in the bacterial phylum level; Table S5: Ternary diagram, F1, F2 and F3 groups in the bacterial phylum level; Table S6: Fungal Statistics of sample sequencing data processing results; Table S7: Fungal Principal Component Analysis; Table S8: Fungal microbial community; Table S9: Ternary diagram, CK, J1 and J2 groups in the fungal phylum level; Table S10: Ternary diagram, F1, F2 and F3 groups in the fungal phylum level.

Author Contributions

L.Y.: formal analysis, investigation, resources, writing—original draft; L.K.: data curation, methodology, visualization, supervision, writing—original draft; Q.Y.: methodology, funding acquisition, resources, writing—review and editing; H.N.: methodology, formal analysis, resources, writing—review and editing. J.L.: funding acquisition, visualization, supervision, writing—review and editing. All authors have read and agreed to the published version of the manuscript.

Funding

This research was funded by the Yunnan Fundamental Research Projects (grant number 202301AU070061), the applied Basic Research Key Project of Yunnan (grant number 202201AS070034), the Yunnan Science and Technology Talent and Platform Program (grant number 202305AM070006), the Yunnan Technology Innovation Center of Phosphorus Resource (No. 202305AK340002), and the National Natural Science Foundation of China (No. 52209055).

Data Availability Statement

The data that support the findings of this study are available from the corresponding author, Jiaping Liang, upon reasonable request.

Conflicts of Interest

We declare that we do not have any commercial or associative interests that represent conflicts of interest in connection with the work submitted here.

References

  1. Canfora, L.; Salvati, L.; Benedetti, A.; Francaviglia, R. Is soil microbial diversity affected by soil and groundwater salinity? Evidences from a coastal system in central Italy. Environ. Monit. Assess. 2017, 189, 319. [Google Scholar] [CrossRef] [PubMed]
  2. Rillig, M.C.; Ryo, M.; Lehmann, A.; Aguilar-Trigueros, C.A.; Buchert, S.; Wulf, A.; Iwasaki, A.; Roy, J.; Yang, G. The role of multiple global change factors in driving soil functions and microbial biodiversity. Science 2019, 366, 886–890. [Google Scholar] [CrossRef] [PubMed]
  3. Kuang, S.; Su, Y.; Wang, H.; Yu, W.; Lang, Q.; Matangi, R. Soil Microbial Community Structure and Diversity around the Aging Oil Sludge in Yellow River Delta as Determined by High-Throughput Sequencing. Archaea 2018, 2018, 7861805. [Google Scholar] [CrossRef] [PubMed]
  4. Dai, L.; Zhang, G.; Yu, Z.; Ding, H.; Xu, Y.; Zhang, Z. Effect of Drought Stress and Developmental Stages on Microbial Community Structure and Diversity in Peanut Rhizosphere Soil. Int. J. Mol. Sci. 2019, 20, 2265. [Google Scholar] [CrossRef] [PubMed]
  5. Praeg, N.; Pauli, H.; Illmer, P. Microbial Diversity in Bulk and Rhizosphere Soil of Ranunculus glacialis Along a High-Alpine Altitudinal Gradient. Front. Microbiol. 2019, 10, 1429. [Google Scholar] [CrossRef] [PubMed]
  6. Mendes, R.; Garbeva, P.; Raaijmakers, J.M. The rhizosphere microbiome: Significance of plant beneficial, plant pathogenic, and human pathogenic microorganisms. FEMS Microbiol. Rev. 2013, 37, 634–663. [Google Scholar] [CrossRef]
  7. Gaston, K.J. Global patterns in biodiversity. Nature 2000, 405, 220–227. [Google Scholar] [CrossRef] [PubMed]
  8. Huang, A.C.; Jiang, T.; Liu, Y.X.; Bai, Y.C.; Reed, J.; Qu, B.; Goossens, A.; Nützmann, H.W.; Bai, Y.; Osbourn, A. A specialized metabolic network selectively modulates Arabidopsis root microbiota. Science 2019, 364, eaau6389. [Google Scholar] [CrossRef]
  9. Lundberg, D.S.; Lebeis, S.L.; Paredes, S.H.; Yourstone, S.; Gehring, J.; Malfatti, S.; Tremblay, J.; Engelbrektson, A.; Kunin, V.; Rio, T.G.D.; et al. Defining the core Arabidopsis thaliana root microbiome. Nature 2012, 488, 86–90. [Google Scholar] [CrossRef]
  10. Fu, H.; Yuan, G.; Jeppesen, E.; Ge, D.; Li, W.; Zou, D.; Huang, Z.; Wu, A.; Liu, Q. Local and regional drivers of turnover and nestedness components of species and functional beta diversity in lake macrophyte communities in China. Sci. Total Environ. 2019, 687, 206–217. [Google Scholar] [CrossRef]
  11. Zhang, Y.; Zheng, Y.; Xia, P.; Xun, L.; Liang, Z. Impact of continuous Panax notoginseng plantation on soil microbial and biochemical properties. Sci. Rep. 2019, 9, 13205. [Google Scholar] [CrossRef] [PubMed]
  12. Berendsen, R.L.; Pieterse, C.M.; Bakker, P.A. The rhizosphere microbiome and plant health. Trends Plant Sci. 2012, 17, 478–486. [Google Scholar] [CrossRef] [PubMed]
  13. Edgar, R.C. Search and clustering orders of magnitude faster than BLAST. Bioinformatics 2010, 26, 2460–2461. [Google Scholar] [CrossRef] [PubMed]
  14. Caporaso, J.G.; Kuczynski, J.; Stombaugh, J.; Bittinger, K.; Bushman, F.D.; Costello, E.K.; Fierer, N.; Peña, A.G.; Goodrich, J.K.; Gordon, J.I.; et al. QIIME allows analysis of high-throughput community sequencing data. Nat. Methods 2010, 7, 335–336. [Google Scholar] [CrossRef] [PubMed]
  15. Chen, L.; Swenson, N.G.; Ji, N.; Mi, X.; Ren, H.; Guo, L.; Ma, K. Differential soil fungus accumulation and density dependence of trees in a subtropical forest. Science 2019, 366, 124–128. [Google Scholar] [CrossRef] [PubMed]
  16. Chen, H.; Boutros, P.C. VennDiagram: A package for the generation of highly-customizable Venn and Euler diagrams in R. BMC Bioinform. 2011, 12, 35. [Google Scholar] [CrossRef] [PubMed]
  17. Willis, A.D. Rarefaction, Alpha Diversity, and Statistics. Front. Microbiol. 2019, 10, 2407. [Google Scholar] [CrossRef] [PubMed]
  18. Grice, E.A.; Kong, H.H.; Conlan, S.; Deming, C.B.; Davis, J.; Young, A.C.; NISCComparative Sequencing Program Bouffard, G.G.; Blakesley, R.W.; Murray, P.R.; Green, E.D. Topographical and temporal diversity of the human skin microbiome. Science 2009, 324, 1190–1192. [Google Scholar] [CrossRef]
  19. Dubois, P.C.A.; Trynka, G.; Franke, L.; Hunt, K.A.; Romanos, J.; Curtotti, A.; Zhernakova, A.; Heap, G.A.; Ádány, R.; Aromaa, A.; et al. Multiple common variants for celiac disease influencing immune gene expression. Nat. Genet. 2010, 42, 295–302. [Google Scholar] [CrossRef]
  20. Ye, Q.; Park, J.; Laurence, J.S.; Parthasarathy, R.; Misra, A.; Spencer, P. Ternary phase diagram of model dentin adhesive exposed to over-wet environments. J. Dent. Res. 2011, 90, 1434–1438. [Google Scholar] [CrossRef]
  21. Aguirre-von-Wobeser, E.; Rocha-Estrada, J.; Shapiro, L.R.; de la Torre, M. Enrichment of Verrucomicrobia, Actinobacteria and Burkholderiales drives selection of bacterial community from soil by maize roots in a traditional milpa agroecosystem. PLoS ONE 2018, 13, e0208852. [Google Scholar] [CrossRef] [PubMed]
  22. Compant, S.; Samad, A.; Faist, H.; Sessitsch, A. A review on the plant microbiome: Ecology, functions, and emerging trends in microbial application. J. Adv. Res. 2019, 19, 29–37. [Google Scholar] [CrossRef] [PubMed]
  23. Wang, X.; Zhang, M.; Gao, J.; Pu, T.; Bilal, M.; Wang, Y.; Zhang, X. Antifungal activity screening of soil actinobacteria isolated from Inner Mongolia, China. Biol. Control 2018, 127, 78–84. [Google Scholar] [CrossRef]
  24. Soo, R.M.; Hemp, J.; Hugenholtz, P. Evolution of photosynthesis and aerobic respiration in the cyanobacteria. Free Radic. Biol. Med. 2019, 140, 200–205. [Google Scholar] [CrossRef] [PubMed]
  25. Pankratova, E.M. Functioning of cyanobacteria in soil ecosystems. Eurasian Soil Sci. 2006, 39, S118–S127. [Google Scholar] [CrossRef]
  26. Wolińska, A.; Kuźniar, A.; Zielenkiewicz, U.; Izak, D.; Szafranek-Nakonieczna, A.; Banach, A.; Błaszczyk, M. Bacteroidetes as a sensitive biological indicator of agricultural soil usage revealed by a culture-independent approach. Appl. Soil Ecol. 2017, 119, 128–137. [Google Scholar] [CrossRef]
  27. McKee, L.S.; Martínez-Abad, A.; Ruthes, A.C.; Vilaplana, F.; Brumer, H. Focused Metabolism of beta-Glucans by the Soil Bacteroidetes Species Chitinophaga pinensis. Appl. Environ. Microbiol. 2019, 85, e02231-18. [Google Scholar] [CrossRef] [PubMed]
  28. Lladó, S.; Žifčáková, L.; Větrovský, T.; Eichlerová, I.; Baldrian, P. Functional screening of abundant bacteria from acidic forest soil indicates the metabolic potential of Acidobacteria subdivision 1 for polysaccharide decomposition. Biol. Fertil. Soils 2016, 52, 251–260. [Google Scholar] [CrossRef]
  29. de Chaves, M.G.; Silva, G.G.Z.; Rossetto, R.; Edwards, R.A.; Tsai, S.M.; Navarrete, A.A. Acidobacteria Subtreatments and Their Metabolic Potential for Carbon Degradation in Sugarcane Soil Amended With Vinasse and Nitrogen Fertilizers. Front. Microbiol. 2019, 10, 1680. [Google Scholar] [CrossRef]
  30. Zhang, Y.; Cong, J.; Lu, H.; Li, G.; Qu, Y.; Su, X.; Zhou, J.; Li, D. Community structure and elevational diversity patterns of soil Acidobacteria. J. Environ. Sci. 2014, 26, 1717–1724. [Google Scholar] [CrossRef]
  31. Schrempf, H. Actinobacteria within soils: Capacities for mutualism, symbiosis and pathogenesis. FEMS Microbiol. Lett. 2013, 342, 77–78. [Google Scholar] [CrossRef] [PubMed]
  32. Wolińska, A.; Górniak, D.; Zielenkiewicz, U.; Kuźniar, A.; Izak, D.; Banach, A.; Błaszczyk, M. Actinobacteria Structure in Autogenic, Hydrogenic and Lithogenic Cultivated and Non-Cultivated Soils: A Culture-Independent Approach. Agronomy 2019, 9, 598. [Google Scholar] [CrossRef]
  33. Zhao, Y.; Zhang, C.; Folly, Y.M.E.; Chang, J.; Wang, Y.; Zhou, L.; Zhang, H.; Liu, Y. Morphological and Transcriptomic Analysis of the Inhibitory Effects of Lactobacillus plantarum on Aspergillus flavus Growth and Aflatoxin Production. Toxins 2019, 11, 636. [Google Scholar] [CrossRef] [PubMed]
  34. Wu, Y.F.; Xing, P.; Liu, S.; Wu, Q.L. Enhanced Microbial Interactions and Deterministic Successions during Anoxic Decomposition of Microcystis Biomass in Lake Sediment. Front. Microbiol. 2019, 10, 2474. [Google Scholar] [CrossRef] [PubMed]
  35. Feng, B.; Yang, Z. Studies on diversity of higher fungi in Yunnan, southwestern China: A review. Plant Divers. 2018, 40, 165–171. [Google Scholar] [CrossRef] [PubMed]
  36. Challacombe, J.F.; Hesse, C.N.; Bramer, L.M.; McCue, L.A.; Lipton, M.; Purvine, S.; Nicora, C.; Gallegos-Graves, L.V.; Porras-Alfaro, A.; Kuske, C.R. Genomes and secretomes of Ascomycota fungi reveal diverse functions in plant biomass decomposition and pathogenesis. BMC Genom. 2019, 20, 976. [Google Scholar] [CrossRef] [PubMed]
  37. Barrera, V.A.; Martin, M.E.; Aulicino, M.; Martínez, S.; Chiessa, G.; Saparrat, M.C.; Gasoni, A.L. Carbon-substrate utilization profiles by Cladorrhinum (Ascomycota). Rev. Argent. Microbiol. 2019, 51, 302–306. [Google Scholar] [CrossRef] [PubMed]
  38. Frey, S.D.; Knorr, M.; Parrent, J.L.; Simpson, R.T. Chronic nitrogen enrichment affects the structure and function of the soil microbial community in temperate hardwood and pine forests. For. Ecol. Manag. 2004, 196, 159–171. [Google Scholar] [CrossRef]
  39. Lienhard, P.; Terrat, S.; Prévost-Bouré, N.C.; Nowak, V.; Régnier, T.; Sayphoummie, S.; Panyasiri, K.; Tivet, F.; Mathieu, O.; Levêque, J.; et al. Pyrosequencing evidences the impact of cropping on soil bacterial and fungal diversity in Laos tropical grassland. Agron. Sustain. Dev. 2014, 34, 525–533. [Google Scholar] [CrossRef]
  40. Desalegn, G.; Turetschek, R.; Kaul, H.P.; Wienkoop, S. Microbial symbionts affect Pisum sativum proteome and metabolome under Didymella pinodes infection. J. Proteom. 2016, 143, 173–187. [Google Scholar] [CrossRef]
  41. Buhtz, A.; Witzel, K.; Strehmel, N.; Ziegler, J.; Abel, S.; Grosch, R. Perturbations in the Primary Metabolism of Tomato and Arabidopsis thaliana Plants Infected with the Soil-Borne Fungus Verticillium dahliae. PLoS ONE 2015, 10, e0138242. [Google Scholar] [CrossRef] [PubMed]
  42. Pasche, J.S.; Taylor, R.J.; Gudmestad, N.C. Colonization of Potato by Colletotrichum coccodes: Effect of Soil Infestation and Seed Tuber and Foliar Inoculation. Plant Dis. 2010, 94, 905–914. [Google Scholar] [CrossRef] [PubMed]
  43. Zhou, J.; Bi, S.; Chen, H.; Chen, T.; Yang, R.; Li, M.; Fu, Y.; Jia, A.Q. Anti-Biofilm and Antivirulence Activities of Metabolites from Plectosphaerella cucumerina against Pseudomonas aeruginosa. Front. Microbiol. 2017, 8, 769. [Google Scholar] [CrossRef] [PubMed]
  44. Elansary, H.O.; El-Ansary, D.O.; Al-Mana, F.A. 5-Aminolevulinic Acid and Soil Fertility Enhance the Resistance of Rosemary to Alternaria dauci and Rhizoctonia solani and Modulate Plant Biochemistry. Plants 2019, 8, 585. [Google Scholar] [CrossRef] [PubMed]
  45. Lombardi, N.; Vitale, S.; Turrà, D.; Reverberi, M.; Fanelli, C.; Vinale, F.; Marra, R.; Ruocco, M.; Pascale, A.; d’Errico, G.; et al. Root Exudates of Stressed Plants Stimulate and Attract Trichoderma Soil Fungi. Mol. Plant Microbe Interact. 2018, 31, 982–994. [Google Scholar] [CrossRef] [PubMed]
  46. Barilli, E.; Cobos, M.J.; Rubiales, D. Clarification on Host Range of Didymella pinodes the Causal Agent of Pea Ascochyta Blight. Front. Plant Sci. 2016, 7, 592. [Google Scholar] [CrossRef] [PubMed]
  47. Zaki, O.; Weekers, F.; Thonart, P.; Tesch, E.; Kuenemann, P.; Jacques, P. Limiting factors of mycopesticide development. Biol. Control 2020, 144, 104220. [Google Scholar] [CrossRef]
  48. Awad, N.E.; Kassem, H.A.; Hamed, M.A.; El-Feky, A.M.; Elnaggar, M.A.; Mahmoud, K.; Ali, M.A. Isolation and characterization of the bioactive metabolites from the soil derived fungus Trichoderma viride. Mycology 2018, 9, 70–80. [Google Scholar] [CrossRef]
  49. Yadav, D.R.; Kim, S.W.; Adhikari, M.; Um, Y.H.; Kim, H.S.; Kim, C.; Lee, H.B.; Lee, Y.S. Three New Records of Mortierella Species Isolated from Crop Field Soil in Korea. Mycobiology 2015, 43, 203–209. [Google Scholar] [CrossRef]
  50. Wijayawardene, N.N.; Pawłowska, J.; Letcher, P.M.; Kirk, P.M.; Humber, R.A.; Schüßler, A.; Wrzosek, M.; Muszewska, A.; Okrasińska, A.; Istel, Ł.; et al. Notes for genera: Basal clades of Fungi (including Aphelidiomycota, Basidiobolomycota, Blastocladiomycota, Calcarisporiellomycota, Caulochytriomycota, Chytridiomycota, Entomophthoromycota, Glomeromycota, Kickxellomycota, Monoblepharomycota, Mortierellomycota, Mucoromycota, Neocallimastigomycota, Olpidiomycota, Rozellomycota and Zoopagomycota). Fungal Divers. 2018, 92, 43–129. [Google Scholar]
  51. Hoysted, G.A.; Kowal, J.; Jacob, A.; Rimington, W.R.; Duckett, J.G.; Pressel, S.; Orchard, S.; Ryan, M.H.; Field, K.J.; Bidartondo, M.I. A mycorrhizal revolution. Curr. Opin. Plant Biol. 2018, 44, 1–6. [Google Scholar] [CrossRef] [PubMed]
  52. Zuccaro, A.; Lahrmann, U.; Langen, G. Broad compatibility in fungal root symbioses. Curr. Opin. Plant Biol. 2014, 20, 135–145. [Google Scholar] [CrossRef] [PubMed]
  53. Egidi, E.; Delgado-Baquerizo, M.; Plett, J.M.; Wang, J.; Eldridge, D.J.; Bardgett, R.D.; Maestre, F.T.; Singh, B.K. A few Ascomycota taxa dominate soil fungal communities worldwide. Nat. Commun. 2019, 10, 2369. [Google Scholar] [CrossRef] [PubMed]
Figure 1. (A) The number of OTUs of bacteria in seven samples. (B) Venn diagram of bacterial soil samples in seven treatments. CK represents the control group; J represents different irrigation treatments; F represents different microbial fertilizer treatments.
Agronomy 14 00922 g001
Figure 2. Principal component analysis (PCA) of bacterial microbial communities of samples: (A) PC1 vs. PC2. (B) PC1 vs. PC3. (C) PC2 vs. PC3. The points represent the samples; different colors represent different treatments; the abscissa represents the first principal component, and the percentage represents the contribution of the first principal component to the difference of the sample; the ordinate represents the second principal component, and the percentage represents the contribution of the second principal component to the difference of the sample.
Agronomy 14 00922 g002
Figure 3. Bacterial microbial community structure in the Panax notoginseng rhizosphere at the phylum and genus levels: (A) Relative abundance of bacterial phyla in seven soil treatments for the Panax notoginseng rhizosphere microbial community. (B) The relative abundance of the bacterial genera in seven soil treatments for the Panax notoginseng rhizosphere microbial community. Only the top 20 species in terms of abundance levels are shown, and other species are merged. In the figure, Unclassified represents species that have not been taxonomically annotated. CK represents the control group; J represents different irrigation treatments; F represents different microbial fertilizer treatments.
Agronomy 14 00922 g003
Figure 4. Ternary diagrams: (A) Ternary diagram of the CK, F1, and F2 treatments at the bacterial phylum level. (B) Ternary diagram of the J1, J2, and J3 treatments at the bacterial phylum level. The three corners of the triangle represent three samples, which are represented by three colors, and the three edges are used to measure the species abundance of the corresponding color samples. The circles in the triangle represent the species classification of all genera contained at a certain level, the circle size represents the average relative abundance of the species, and the circle color in the legend represents the species classification with the highest abundance of the five phyla.
Agronomy 14 00922 g004
Figure 5. (A) The number of fungal OTUs in the seven samples. (B) Venn diagram of fungal soil samples from the seven different treatments. CK represents the control group; J represents different irrigation treatments; F represents different microbial fertilizer treatments.
Agronomy 14 00922 g005
Figure 6. Principal component analysis (PCA) of the fungal microbial communities of samples: (A) PC1 vs. PC2. (B) PC1 vs. PC3. (C) PC2 vs. PC3.
Agronomy 14 00922 g006
Figure 7. Fungal community structure in the Panax notoginseng rhizosphere at the phylum and genus levels: (A) Relative abundance of fungal phyla in the seven soil treatments for the Panax notoginseng rhizosphere microbial community. (B) Relative abundance of the fungal genera in the seven soil treatments for the Panax notoginseng rhizosphere microbial community. CK represents the control group; J represents different irrigation treatments; F represents different microbial fertilizer treatments.
Agronomy 14 00922 g007
Figure 8. Ternary diagram: (A) Ternary diagram of the CK, F1, and F2 treatments at the fungal phylum level. (B) Ternary diagram of the J1, J2, and J3 treatments at the fungal phylum level.
Agronomy 14 00922 g008
Figure 9. Effects of irrigation and microbial fertilizer on the incidence of root rot of Panax notoginseng. J represents different irrigation treatments; F represents different microbial fertilizer treatments.
Agronomy 14 00922 g009
Figure 10. Effects of irrigation and microbial fertilizer on yield. J represents different irrigation treatments; F represents different microbial fertilizer treatments.
Agronomy 14 00922 g010
Table 1. Different irrigation and microbial fertilizer treatments of Panax notoginseng soils.
TreatmentsCKJ1F1J1F2J2F1J2F2J3F1J3F2
Irrigation/m30.250.1250.1250.3750.375AlternationAlternation
Microbial
Fertilizer/kg
01.4261.9711.4261.9711.4261.971
Table 2. Alpha diversity metrics of the bacterial communities in the different treated rhizosphere soils. CK represents the control group; J represents different irrigation treatments; F represents different microbial fertilizer treatments.
TreatmentsOTUACEChao1SimpsonShannonCoverage
CK481497.3891514.83330.06354.18250.9994
J1F112791327.43641335.59620.00516.11850.9971
J1F210291057.83961099.02270.02525.24120.9983
J2F113641416.86291428.62710.03885.35270.9968
J2F212221270.55891274.00990.00526.0490.9975
J3F112251240.52591244.61540.00746.00330.9987
J3F211291141.98411153.06980.01665.7010.9989
Table 3. Alpha diversity metrics of the fungal communities in the different treated rhizosphere soils. CK represents the control group; J represents different irrigation treatments; F represents different microbial fertilizer treatments.
TreatmentsOTUACEChao1SimpsonShannonCoverage
CK129219.5933175.42860.04513.92080.9994
J1F1433483.4292473.6250.03044.57070.9996
J1F2758759.3125761.50.00725.76620.9999
J2F1162194.7184189.08330.18983.18320.9996
J2F2363431.0311395.50.01974.89480.9993
J3F1789793.5483798.23080.00675.75970.9997
J3F2252333.4158343.00.03984.1870.9999
Disclaimer/Publisher’s Note: The statements, opinions and data contained in all publications are solely those of the individual author(s) and contributor(s) and not of MDPI and/or the editor(s). MDPI and/or the editor(s) disclaim responsibility for any injury to people or property resulting from any ideas, methods, instructions or products referred to in the content.