Abstract
The European Commission’s “Farm to Folk” (F2F) strategy recommends reducing fertilizers by at least 20% by 2030. In this aspect, the main goal of our study was to verify whether a 20 and even 40% reduction in nitrogen (N) fertilization rate would be sufficient to maintain soil fertility (expressed as dehydrogenase activity—DHA, humic acid substances—HA substances, E4/E6 ratio), and yields of wheat and rapeseed cultivated in strip-till technology. Two fields (10 ha each) were established for wheat and rapeseed cultivation, and soils (0–20 cm) were sampled before sowing and after harvesting. It was found that a 20% fertilization reduction does not adversely affect the biological activity expressed by DHA. Nevertheless, the reduction in nitrogen (N) fertilizer rates led to a slight decrease in the E4/E6 ratio, which could serve as a potential indicator of fertilization reduction. DHA, E4/E6 ratio and content of HA substances were also dependent on the crop. Following harvesting, both rapeseed and wheat exhibited a positive correlation between the E4/E6 ratio and the degree of fertilization rate (FR), as well as yield.
1. Introduction
Modern economic and ecological farming is the subject of numerous discussions, which are aimed at developing technologies that make it practicable to obtain maximum yields while effectively minimizing the emission of harmful pollutants into the environment. Farmers, in collaboration with specialists, often decide to fertilize their farmland artificially, which is not indifferent to the ecosystem. It is worth noting that nature has, for several thousands of years, developed mechanisms to enrich soils with nutrients and minerals, which arouses the interest of agrobiotechnologists.
One of the key processes affecting soil fertility and nutrient abundance is the humification process, which is initiated by the decomposition of organic plant and animal residues by microorganisms: bacteria, fungi and protozoa [1]. These microorganisms are capable of converting complex organic substances into more simple compounds, resulting in the production of a humus layer [2]. Through the transformation and decomposition process, it is loaded with organic matter such as plant residues, roots, mosses and other organic matter in varying degrees of decomposition, which, in addition to humification, also undergoes mineralization [3]. As a result of all the biological, chemical and physical processes, a complex group of organic substances called humus is formed in the humus layer [3]. The humus components are humic acids, fulvic acids and low molecular weight humic substances. These substances are persistent and play a fundamental role in improving soil structure, providing nutrients to plants, retaining water and supporting soil biodiversity [3].
One of the European Union’s objectives is to reduce the use of the plowing system which, in addition to increasing greenhouse gas emissions consequences in soil aeration, accelerates oxidation processes and the mineralization of humic acids [4]. The introduction of numerous variants of the no-till system in place of the plowing, such as strip-till, will reduce interference with the soil ecosystem and maintain the soil’s physico-chemical and biological balance [4,5]. Jaskulska et al. [5] concluded that no-till technologies contribute to the enrichment of soils in maintaining the values of total organic carbon and total nitrogen. Consequently, the contents of carbon and nitrogen in the fractions of humic and fulvic acids are higher in soils from the no-till system than obtained from the plowing system.
Microorganisms are required for many biogeochemical cycles, and their metabolic activity is recognized as a key element in the functioning of the soil ecosystem [6]. A proper balance of the soil microbiome is important for maintaining soil fertility, vitality and sustainable functioning [6,7]. To verify the microbial activity, it is common practice to measure dehydrogenase activity (DHA), which is considered a marker of soil health and fertility as an increase in DHA is usually associated with an increased abundance and activity of microorganisms [8]. Importantly, soil dehydrogenases have a significant impact on the decomposition of organic matter in soils, including nitrification and denitrification processes and they affect humic acid (HA substances) [9]. Soil microorganisms synthesize dehydrogenases which participate in the decomposition of organic matter and lead to the breakdown of organic substances and at the same time to the formation of for example HA substances [9]. The soil bacteria and fungi demonstrate diverse rates of DHA. The analysis of this activity may help to understand the dominant microbial groups in a given soil and contribute to the assessment of its biodiversity [10]. The value of DHA is also dependent on environmental conditions, including pH, temperature, oxygen availability and soil moisture [9,11,12]. The assessment of soil fertility is based on a variety of physico-chemical tests that identify different soil properties and provide information about the soil’s ability to support plant growth and maintain plant vigor, as well as giving an appreciation of the diversity of the soil micro- and mycobiome [13,14].
The European Commission’s “Farm to Folk” (F2F) strategy recommends reducing fertilizer use by at least 20% by 2030. It should be noted that a factor of E4/E6 was added to the analysis, which enriched the inference of the degree of condensation and humification of organic matter. This parameter determines the ratio of optical density (absorbance) of dilute solutions of HA substances determined spectrophotometrically at 465 and 665 nm wavelength (E4/E6). The E4/E6 ratio is related to the molecular weight of humic substances, it is a good indicator of the size of the molecules present in solution, reliable and easy to measure. What is more, the E4/E6 ratio is applied to characterize the different humic samples providing an estimate of the molecular weight (MW) and the composition of the molecules they contain. It varies inversely with the molecular weight of the particles [15]. Particles of high MW (humic acids) have a low ratio (E4/E6 < 5), and those of low MW (fulvic acids) have a high ratio (5 < E4/E6 < 10).
Consequently, the main goal of the study was to monitor the levels of DHA, HA substances level and E4/E6 ratio in the two experimental fields where wheat and rapeseed were cultivated under strip-till technology and conditions of reduced N fertilization (according to European Union recommendation). It was hypothesized that both DHA, E4/E6 ratio, and content of HA substances can be indicators not only of microbial activity and soil fertility but also could indicate sensitivity to reduced N fertilization and could be dependent on the crop.
2. Materials and Methods
2.1. Strip-Till Technology
The field experiment was carried out in the arable fields (Luvisols, class IIIb) of the CGFP Ltd. located in Sicienko (53°12′32.2″ N 17°46′45.4″ E (rapeseed) and 53°13′11″ N 17°48′45″ E (wheat) in NW Poland (Kujawsko–Pomorskie Voivodeship). Tested farmland was cultivated using strip-till technology that involves tilling only a narrow strip of soil where the crop will be planted, leaving the rest of the field undisturbed. This is in contrast to conventional tillage, where the entire field is plowed or tilled. Minimal soil disturbance contributes to improved soil health [16]. The undisturbed areas allow for the development of a diverse and robust soil ecosystem. Compared to traditional tillage practices, strip-till requires less energy and fuel. This can lead to cost savings for farmers and also has environmental benefits by reducing carbon emissions and greenhouse gases [17].
2.1.1. Method of Wheat Cultivation
After harvesting the pre-crop (rapeseed), a very shallow tillage was applied at about 5 cm with a disc harrow. The soil for sowing was prepared using a professional Köckerling Master machine, which is adapted for strip sowing and guarantees deep loosening to about 25 cm, with a colter spacing of 30 cm. During one pass, the Master loosens the soil (due to the richness of the soil and the value of the pre-crop residue, phosphorus and potassium fertilization was abandoned), and the seeder sows the seeds at a row spacing of 15 cm. PK (phosphorus and potassium) targeted fertilization is an agrobiotechnology approach that aims to optimize the delivery of these two key nutrient elements to plants to improve their growth, productivity and ability to adapt to the environment. P and K are essential for various processes in the plant life cycle, such as root development, flowering, seed maturation and resistance to environmental stresses [18]. On properly prepared agricultural land, winter wheat of the RTG Kilimanjaro (RAGT brand) variety was sown, as it has high resistance to frost and is particularly resistant to fungal diseases such as brown rust, septoria and Fusarium sp. head blight.
2.1.2. Method of Rapeseed Cultivation
As in the case of wheat, a Köckerling Master was also used, maintaining the same loosening depth (25 cm). Thanks to the built-in Köckerling Boxer seeder, the Master is capable of evenly loosening the soil and dispensing fertilizer during a single pass. Fertilizer at a rate of 50% of the dosage was applied at the depth of the crop and at a depth of approximately 0–15 cm. Simultaneously with fertilizer dosing, seeds of a winter oilseed rape variety Excited were sown at 45 cm row spacing using a drill. DK Exited (DEKALB brand) oilseed rape is a high-health variety resistant to turnip yellow virus (TuYV). The variety is also distinguished by its high seed oil content and its resistance to seed bursting and seed drop. The low elongation before winter provides the plants with very good winter hardiness.
2.2. Fertilization Strategy
The rapeseed and wheat fields in the 2022/2023 season were treated with N fertilizers according to the instructions summarized in Table 1 and Table 2.

Table 1.
Nitrogen fertilization strategy for winter wheat cultivation in 2022/2023 season.
Table 2.
Nitrogen fertilization strategy for winter rapeseed cultivation in 2022/2023 season.
NPK-directed fertilization stands for the strategy of supplying soils with three basic nutrients: N, P, K. The aim of this nutrient application was to optimize the availability of N, P, K which are crucial for healthy growth, flowering, fruiting and overall productiveness of the crop. The implementation of a responsible fertilization policy has numerous benefits for food safety, as it will contribute to the production of higher-quality food, but with reduced amounts of harmful substances. Optimal fertilization can also increase agricultural yields, improve food production and minimize the risk of soil and water pollution. Furthermore, conscious fertilization management supports sustainable farming practices, contributing to the protection of ecosystems and maintaining environmental balance [19]. Importantly, for wheat cultivation, no autumn fertilization was carried out.
2.3. Soil Sampling
The scheme of a single field with a description of the reduced fertilization pattern and rules of soil sampling is presented in Figure 1. The large-scale area of agricultural soils (20 ha) is managed by the CGFP Ltd. (Potulicka Foundation’s Economic Center). and dedicated to the current experiment is a guarantee of the representativeness of the obtained results. CGFP Ltd. agricultural acreage is predominantly (>95%) mapped using GPS, and the precision farming system is successfully applied in the whole area hence, precise doses of fertilizers were applied and samples for analysis were collected from the same places [20]. Soil samples were taken in accordance with PN-R-04031:1997.
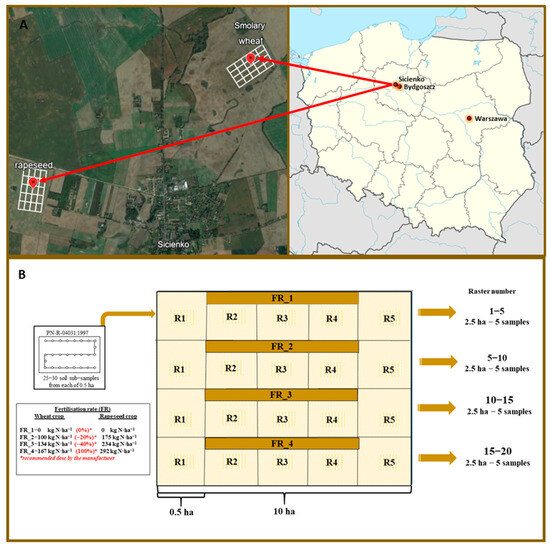
Figure 1.
(A) The map of the study region, (B) The scheme of soil sampling from the two fields (10 ha each) where wheat and rapeseed were cultivated.
Within each of the 10 ha fields (Figure 1), 2.5-ha plots were exposed to the following N treatments: (1) control sites with no fertilization (0%, Fertilization Rate—FR_4) from which 5 rasters were taken and variable N rates, (2) amount based on soil properties and manufacturer recommendation to crop requirements (FR_1 treated as 100%) represented by 5 rasters, (3) standard fertilizer rate reduced by 20% in respect to FR_1 (in agreement with the EC directive, FR_2) represented by 5 rasters, and (4) standard fertilizer rate reduced by 40% in respect to FR_1 (also 5 rasters, FR_3).
The greatest possible representativeness of the soil material was guaranteed by the single soil sub-sampling from 25–30 randomly selected sites from each experimental “microplot” (0.5 ha area) separated from the 2.5 ha plot (Figure 1). Finally, twenty soil samples represented the wheat field, whereas another twenty samples pertained to the rapeseed field. Importantly, soil samples before sowing were taken before the fertilizer application so that the freshly applied fertilizer could not disturb the tested values [20].
2.4. Determination of the Soil Chemical Features
Soil acidity (pH), redox potential (Eh) and electric conductivity (EC) were determined from a 1:2.5 soil suspension (10 g of soil, 25 mL of water) prepared in distilled water. An automatic multifunctional potential meter HQ40d equipped with a proper measuring electrode: C301, MTC101, and CDC401 (Hach, Loveland, CL, USA) for pH, Eh and EC, respectively, was applied [20].
The cation exchange capacity (CEC) is the sum of all base cations (Ca2+, Mg2+, K+, Na+) and acid cations (H+, Al3+) absorbed by the soil. Briefly, 20 g of dry soil was weighed into 250 mL flasks in triplicate and 100 mL 1 M CH3COONa (pH 8.2) was added for hydrolytic acidity (Hg) measurement, and 100 mL 0.1 M HCl was added for determination of base cations (BS). The mixtures, after shaking for one hour were filtered through strainers and 25 mL of each of the clear permeates was taken. Each of the samples received 3–4 drops of 0.1% phenolphthalein and was titrated with 0.1 M NaOH until a slightly pink color appeared. CEC was calculated by adding the sum of BS to hydrolytic acidity according to the following formula CEC = BS + Hg (cmol·kg−1).
2.5. Measurement of Dehydrogenase Activity (DHA) in Soil Samples
DHA was marked according to the method of Casida et al. [21], using a UV-VIS spectrophotometer [UV-1800 UV/Visible Scanning Spectrophotometer, Shimadzu, Japan]. The first step was to weigh 6 g of soil each in triplicate. Then 120 mg of calcium carbonate, 2 mL of distilled water, and 1 mL of 3% triphenyltetrazolium chloride (TTC) were added to each sample. TTC was reduced by dehydrogenases to triphenylformazan (TPF), providing a reddish color [22]. The samples were incubated for 24 h in the dark at 30 °C. The next day, 25 mL of ethanol was added to each sample and stored for 1 h in the dark. After an hour’s incubation, it was possible to observe the color change in the samples. Spectrophotometric measurement was performed at the wavelength of 485 nm, which provided information about the activity of the dehydrogenases. The higher the enzyme activity, the greater the reduction in TTC and the stronger the absorbance signal.
2.6. Assessment of the Content of Humic Acid (HA) Substances in Soils
The isolation of HA substances was carried out according to the method of Kononova and Belchikova [23] with modifications. For this purpose, 25 g of soil was weighed in three repetitions into falcons (50 mL). Then 25 mL of NaOH was added and shaken for 4 h at 25 °C. The samples were centrifuged at 9000 rpm (10 min) in a Sigma 3–18K Refrigerated Centrifuge. The supernatant was poured into clean falcons and acidified with 1 M HCl to set pH < 2. After centrifugation (12,000 rpm, 10 min) the sediments were rinsed with water at pH 1 and transferred to previously weighed paper filters. The HA precipitate was stored (4 °C, dark) until use.
The susceptibility of HA-like substances to oxidation was performed using the spectrophotometric method according to Janowiak [24]. First, 0.01 g of HA substances were weighed into 100 mL flasks and poured with 50 mL of 0.005 M NaHCO3 solution. and 5 mL of 5% H2O2 were added. The samples were incubated in the dark and the absorbance (at λ = 465 and λ = 665 nm, BioSpectrometers, Eppendorf, Hamburg, Germany) was measured after 1, 6, and 24 h. According to the methodology, control samples were prepared, to which 5 mL of dissolved sediments of HA substances and 5 mL of distilled water were added. The HA fractions were estimated based on the E4/E6 (ratio of the absorbances at 465 nm and at 665 nm).
2.7. Statistical Analysis
The data were statistically processed using RStudio software (version 4.3.1, R Foundation, Vienna, Austria) [25]. To assess the influence of fertilization level on DHA or HA-like substances, the Kruskal–Wallis test with post hoc Dunn test was applied (ggplot2, FSA, and ggstatsplot packages), examining differences in group means across each level of the independent variable. Furthermore, the variation in the studied parameters across different terms of the vegetation season was evaluated using ANOVA statistical analysis (implemented with ggplot2 and car packages). Then, a correlation analysis was conducted by calculating either Person’s or Spearman’s rho coefficient, depending on data normality. A correlation matrix was prepared using RStudio software (corrplot package).
3. Results
3.1. Soil Chemical Characteristic
To determine the effect of reduced N fertilization on soil quality and fertility, full-scale analysis of soil material was carried out for both rapeseed and wheat field samples (Table 3 and Table 4, respectively) undertaken during the vegetation season (before sowing 2022, after harvesting 2023).
Table 3.
Physico-chemical parameters of soil and average rapeseed yield (mean values of three replicates ± standard deviation, N/A—not applicable).
Table 4.
Physico-chemical parameters of soil and average wheat yield (mean values of three replicates ± standard deviation, N/A—not applicable).
Within the applied N fertilization rates, a decrease in the pH was confirmed in samples after harvesting rapeseed (Table 3). For after-harvesting samples, the highest pH value was found for soil samples with a 40% reduction in nitrogen fertilization (FR_2), and the lowest for samples with a KE-recommended 20% reduction (FR_3), which were, respectively: 6.41 and 6.27.
Moreover, the results for soil samples before sowing rapeseed and after harvesting showed a decrease in values for FR_3 samples from 6.60 to 6.27. The values of Eh and EC achieved relatively higher values after harvesting than before sowing, regardless of the FR (Table 3).
CEC of rapeseed soil samples showed that in the case of samples taken before sowing, the parameter goes up in accordance with the increasing dose of N fertilization from 7.95 cmolc·kg−1 (FR_1) to 14.04 cmolc·kg−1 (FR_4).
The opposite situation was observed after harvesting, where the highest value of CEC was held by unfertilized samples and equals 11.11 cmolc·kg−1 (FR_1), whilst the lowest (10.56 cmolc·kg−1) occurred in the FR_4 variant (Table 3).
In the case of wheat fields (Table 4), an increase in the value of the pH was observed in relation to the soil samples before sowing in all FR in the soil samples after harvesting.
The reduction in fertilization (FR_3) resulted in pH decrease with respect to the unfertilized samples (FR_1), but acidity remained higher than the average pH obtained for the samples treated with the maximum nitrogen dosage (FR_4) which amounted to 7.08.
Higher values with respect to FR_4 were also recorded for the Eh and EC (Table 4). Only in the case of CEC, we found that a 20% N fertilization reduction contributed to a decrease in values in relation to the soil samples with the maximum FR, i.e., from 20.77 to 20.20 cmol(+)·kg−1, noteworthy that the CEC value for samples FR_4 was the highest value within the investigated fertilization treatments (Table 4).
By quantitative measurement of HA substances in the 2022/2023 season, it was found that soils on which rapeseed was planted were more resourceful than soils from wheat cultivation (Table 4). Soils after harvesting rapeseed were characterized by a higher amount of HA substances compared to values obtained for samples before sowing the crop. A 20% reduction in nitrogen fertilization recommended by the European Commission for rapeseed resulted in an increase in HA substances relative to the maximum fertilization rate—the amounts were 577.81 g·kg−1 (FR_3) and 331.84 g·kg−1 (FR_4), respectively. In the case of the wheat crop, there was an increase in the amount of humic substances relative to samples before sowing for rasters 1–5 (FR_1), 11–15 (FR_3), and 16–20 (FR_4). The highest amount of HA substances was characterized by the samples with the maximum fertilization rate 221.65 g·kg−1, while the lowest amount was renewed for the samples on which a 40% reduction in nitrogen fertilization was applied (FR_2) and reached 122.13 g·kg−1.
In addition to the quantitative analysis of isolated HA substances (Table 3 and Table 4), within the framework of soil fertility assessment, it is essential to underscore the qualitative examination of HA substances. This involves scrutinizing the degree of humification of organic matter, a process determined by assessing the E4/E6 ratio of the soils under investigation. A detailed exposition of these findings is provided later in this paper.
3.2. Soil Dehydrogenase Activity
The rate of DHA determined in 20 rapeseed soil samples before sowing (2022) and 20 after harvesting (2023) are shown in Figure A1. However, for more comparative analysis Figure 2 was prepared that illustrated an averaged DHA level noted for each fertilization combination. DHA in the soil samples collected before sowing and after rapeseed harvesting unequivocally indicate that microorganisms were significantly (p < 0.001) more active in soils after rapeseed harvest than before sowing. However, there were no statistically significant differences between DHA and N fertilization rates (p > 0.05).
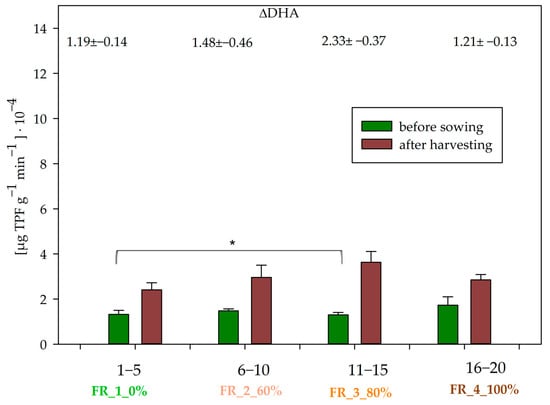
Figure 2.
Averaged DHA results under the fertilization rule (Table 1) for rapeseed soil samples before sowing (2022) and after harvesting (2023)—bars on the graph show the standard deviation.  —links sample pairs that are statistically different, p < 0.05 *. Δ—means parameter change in relation to the control (before sowing).
—links sample pairs that are statistically different, p < 0.05 *. Δ—means parameter change in relation to the control (before sowing).
Anyhow, it should be pointed out that a 20% N reduction resulted in a DHA increase of 27% (Figure 2). What is more, even a 40% reduction in fertilization (FR_2) did not adversely affect DHA, as there was an increase in enzymatic activity of 3.8% compared to the standard dose (FR_4) dedicated to rapeseed cultivation. In the case of unfertilized samples (FR_1), which were not treated with fertilizer DHA reached the lowest level However, these differences were not statistically significant (p > 0.05). Significant differences in DHA, however, were shown between FR_1 and FR_3, where the reduction in fertilization was 20% (p < 0.05) (Figure 2).
The values of the DHA determined for 20 soil samples before sowing and 20 after harvesting wheat are presented in Figure A2. In order to compare the results of DHA, the averaged results are presented (Figure 3). A similar trend of enzymatic activity from the rapeseed crop was obtained, the value of DHA from wheat fields was higher after harvesting than before sowing (p < 0.001) and there were no statistically significant differences between DHA and N fertilization rates (p > 0.05).
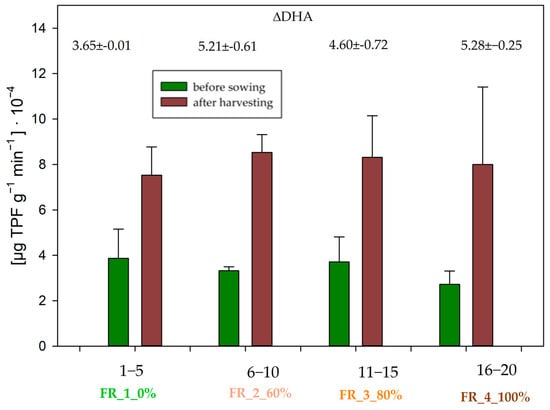
Figure 3.
Averaged DHA results under the fertilization rule (Table 1) for wheat soil samples before sowing (2022) and after harvesting (2023)—bars on the graph show the standard deviation. Δ—means parameter change in relation to the control (before sowing).
Fertilization reduction of 20 and 40% in the wheat cultivation variant also did not negatively affect DHA, on the contrary, an increase in enzymatic activity of 4 and 6.6% was observed in samples FR_3 and FR_2, respectively (Figure 3).
3.3. The Assessment of the E4/E6 Ratio of Humic-Acid Substances
The value of E4/E6 determines the ratio of substances in the initial stage of decomposition to those in advanced humification. It is assumed that the value of the E4/E6 ratio is inversely proportional to the degree of condensation of aromatic rings in the molecules of humic substances and/or the molecular weight of humic acids.
The value of the E4/E6 ratio in the 20 soil samples taken from fields where rapeseed was grown is demonstrated in Figure A3; meanwhile, the averaged values of this parameter, in turn, are illustrated in Figure 4.
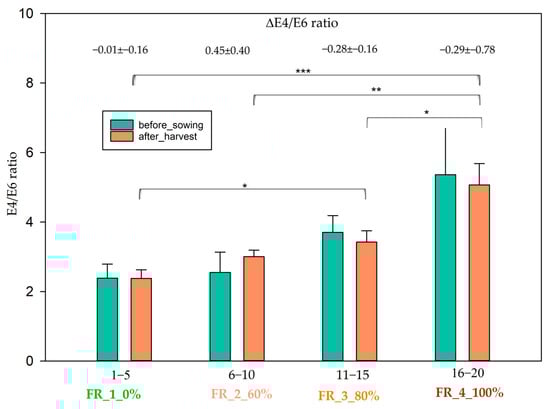
Figure 4.
The E4/E6 ratios for soil samples collected from under the rapeseed crop (before and after the crop is harvested)—bars on the graph show the standard deviation. Δ—means parameter change in relation to the control (before sowing). —links sample pairs that are statistically different, p < 0.001 ***; p < 0.01 **; p < 0.05 *.
—links sample pairs that are statistically different, p < 0.001 ***; p < 0.01 **; p < 0.05 *.
Samples taken from unfertilized fields (FR_1) had the lowest E4/E6 (2.38). Results from fields treated with 40% reduced N fertilization rates (FR_2) and 20% (FR_3) reached a similar level of E4/E6 ratio (3.00 and 3.42, respectively). Soil samples under treatment with the maximum N application rate displayed a 5.06 ratio value (Figure 4). The E4/E6 ratio was significantly different depending on the FR (p < 0.001).
Analysis of the effect of reduced fertilization showed a significant effect of fertilizer dose on the E4/E6 ratio between the recommended N fertilizer dose (FR_4) and all other probes where FR was applied (FR_3 p < 0.05, FR_2 p < 0.01, FR_1 p < 0.001). Furthermore, the E4/E6 ratio differed significantly between the FR_3 and FR_1 probes (p < 0.05), (Figure 4). However, there was no significant correlation between the E4/E6 ratios and the terms of vegetation (p > 0.05). However, the differences between the value of the E4/E6 ratio before sowing and after harvesting were expressed as Δ in Figure 4. In the case of the recommended N dose (FR_4) and its 20% reduction (FR_3), the value of the E4/E6 ratio after harvesting rapeseed seemed to be lower than before sowing by almost 0.3 (Figure 4).
The level of the E4/E6 ratio in the studied soil samples taken from fields where wheat was grown is demonstrated in Figure A4; meanwhile, the averaged values of this factor are illustrated in Figure 5.
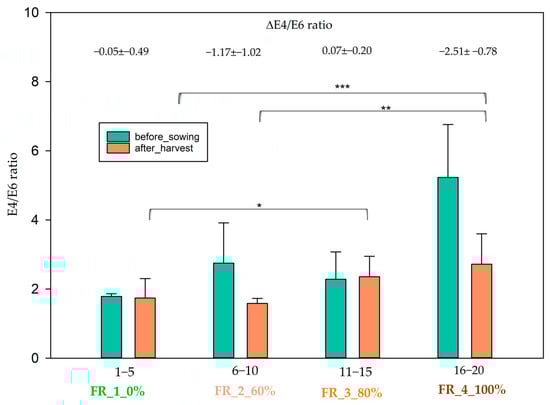
Figure 5.
The E4/E6 ratios for soil samples collected from under the wheat crop (before and after the crop is harvested)—bars on the graph show the standard deviation. Δ—means parameter change in relation to the control (before sowing). —links sample pairs that are statistically different, p < 0.001 ***; p < 0.01 **; p < 0.05 *.
—links sample pairs that are statistically different, p < 0.001 ***; p < 0.01 **; p < 0.05 *.
Soil samples taken after the wheat harvest show a similar trend to those taken after sowing rapeseed. The E4/E6 ratios reached the lowest level (1.654) for the unfertilized samples (FR_1) and the highest (3.057) for the samples where maximum N fertilization dosage (FR_4) was applied. For the remaining samples, it was determined at the level of 1.82 and 2.34, for variants with reduced fertilization by 40% (FR_2) and 20% (FR_3), respectively (Figure 5). In the case of the wheat crop, analysis of the effect of reduced fertilization on the E4/E6 ratio also showed variation between groups (fertilizer doses). In samples where the recommended dose of N fertilizer was applied (FR_4), the E4/E6 ratio was significantly higher than in unfertilized samples (FR_1) (p < 0.001) and in samples where fertilization was reduced by 40% (FR_2) (p < 0.01). Additionally, significant differences were observed between FR_3 and FR_1 (p < 0.05), (Figure 5). The value of the E4/E6 ratio also differed significantly in terms of the vegetation season—before sowing and after harvesting (p < 0.05). Moreover, this relationship was also expressed by the ΔE4/E6 ratio, with the most pronounced discrepancy of about 2.5 being observed in the FR_4 samples (Figure 5).
3.4. Correlations among Factors Studied
Correlograms depicting the relationships among the investigated parameters for rapeseed and wheat crops, each analyzed separately after harvesting, are shown in Figure 6 and Figure 7, respectively.
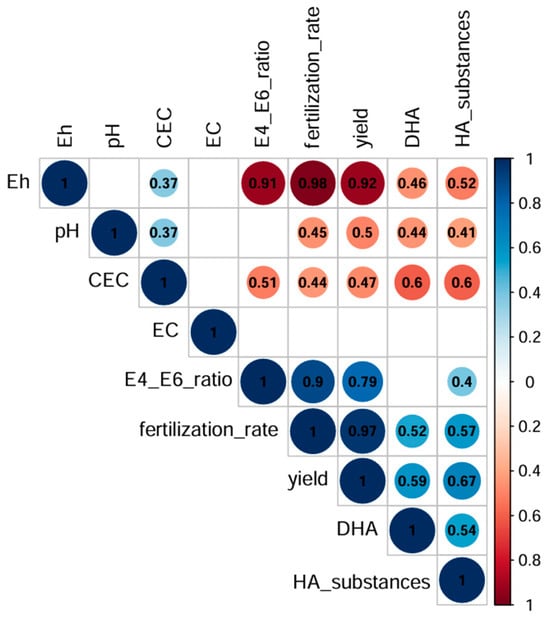
Figure 6.
Correlogram between the studied parameters for the rapeseed crop after harvesting (n = 120, correlation is significant at the 0.01 level).
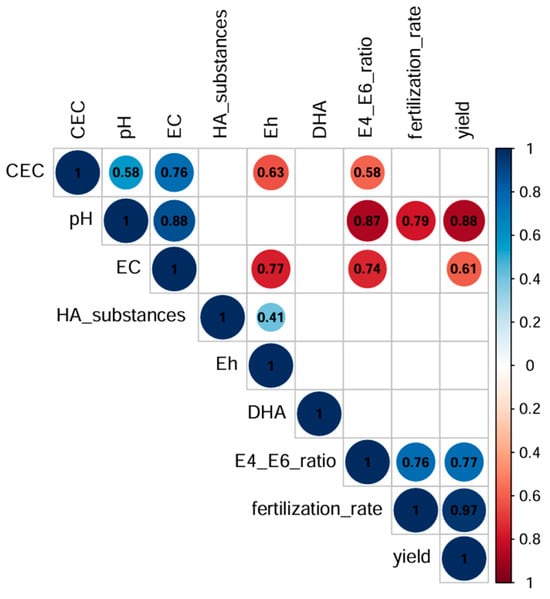
Figure 7.
Correlogram between the studied parameters for the wheat crop after harvesting (n = 120, correlation is significant at the 0.01 level).
In addition, statistical analysis of the entire dataset, encompassing both crops and including before-sowing and after-harvest data, enabled a comprehensive assessment of the strength and significance of the relationships among the variables under investigation (Figure A5).
Based on all results obtained, it was indicated that DHA depends proportionally on pH, CEC, and yield, inversely proportionally on EC, E4/E6 ratio, and amount of HA substances (Figure A5). Statistical tests also revealed that HA-like substances and E4/E6 ratio are positively correlated with each other. HA substances were also positively dependent on EC. Analyzing the entire dataset (for wheat and rapeseed combined), a correlation of the soil parameters with FR was found (Figure A5). Such a correlation was shown by conducting statistical tests separately for each of the tested crops after harvesting as demonstrated in Figure 6 and Figure 7. In this case, high correlation coefficients testify to the significant effect of applied fertilization on various physicochemical parameters, including mainly those related to HA substances. In addition, analysis of HA-like substances in the context of yield indicates a high positive correlation of these factors with each other (E4/E6 ratio, HA substances and yield), (Figure 6 and Figure 7).
With respect to rapeseed cultivation (Figure 6), it was confirmed that DHA, HA substances, E4/E6 ratio and yield are positively correlated with FR; meanwhile, negative relationships were noted between FR and Eh, pH, and CEC. Importantly, positive synergism was revealed with respect to DHA and HA substances but only in the rapeseed field (Figure 6). For wheat cultivation, it was found that FR affected positively on E4/E6 ratio, whereas negatively on pH (Figure 7). Wheat yields were dependent on pH and EC (negative correlations) and E4/E6 ratio and FR. HA substances in this case were positively correlated only with Eh. Any dependencies were not noted between DHA and HA substances (Figure 7).
4. Discussion
In order to optimize soil conditions, studies on individual parameters should be implemented, which include the physicochemical, agroclimate, and topography characteristics combined with biodiversity. Such a comprehensive metadata set would create a kind of data library, which, using artificial intelligence and various IT solutions, would facilitate the prediction and selection of an appropriate cultivation strategy and afterward support farmers in drawing correct conclusions from the vast amount of data [26,27].
4.1. F2F Strategy
The F2F strategy is one of the key elements of the European Green Deal and is aimed at creating a fair, safe and ecological agricultural and food production system—one of the main assumptions of the entire initiative is to reduce greenhouse gas emissions by 55% by 2030 [28]. The actions that will be taken are aimed at ensuring the sustainable use of natural resources and restoring the best possible condition of soils, protecting the microbiome and mycobiome of the soil environment, as well as protecting food against excess pesticides and reducing fertilization [29,30]. Modern agriculture faces the challenge of introducing more sustainable resource management, taking into account crop yields, environmental protection and public health. Mineral fertilization, which is the standard practice, promotes crop yields by providing essential nutrients to plants [31]. However, improper or excessive use of mineral fertilizers can generate a number of risks and can lead to groundwater and surface water pollution, which in turn affects aquatic ecosystems and public health [19,31,32].
4.2. Chemical and Biological Factors Affecting Yields
Achieving an impressive yield and maintaining great plant vigor is closely associated with crop-specific optimum chemical parameters. One of the most essential and significant of these is the pH, which determines the acidity or basicity of the soil. The optimum pH for most agricultural crops remains between 6 and 7.5 [33] as was in our experiment fields. Soil pH has an influence on the availability of plants’ nutrients and the activity of soil microorganisms [33], and consequently DHA. Włodarczyk et al. [34] indicated maximum DHA at pH 7.1, similar to the work of Ros et al. [35], where optimum DHA was noted for pH 7.6–7.8. Also, Brzezińska et al. [36] reported that the best pH conditions for DHA ranged between 6.6 and 7.2. The mentioned ranges remain in agreement with the pH noted in the majority of the studied soil rasters (Table 3 and Table 4) which indicates that DHA was rather not limited by unfavorable pH. Wheat, being one of the world’s most important crops, prefers neutral to slightly acidic soils. The optimum pH for wheat is usually in the range of 6 to 7.5, whereas studies have shown that a pH of 6.8 is the most favorable for the crop [37]. In such an environment, wheat can efficiently take up essential nutrients, which contributes to its healthy growth and productiveness [37]. In the examined soil samples, it can be seen that pH values are within the optimum range in all samples before wheat sowing. Rapeseed, as a cruciferous crop, prefers soils with a slightly lower pH compared to wheat. In general, rapeseed grows best in well-drained soils with a pH between 5.5 and 7; however, it has a tolerance to more alkaline soils and can be grown under a pH ranging from 8.3 to 8.5 [38]. Measurements of soil pH before sowing and after harvesting of rapeseed crops revealed that the results were within the optimum range for this type of crop (Table 3). Such pH conditions favor the uptake of nutrients, especially micronutrients, by the rapeseed, which can affect its healthy growth.
The redox potential influences the availability of oxygen for plant roots and the chemical processes taking place in the soil. The optimum Eh range for most agricultural crops oscillates between −100 and +500 mV, and by keeping this range, plants can efficiently utilize oxygen availability for the proper functioning of the root system and carry out essential metabolic processes [39]. Eh and pH reactions are considered to be crucial for the maintenance of all living organisms, and they respectively and collectively are the primary factors that guarantee favorable soil conditions and thus crop yields. Furthermore, they serve as important parameters of biological activity [39]. Eh in tested soils, season and crops remained within 235.39–252.57 mV before sowing and 457.76–550.84 mV after harvesting (Table 3 and Table 4), which corresponds to optimal Eh values for the soil environment, so it was also not a limiting parameter for the biological activity, fertility or yield of these soils.
Soil EC is an important physicochemical parameter in the cultivation of agricultural plants because it reflects the content of minerals and salts dissolved in the soil, which in turn determines the ability of plants to absorb water. According to Mat Su and Adamchuk [40], the EC of soils is closely related to their salinity, texture and the CEC parameter. Optimal EC values for soil depend on the type of soil and crops grown, but are usually in the range of 500 to 3000 µS/cm. If EC is lower than <600 µS/cm, the soil can be classified as non-saline [41]. The soils tested in the experiment achieved values below this value, which may be a sign of reduced mineral content in the soil, which may require the use of fertilizers or improved water retention in the soil.
4.3. E4/E6 Ratio
It should be pointed out that in the case of rapeseed soil samples, the E4/E6 ratio maintained a similar value during the season. In the case of wheat soil samples, the disparity between the results obtained was statistically significant, which raises interest, because DHA was characterized by much higher values than in rapeseed soil samples. This may indicate that wheat cultivation has a more favorable effect on the biological properties of agricultural land—not only on DHA, but also on respiratory activity and biomass growth [42]. Intriguingly, despite the high activity of oxyreducing enzymes, the value of the E4/E6 ratio in soils after wheat cultivation was significantly lower compared to soils after rapeseed harvest; nevertheless, it is concluded that the presence of humic substances has a significant effect on the enzymatic activity of dehydrogenases and other soil enzymes. The different fractions that make up the humic layer can have an inactivating effect on their action—the enzymes are incorporated into the structure of the humic substance molecule [43].
The utilization of the E4/E6 ratio is contingent upon the level of condensation and aromaticity within the humic substance as well as the extent of its humification. Schnitzer [44] proposed that the E4/E6 ratio is less than 5 for humic acids (HA), while for fulvic acids (FA), it falls within the range of 6 to 8.5. Consistent findings have been observed in other studies, indicating values approximately between 5.44 to 5.70 for HA and 8.88 to 9.90 for FA [45]. Higher values of the E4/E6 absorbance coefficient (>5) recorded for HA substances extracted from most of the tested soils where 0% reduction in N fertilization was applied (FR_4) indicated that the isolated substances are characterized by a higher proportion of aliphatic structures (more susceptible to oxidation), and have a lower molecular weight compared to HA substances of soils where reduced nitrogen fertilization was applied. In contrast, in other FR treatments, the E4/E6 ratio falls below 5. The lower (about 1.50–3.00) values of the absorbance coefficient noted in most of the soils analyzed testify to the presence of mature and well-formed humic acids. Such values are characteristic of soils fertilized exclusively with mineral fertilizers [46,47,48].
4.4. Soil Enzymatic Activity
Furthermore, HA substances may affect microorganisms, causing loss or weakening of catalytic properties of extracellular enzymes synthesized by them [48,49]. The influence of HS over soil enzyme functions is determined by numerous environmental factors, most notably pH and HS-enzyme ratio [46,48,49]. Enzymes belonging to the oxyreduction group, such as malate dehydrogenase and glutamate dehydrogenase, undergo competitive inhibition and are reactivated when the enzyme concentration becomes heightened [50,51,52].
Bacterial soil enzymes are responsible for many catalytic reactions involved in the metabolism, humification process and regulation of the availability cycle of key elements and nutrients [53,54,55]. Enzymes produced by soil microorganisms directly affect the quality and yield—dehydrogenases fulfill the function of indicators of soil health, the abundance and activity of the bacterial consortium, because they are active only in living organisms and are not released outside the cell [10,53,56]. In addition, they can be used as a measure of disturbance caused by pesticides, trace elements or inadequate soil management practices [55]. Our results proved that DHA testified about the soil quality and reached a higher level in autumn (at the end of the vegetation season) than in spring and the beginning of the vegetation season. What is more, we evidenced that DHA depends on the crop as higher DHA was noted in soils under wheat cultivation rather than in rapeseed. Consequently, it is possible to conclude that wheat cultivation favors DHA maintenance. This is in agreement with previous findings [43], that wheat cultivation has a more favorable effect on the maintenance of biological properties than oat cultivation, as confirmed by the higher indices of dehydrogenase and respiration activities, microbial biomass and DNA content recorded on sites where wheat was grown [43].
The aspiration under the European Green Deal activities is to reduce the use of not only mineral fertilizers, but also antibiotics and pesticides [55]. The use of enzymes such as dehydrogenases may contribute to effective soil monitoring and designing appropriate cultivation strategies to ensure environmental safety and financial security for farmers [29,30,57]. With the use of biological and physicochemical parameters, this can become the basis for long-term research to control and monitor the condition of soils and verify suggested solutions to improve the natural and agricultural environment. The agricultural environment is an integral part of the ecosystem, the sustainability of which is essential for the survival of mankind. Long-term studies provide a way to be able to monitor the impact of agricultural activities on the environment and identify methods to improve productivity while minimizing negative impacts on the ecosystem [26,28,58].
5. Conclusions
Our results clearly indicated that reducing N fertilizer application both in rapeseed and wheat crops resulted in a decrease in the E4/E6 ratio, which suggests that the analysis of HA substances content in arable soils and the determination of the E4/E6 index could serve as a valuable tool for assessing soil quality during N fertilizer reduction.
DHA was dependent on the crop. More statistically significant relationships between DHA and the factors studied were found in the field with rapeseed than wheat crops. In the rapeseed field, DHA displayed positive correlations with FR, yield and HA-like substances which proves that DHA maintains soil fertility, stimulates yields, and demonstrates synergism with HA substances. At any rate, the aforementioned relationships were not confirmed for wheat, where yields depended mainly on FR and the E4/E6 ratio (positive correlations) and pH, EC (negative correlations); meanwhile, no significant correlations were determined for DHA.
Generally, it could be concluded that a 20% reduction in the application of N fertilizer (according to the F2F strategy) does not adversely affect the biological activity expressed by DHA. Nevertheless, the reduction of N fertilizer rates led to a slight decrease in the E4/E6 ratio, slowing down the decomposition of organic matter and the production of fertile and humus-rich soils. At any rate, more studies extended to other crops should be conducted to establish the existence of synergism between the studied factors and soil fertility.
Author Contributions
Conceptualization, A.W., K.K. and W.G; Methodology, K.K., A.K. (Anna Kruczyńska), W.G., A.K. (Agnieszka Kuźniar) and A.S. (Anna Sochaczewska); Software, W.G. and A.K. (Agnieszka Kuźniar); Validation, W.G., A.K. (Agnieszka Kuźniar) and A.S. (Andrzej Słomczewski); Formal Analysis, A.W., W.G. and A.K. (Agnieszka Kuźniar); Investigation, K.K., A.S. (Anna Sochaczewska), A.K. (Anna Kruczyńska) and A.S. (Andrzej Słomczewski); Resources, A.S. (Andrzej Słomczewski); Data Curation, W.G., A.K. (Agnieszka Kuźniar) and K.K.; Writing—Original Draft Preparation, K.K., W.G. and A.K. (Agnieszka Kuźniar); Writing—Review & Editing, A.W. and A.S. (Andrzej Słomczewski); Visualization, W.G. and A.K. (Agnieszka Kuźniar); Supervision, A.W.; Project Administration, A.S. (Andrzej Słomczewski); Funding Acquisition, A.W. All authors have read and agreed to the published version of the manuscript.
Funding
This scientific work was supported by the Agency for Restructuring and Modernization of Agriculture under the action “Cooperation” (Nr 00019.DDD.6509.00016.2022.02).
Data Availability Statement
The data presented in this study are available on request from the corresponding author.
Conflicts of Interest
Author Andrzej Słomczewski was employed by the company CGFP Ltd. The remaining authors declare that the research was conducted in the absence of any commercial or financial relationships that could be construed as a potential conflict of interest.
Appendix A
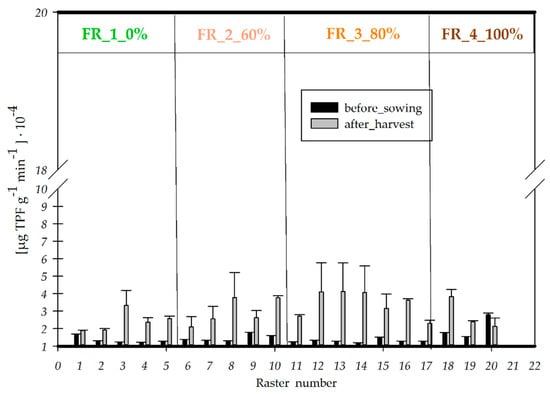
Figure A1.
DHA results for rapeseed soil samples before sowing (2022) and after harvesting (2023)—the average of three replicates for each sample, bars on the graph show the standard deviation.
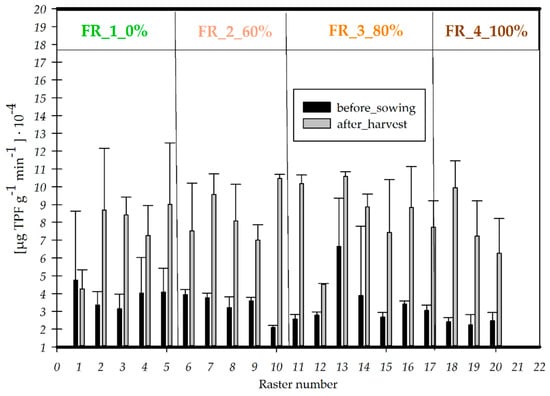
Figure A2.
DHA results for before sowing wheat soil samples (2022) and soil samples after harvest (2023)—bars present the average of three replicates for each soil sample; bars on the graph show the standard deviation.
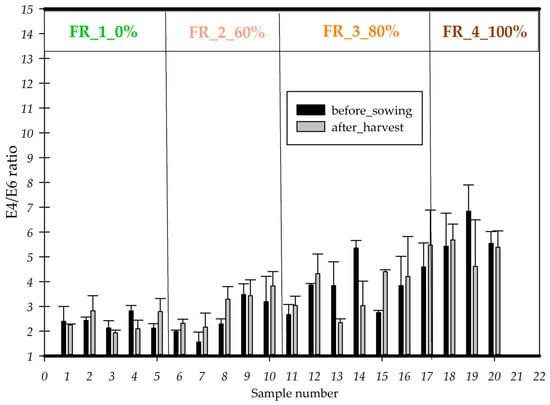
Figure A3.
The value of the E4/E6 ratio for samples taken before sowing (2022) and after harvesting (2023) rapeseed, bars on the graph show the standard deviation. The yellow line shows the average value of the E4/E6 ratio calculated through the control samples.
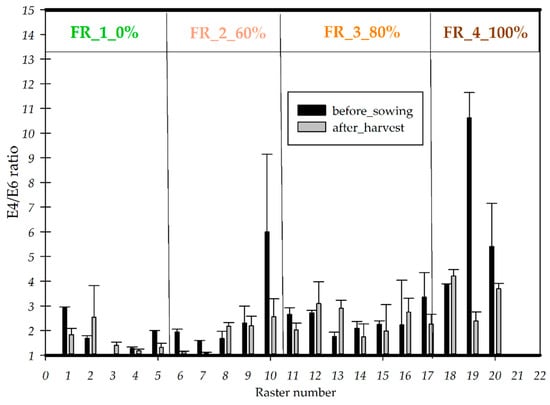
Figure A4.
The value of the E4/E6 ratio for samples taken before sowing (2022) and after harvesting (2023) wheat, bars on the graph show the standard deviation. The yellow line shows the average value of the E4/E6 ratio calculated through the control samples.
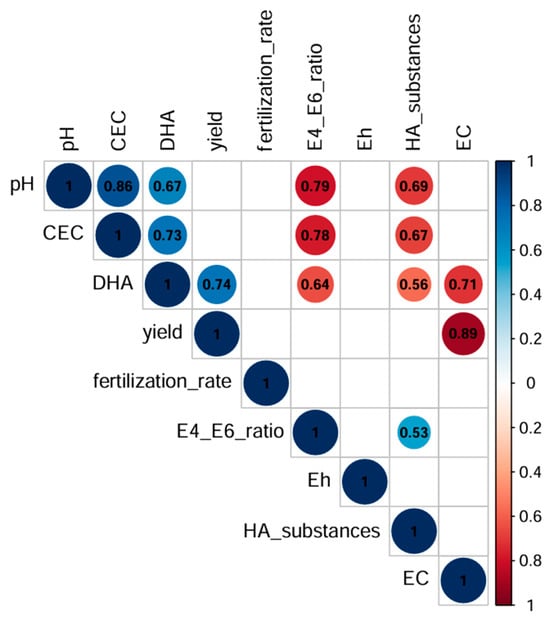
Figure A5.
Correlogram between the studied parameters for the whole dataset (n = 240, correlation is significant at the 0.01 level).
References
- Ibigweh, M.N.; Asawalam, D.O. Evaluation on Living Organisms and Their Effects on Soil Fertility Maintenance. Direct Res. J. Agric. Food Sci. 2017, 5, 65–76. [Google Scholar] [CrossRef]
- Prietzel, J.; Hiesch, S.; Harrington, G.; Müller, S. Microstructural and Biochemical Diversity of Forest Soil Organic Surface Layers Revealed by Density Fractionation. Geoderma 2022, 366, 114262. [Google Scholar] [CrossRef]
- Guggenberger, G. Humification and mineralization in soils. In Microorganisms in Soils: Roles in Genesis and Functions; Buscot, F., Varma, A., Eds.; Springer: Berlin/Heidelberg, Germany; New York, NY, USA, 2005; pp. 85–106. [Google Scholar]
- Dębska, B.; Jaskulska, I.; Jaskulski, D. Method of Tillage with the Factor Determining the Quality of Organic Matter. Agronomy 2020, 10, 1250. [Google Scholar] [CrossRef]
- Jaskulska, I.; Lemanowicz, J.; Dębska, B.; Jaskulski, D.; Breza-Boruta, B. Changes in Soil Organic Matter and Biological Parameters as a Result of Long-Term Strip-Till Cultivation. Agriculture 2023, 13, 2188. [Google Scholar] [CrossRef]
- Basu, S.; Kumar, G.; Chhabra, S.; Prasad, R. Role of Soil Microbes in Biogeochemical Cycle for Enhancing Soil Fertility. In New and Future Developments in Microbial Biotechnology and Bioengineering; Elsevier: Amsterdam, The Netherlands, 2021; pp. 149–157. [Google Scholar]
- Chandra, N.; Kumar, S. Antibiotics Producing Soil Microorganisms. In Antibiotics and Antibiotics Resistance Genes in Soils; Hashmi, M.Z., Strezov, V., Varma, A., Eds.; Springer International Publishing: Cham, Switzerland, 2017; pp. 1–18. ISBN 978-3-319-66259-6. [Google Scholar]
- Aulakh, C.S.; Sharma, S.; Thakur, M.; Kaur, P. A Review of the Influences of Organic Farming on Soil Quality, Crop Productivity and Produce Quality. J. Plant Nutr. 2022, 45, 1884–1905. [Google Scholar] [CrossRef]
- Hanajík, P.; Gáfriková, J.; Zvarík, M. Dehydrogenase Activity in Topsoil at Windthrow Plots in Tatra National Park. Cent. Eur. For. J. 2017, 63, 91–96. [Google Scholar] [CrossRef]
- Kaur, J.; Kaur, G. Dehydrogenase Activity as a Biological Indicator of Soil Health. Chem. Sci. Rev. Lett. 2021, 10, 326–329. [Google Scholar]
- Naamala, J.; Smith, D.L. Relevance of Plant Growth Promoting Microorganisms and Their Derived Compounds, in the Face of Climate Change. Agronomy 2020, 10, 1179. [Google Scholar] [CrossRef]
- Zheng, W.; Zeng, S.; Bais, H.; LaManna, J.M.; Hussey, D.S.; Jacobson, D.L. Plant Growth-Promoting Rhizobacteria (PGPR) Reduce Evaporation and Increase Soil Water Retention. Water Resour. Res. 2018, 54, 3673–3687. [Google Scholar] [CrossRef]
- Kekane, S.S.; Chavan, R.P.; Shinde, D.N.; Patil, C.L.; Sagar, S.S. A Review on Physico-Chemical Properties of Soil. Int. J. Chem. Stud. 2015, 3, 29–32. [Google Scholar]
- Jasinska, E.; Wetzel, H.; Baumgartl, T.; Horn, R. Heterogeneity of Physico-Chemical Properties in Structured Soils and Its Consequences. Pedosphere 2006, 16, 284–296. [Google Scholar] [CrossRef]
- Haddad, G.; El-Ali, F.; Mouneimne, A.H. Humic Matter of Compost: Determination of Humic Spectroscopic Ratio (E4/E6). Curr. Sci. Int. 2015, 4, 56–72. [Google Scholar]
- Bečka, D.; Bečková, L.; Kuchtová, P.; Cihlář, P.; Pazderů, K.; Mikšík, V.; Vašák, J. Growth and Yield of Winter Oilseed Rape under Strip-Tillage Compared to Conventional Tillage. Plant Soil Environ. 2021, 67, 85–91. [Google Scholar] [CrossRef]
- Cheng, Z.; Bai, L.; Wang, Z.; Wang, F.; Wang, Y.; Liang, H.; Wang, Y.; Rong, M.; Wang, Z. Strip-Till Farming: Combining Controlled-Release Blended Fertilizer to Enhance Rainfed Maize Yield While Reducing Greenhouse Gas Emissions. Agronomy 2024, 14, 136. [Google Scholar] [CrossRef]
- Stack, S.; Yarmuch, M.; Landhäusser, S.M. Species-Specific Responses to Targeted Fertilizer Application on Reconstructed Soils in a Reclaimed Upland Area. Can. J. Soil Sci. 2021, 101, 45–61. [Google Scholar] [CrossRef]
- Penuelas, J.; Coello, F.; Sardans, J. A Better Use of Fertilizers is Needed for Global Food Security and Environmental Sustainability. Agric. Food Secur. 2023, 12, 5. [Google Scholar] [CrossRef]
- Wolińska, A.; Banach, A.; Kruczyńska, A.; Sochaczewska, A.; Goraj, W.; Górski, A.; Podlewski, J.; Słomczewski, A.; Kuźniar, A. Effect of Reduced Nitrogen Fertilization on the Chemical and Biological Traits of Soils under Maize Crops. Agronomy 2023, 13, 2913. [Google Scholar] [CrossRef]
- Casida, L.; Klein, D.; Santoro, T. Soil Dehydrogenase Activity. Soil Sci. 1964, 98, 371–376. [Google Scholar] [CrossRef]
- Jones, G.A.; Humphrey, B.A. Evaluation of a Dehydrogenase Assay Based on Tetrazolium Reduction for Rapid in vitro Estimation of Fermentation Activity in Rumen Contents. Can. J. Anim. Sci. 1978, 58, 501–511. [Google Scholar] [CrossRef]
- Kononova, M.M.; Belchikova, N.P. Accelerated Methods for Determining the Composition of Humus in Mineral Soils. Soil Sci. 1961, 10, 75–87. [Google Scholar]
- Janowiak, J. Właściwości substancji humusowych czarnych ziem i gleb płowych. Zesz. Probl. Post Nauk Rol. 1993, 411, 182–188. (In Polish) [Google Scholar]
- R Core Team. R: A Language and Environment for Statistical Computing; R Foundation for Statistical Computing: Vienna, Austria, 2018; Available online: https://www.R.-project.org/ (accessed on 27 March 2024).
- Körschens, M. The Importance of Long-Term Field Experiments for Soil Science and Environmental Research—A Review. Plant Soil Environ. 2006, 52, 1–8. [Google Scholar]
- Bhatnagar, V.; Chandra, R. Iot-Based Soil Health Monitoring and Recommendation System. In Internet of Things and Analytics for Agriculture; Springer: Berlin/Heidelberg, Germany, 2020; Volume 2, pp. 1–21. [Google Scholar]
- Schebesta, H.; Bernaz, N.; Macchi, C. The European Union Farm to Fork Strategy: Sustainability and Responsible Business in the Food Supply Chain. SSRN Electron. J. 2020, 15, 420–427. [Google Scholar] [CrossRef]
- Billen, G.; Aguilera, E.; Einarsson, R.; Garnier, J.; Gingrich, S.; Grizzetti, B.; Lassaletta, L.; Le Noë, J.; Sanz-Cobena, A. Beyond the Farm to Fork Strategy: Methodology for designing a European agro-ecological future. Sci. Total. Environ. 2024, 908, 168160. [Google Scholar] [CrossRef] [PubMed]
- Montanarella, L. Soils and the European Green Deal. Ital. J. Agron. 2020, 15, 262–266. [Google Scholar] [CrossRef]
- Verma, K.K.; Song, X.P.; Joshi, A.; Tian, D.D.; Rajput, V.D.; Singh, M.; Arora, J.; Minkina, T.; Li, Y.R. Recent Trends in Nano-Fertilizers for Sustainable Agriculture under Climate Change for Global Food Security. Nanomaterials 2022, 12, 173. [Google Scholar] [CrossRef] [PubMed]
- Adisa, I.; Pullagurala, V.; Peralta-Videa, J.; Dimkpa, C.; Gardea-Torresdey, J.; White, J. Recent Advances in Nano-Enabled Fertilizers and Pesticides: A Critical Review of Mechanisms of Action. Environ. Sci. Nano 2019, 6, 2002–2030. [Google Scholar] [CrossRef]
- Läuchli, A.; Grattan, S.R. Soil pH Extremes. In Plant Stress Physiology; CABI Publishing: Wallingford, UK, 2012; pp. 194–209. [Google Scholar]
- Włodarczyk, T.; Stępniewski, W.; Brzezińska, M. Dehydrogenase Activity, Redox Potential, and Emissions of Carbon Dioxide and Nitrous Oxide from Cambisols under Flooding Conditions. Biol. Fertil. Soils 2002, 36, 200–206. [Google Scholar] [CrossRef]
- Ros, M.; Hernandez, M.T.; Garcia, C. Soil Microbial Activity After Restoration of a Semiarid Soil By Organic Amendments. Soil Biol. Biochem. 2003, 35, 463–469. [Google Scholar] [CrossRef]
- Brzezińska, M.; Stępniewski, W.; Stępniewska, Z.; Przywara, G.; Włodarczyk, T. Effect of Oxygen Deficiency on Soil Dehydrogenase Activity in a Pot Experiment with Triticale cv. Jago Vegetation. Int. Agrophys. 2001, 15, 145–149. [Google Scholar]
- Kılıç, O.; Ersayin, K.; Gunal, H.; Khalofah, A.; Alsubeie, M. Combination of Fuzzy-AHP and GIS Techniques in Land Suitability Assessment for Wheat (Triticum aestivum) Cultivation. Saudi J. Biol. Sci. 2022, 29, 2634–2644. [Google Scholar] [CrossRef]
- Raboanatahiry, N.; Li, H.; Yu, L.; Li, M. Rapeseed (Brassica napus): Processing, Utilization, and Genetic Improvement. Agronomy 2021, 11, 1776. [Google Scholar] [CrossRef]
- Husson, O. Redox Potential (Eh) and pH as Drivers of Soil/Plant/Microorganism Systems: A Transdisciplinary Overview Pointing to Integrative Opportunities for Agronomy. Plant Soil 2013, 362, 389–417. [Google Scholar] [CrossRef]
- Mat Su, A.S.; Adamchuk, V.I. Temporal and Operation-Induced Instability of Apparent Soil Electrical Conductivity Measurements. Front. Soil Sci. 2023, 3, 1137731. [Google Scholar] [CrossRef]
- Benslama, A.; Khanchoul, K.; Fouzi, B.; Boubehziz, S.; Faredj, C.; Navarro-Pedreño, J. Monitoring the Variations of Soil Salinity in a Palm Grove in Southern Algeria. Sustainability. 2020, 12, 6117. [Google Scholar] [CrossRef]
- Wolińska, A.; Szafranek-Nakonieczna, A.; Zielenkiewicz, U.; Tomczyk-Żak, K.; Banach, A.; Błaszczyk, M.; Stępniewska, Z. Quantified Characterization of Soil Biological Activity Under Crop Cultivation. J. Adv. Biol. 2016, 8, 1655–1665. [Google Scholar]
- Lumactud, R.A.; Gorim, L.Y.; Thilakarathna, M.S. Impacts of Humic-Based Products on the Microbial Community Structure and Functions Toward Sustainable Agriculture. Front. Sustain. Food Syst. 2022, 6, 977121. [Google Scholar] [CrossRef]
- Schnitzer, M. Characterization of humic constituents spectroscopy. In Soil Biochemistry; McLaren, A.D., Skujins, J., Eds.; Marcel Dekker: NewYork, NY, USA, 1971; Volume 2, pp. 60–95. [Google Scholar]
- Chen, Y.; Senesi, N.; Schnitzer, M. Information Provided on Humic Substances by E4/E6 ratios. Soil Sci. Soc. Am. J. 1977, 41, 352–358. [Google Scholar] [CrossRef]
- Al-Khafagi, Q.D.E. Interaction Between Some Micro-Elements And Humic Substances in Some Forest Soils Northern Iraq. Tikrit J. Agric. Sci. 2022, 22, 166–174. [Google Scholar] [CrossRef]
- Reddy, S.; Nagaraja, M.S.; Raj, T.P.; Patil, A.P.; Dumgond, P. Elemental Analysis, E4/E6 Ratio and Total Acidity of Soil Humic and Fulvic Acids from Different Land Use Systems. Ann. Plant. Soil. Res. 2014, 16, 89–92. [Google Scholar]
- Allison, S.D. Soil Minerals and Humic Acids Alter Enzyme Stability: Implications Forecosystem Processes. Biogeochemistry 2006, 81, 361–373. [Google Scholar] [CrossRef]
- Gołębiowska, D.; Grzyb-Miklewska, J. Kompleksy Humus-Enzym. II. Oddziaływanie kompleksów humus-enzym w układach modelowych „in vitro”. Post. Nauk Roln. 1991, 4/5/6, 117–126. (In Polish) [Google Scholar]
- Mazzei, P.; Oschkinat, H.; Piccolo, A. Reduced Activity of Alkaline Phosphatase Due to Host–Guest Interactions with Humic Superstructures. Chemosphere 2013, 93, 1972–1979. [Google Scholar] [CrossRef] [PubMed]
- Pflug, W.; Ziechmann, W. Inhibition of Malate Dehydrogenase by Humic Acids. Soil Biol. Biochem. 1981, 13, 293–299. [Google Scholar] [CrossRef]
- Pospíšil, F. Influence of Physiologically Active Substances of the Soil Humus on the Activity of Glucose-6-Phosphate-Dehydrogenase in Pea (Pisum sativum L.) Roots. Biol. Plant. 1980, 22, 161–166. [Google Scholar] [CrossRef]
- Bueis, T.; Turrión, M.B.; Bravo, F.; Pando, V.; Muscolo, A. Factors Determining Enzyme Activities in Soils under Pinus halepensis and Pinus sylvestris Plantations in Spain: A Basis for Establishing Sustainable Forest Management Strategies. Ann. For. Sci. 2018, 75, 34. [Google Scholar] [CrossRef]
- Mencel, J.; Mocek-Płóciniak, A.; Kryszak, A. Soil Microbial Community and Enzymatic Activity of Grasslands under Different Use Practices: A Review. Agronomy 2022, 12, 1136. [Google Scholar] [CrossRef]
- Zhang, L.; Chen, X.; Xu, Y.; Jin, M.; Ye, X.; Gao, H.; Chu, W.; Mao, J.; Thompson, M.L. Soil Labile Organic Carbon Fractions and Soil Enzyme Activities After 10 Years of Continuous Fertilization and Wheat Residue Incorporation. Sci. Rep. 2020, 10, 11318. [Google Scholar] [CrossRef]
- Wolińska, A.; Stępniewska, Z. Dehydrogenase Activity in the Soil Environment. In Dehydrogenases; Canuto, R.A., Ed.; InTech Open: London, UK, 2012; Volume 10, pp. 183–210. [Google Scholar]
- Cuadros-Casanova, I.; Cristiano, A.; Biancolini, D.; Cimatti, M.; Sessa, A.A.; Mendez Angarita, V.Y.; Dragonetti, C.; Pacifici, M.; Rondinini, C.; Di Marco, M. Opportunities and Challenges for Common Agricultural Policy Reform to Support the European Green Deal. Conserv. Biol. 2023, 37, e14052. [Google Scholar] [CrossRef]
- Bungau, S.; Behl, T.; Aleya, L.; Bourgeade, P.; Aloui-Sossé, B.; Purza, A.L.; Abid, A.; Samuel, A.D. Expatiating the Impact of Anthropogenic Aspects and Climatic Factors on Long-Term Soil Monitoring and Management. Environ. Sci. Pollut. Res. 2021, 28, 30528–30550. [Google Scholar] [CrossRef]
Disclaimer/Publisher’s Note: The statements, opinions and data contained in all publications are solely those of the individual author(s) and contributor(s) and not of MDPI and/or the editor(s). MDPI and/or the editor(s) disclaim responsibility for any injury to people or property resulting from any ideas, methods, instructions or products referred to in the content. |
© 2024 by the authors. Licensee MDPI, Basel, Switzerland. This article is an open access article distributed under the terms and conditions of the Creative Commons Attribution (CC BY) license (https://creativecommons.org/licenses/by/4.0/).