Article

QTL Mapping and Candidate Gene Mining for Stem Diameter Using Genetic Basis of Cultivated Soybean and Wild Soybean

1
National Key Laboratory of Smart Farm Technology and System, Key Laboratory of Soybean Biology in Chinese Ministry of Education, College of Agriculture, Northeast Agricultural University, Harbin 150030, China
2
Crop Development Research Institute, Heilongjiang Academy of Land Reclamation Sciences, Harbin 150038, China
3
Fangzheng Comprehensive Product Quality Inspection and Testing Center, Harbin 150899, China
*
Authors to whom correspondence should be addressed.
These authors contributed equally to this work.
Agronomy 2024, 14(5), 1019; https://doi.org/10.3390/agronomy14051019
Submission received: 19 April 2024 / Revised: 7 May 2024 / Accepted: 8 May 2024 / Published: 11 May 2024
(This article belongs to the Special Issue Soybean Yield and Quality Improvement)

Abstract

:
Soybean (Glycine max) is a vital food crop, serving as a major source of high-quality protein for human and animal consumption. Stem diameter is one of the primary determinants of the stem lodging resistance of a given plant, but there has been relatively little research to date focused on genes associated with this trait. To address this gap in the literature, 207 chromosome segment substitution lines (CSSLs) were generated in the present study through the crossing and backcrossing of the improved Suinong14 and the wild ZYD00006 soybean varieties. These CSSLs were then used for the mapping of quantitative trait loci (QTLs) associated with stem diameter in two-year field planting materials, leading to the identification of nine QTLs. Whole genome resequencing, RNA-seq, and qPCR were then used to evaluate candidate genes associated with stem diameter within these QTL intervals, ultimately leading to the selection of Glyma.04G004100 as a stem diameter-related gene. Subsequent qPCR analyses revealed that Glyma.04g004100 was upregulated in soybean plants with larger stem diameters, and haplotype analyses yielded results consistent with these stem diameter data in the population used to conduct this study. In summary, a series of QTLs associated with stem diameter were identified in the present study, resulting in the establishment of Glyma.04g004100 as a stem diameter-related gene. Together, these results offer a theoretical foundation for the future molecular-assisted breeding of lodging-resistant soybean varieties, and future functional research focused on Glyma.04g004100 may elucidate the molecular mechanisms and key signaling networks involved in soybean stem development.

1. Introduction

Soybeans are a key oil crop throughout the globe, and soybean plants are widely cultivated as a major source of high-quality protein for human and animal consumption [1,2]. Soybean imports account for ~80% of the total demand in China, underscoring the need to improve domestic soybean yields in order to help safeguard China’s food security. Lodging plays an important role in shaping grain yields, as it can result in the destruction of plant canopy structures. Lodging results in poor light penetration, reduced photosynthetic activity, worse dry matter accumulation, and decreases in nutrient absorption and transport efficiency [3,4]. When soybean varieties that exhibit severe lodging are susceptible to fungal diseases, this can result in greater than 60% yield reductions in severe instances [5,6]. Plant height is a key metric that is often used to assess plant lodging resistance [7], and areas with superior growing conditions can influence plant height, ultimately aggravating the challenges posed by lodging [8]. For these reasons, ongoing research and breeding efforts focused on stem strength characteristics are aimed at improving lodging resistance and thereby ensuring greater stability with respect to grain yields.
Stem diameter (SD) is closely tied to overall stem strength, making it another important factor that is associated with crop lodging resistance [9]. In 1999, research conducted on wheat first provided evidence of a direct link between SD and lodging resistance, with this resistance generally being superior for varieties with thicker stems [10]. Several stem development-related genes have been described in various crop species. For example, genome-wide association studies (GWASs) and analyses of transgenic plant phenotypes have led to the identification of OsWRKY21 as an important regulator of rice plant height. When overexpressed, OsWRKY21 reduces the height of rice plants with corresponding internode shortening and an earlier heading date [11]. In wheat, TEOSINTE BRANCHED1 (TB1) functions as a negative regulator of plant height that is linked to the limiting of internode elongation [12]. Efforts to identify genes involved in the regulation of SD development have largely centered around QTL mapping and molecular marker-assisted breeding. In rice, researchers have confirmed the importance of SD as a determinant of lodging resistance through its influence on pushing resistance, with five SD-related QTLs having been detected through population mapping studies [13]. In a separate study, researchers leveraged a backcross inbred line (BIL) population for analyses of lodging resistance-related QTLs in rice, leading to the identification of twelve stem width-related QTLs [14], including two (qLR1 and qLR8) that increased stem width, with qLR1 being significantly associated with SD. Maize is a major food crop, and maize stalk characteristics are a focus of significant interest. Researchers have utilized recombinant inbred line (RIL) data from three years based on a population generated by crossing the Ye478 and Qi319 varieties to identify seven SD-related QTLs on chromosomes 4, 5, 7, and 10. Based on the combination of data across multiple years, the authors were able to detect a candidate gene within the chromosome 7 QTL region that was an allele of Ye478 and linked to SD enlargement [15]. SD-associated QTLs have also recently been described in legumes. For instance, peas are an important leguminous crop that are prone to lodging, and studies of RIL populations generated by crossing the lodging-resistant Delta and RER varieties have enabled the identification of QTLs associated with SD [16]. Specifically, RER parental alleles have been demonstrated to contribute to increases in SD, allowing researchers to ultimately conclude that SD-related QTLs are associated with greater lodging resistance. To date, however, there has been relatively little research focused on SD in soybeans. Chen et al. detected one consensus QTL and five unique QTLS associated with SD based on three years of data from RIL populations generated by crossing the Zhongdou29 and Zhongdou32 varieties over three years [17]. Separately, 12 QTLs were identified across three RIL populations, leading to the identification of three candidate SD development-related genes that were associated with auxin synthesis (Glyma.11g204200, Glyma.11g194800) and cellulose synthesis (Glyma.11g189600) [18]. These prior studies provide strong evidence that QTL-based mapping efforts can provide an effective approach for the identification of SD-related candidate genes.
Cultivated soybeans that are widely grown in agricultural settings were domesticated from the wild ancestor species, Glycine soja, through a process of artificial selection for desirable traits [5]. In the long history of agricultural development, soybean has become rich in germplasm resources and genetic variation after a long domestication process from wild soybean to landraces and then to cultivated varieties [19]. While the cultivated varieties tend to exhibit many favorable traits, the fine-mapping of QTL intervals responsible for the regulation of key agronomic traits is vital for efforts to explore relevant candidate genes. Chromosome segment substitution lines (CSSLs) are populations that can be constructed through the extensive crossing and backcrossing of cultivated and wild soybean varieties over the course of many years [20]. Given the absence of any reproductive isolation between wild and cultivated soybean varieties, such approaches are widely regarded as a viable means of introducing fragments of the wild soybean genome into cultivated varieties, thereby leveraging the superior allelic diversity of these wild germplasm resources [21]. CSSLs can thus be effectively utilized to conduct QTL mapping, allowing for the accurate localization of key intervals of interest and thereby providing valuable genetic resources for efforts to improve soybean traits. Here, a CSSL population was established using the Suinong14 variety, which exhibits large SD values, and the wild ZYD00006 variety, which exhibits smaller SD measurements. Through QTL mapping based on measurements of SD values for members of the CSSL population, chromosomal insertion fragment analyses, and RNA-seq, screening for SD-related candidate genes was conducted. These candidate genes were then subjected to further verification through qPCR approaches. Finally, the relationship between Glyma.04g004100 haplotypes and soybean resource varieties was determined by haplotype analysis. The genetic loci and candidate genes related to stem diameter identified in this study can provide a molecular basis for the selection of lodging resistant varieties and also provide a clearer research target for the mechanism analysis of stem development-related regulatory networks in the future.

2. Materials and Methods

2.1. Plant Materials and Genetic Mapping

SD measurements were performed for 310 different soybean varieties in this study. A CSSL population consisting of 207 materials generated through hybridization and backcrossing between the cultivated Suinong14 and the wild ZYD00006 soybean varieties was also established [22]. For parental selection, Suinong14 was used as the recurrent parent and ZYD00006 as the donor parent for crossing, and the obtained F1 generation was backcrossed to Suining14 to further form the line. SSR (simple sequence repeat) marker-assisted selection was used to select homozygous recombinant strains BC3F5, BC3F6, BC3F7, BC4F4, BC4F5, BC4F6, BC5F4, and BC5F5 after several rounds of backcrossing to create a fine-mapping population, consisting of 207 CSSL materials. CSSL genetic map construction was reported previously by Wang et al. [21]. Genomic DNA was extracted from parental and CSSL leaves by the CTAB method [23], 329 SSR markers were used to analyze the polymorphism in the CSSL population, and 121 evenly distributed SSR markers on chromosomes were selected to construct a genetic map of the CSSL population. The final map used 20 linkage groups consisting of 5308 markers, with a total marker length of 2655.68 cM and an average distance of 0.5 cM between adjacent makers.

2.2. Field Experiment and Plant Measurements

Cultivar materials were planted in Xiangyang Crop Breeding Base of Northeast Agricultural University in Harbin (45.75° N, 126.53° E) in 2022 and 2023. The soil type was typical black soil in Northeast China. The organic matter, total nitrogen, available phosphorus, and available potassium in the topsoil were 43.9 g/kg, 2.1 g/kg, 33.9 mg/kg, and 291 mg/kg, respectively. The climate is characterized by a cold temperate continental monsoon climate, with an active accumulated temperature of about 2700 °C, sunshine hours of about 2623 h, and average annual precipitation of about 550 mm. The experiment consisted of a randomized complete block design (RCBD), each measuring 5 m in length, with 5 cm between seeds and a row spacing of 0.65 m. Measurement standards were conducted, as reported previously by Qiu et al. [24], at the R8 maturity stage of the soybean plant, using a vernier caliper to measure the width of the fifth stem internode of main stem. The unit of the SD is mm, and the SD is measured by selecting three plants exhibiting constant growth. For each, the diameter of the fifth internode of the main stem (in mm) was assessed at the maturity stage.

2.3. Statistical Analysis of Data

Microsoft®Excel2016 was used for the statistical analyses of data in each group, and each group of data was averaged for a significance test. SPSS 17.0 and GraphPad Prism 8 were used for the analyses of multiple groups of data using Duncan’s multiple range test and Student’s t-tests.

2.4. QTL Identification

The genetic map constructed with the CSSLs described above was used for SD-related QTL mapping via the composite interval mapping (CIM) method in WinQTL Cartographer 2.5 [25]. The control markers were set to 5 cM, with a 10 cM window width and a 0.5 cM running speed. The LOD values corresponding to the degree of linkage were measured, and those QTLs with an LOD > 2.5 were chosen as effective loci.

2.5. Chromosome Fragment Insertion Analysis

Based on the CSSL resequencing results, the positions of ZYD00006 insertion fragments within the CSSL maps of extreme materials were assessed. Combined with the QTLs of SD, the mapping range of the main QTLs of SD was further reduced.

2.6. Candidate Gene Mining

The Williams82 reference genome was used for the annotation of genes in the major QTL regions associated with SD to support candidate gene prediction efforts. Specifically, the full-length sequences of genes within the candidate region were extracted, including the upstream 3000 bp promoter region and the entire transcript sequence, from Phytozome12 (Glycine max Wm82.a4.v1, https://phytozome-next.jgi.doe.gov/info/Gmax_Wm82_a4_v1, accessed on 15 December 2023).

2.7. Candidate Gene Single-Nucleotide Polymorphism (SNP) Analyses

Whole genome sequencing data from the parental Suinong14 and ZYD00006 varieties were used for the SNP analyses of genes located within the major QTLs of interest. A local BLAST was performed to align the Suinong 14 and ZYD00006 sequences with the reference sequences of the candidate genes to obtain information on single-nucleotide polymorphisms (SNPs) within the candidate genes in Suinong14 and ZYD00006. The SNP analyses of these regions focused on candidate gene promoters and coding sequences. The promoter sequences of candidate genes in Suinong14 and ZYD00006 were input into the PlantCARE website (https://bioinformatics.psb.ugent.be/webtools/plantcare/html/, accessed on 18 December 2023) for homeopathic element prediction.

2.8. RNA Sequencing and qPCR Verification

Based on the survey specification of soybean traits, the fifth stem node was selected for stem diameter measurement at the maturity stage R8, and the main stem diameter of the plant was unchanged when it was fully mature. We want to know the expression levels of Suinong14 and ZYD00006 genes during the fifth node development period, combined with the QTL locus interval mining of candidate genes leading to significant differences in the parental stem diameter. Therefore, when the plant grew to the fifth leaf stage (V5), when the sixth trifoliate is fully expanded, the internode of the fifth stem was cut off and quickly placed into liquid nitrogen. Trizol was used to extract total RNA from these specimens, collecting samples from three replicates each of the Suinong14 and ZYD00006 varieties. RNA quality was assessed with a Bioanalyzer 2100 instrument (Agilent Technologies, Santa Clara, CA, USA), and qualified samples (>50 ng/μL, RIN > 7.0, and total RNA > 1 μg) were used for library preparation. The paired-end (PE) sequencing of these libraries was performed with an Illumina Novaseq 6000 (Illumina, Shanghai, China) HiSeq instrument. Raw data were then filtered, after which the compared data were compared with the reference genome using HISAT2 (http://daehwankimlab.github.io/hisat2/, accessed on 10 December 2023), allowing for the mapping of reads to specific genes. DeSeq2 (http://bioconductor.org/packages/release/bioc/html/DESeq2.html, accessed on 12 December 2023) was used to analyze differences in gene expression, with differentially expressed genes (DEGs) being identified as those with an expression difference multiple of more than 1 and a p-value < 0.05. Top GO was used for GO enrichment analyses of these genes, with p < 0.05 as determined based on a hypergeometric distribution being indicative of significant GO enrichment.
Collected RNA was processed to produce cDNA with the HiScript III RT Super-Mix for qPCR (+gDNA wiper) kit (Vazyme, Nanjing, China), after which qPCR analyses were conducted with the ChamQ Universal SYBR qPCR Master Mix (Vazyme, Nanjing, China) and specific primers (Table S1), using GmUKN1 (Glyma.12G020500) as the reference gene.

2.9. Subcellular Localization

The YFP tag-encoding pEarlygate101-Glyma.04G004100 vector was generated and introduced into Agrobacterium EHA105, after which these bacteria were used to inoculate young Nicotiana benthamiana leaves [26], with the fluorescent signal at the site of injection being assessed after 48 h via laser confocal microscopy (Leica, TCS SP8, Beijing, China).

2.10. Haplotype Analyses

Candidate gene haplotype analyses were performed using resequencing data from 310 soybean varieties and the CSSL sequencing data, evaluating the coding regions and promoter sequences (within 3000 bp upstream) for these candidate genes. Local BLAST was used to select all SNPs, and Dnasp5.0 was used for haplotype classification, with GraphPad Prism 8 being used to identify correlations between SD and haplotype.

3. Results

3.1. The Suinong14 Soybean Variety Exhibits a Larger Stem Diameter than the Wild ZYD00006 Variety

In both 2022 and 2023 years, SD values for soybean plants in the field in different plots at the Xiangyang crop breeding base (45.75° N, 126.53° E) of Northeast Agricultural University in Harbin were measured. These analyses revealed that the lodging status of the improved Suinong14 variety in the field was far lighter than that of wild ZYD00006. Moreover, the SD of Suinong14 is larger than ZYD00006. To confirm these findings, the diameter of the fifth internode was compared between these two varieties at the maturity stage, yielding consistent results (Figure 1A,B). Given these significant differences in SD and in an effort to identify key genes that impact SD for the purposes of establishing improved cultivars, Suinong14 and ZYD00006 were used to build a CSSL population for the mapping of QTLs associated with SD.

3.2. SD Data Statistics and Associated QTL Identification in the Soybean CSSL Population

SD values were measured for 207 materials in the CSSL population over two years, with the resultant values ranging from 4.86 to 10.03 mm and 4.73 to 10.71 mm in these respective years (Table 1 and Table S2). The SD values measured for the parental lines fell within these ranges, and the SD values for the overall population were normally distributed (Figure 1C). This suggests that genetic differences between the two parental lines are the cause of the observed variations in SD in the backcrossed CSSL population, making this an ideal resource for the identification of QTLs associated with SD. Based on the composite interval mapping (CIM) approach in the WinQTL Cartographer program, the SD data from two years were combined for QTL location, identifying QTLs based on the following criteria: p < 0.05 and LOD score > 3.0. In total, nine QTLs were detected using this approach (Table 2), with the same QTL on chromosome 4 (LGs C1) being identified in both years. This locus was thus selected as a candidate interval for subsequent analyses of SD-related genes.

3.3. Candidate Interval Confirmation Based on Chromosome Fragment Insertion

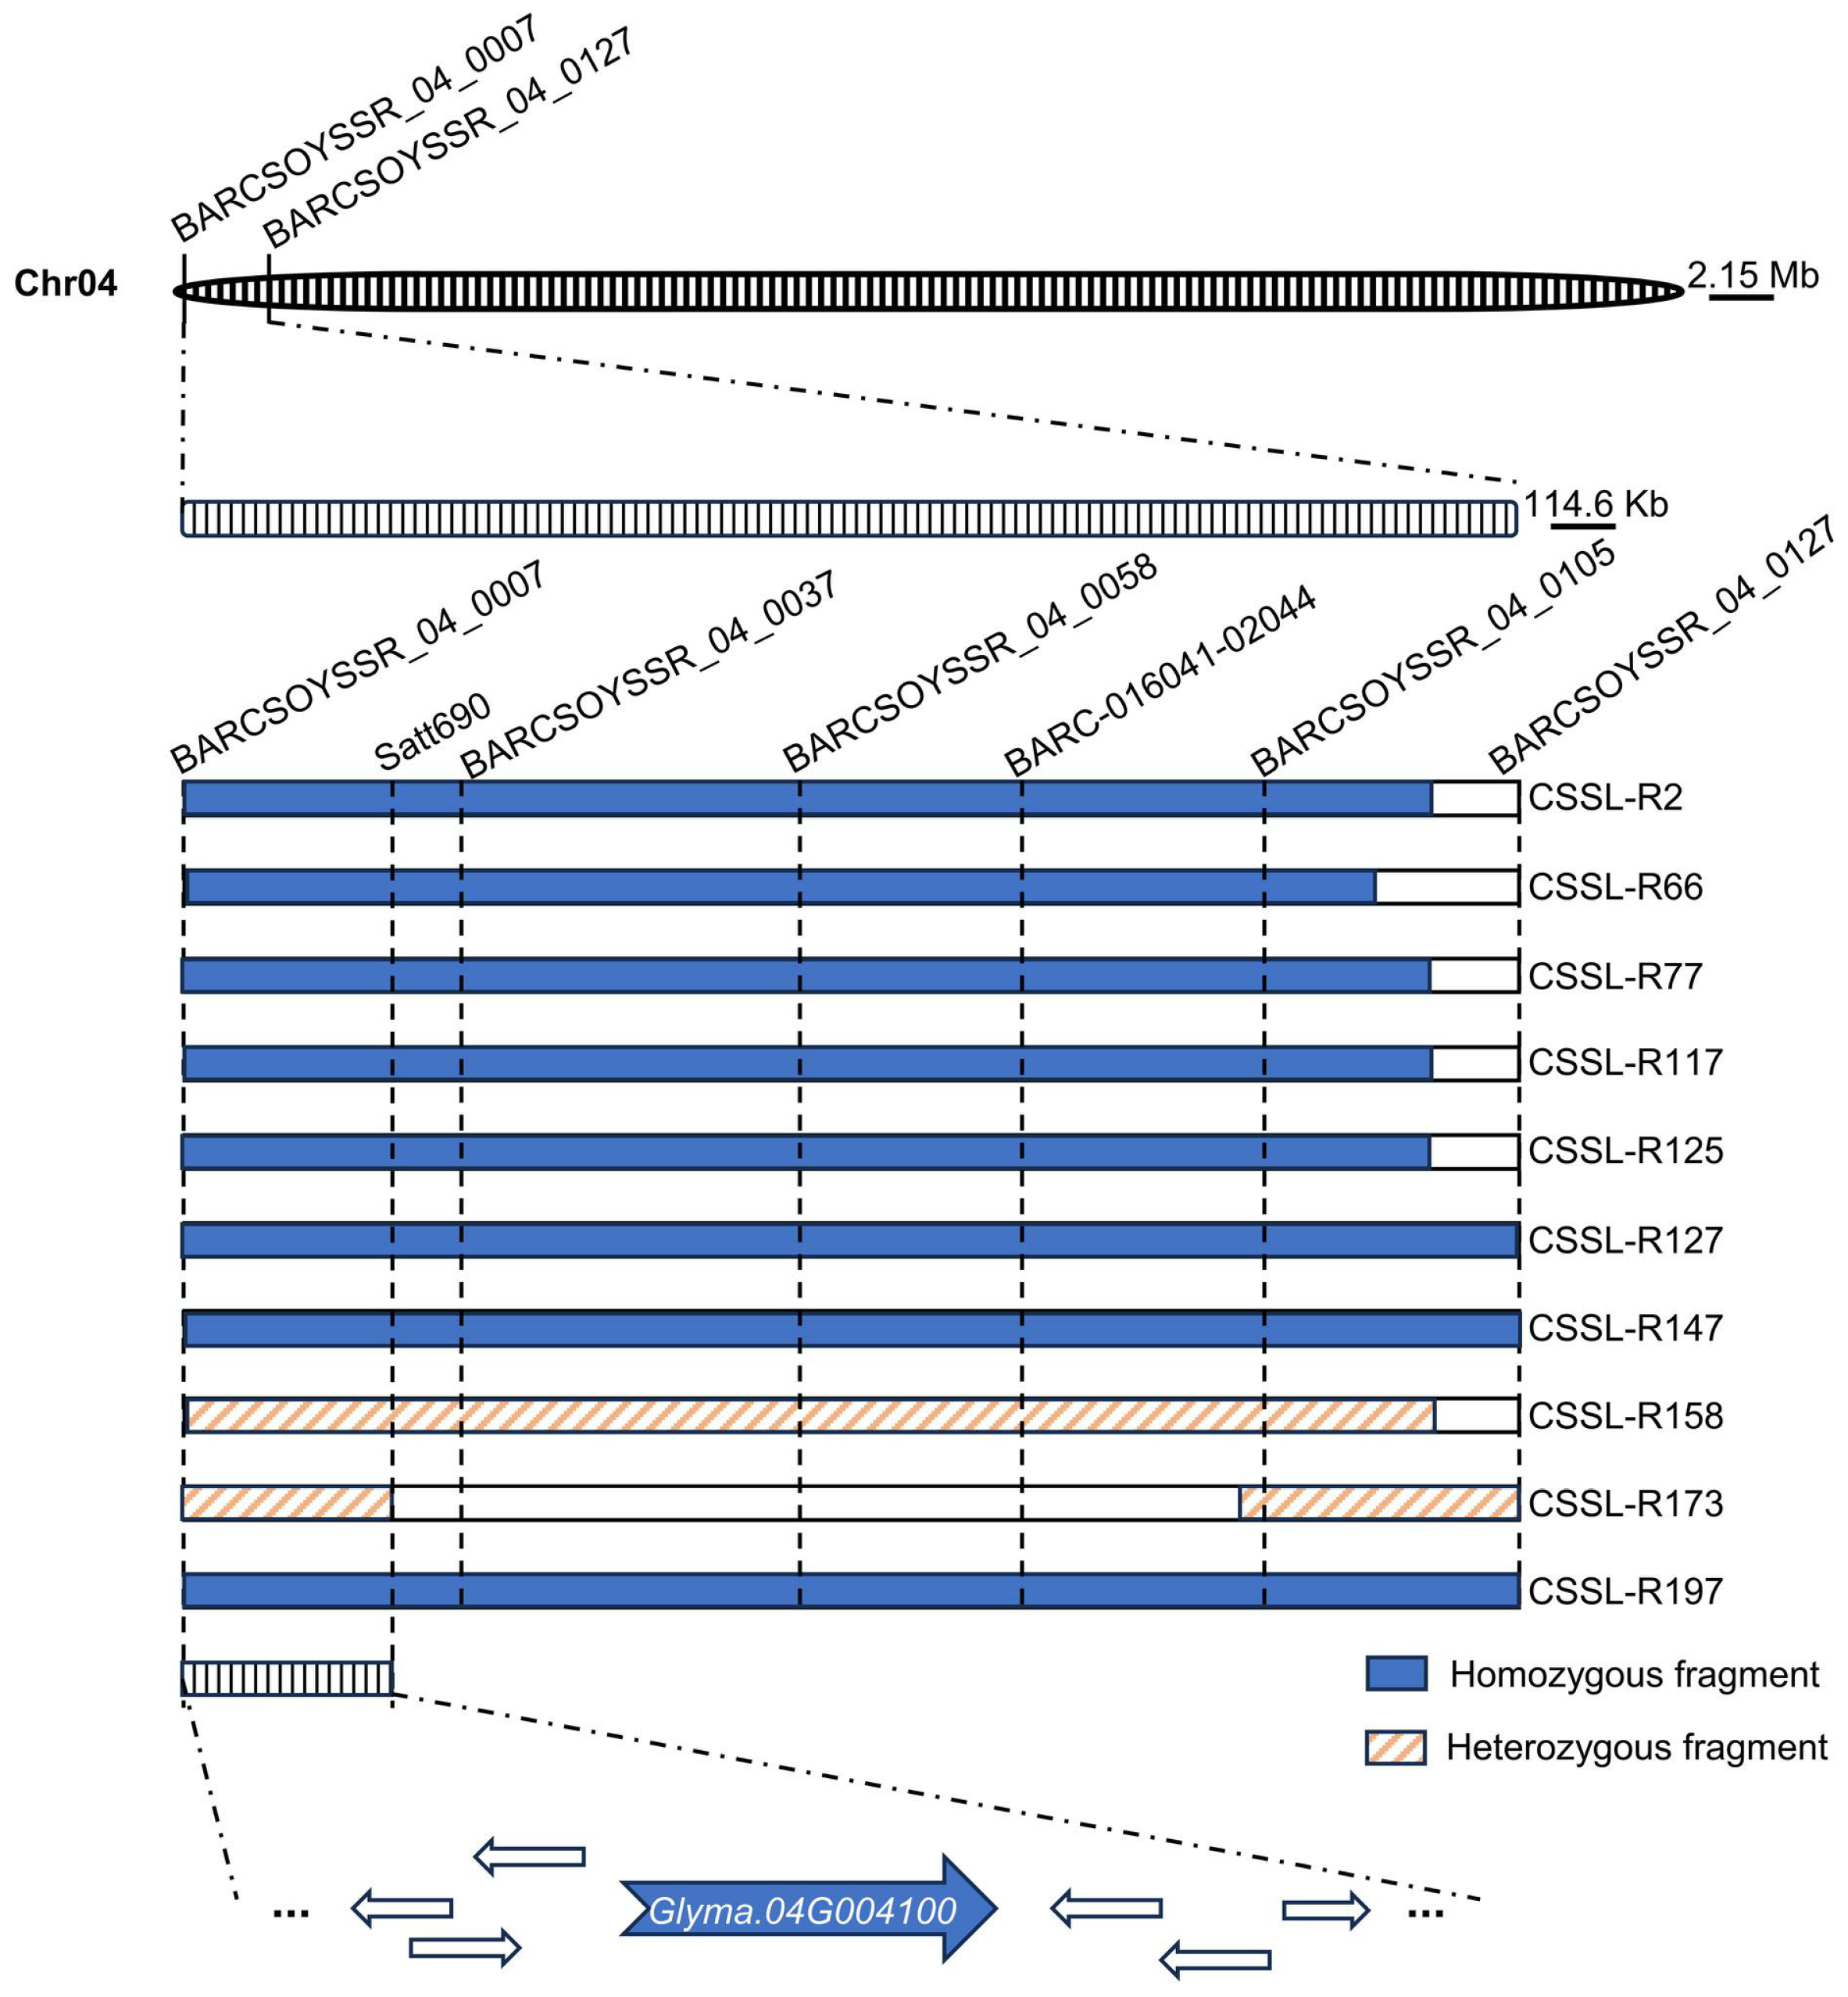
After continuous backcrossing between ZYD00006 and Suining14, 207 CSSL material populations were obtained with genome insertions from different positions of ZYD00006 fragments to integrate into the Suining14 genome. Phenotypic differences in these populations confirmed the role that genomic differences played in plant phenotypic characteristics. As such, the ZYD00006 fragment insertion was considered to be a likely contributor to reductions in SD measurements based on phenotypic data from CSSLs and the Suinong14 variety. In order to more precisely identify the genomic regions linked to changes in SD, 10 materials were selected from among those with significant reductions in SD values, and the physical location of the inserted fragments was confirmed using SSR markers based on CSSL resequencing. Through comparisons of the overlap interval between SSR markers and these QTLs, a 335 kb (0.12 Mb–0.46 Mb) region situated on chromosome 4 between the BARCSOYSSR_04_0007 and Satt690 markers was identified as a candidate SD-related interval (Figure 2). This thus suggested that one or more genes in this region play a role in the process of stem development.

3.4. RNA-seq Analyses of Suinong14 and ZYD00006 Plants during Stem Development

Transcriptomic sequencing analyses of stem tissue samples collected from Suinong14 and ZYD00006 plants at the seedling stage were conducted next. Following the filtering of raw data, roughly 269 Mb of clean data were obtained, with respective Q20 and Q30 base percentages of 99.01–99.30% and 95.40–96.45% (Table S3). In total, screening for differentially expressed genes (DEGs; |log2FC| ≥ 1, q < 0.05) revealed 4017 and 1529 genes that were significantly upregulated and downregulated, respectively, when comparing the ZYD00006 and Suinong14 groups (Figure 3A,B). GO enrichment analyses of these DEGs revealed that they were enriched in 25, 10, and 15 biological process, molecular function, and cellular component terms, respectively, including the following: biological process (GO:0008150), multicellular organization development (GO:0007275), cell differentiation (GO:0030154), signal transmission (GO:0007165), response to allergic acid (GO:0009737), cell wall organization (GO:0071555), plasma membrane (GO:0005886), and DNA binding (GO:0003677). KEGG analyses further revealed the enrichment of these DEGs in the plant hormone signal transduction, cutin, suberine and wax biosynthesis, flavonoid biosynthesis, phenylpropanoid biosynthesis, and brassinosteroid biosynthesis pathways (Figure 3C,D).

3.5. Identification of Stem Diameter-Related Candidate Genes Based on Single-Nucleotide Polymorphism Analysis

Using the Williams 82 genome as a reference, a total of 42 genes were identified next within the 335 kb candidate interval of interest. Through comparisons of the reference genome to the genomic sequences of the Suining14 and ZYD00006 varieties, a total of 383 SNPs and 143 Indels were identified in this region of chromosome 4 (Figure 4A). These SNPs included 71 within the exonic regions of 23 genes, as well as 312 that were located within the promoter region 3000 bp upstream of 34 genes. Of the identified Indels, 4 were located within the exonic regions of 4 genes, while 139 were located within the promoter region 3000 bp upstream of 33 genes (Table S4). In total, these SNPs and Indels were distributed across 38 genes. Through analyses of transcriptomic data, Glyma.04G001500, Glyma.04G001700, Glyma.04G002200, Glyma.04G002300, Glyma.04G002400, Glyma.04G002900, Glyma.04G003200, Glyma.04G003700, and Glyma.04G004100 were found to be expressed at detectable levels in both parental varieties during the stem development stage (Figure 4B). Of these candidate genes, only Glyma.04G004100 differed significantly in expression between these two parental lines. A qPCR-based verification strategy further confirmed that of these nine candidate genes, only Glyma.04G004100 was expressed at significantly higher levels in the stems of Suinong14 plants as compared to those from ZYD00006 plants (Figure 4C and Figure S1). SNP analyses of parental Glyma.04G004100 showed that 18 SNPs and five Indels were identified in the promoter region (Table S4). A further cis-element analysis of the parental promoter region showed that Suinong14 had two additional motifs (AT-rich sequence and Myc motifs) compared to ZYD00006 (Table S7). This analysis suggested that SNPs or Indels within the Glyma.04G004100 promoter region might be responsible for the differential changes in its expression during stem development in plants. Given these results, Glyma.04G004100 was ultimately selected as an SD development-related candidate gene for further analysis.

3.6. Expression Pattern Analysis of Glyma.04G004100 Encoding MYB4 Protein in CSSLs

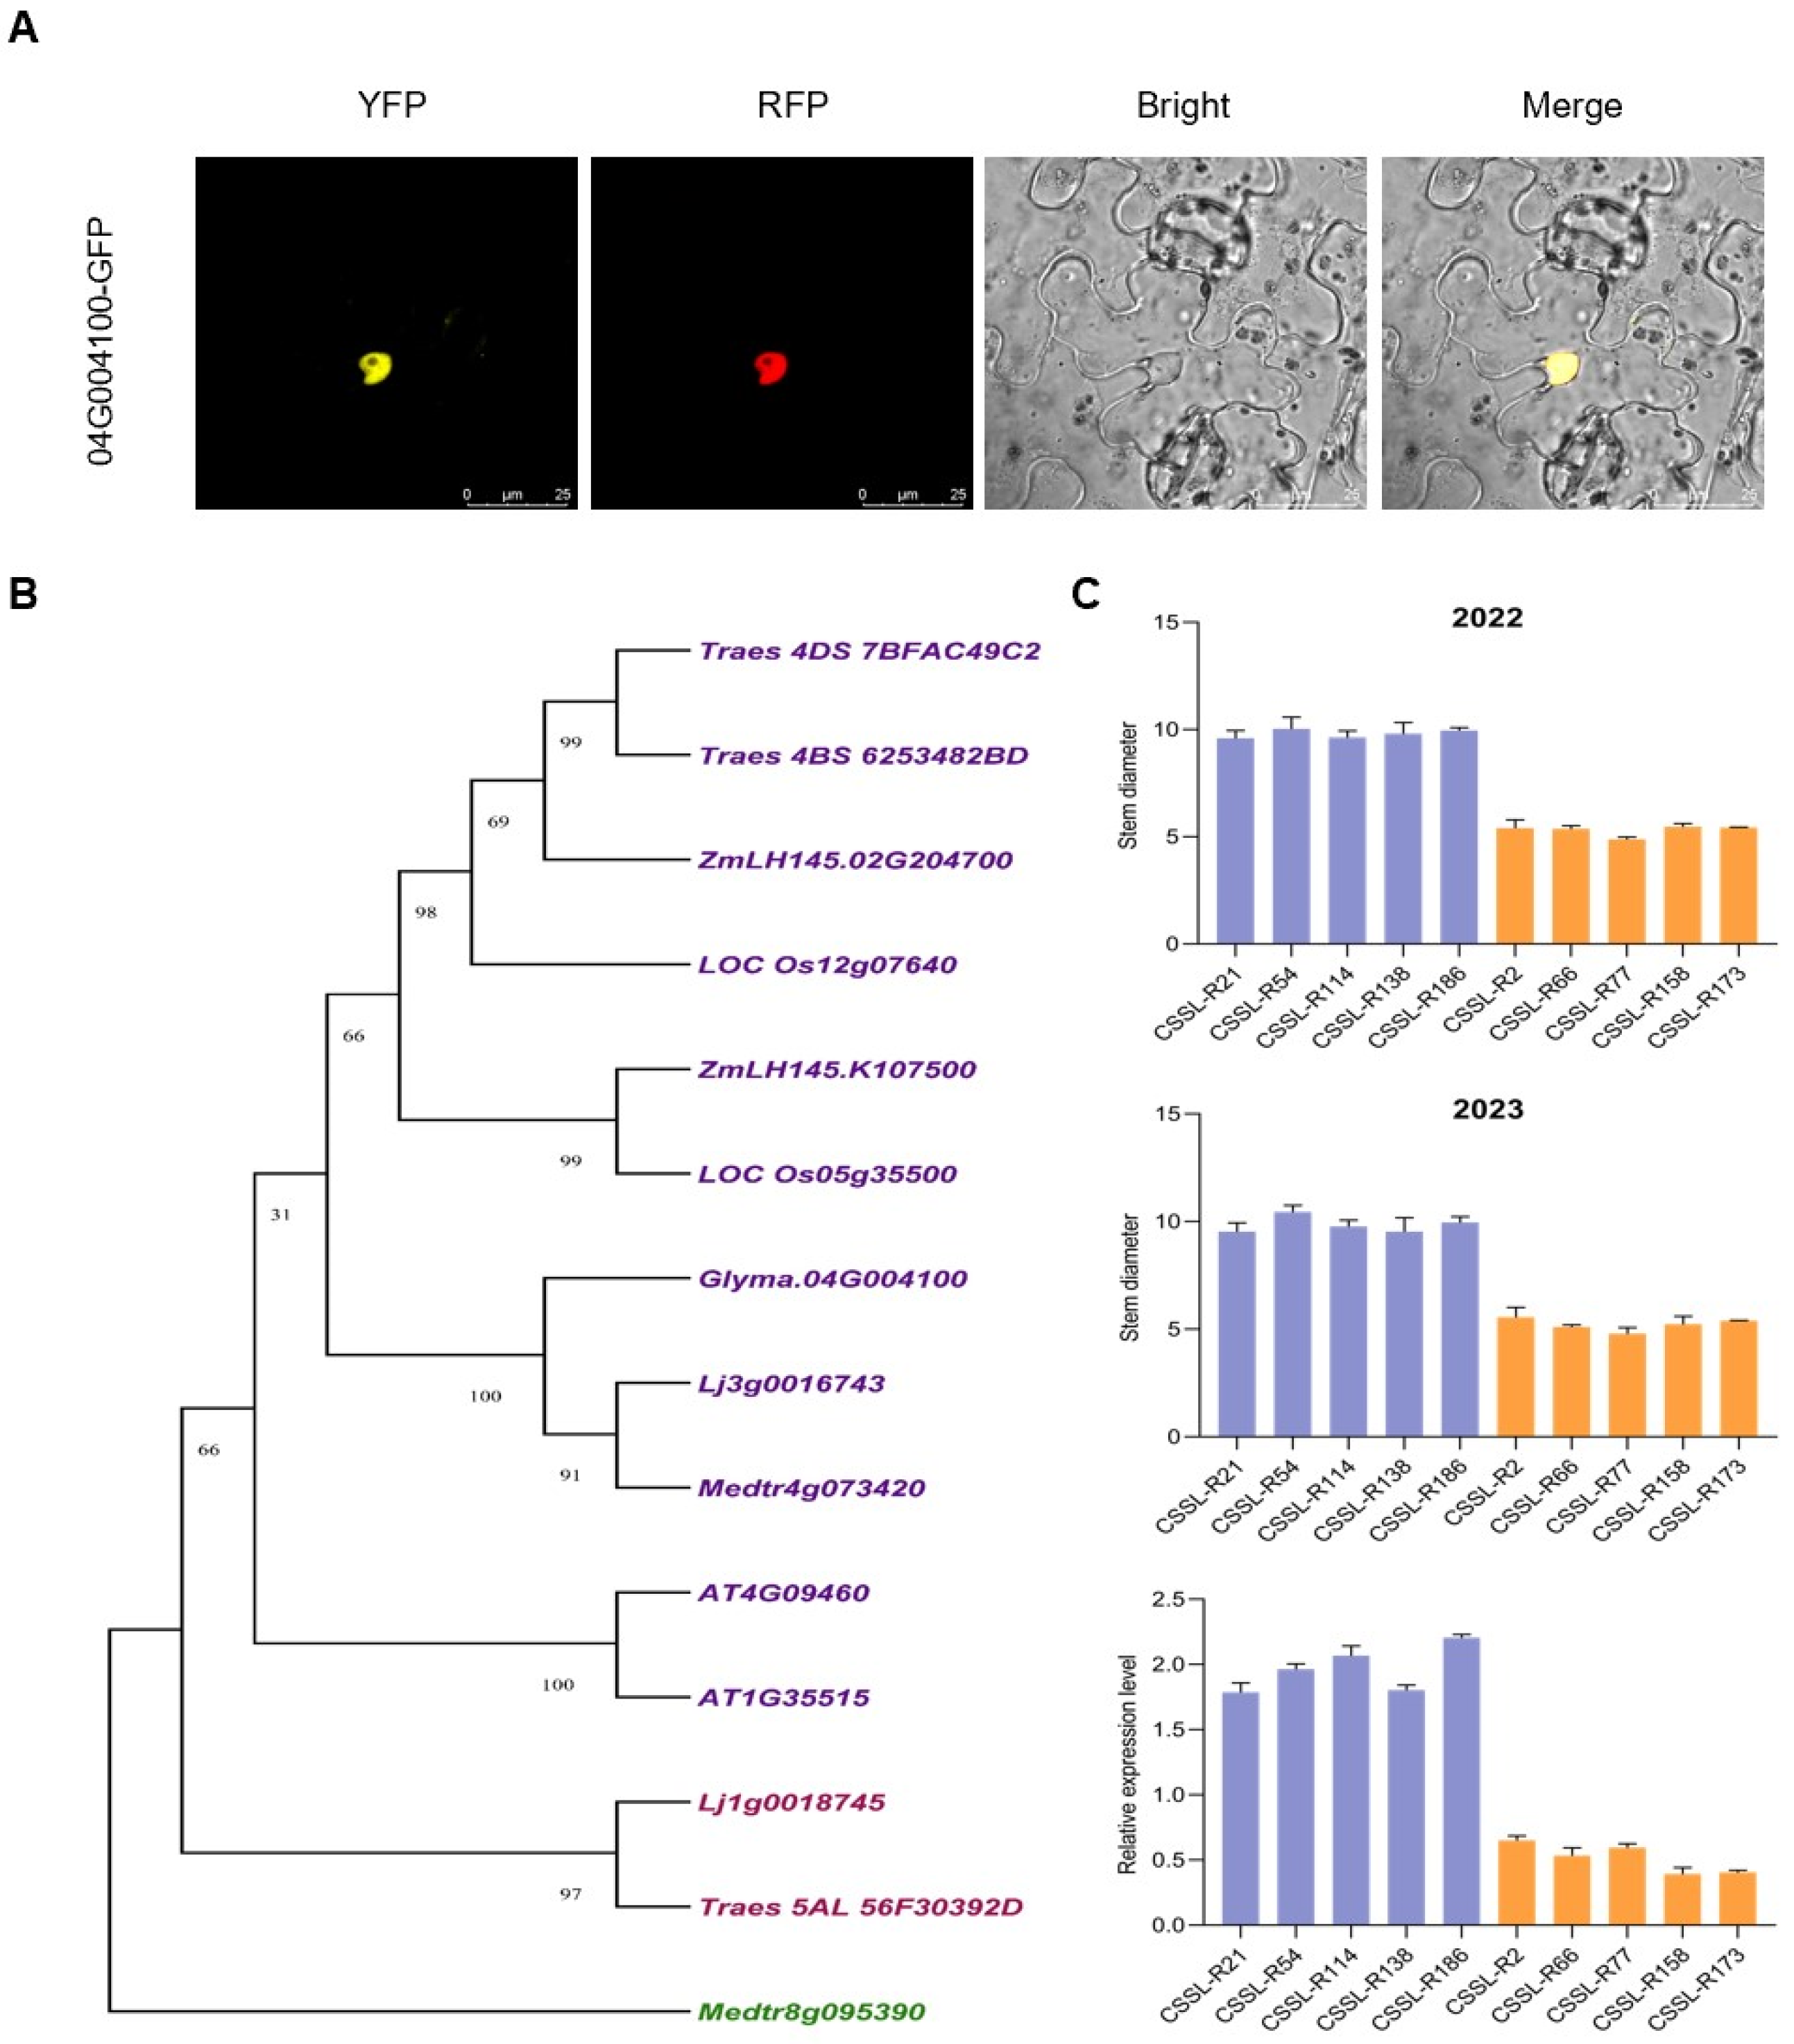
Glyma.04G004100 was found to encode an MYB4 family protein with 211 amino acids that primarily localized to the nucleus in subcellular localization analyses (Figure 5A). A phylogenetic analysis of Glyma.04G004100 was then conducted using data from six different comparator species (Triticum aestivum, Zea mays, Oryza sativa, Medicago sativa, Lotus corniculatus, and Arabidopsis thaliana), revealing that this gene was most closely associated with Lj3g0016743 and Medtr4g073420 (Figure 5B). Five CSSLs exhibiting larger SD values during soybean maturity (CSSL-R21, CSSL-R54, CSSL-R114, CSSL-R138, CSSL-R186) and five exhibiting smaller SD values during this same stage (CSSL-R2, CSSL-R66, CSSL-R77, CSSL-R158, CSSL-R173) were selected next to assess Glyma.04G004100 expression in the context of SD development. The resultant qPCR analyses revealed that Glyma.04G004100 was expressed at significantly higher levels in the five materials exhibiting larger SD values as compared to those with smaller SD values (Figure 5C). This analysis supported a potential role for Glyma.04G004100 in the process of soybean stem development.

3.7. Haplotype Analyses

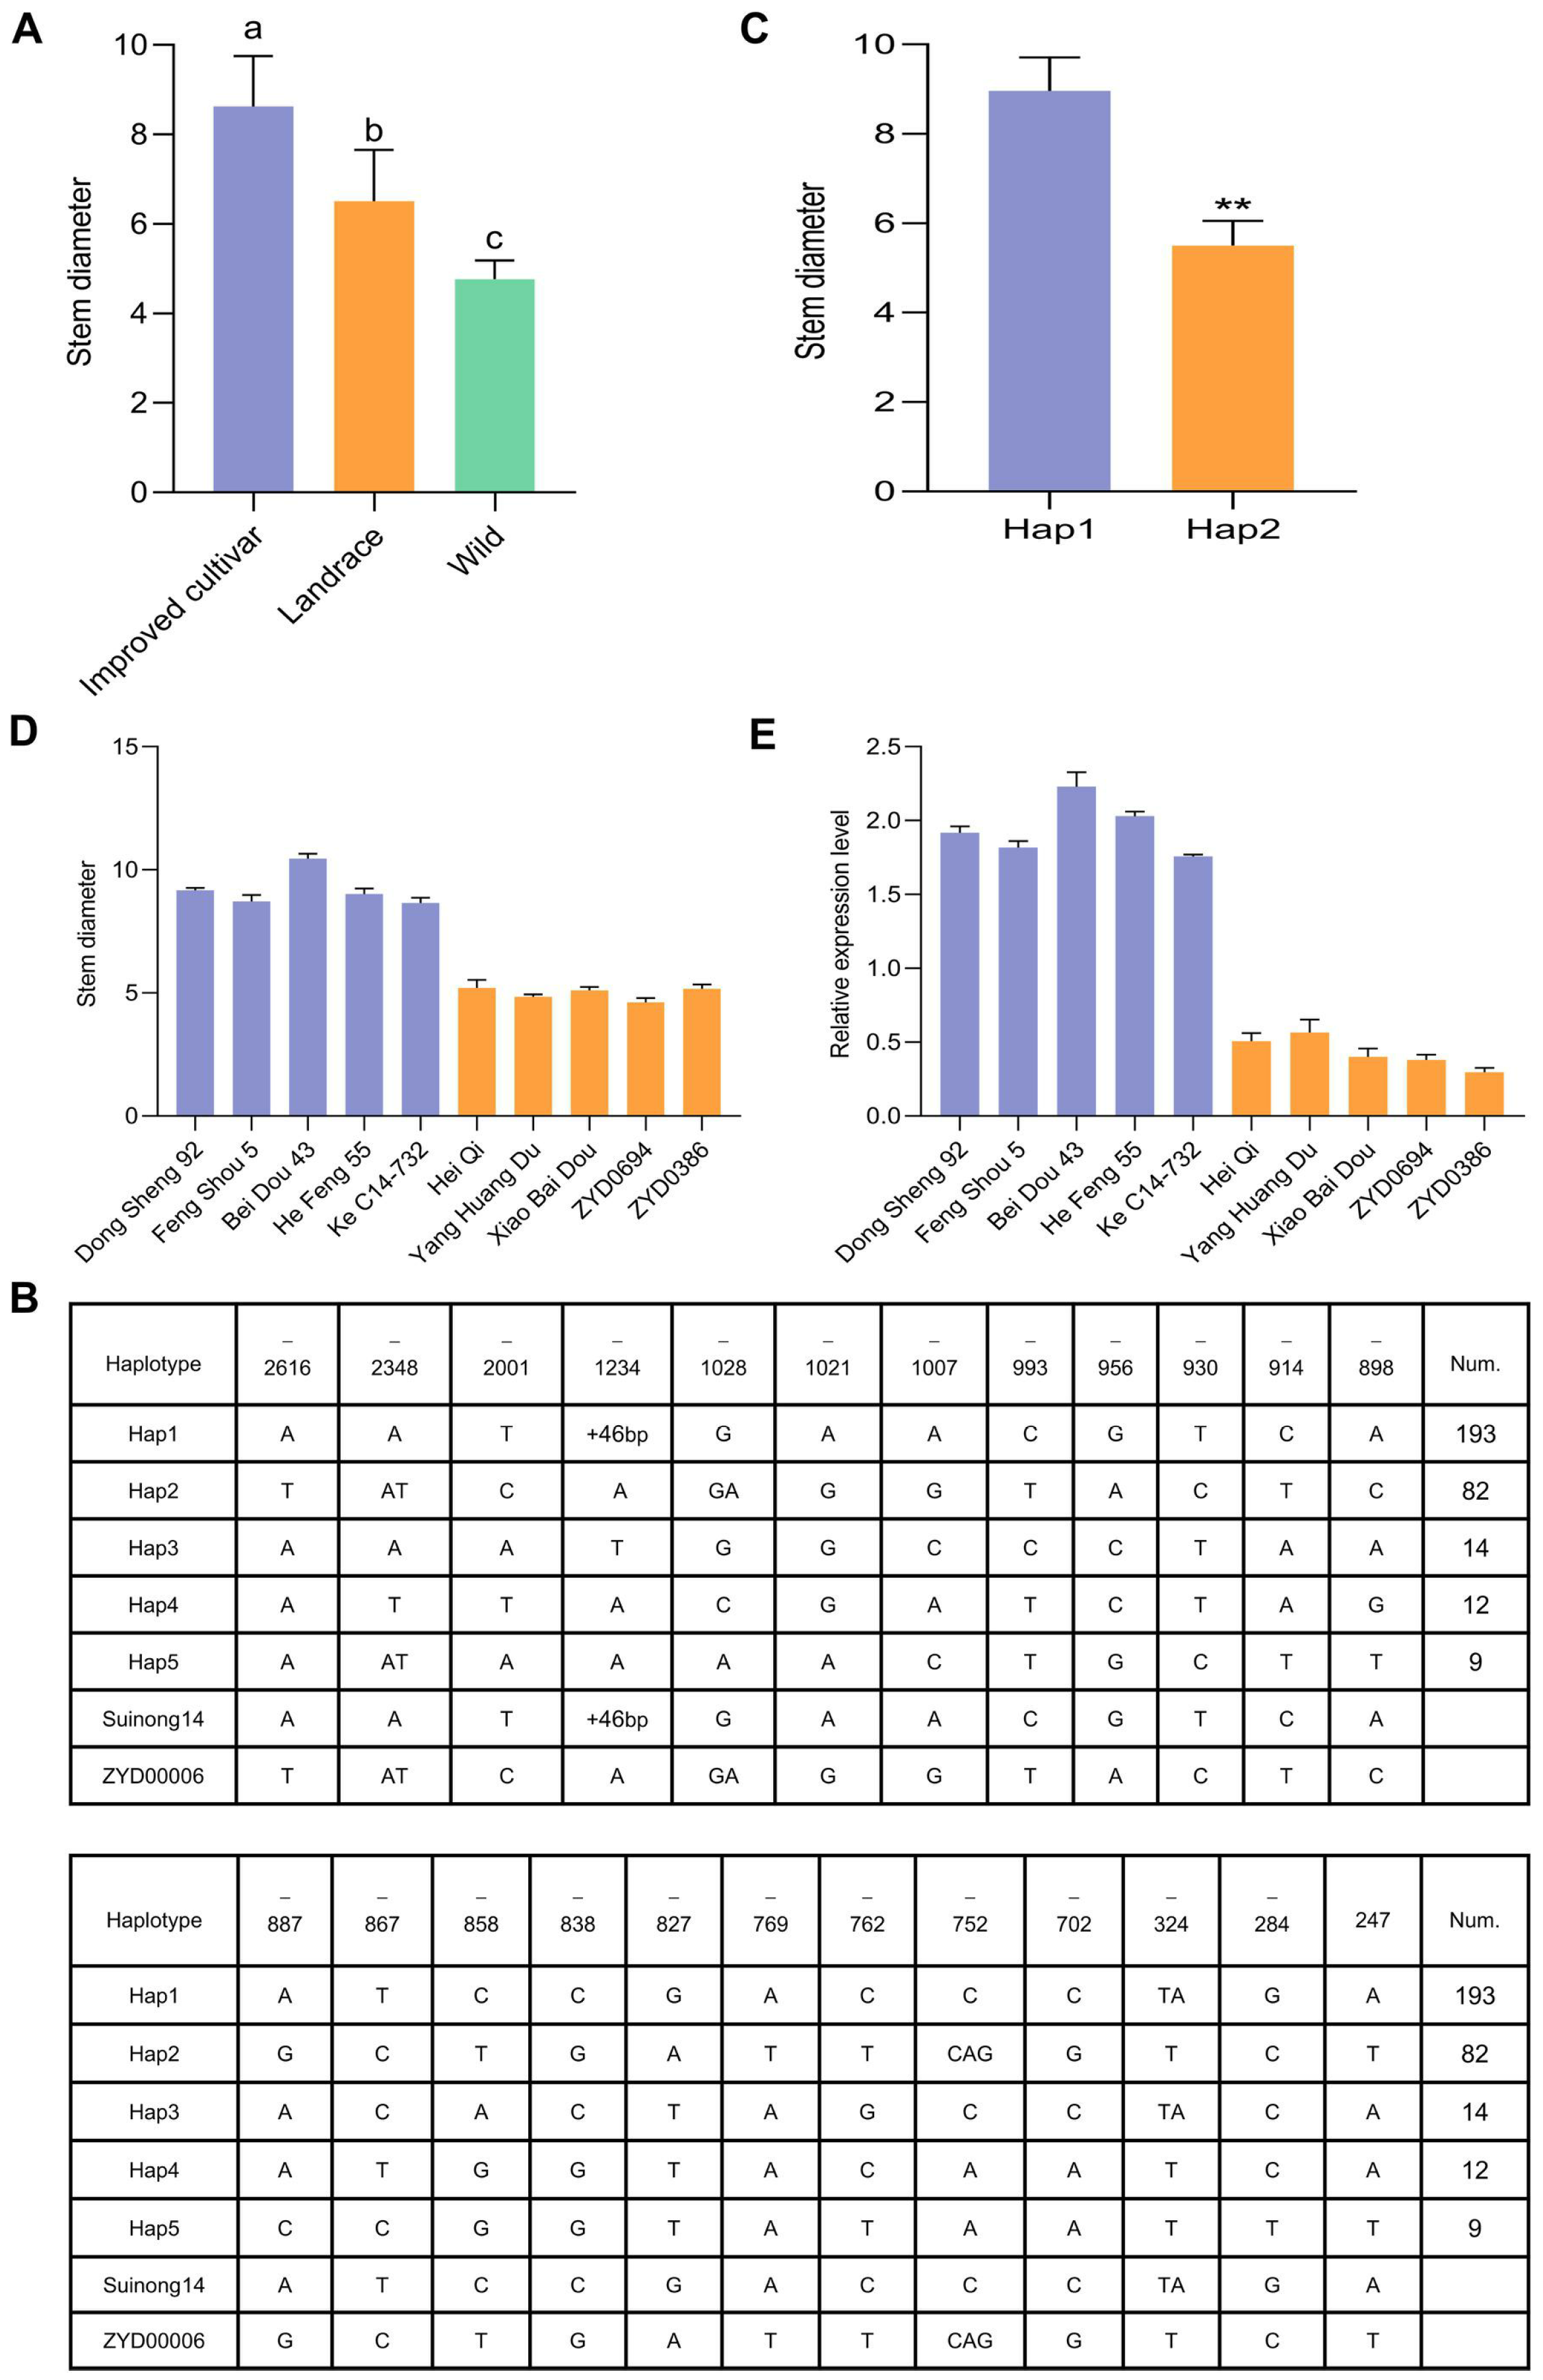
To gain further insight into the relationship between Glyma.04G004100 and soybean SD values, SD measurements were calculated for 310 soybean germplasm resources, including wild, landrace, and improved cultivars (Table S5). These analyses revealed that the improved varieties exhibited the largest SD values (Figure 6A). The Dnasp5.0 software was used to conduct a haplotype analysis of Glyma.04G004100 using the results of resequencing. This approach led to the identification of two excellent haplotypes (Hap1 and Hap2, >5% of the population), with the Suinong14 and ZYD00006 varieties respectively belonging to Hap1 and Hap2 (Figure 6B). In total, 19 SNPs and five Indels were detected in the exon and promoter regions corresponding to Hap1 and Hap2. Association analyses examining the relationship between the Hap1/2 haplotypes and phenotypes revealed that the SD of Hap1 plants was significantly larger than that of Hap2 plants (Figure 6C). A total of five Hap1 and five Hap2 varieties were then selected at random to validate the expression of Glyma.04G004100 at the stem development stage. These analyses confirmed significantly higher Glyma.04G004100 expression levels in Hap1 varieties as compared to Hap2 varieties (Figure 6D,E). These haplotype analyses and associated results thus confirmed a close relationship between Glyma.04G004100 and stem development in soybean plants.

4. Discussion

Lodging is a key factor that influences agricultural yields, as permanent stem displacement that cannot be restored will impair grain quality and output at the time of harvest [28]. Stem lodging resistance is influenced by factors including SD, stem strength, plant height, and the accumulation of lignin [7]. QTLs associated with plant lodging resistance have been described in a range of crop species, and there have been some efforts to confirm the functional roles of candidate genes in these loci [15,17,18,29,30]. SD is an important determinant of lodging resistance, with several SD-related QTLs having been reported in different species [31,32]. For instance, QTLs related to SD were identified in rice, and a preliminary view was given that the SD was affected by the combination of multiple QTLs to influence lodging resistance [13]. At present, there are not many studies on SD-related genes in soybeans. Here, a series of population mapping and high-throughput sequencing approaches were employed to guide the joint identification of QTLs related to SD, providing a means of mining for candidate genes with the potential to improve SD and thereby enhance soybean lodging resistance.
Populations serve as the foundation for the construction of genetic maps and for QTL and fine-mapping efforts. For this study, a CSSL population was generated by crossing and backcrossing the improved variety Suinong14 and wild variety ZYD00006. Populations generated through the use of both improved and wild plant varieties can help the effective utilization of the genetic diversity of wild varieties for the expansion of the genetic basis of existing variety materials [33]. Suinong14 served as the main parental line used in this study, with ZYD00006 import fragments being present in the resultant CSSLs while providing a more consistent genetic background in order to ensure that the identified QTLs were reliable. Overall these analyses yielded nine SD-related QTLs, some of which exhibited overlap with stem strength-related loci (qSS-C2-3) [17], SD-related loci (q11SD2018_dw) [18], and plant height-related loci (qPH-m-2) [27] that have been described previously attesting to the accuracy of these analyses and aligning with genetic analysis strategies. In addition to the CSSL population localization, a germplasm resource population comprising 229 improved varieties, 71 local varieties, and 10 wild varieties was used to conduct haplotype analyses in order to further clarify the association between haplotypes and SD phenotypes in natural soybean populations. Subsequently, we utilized whole genome resequencing to screen for regions of ZYD00006 fragment insertion, RNA-seq, and qRT-PCR to further explore stem diameter-related loci and regulatory genes. GO and KEGG enrichment analysis revealed that DEG functions are enriched in cell differentiation and cell wall organization, mainly involved in the biosynthesis of flavonoids, phenylpropanoids, and brassinosteroids. In plants, cell differentiation and cell wall organization determine the formation of stem tissue and thus affect the growth and development of plant stems [34]. At the same time, secondary metabolism including flavonoids and phenylpropanoids has been proven to play a key role in plant growth and development [35]. Niu et al. found that brassinosteroid (BR) regulates rice stem node elongation, with typical BR-deficient mutants exhibiting internode shortening [36]. Combined with QTLs, these analysis results provide us with scientific ideas for mining and verifying stem development-related regulatory genes.
These analyses led to the identification of Glyma.04G004100, encoding an MYB4 protein 211 amino acids in length, as a regulator of SD development. The MYB family is among the largest groups of transcription factors in plants, with all members of this family containing a conserved Myb domain [37]. Members of the MYB family play diverse regulatory roles in plant growth, hormone responses, and the ability of these plants to respond to biotic and abiotic stressors [38]. Research focused on the MYB-mediated regulation of plant stem development has demonstrated that in herbaceous peony plants, the R2R3 MYB family members PIMYB43, PIMYB83, and PIMYB103 are capable of activating the expression of PICOMT2, which is a gene involved in lignin monomer biosynthesis, as well as PILAC4, which is involved in secondary wall thickening and lignin deposition, thereby yielding greater stem strength [39]. AtMYB91 has been confirmed as a negative regulator of stem morphogenesis during A. thaliana development, with AtMYB30 controlling the elongation of hypocotyl cells through the brassinolide pathway [40,41]. AtMYB117 and AtMYB105 have also been confirmed to play roles in lateral organ and axillary tissue development [42]. Many reports have demonstrated a key role for MYB4 as a regulator of abiotic stress responses. During A. thaliana development, AtMYB4 plays a role as an inhibitor of ADT6 expression, suppressing flavonoid accumulation and protecting plants from abiotic stressors [43]. In rice, drought stress has been demonstrated to induce OsMYB4 displacement expression, thereby bolstering overall drought resistance [44]. OsMYB4 overexpression in Arabidopsis has been linked to greater cold stress tolerance [45]. Light stress can also impact the growth and development of plants, with the exposure of Arabidopsis plants to UV-A and UV-B light respectively inducing and inhibiting AtMYB4 expression. AtMYB4 can also inhibit AtMYB7 expression to control anti-UV irradiation [46]. While MYB4 has thus been the target of extensive research to date, whether it plays a role in regulating stem development remains uncertain. In total, 244 R2R3-MYB genes have been described in soybean and classified into 48 subfamilies [47]. Comparative analyses of patterns of MYB expression in soybean and Arabidopsis have demonstrated that there are certain differences in MYB function, with much uncertainty remaining with respect to the functions of the majority of GmMYB proteins. There have not been any reports describing the role that GmMYB4 plays in stem development, although the R2R3-MYB transcription factor GmGAMYB has been reported in soybean, with its expression being induced in response to gibberellin, promoting increased plant height. Studies have found that GmGAMYB is capable of regulating gibberellin levels through the upregulation of GmGA20ox [48]. Studies of the role of GmMYBs as regulators of plant stress responses have demonstrated the ability of GmMYB76, GmMYB92, and GmMYB177 to serve as regulators of stress-resistance genes in Arabidopsis [49]. Here, the MYB family transcription factor Glyma.04G004100 was revealed to play an important role in regulating soybean SD, with its expression being elevated early during the process of SD development. Based on the SNPs and Indels in the Glyma.04G004100 promoter region of Suinong14 and ZYD00006, the analysis of cis-acting elements within the 3000 bp promoter region upstream of this gene revealed that in the Suinong14 variety, Glyma.04G004100 presents with an additional AT-rich sequence and Myc motifs absent from ZYD00006 (Tables S6 and S7). This AT-rich sequence is a light-responsive element, while the Myc motifs are elements involved in regulating gene expression. These distinct promoter elements may explain the observed differences in Glyma.04G004100 expression between the two parental cultivars. Together, these results support a key role for Glyma.04G004100 as a regulator of stem development that then affects SD, providing a foundation for efforts to leverage this gene to develop lodging-resistant soybean varieties with superior grain yields.

5. Conclusions

In summary, the present analyses initially revealed that the SD of the improved Suinong14 soybean variety was larger than that of the wild ZYD00006 variety. Using a CSSL population, nine total SD-related QTLs were identified through a QTL mapping study. Subsequent whole genome resequencing, RNA-seq, and qPCR analyses led to the selection of Glyma.04G004100 as a candidate SD-related gene. Haplotype and phenotypic data were also combined, providing further support for a link between Glyma.04G004100 and SD. Together, these data offer new evidence regarding the genes that play a role in soybean stem development, offering a foundation for further efforts to explore development-associated pathways and signaling that shape SD.

Supplementary Materials

The following supporting information can be downloaded at https://www.mdpi.com/article/10.3390/agronomy14051019/s1, Figure S1. Validation of relative expression of genes in candidate intervals; Table S1. Primers used in this study; Table S2. The stem diameter of CSSLs; Table S3. RNA-seq sample data quality control; Table S4. SNP statistics of candidate interval between Suinong14 and ZYD00006 of CSSL parents; Table S5. Stem diameter measurement data of germplasm resource population in this study; Table S6. Excellent haplotype promoter sequence; Table S7. Motif analysis of excellent haplotype promoter.

Author Contributions

Conceptualization, Q.C. and J.W.; methodology, L.C, Q.C. and J.W.; software, L.C., S.M., L.Y., C.T., K.Z. and Z.S.; investigation, L.C., F.L., L.L., Z.S., K.Z. and C.L.; data curation, L.C., F.L., L.L., S.M., L.Y., C.T. and C.L.; writing—original draft preparation, L.C. and F.L.; writing—review and editing, L.C., F.L., Q.C. and J.W.; visualization, Q.C. and J.W.; supervision, Q.C. and J.W.; funding acquisition, Q.C. and J.W. All authors have read and agreed to the published version of the manuscript.

Funding

This research was funded by the National Natural Science Foundation of China (Grant numbers: 32201809 and 32272072), Inner Mongolia Autonomous Region science and technology project (Grant number: 2023JBGS0006), and the APC was funded by the National Natural Science Foundation of China (Grant numbers: 32201809 and 32272072) and the Inner Mongolia Autonomous Region science and technology project (Grant number: 2023JBGS0006).

Data Availability Statement

The data presented in this study are available on request from the corresponding author.

Acknowledgments

The authors would like to thank Northeast Agricultural University for supporting this study.

Conflicts of Interest

The authors declare no conflicts of interest.

References

  1. Zhang, J.; Song, Q.; Cregan, P.B.; Jiang, G.-L. Genome-wide association study, genomic prediction and marker-assisted selection for seed weight in soybean (Glycine max). Theor. Appl. Genet. 2016, 129, 117–130. [Google Scholar] [CrossRef]
  2. Dong, L.; Fang, C.; Cheng, Q.; Su, T.; Kou, K.; Kong, L.; Zhang, C.; Li, H.; Hou, Z.; Zhang, Y. Genetic basis and adaptation trajectory of soybean from its temperate origin to tropics. Nat. Commun. 2021, 12, 5445. [Google Scholar] [CrossRef] [PubMed]
  3. Niu, Y.; Chen, T.; Zhao, C.; Zhou, M. Lodging prevention in cereals: Morphological, biochemical, anatomical traits and their molecular mechanisms, management and breeding strategies. Field Crops Res. 2022, 289, 108733. [Google Scholar] [CrossRef]
  4. Yang, L.; Liu, J.; Li, N.; Pei, Y.; Peng, J.; Wang, Z. An integrated strategy coordinating endogenous and exogenous approaches to alleviate crop lodging. Plant Stress 2023, 9, 100197. [Google Scholar]
  5. Zhuang, Y.; Li, X.; Hu, J.; Xu, R.; Zhang, D. Expanding the gene pool for soybean improvement with its wild relatives. Abiotech 2022, 3, 115–125. [Google Scholar] [CrossRef]
  6. Cristina da Silva Reis, K.; Savario, C.F.; Hoy, J.W. Effects of Pesticides on Red Rot of Planted Sugarcane. Plant Dis. 2023, 107, 3616–3622. [Google Scholar] [CrossRef]
  7. Niu, Y.; Chen, T.; Zhao, C.; Zhou, M. Improving crop lodging resistance by adjusting plant height and stem strength. Agronomy 2021, 11, 2421. [Google Scholar] [CrossRef]
  8. Afza, R.; Hardarson, G.; Zapata, F.; Danso, S. Effects of delayed soil and foliar N fertilization on yield and N 2 fixation of soybean. Plant Soil 1987, 97, 361–368. [Google Scholar] [CrossRef]
  9. Khobra, R.; Sareen, S.; Meena, B.K.; Kumar, A.; Tiwari, V.; Singh, G. Exploring the traits for lodging tolerance in wheat genotypes: A review. Physiol. Mol. Biol. Plants 2019, 25, 589–600. [Google Scholar] [CrossRef]
  10. Zuber, U.; Winzeler, H.; Messmer, M.; Keller, M.; Keller, B.; Schmid, J.; Stamp, P. Morphological traits associated with lodging resistance of spring wheat (Triticum aestivum L.). J. Agron. Crop Sci. 1999, 182, 17–24. [Google Scholar] [CrossRef]
  11. Wei, X.; Zhou, H.; Xie, D.; Li, J.; Yang, M.; Chang, T.; Wang, D.; Hu, L.; Xie, G.; Wang, J. Genome-wide association study in rice revealed a novel gene in determining plant height and stem development, by encoding a WRKY transcription factor. Int. J. Mol. Sci. 2021, 22, 8192. [Google Scholar] [CrossRef] [PubMed]
  12. Dixon, L.E.; Pasquariello, M.; Boden, S.A. TEOSINTE BRANCHED1 regulates height and stem internode length in bread wheat. J. Exp. Bot. 2020, 71, 4742–4750. [Google Scholar] [CrossRef]
  13. Kashiwagi, T.; Togawa, E.; Hirotsu, N.; Ishimaru, K. Improvement of lodging resistance with QTLs for stem diameter in rice (Oryza sativa L.). Theor. Appl. Genet. 2008, 117, 749–757. [Google Scholar] [CrossRef] [PubMed]
  14. Long, W.; Dan, D.; Yuan, Z.; Chen, Y.; Jin, J.; Yang, W.; Zhang, Z.; Li, N.; Li, S. Deciphering the genetic basis of lodging resistance in wild rice Oryza longistaminata. Front. Plant Sci. 2020, 11, 628. [Google Scholar] [CrossRef]
  15. Shang, Q.; Zhang, D.; Li, R.; Wang, K.; Cheng, Z.; Zhou, Z.; Hao, Z.; Pan, J.; Li, X.; Shi, L. Mapping quantitative trait loci associated with stem-related traits in maize (Zea mays L.). Plant Mol. Biol. 2020, 104, 583–595. [Google Scholar] [CrossRef]
  16. Smitchger, J.; Weeden, N. Quantitative trait loci controlling lodging resistance and other important agronomic traits in dry field peas. Crop Sci. 2019, 59, 1442–1456. [Google Scholar] [CrossRef]
  17. Chen, H.; Shan, Z.; Sha, A.; Wu, B.; Yang, Z.; Chen, S.; Zhou, R.; Zhou, X. Quantitative trait loci analysis of stem strength and related traits in soybean. Euphytica 2011, 179, 485–497. [Google Scholar] [CrossRef]
  18. Sun, C.-Y.; Yang, Y.-M.; Jia, L.; Liu, X.-Q.; Xu, H.-Q.; Lv, H.-Y.; Huang, Z.-W.; Zhang, D. QTL mapping of the genetic basis of stem diameter in soybean. Planta 2021, 253, 1–12. [Google Scholar] [CrossRef] [PubMed]
  19. Wu, T.; Xu, X.; Zhang, L.; Yuan, S.; Chen, F.; Sun, S.; Jiang, B. Progress and future impacts on genomic dissection of soybean domestication and improvement. Crit. Rev. Plant Sci. 2024, 43, 116–130. [Google Scholar] [CrossRef]
  20. Zheng, H.; Hou, L.; Xie, J.; Cao, F.; Wei, R.; Yang, M.; Qi, Z.; Zhu, R.; Zhang, Z.; Xin, D. Construction of chromosome segment substitution lines and inheritance of seed-pod characteristics in wild soybean. Front. Plant Sci. 2022, 13, 869455. [Google Scholar] [CrossRef]
  21. Wang, J.; Feng, H.; Jia, X.; Ma, S.; Ma, C.; Wang, Y.; Pan, S.; Chen, Q.; Xin, D.; Liu, C. Identifications of QTLs and candidate genes associated with Pseudomonas syringae responses in cultivated soybean (Glycine max) and wild soybean (Glycine soja). Int. J. Mol. Sci. 2023, 24, 4618. [Google Scholar] [CrossRef]
  22. Xin, D.; Qi, Z.; Jiang, H.; Hu, Z.; Zhu, R.; Hu, J.; Han, H.; Hu, G.; Liu, C.; Chen, Q. QTL location and epistatic effect analysis of 100-seed weight using wild soybean (Glycine soja Sieb. & Zucc.) chromosome segment substitution lines. PLoS ONE 2016, 11, e0149380. [Google Scholar]
  23. Peng, J.; Shi, X.; Sun, Y.; Li, D.; Liu, B.; Kong, F.; Yuan, X. QTLMiner: QTL database curation by mining tables in literature. Bioinformatics 2015, 31, 1689–1691. [Google Scholar] [CrossRef] [PubMed]
  24. Qiu, L.; Chang, R.; Liu, Z.; Guan, R.; Li, Y. Descriptors and Data Standard for Soybean (Glycine spp.); China Agriculture Press: Beijing, China, 2006. [Google Scholar]
  25. Wang, S.; Basten, C.; Zeng, Z. Windows QTL Cartographer Version 2.5. 2005. Available online: https://api.semanticscholar.org/CorpusID:67296679 (accessed on 20 November 2023).
  26. Wang, J.; Ma, C.; Ma, S.; Zheng, H.; Tian, H.; Wang, X.; Wang, Y.; Jiang, H.; Wang, J.; Zhang, Z. Genetic variation in GmCRP contributes to nodulation in soybean (Glycine max Merr.). Crop J. 2023, 11, 332–344. [Google Scholar] [CrossRef]
  27. Li, R.; Jiang, H.; Zhang, Z.; Zhao, Y.; Xie, J.; Wang, Q.; Zheng, H.; Hou, L.; Xiong, X.; Xin, D. Combined linkage mapping and BSA to identify QTL and candidate genes for plant height and the number of nodes on the main stem in soybean. Int. J. Mol. Sci. 2019, 21, 42. [Google Scholar] [CrossRef] [PubMed]
  28. Liao, P.; Bell, S.M.; Chen, L.; Huang, S.; Wang, H.; Miao, J.; Qi, Y.; Sun, Y.; Liao, B.; Zeng, Y. Improving rice grain yield and reducing lodging risk simultaneously: A meta-analysis. Eur. J. Agron. 2023, 143, 126709. [Google Scholar] [CrossRef]
  29. Yuhui, C.; Xujun, C.; Ke, X.; Qikai, X.; Yawen, W.; Jing, L.; Caihong, D.; Zongxiu, S.; Zejian, G.; Jin-Song, Z. Dlf1, a WRKY Transcription Factor, Is Involved in the Control of Flowering Time and Plant Height in Rice. PLoS ONE 2014, 9, e102529. [Google Scholar]
  30. Guo, D.; Zhang, J.; Wang, X.; Han, X.; Wei, B.; Wang, J.; Li, B.; Yu, H.; Huang, Q.; Gu, H. The WRKY transcription factor WRKY71/EXB1 controls shoot branching by transcriptionally regulating RAX genes in Arabidopsis. Plant Cell 2015, 27, 3112–3127. [Google Scholar] [CrossRef] [PubMed]
  31. Kong, W.; Jin, H.; Goff, V.H.; Auckland, S.A.; Rainville, L.K.; Paterson, A.H. Genetic analysis of stem diameter and water contents to improve sorghum bioenergy efficiency. G3. Genes Genomes Genet. 2020, 10, 3991–4000. [Google Scholar] [CrossRef] [PubMed]
  32. Shen, Y.; Xiang, Y.; Xu, E.; Ge, X.; Li, Z. Major co-localized QTL for plant height, branch initiation height, stem diameter, and flowering time in an alien introgression derived Brassica napus DH population. Front. Plant Sci. 2018, 9, 332952. [Google Scholar] [CrossRef]
  33. Swarup, S.; Cargill, E.J.; Crosby, K.; Flagel, L.; Kniskern, J.; Glenn, K.C. Genetic diversity is indispensable for plant breeding to improve crops. Crop Sci. 2021, 61, 839–852. [Google Scholar] [CrossRef]
  34. Satterlee, J.W.; Strable, J.; Scanlon, M.J. Plant stem-cell organization and differentiation at single-cell resolution. Proc. Natl. Acad. Sci. USA 2020, 117, 33689–33699. [Google Scholar] [CrossRef] [PubMed]
  35. Sun, J.; Du, L.; Qu, Z.; Wang, H.; Dong, S.; Li, X.; Zhao, H. Integrated metabolomics and proteomics analysis to study the changes in Scutellaria baicalensis at different growth stages. Food Chem. 2023, 419, 136043. [Google Scholar] [CrossRef] [PubMed]
  36. Niu, M.; Wang, H.; Yin, W.; Meng, W.; Xiao, Y.; Liu, D.; Zhang, X.; Dong, N.; Liu, J.; Yang, Y. Rice DWARF AND LOW-TILLERING and the homeodomain protein OSH15 interact to regulate internode elongation via orchestrating brassinosteroid signaling and metabolism. Plant Cell 2022, 34, 3754–3772. [Google Scholar] [CrossRef] [PubMed]
  37. Yang, X.; Li, J.; Guo, T.; Guo, B.; Chen, Z.; An, X. Comprehensive analysis of the R2R3-MYB transcription factor gene family in Populus trichocarpa. Ind. Crops Prod. 2021, 168, 113614. [Google Scholar] [CrossRef]
  38. Thakur, S.; Vasudev, P.G. MYB transcription factors and their role in Medicinal plants. Mol. Biol. Rep. 2022, 49, 10995–11008. [Google Scholar] [CrossRef] [PubMed]
  39. Tang, Y.; Lu, L.; Sheng, Z.; Zhao, D.; Tao, J. An R2R3-MYB network modulates stem strength by regulating lignin biosynthesis and secondary cell wall thickening in herbaceous peony. Plant J. 2023, 113, 1237–1258. [Google Scholar] [CrossRef] [PubMed]
  40. Byrne, M.E.; Barley, R.; Curtis, M.; Arroyo, J.M.; Dunham, M.; Hudson, A.; Martienssen, R.A. Asymmetric leaves1 mediates leaf patterning and stem cell function in Arabidopsis. Nature 2000, 6815, 967–971. [Google Scholar] [CrossRef] [PubMed]
  41. Li, L.; Yu, X.; Thompson, A.; Guo, M.; Yoshida, S.; Asami, T.; Chory, J.; Yin, Y. Arabidopsis MYB30 is a direct target of BES1 and cooperates with BES1 to regulate brassinosteroid-induced gene expression. Plant J. 2010, 58, 275–286. [Google Scholar] [CrossRef] [PubMed]
  42. Lee, D.K.; Geisler, M.; Springer, P.S. LATERAL ORGAN FUSION1 and LATERAL ORGAN FUSION2 function in lateral organ separation and axillary meristem formation in Arabidopsis. Development 2009, 136, 2423. [Google Scholar] [CrossRef]
  43. Wang, X.C.; Wu, J.; Guan, M.L.; Zhao, C.H.; Geng, P.; Zhao, Q. Arabidopsis MYB4 plays dual roles in flavonoid biosynthesis. Plant J. 2020, 101, 637–652. [Google Scholar] [CrossRef]
  44. Peng, Y.; Tang, N.; Zou, J.; Ran, J.; Chen, X. Rice MYB transcription factor OsMYB1R1 negatively regulates drought resistance. Plant Growth Regul. 2023, 99, 515–525. [Google Scholar] [CrossRef]
  45. Aydın, G. Effect of Osmyb4 gene expression on salinity tolerance of potato transformed with Oryza sativa Osmyb4 gene. Anadolu Tarim Bilim. Derg. 2020, 35, 115–123. [Google Scholar] [CrossRef]
  46. Jin, H.; Cominelli, E.; Bailey, P.; Parr, A.; Mehrtens, F.; Jones, J.; Tonelli, C.; Weisshaar, B.; Martin, C. Transcriptional repression by AtMYB4 controls production of UV-protecting sunscreens in Arabidopsis. EMBO J. 2000, 19, 6150–6161. [Google Scholar] [CrossRef] [PubMed]
  47. Yu, M.; Man, Y.; Wang, Y. Light-and temperature-induced expression of an R2R3-MYB gene regulates anthocyanin biosynthesis in red-fleshed kiwifruit. Int. J. Mol. Sci. 2019, 20, 5228. [Google Scholar] [CrossRef] [PubMed]
  48. Yang, X.; Li, X.; Shan, J.; Li, Y.; Zhang, Y.; Wang, Y.; Li, W.; Zhao, L. Overexpression of GmGAMYB accelerates the transition to flowering and increases plant height in soybean. Front. Plant Sci. 2021, 12, 667242. [Google Scholar] [CrossRef]
  49. Liao, Y.; Zou, H.-F.; Wang, H.-W.; Zhang, W.-K.; Ma, B.; Zhang, J.-S.; Chen, S.-Y. Soybean GmMYB76, GmMYB92, and GmMYB177 genes confer stress tolerance in transgenic Arabidopsis plants. Cell Res. 2008, 18, 1047–1060. [Google Scholar] [CrossRef]
Figure 1. Statistical analyses of SD measurements in CSSL population over two years. (A) A schematic overview of the SD measurement phenotypes for the Suinong14 and ZYD00006 varieties. (B) SD measurements for the Suinong14 and ZYD00006 varieties over two years. ** p < 0.01, Student’s t-test. (C) Frequency distributions for SD measurements in CSSLs in 2022 and 2023.
Agronomy 14 01019 g001
Figure 2. Fine localization analyses of extreme materials from CSSL populations. The blue region of the indicated chromosome corresponds to the ZYD00006 homozygous import, while the orange region corresponds to the ZYD00006 heterozygous import. Based on the ZYD00006 fragment’s introduction into the selected materials, the candidate interval was narrowed to a 335 kb region of chromosome 4 situated between the BARCSOYSSR_04_0007 and Satt690 markers.
Agronomy 14 01019 g002
Figure 3. Comparative transcriptome analyses of Suinong14 and ZYD00006 during the process of stem development. (A) Volcano plot. (B) A heatmap of DEGs. (C,D) GO and KEGG enrichment analysis results for DEGs.
Agronomy 14 01019 g003
Figure 4. SD-related candidate gene identification. (A) Analyses of SNPs within the candidate interval (SNPs, Indels) in the Suiong14 and ZYD00006 genomes. The numbers of SNPs in 1 kb sliding windows are indicated with a color scale, with darker colors corresponding to more SNPs. (B) A candidate gene heatmap of SNP- or Indel-containing genes. (C) qPCR analyses of the relative Glyma.04G004100 expression in Suinong14 and ZYD00006 samples during stem development. ** p < 0.01, Student’s t-test.
Agronomy 14 01019 g004
Figure 5. Analyses of Glyma.04G004100 expression in CSSLs exhibiting significant differences in SD. (A) The subcellular localization of YFP-tagged Glyma.04G004100; scale bar: 25 μm. (B) A maximum likelihood phylogenetic analysis of Glyma.04G004100 in 6 plant species. (C) Five varieties (CSSL-R21, CSSL-R54, CSSL-R114, CSSL-R138, CSSL-R186) exhibiting larger SD values and five (CSSL-R2, CSSL-R66, CSSL-R77, CSSL-R158, CSSL-R173) exhibiting smaller SD values in the field in 2022 and 2023 were selected to analyze Glyma.04G004100 expression at the SD development stage. Data are presented as the means of three replicates.
Agronomy 14 01019 g005
Figure 6. Glyma.04G004100 haplotype analysis. (A) Duncan’s multiple range test was used to evaluate the SD data from 310 natural soybean germplasm resources at the maturity stage, with different letters being used to denote significant differences (p < 0.05). (B) Glyma.04G004100 haplotype analysis. (C) SD statistics for the excellent Hap1 and Hap2 haplotypes, with data presented as the means of three replicates. ** p < 0.01, Student’s t-test. (D,E) Five Hap1 and Hap2 materials were selected for analyses of Glyma.04G004100 expression during SD development process. Data are presented as the means of three replicates.
Agronomy 14 01019 g006
Table 1. The stem diameter of the parent and CSSL population.
TraitYearParentsCSSLs (n = 207)
ZYD00006Suinong14Mean ± SDKurtosisSkewness
SD20224.97 **8.737.75 ± 1.090.35−0.54
20234.85 **8.257.78 ± 1.130.53−0.40
** indicates p ≤ 0.01; SD, standard deviation; kurtosis is the characteristic number representing the peak height of the probability density distribution curve at the mean value; skewness is a measure of the skew direction and degree of statistical data distribution.
Table 2. Identification of SD-associated QTLs in CSSL population.
TraitYearChr/LGQTLPosition
(Mb)
LODR2ADDPrevious Studies
SD2022Chr06/C2qSD-22-0624.03.7442.12qSS-C2-3 [17]
Chr19/LqSD-22-1941.43.255−0.78
Chr04/C1qSD-22-041.36.403−1.20
Chr09/KqSD-22-0944.34.4260.08
2023Chr11/B1qSD-23-1132.56.1220.42q11SD2018_DW [18]
Chr04/C1qSD-23-041.37.295−0.75
Chr02/D1bqSD-23-0215.13.0831.32
Chr07/MqSD-23-0736.73.3041.76qPH-m-2 [27]
Chr20/IqSD-23-2017.15.524−0.56
Chr03/NqSD-23-0342.95.832−0.32
Chr, chromosome; QTL, quantitative trait loci; LG, linkage group; LOD, log of odds ratio; R2, phenotypic variance explained; ADD, additive effects value.
Disclaimer/Publisher’s Note: The statements, opinions and data contained in all publications are solely those of the individual author(s) and contributor(s) and not of MDPI and/or the editor(s). MDPI and/or the editor(s) disclaim responsibility for any injury to people or property resulting from any ideas, methods, instructions or products referred to in the content.