Article

Water-Use Characteristics of Wheat–Maize Rotation System as Affected by Nitrogen Application Rate in North China Plain

1
Institute of Farmland Irrigation, Chinese Academy of Agriculture Sciences, Xinxiang 453002, China
2
Key Laboratory of Water-Saving Engineering, Ministry of Agriculture and Rural Affairs, Xinxiang 453002, China
*
Author to whom correspondence should be addressed.
Agronomy 2024, 14(5), 1006; https://doi.org/10.3390/agronomy14051006
Submission received: 2 April 2024 / Revised: 21 April 2024 / Accepted: 7 May 2024 / Published: 10 May 2024

Abstract

:
Reducing the nitrogen (N) application rate and improving water-use efficiency (WUE) are extremely important for sustainable agricultural development in wheat–maize rotation systems in the North China Plain (NCP). We conducted a three-year experiment to investigate the effects of the N application rate on the water-use characteristics of wheat–maize rotation systems in the NCP. The experiment consisted of four N application rates: 250, 167, 84, and 0 kg hm−2, denoted by N3, N2, N1, and N0, respectively. The results showed the following: For the 0–60 cm soil layer, N deficiency could lead to reduced soil water use (SWU) in wheat seasons, but in maize seasons, N deficiency showed no significant effects on SWU in the 0–60 cm layer. For the 60–140 cm soil layer, N deficiency could lead to reduced SWU in wheat seasons, but in maize seasons, the effects of N deficiency on SWU in the 60–140 cm layer varied with the SWC in the 0–60 cm layer. Throughout the three-year experiment, the evapotranspiration (ET), leaf area index (LAI), yield, and WUE of plants receiving low N treatments decreased with the growing season due to the negative effects of low N treatment (N1 and N0) on the soil. The LAI, total ET, grain yield, and WUE were all positively correlated with each other for both wheat and maize. Considering grain yield and WUE, a single-season N application rate of 167 kg hm−2 (N2 treatment) in the NCP could meet the growth needs of the wheat–maize rotation system.

1. Introduction

The wheat–maize rotation is the primary agricultural production system that is extensively planted in the North China Plain (NCP). In 2021, wheat and maize production in the NCP accounted for 71.6% and 28.0% of the total national wheat and maize production [1], respectively, which played an important role in ensuring China’s national food security.
However, water scarcity and the inefficient utilization of water and nitrogen (N) have also been a long-standing problem in the NPC. Precipitation in the NPC is very unevenly distributed within the year, and the wheat season is relatively dry with little precipitation, which is far from able to satisfy the growth and development needs of wheat, while in maize season, due to the spatial variations in rainfall, irrigation is also usually needed to compensate for untimely and inadequate precipitation. Large amounts of irrigation have led to the increasing depletion of groundwater resources in the NPC, with groundwater levels declining at a rate of 0.5–1.0 m per year, which has caused many serious environmental and ecological problems in the region [2], and has forced the region to continually improve the crop water-use efficiency (WUE) to achieve the sustainable use of water resources.
N is an essential nutrient for crop growth and development and is usually taken up from the soil through roots and then transferred to shoots and grains [3,4,5]. Fertilizer N inputs are the main source of crop N demand in food production for nearly half the world’s population [6,7], contributing to 45–50% of current global food production [8]. Chinese agricultural producers, influenced by traditional concepts, have been over-applying N for a long time to ensure stable and high yields, and China is now the world’s largest consumer of N from fertilizers, using about 11.9 million tons of fertilizer N in wheat and maize production in 2018 [9]. However, excessive N application not only fails to improve crop yields but also leads to environmental problems, such as water and air quality, biological diversity, and the human hazards of nitrate [10,11,12]; in addition, the low efficiency of N fertilizer and large doses of N also lead to large economic outlays and, often, low farm profits. Moreover, N management in crop production varies with the soil, climatic, and management factors [3,13].
Different N application rates cause changes in the water-use characteristics of crops. First, different N application rates affect the growth of the crop, such as the development of leaves [14,15,16], which are the main transpiration organ in the crop, and this indirectly affects the water-use characteristics of the crop. Second, changes in the N application rate also cause changes in the crop root system [17,18,19], which is the main water-absorbing organ of the crop, and this indirectly affects the crop’s utilization of soil water [17,20]. At the same time, moderate increases in N application can increase water use and WUE [21,22,23], whereas when the N application rate exceeds a certain value, further increases in N application do not increase crop water use [24,25,26].
Thus, studying the water-use characteristics of a wheat–maize rotation system under different N application rates is of great significance for the rational utilization of water resources in the NCP. This three-year experiment investigated the effects of four N application rates on leaf area index, soil water content, evapotranspiration, yield, and WUE. The purpose of this study was to investigate the similarities and differences in the water-use characteristics of wheat and maize under different N application rates, and to provide suitable N application rates for wheat–maize rotation systems under drip irrigation conditions in the NPC.

2. Materials and Methods

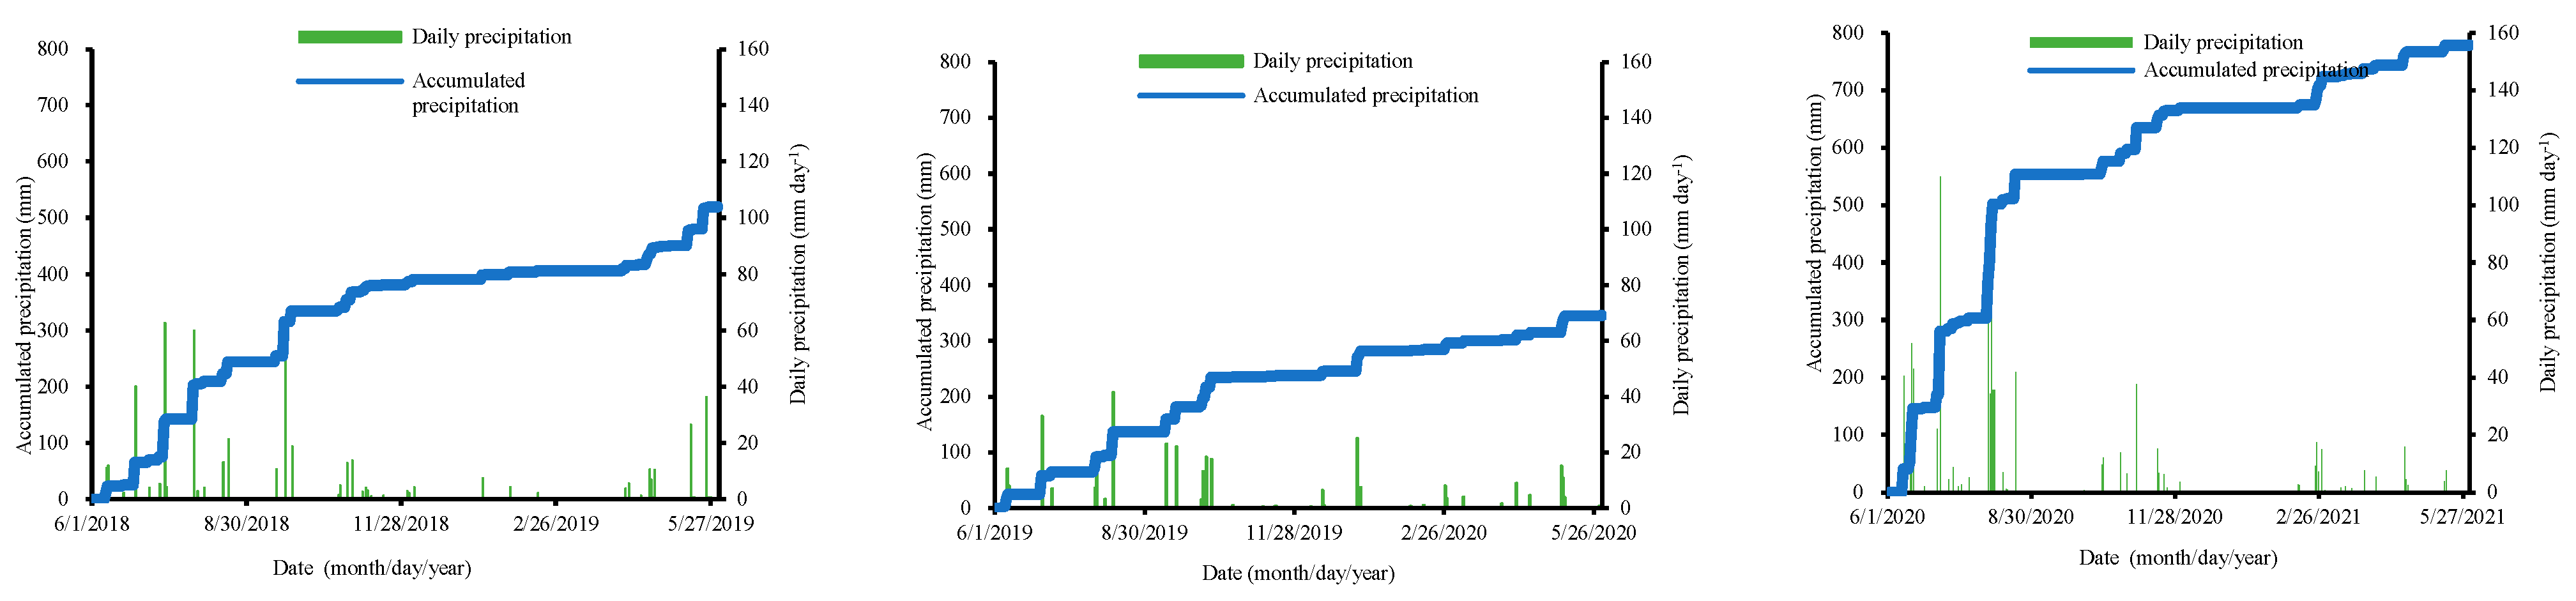
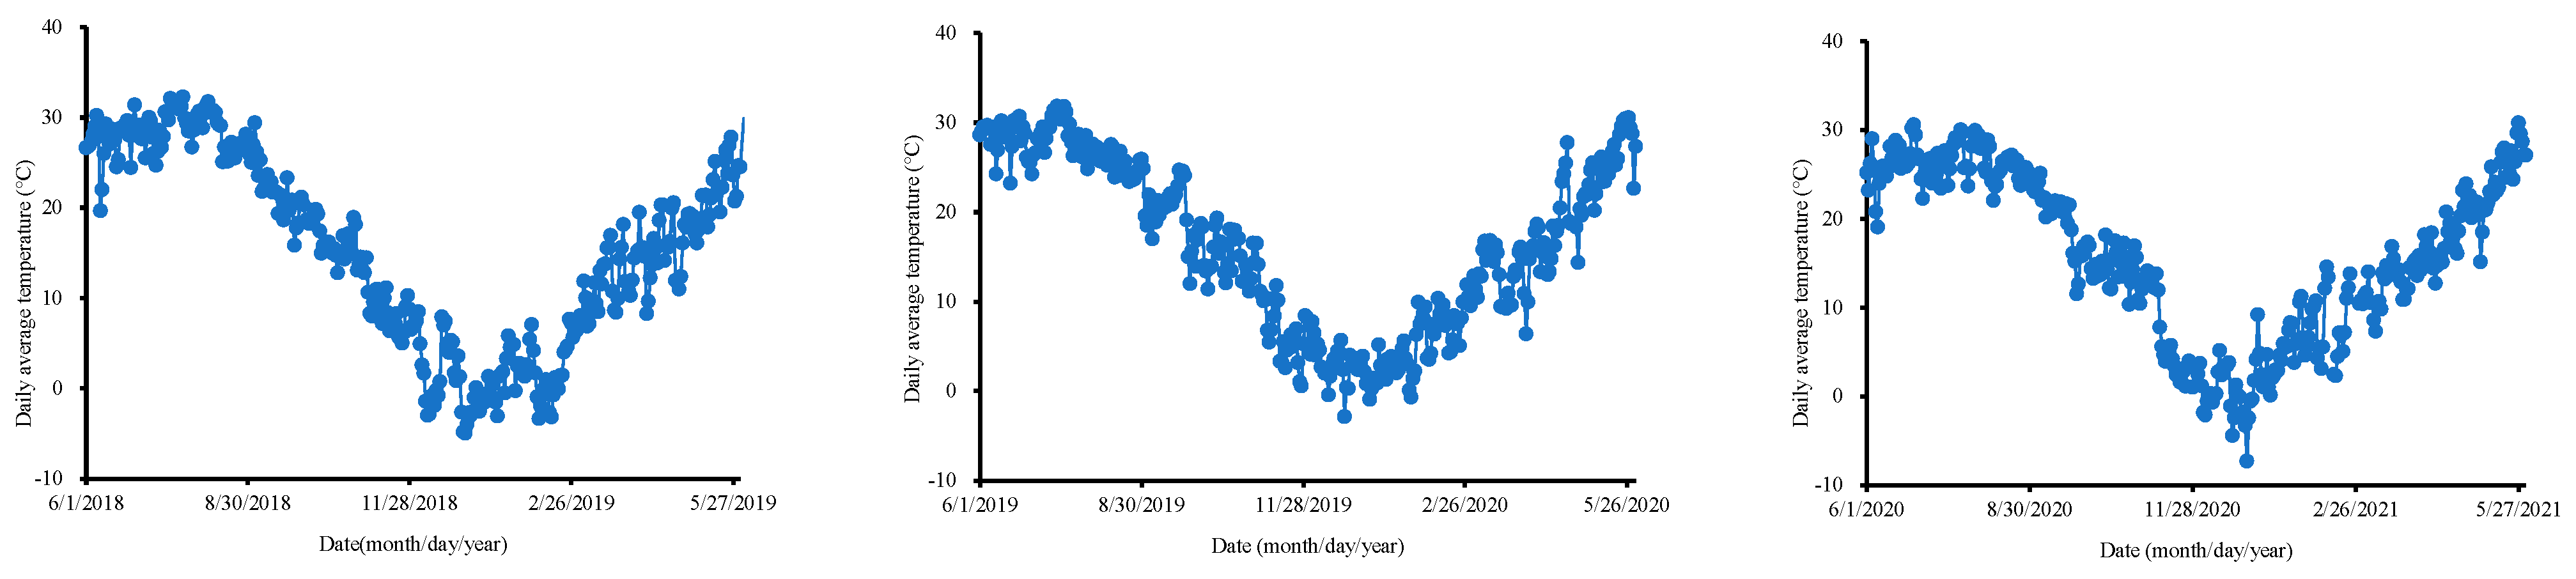
2.1. Experimental Site Description

The three-year field experiment began with maize sowing in June 2018 and ended with wheat harvest in June 2021. The experiment was conducted at Qiliying Experimental Station (35.32° N, 113.83° E, and 73 m altitude), located in Qiliying town, Xinxiang City, Henan Province, China. An automatic meteorological station was set up in the experimental station. The average annual precipitation is 582 mm (about 70% occurs in June–October); the average annual air temperature, sunshine duration, and potential evaporation are 14.2 °C, 2286 h, and 2000 mm, respectively. The soil texture is light sandy loam soil, classified as Fluvic Cambisol soil according to the World Reference Base; other main soil physical properties were investigated before the experiment and are presented in Table 1. The water table at the station was detected more than 6 m below the soil surface.
Soil nutrient contents before the experiment, i.e., before maize planting in 2018, are shown in Table 2. The daily and accumulated precipitation values during the three-year experiment period are shown in Figure 1, with accumulated precipitation of 309.2, 156.4, and 513.0 mm for the 2018, 2019, and 2020 maize seasons, respectively, and 195.0, 164.0, and 228.0 mm for the 2018–2019, 2019–2020, and 2020–2021 wheat seasons, respectively. The daily average air temperature at 2 m during the three-year experiment period is shown in Figure 2.

2.2. Experimental Design

The experiment consisted of four N application rates, i.e., 250, 167, 84, and 0 kg hm−2, of N per growing season, referred to as N3, N2, N1, and N0, respectively. Urea (46.7% N) was used as the N source, half of the N application rate was applied mechanically before sowing, and the remaining N fertilizer was applied by drip irrigation at the reviving–jointing stage for wheat and at the V6-VT stage for maize. The applications of phosphorus (P) and potassium (K) were the same in wheat and maize seasons, and 64.8 kg hm−2 of P and 74.0 kg hm−2 of K were applied once before sowing. Crop residues were returned to the field and rotary plowed during the experiment period.
Three replicate plots were set up for each treatment; each plot was 7.6 m × 7.8 m. The wheat variety was “Lunxuan 69” and the maize variety was “Denghai 618”. The wheat row spacing was 20 cm and the seeding rate was 187.5 kg hm−2; the maize row spacing was 60 cm and planting density was 66,667 plants hm−2. The growth stages of wheat and maize are shown in Table 3 and Table 4, respectively, where the growth stages of maize are referenced from Ritchie et al. (1997) [27]. The irrigation method was drip irrigation with drip tape spacing of 60 cm.
In wheat seasons, each irrigation quota was 80 mm; the irrigation date was chosen to be within three key growth stages, i.e., the reviving–jointing, jointing–anthesis, and filling–maturity stages (Table 5). To ensure the emergence of wheat, all treatments were irrigated with 60 mm of emergence water after sowing. In maize seasons, due to the high variability in precipitation, irrigation dates and the irrigation amount were applied based on precipitation and SWC status. On 26 July 2018, only 10 mm of fertilized water was irrigated; on 14 July, 25 July (fertilization date), and 29 August 2019, 60 mm, 40 mm, and 40 mm of water were irrigated, respectively; on 28 July 2020, only 10 mm of fertilized water was irrigated. Irrigation water was sourced from groundwater at a depth of 70 m, with a mineralization of less than 1 g L−1 and a pH between 7.2 and 7.9. Other agricultural management activities were consistent with local farmers’ activities.

2.3. Sampling and Measurements

2.3.1. Soil Water Content and Evapotranspiration

Soil water contents (SWCs) in the 0–60, 60–100, and 100–140 cm layers were measured at the critical growth stages of wheat and maize by gravity method. Two points were selected for soil sampling in each plot; the two sampling points were located directly below the drip tapes and in the middle of the two drip tapes, and each soil sample was measured individually. All SWC data were converted to volumetric SWC (cm3 cm−3) for analysis.
The crop evapotranspiration (ET) (mm) was estimated using the water balance formula:
ET = P + I     D + SWU
where P is the effective precipitation (mm); I is the irrigated water depth (mm); D is the deep percolation out in the 0–140 cm soil layers (mm); and SWU is the soil water use amount in the 0–140 cm layers (mm).
In the 2020 maize season, 132.2 mm of precipitation fell on 2–4 July and 198.6 mm on 3–6 August. Considering the SWC before precipitation, both of these two large precipitations could be followed by D; for other periods in wheat and maize seasons, considering the SWC before precipitation, the D can be ignored.

2.3.2. Leaf Area Index

We selected wheat at the anthesis stage and maize at the VT stage, and sampled ten plants from each plot to measure leaf length and maximum width. The leaf area was calculated by summing the rectangular area (leaf length × maximum width) of each completely developed leaf multiplied by a factor of 0.75. Leaf area index (LAI) is defined as the ratio of leaf area to land area.

2.3.3. Grain Yield and Water-Use Efficiency

After maturity, 2 m2 of wheat and 4 rows of 7 m of maize were randomly selected for yield determination in the middle of each plot. The grain yield of wheat and maize was calculated at 13% and 14% moisture content, respectively.
Water-use efficiency (WUE) (kg m−3) was calculated using the following formula:
WUE = 0.1 GY ET
where GY is the grain yield (kg ha−1) and ET is the crop total evapotranspiration (mm).

2.3.4. Statistical Analysis

The data were statistically analyzed using SPSS 24.0 (SPSS Inc., Chicago, IL, USA). For Analysis of variance (ANOVA), the attributes from different treatments (mean values of N treatments) were compared using the least significant difference (LSD) at the p < 0.05 level to determine significant differences between treatments. Correlation analysis was performed using a Pearson’s correlation test (two-tailed) with two significance levels of p < 0.05 and p < 0.01.

3. Results

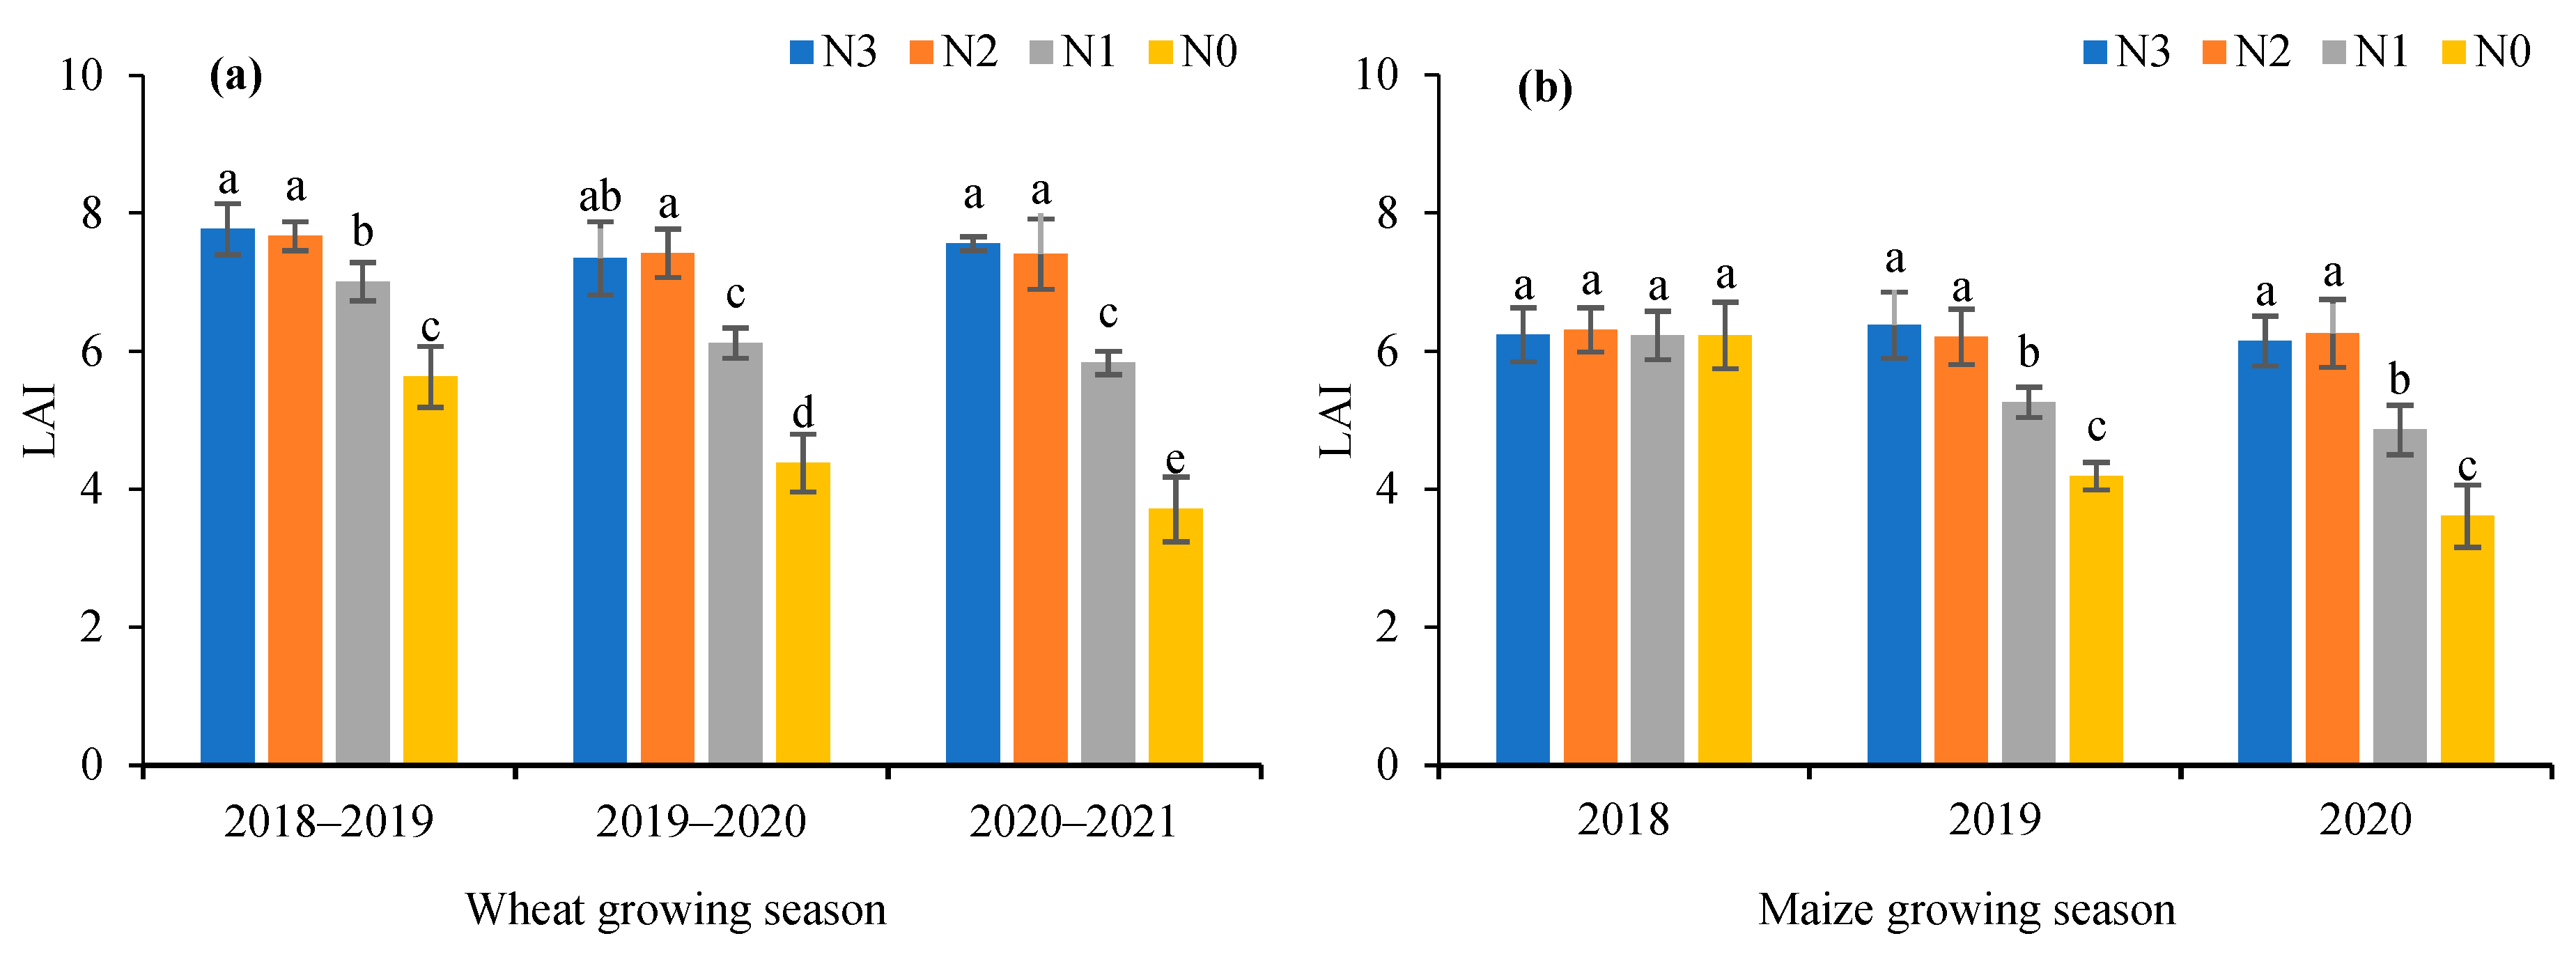
3.1. Leaf Area Index

For wheat, both the N application rate and growing season significantly affected the LAI; the LAI of each treatment in 2018–2019, 2019–2020, and 2020–2021 ranged from 5.63 to 7.77, 4.38 to 7.35, and 3.71 to 7.56, respectively (Figure 3a). There was no significant difference between the N3 and N2 treatments in three wheat seasons, but when the N application rate did not exceed the N2 treatment, N application promoted an increase in the LAI. The LAI of the N3 treatment was 38.0%, 67.8%, and 103.8% higher than that of the N0 treatment in 2018–2019, 2019–2020, and 2020–2021, respectively. The difference in the LAI caused by different N application rates increased with the growing season.
For maize, the N application rate showed no significant effects on the LAI in 2018, but showed significant effects on the LAI in 2019 and 2020. The LAI of each treatment in 2018, 2019, and 2020 ranged from 6.23 to 6.31, 6.23 to 6.31, and 6.23 to 6.31, respectively (Figure 3b). The LAI of the N3 treatment increased by 0.2%, 52.3%, and 70.4% compared to the N0 treatment in 2018, 2019, and 2020, respectively. Similar to wheat seasons, the difference in the LAI caused by different N application rates increased with the growing season.

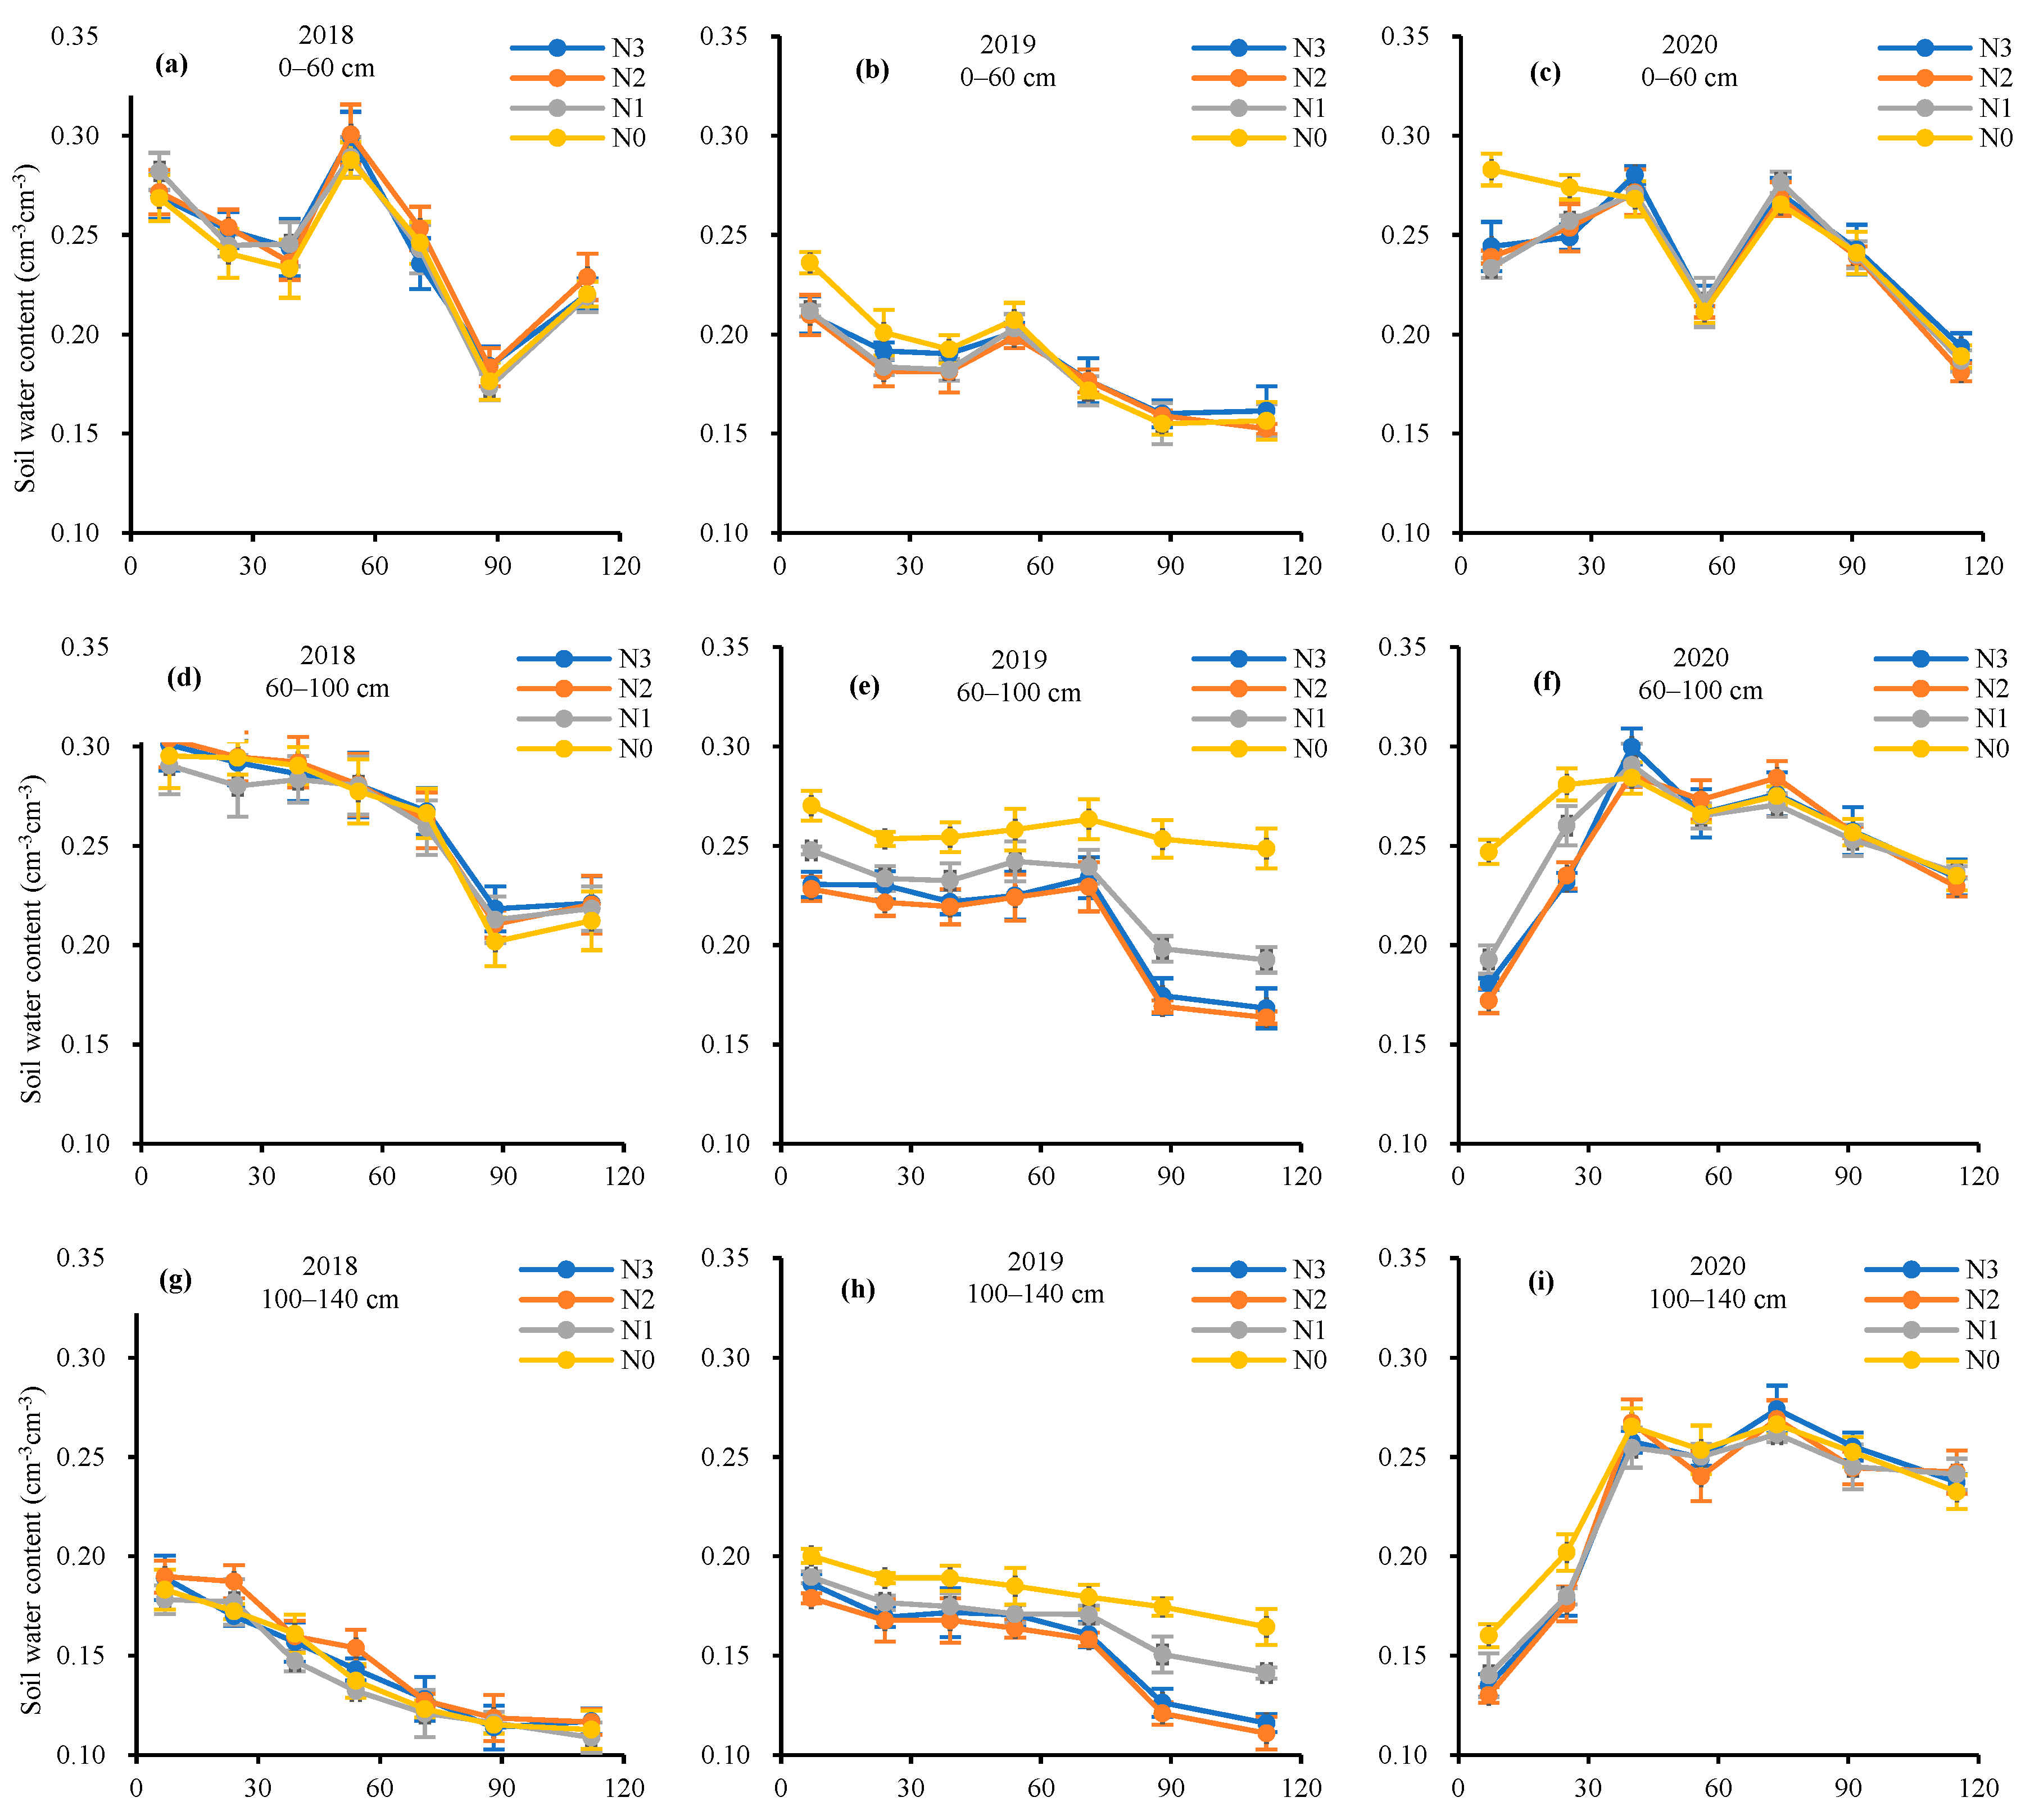
3.2. Soil Water Content

3.2.1. Soil Water Content in Wheat Seasons

The SWCs in the 0–60, 60–100, and 100–140 cm layers of three wheat seasons are shown in Figure 4. Since the SWC observation dates were mostly conducted within 1–3 days before and after irrigation, the SWC variation in the figure is large (Figure 4).

Soil Water Content in the 0–60 cm Layer

In 2018–2019 and 2018–2019, the SWC in the 0–60 cm layer was almost the same for the N3, N2, and N1 treatments, while the SWC of the N0 treatment was significantly higher than the other three treatments after a certain period. In 2020–2021, the SWC of each treatment showed N0 > N1 > N2 after the reviving stage, and no significant difference was observed between the N2 and N3 treatments. In three wheat seasons, for the SWC in the 0–60 cm layer, the differences caused by the N application rate increased with the growing season.

Soil Water Content in the 60–100 cm Layer

In 2018–2019, the SWC in the N0 treatment was significantly higher than that in other treatments on most of the dates after the reviving stage, and the SWC changes in the other three treatments were similar. In 2019–2020 and 2020–2021, partially due to the influence of the previous maize season’s experiments, the SWC showed N0 > N1 > N2, and the difference gradually increased, while there was no significant difference between the N2 and N3 treatments. Similar to the SWC in the 0–60 cm layer, the differences caused by the N application rate increased with the growing season for the SWC in the 60–100 cm layer.

Soil Water Content in the 100–140 cm Layer

In 2018–2019 and 2019–2020, the SWC in the 100–140 cm layer after the reviving stage was consistently low, with a range of 8–12%, resulting in little root uptake of soil water. In 2020–2021, the initial SWC in the 100–140 cm layer was relatively high, but gradually decreased over time. From about 201 days after sowing, the SWC showed N0 > N1 > N2, while no significant difference was detected between the N2 and N3 treatments.

3.2.2. Soil Water Content in Maize Seasons

Soil Water Content in the 0–60 cm Layer

In 2018, the SWC of each treatment on different dates was almost the same (Figure 5). At the initial stage in 2019, influenced by the previous wheat season’s experiment, the SWC of the N0 treatment was significantly higher than that of the other three treatments; however, the differences between treatments gradually disappeared over time. At the initial stage in 2020, similar to 2019, the SWC of the N0 treatment was also significantly higher than that of the other three treatments; however, partially due to the large amount of precipitation (130 mm) on days 28–31 after sowing, the difference also disappeared after 40 days after sowing. After 40 days after sowing, the changing trends in the SWC in each treatment were almost the same.

Soil Water Content in the 60–100 cm Layer

In 2018, no significant difference was detected between treatments. In 2019, influenced by the previous wheat season’s experiment, the initial SWC was N0 > N1 > N2, and no significant difference was detected between the N2 and N3 treatments; however, no significant difference was detected in the soil water use (SWU) amount between treatments at the VE−VT stage (1–55 days after sowing) in 2019. From 71 to 88 days after sowing, except for the insignificant difference between the N3 and N2 treatments, a higher N application rate led to a higher SWU amount. At the R3−R6 stage (88–112 days after sowing) in 2019, all treatments showed a smaller downward trend and there was no significant difference in the SWU amount between treatments. In 2020, influenced by the previous wheat season’s experiment, the initial SWC also showed N0 > N1 > N2, and there was no significant difference between the N2 and N3 treatments. At the VE-V6 stage in 2020, the SWC increased substantially due to heavy precipitation, and the differences in SWCs between treatments gradually decreased from 1 to 40 days after sowing. Overall, except for the period from 71 to 88 days after sowing and the early period when the SWC was influenced by the previous season’s experiment, the effects of the N application rate on the SWC were not significant in three maize seasons.

Soil Water Content in the 100–140 cm Layer

The SWC change trend in the 100–140 cm layer was almost the same as that in the 60–100 cm layer, but the change range was relatively small.

3.3. Evapotranspiration

3.3.1. Wheat Evapotranspiration

The total ET and ET at the jointing to anthesis and anthesis to maturity stages were significantly affected by the growing season, N application rate, and their interaction (Table 6). The N application rate showed no significant effect on ET at the sowing to jointing stage in three wheat seasons. The total ET in the 2018–2019, 2019–2020, and 2020–2021 seasons ranged from 466.0 to 502.5, 406.2 to 452.9, and 396.8 to 508.8 mm, respectively, and the differences in the total ET between treatments increased with the growing season.

3.3.2. Maize Evapotranspiration

In 2018, the total ET of each treatment ranged from 372.1 to 378.4 mm, and the N application rate showed no significant effects on the total ET and ET at each growth stage (Table 7). In 2019, the total ET of each treatment ranged from 363.9 to 380.6 mm. The N application rate showed no significant effects on the total ET, but it showed significant effects on ET at the VE−V6 and VT−R3 stages. At the VE−V6 stage in 2019, a higher N application rate resulted in a smaller ET. However, at the VT−R3 stage, the ET showed N2 > N1 > N0, and there was no significant difference between the N3 and N2 treatments. In 2020, as mentioned in Section 2.3.1, ET at the V6−VT and VT−R3 stages was not calculated due to deep percolation caused by heavy precipitation. At the VE−V6 stage in 2020, the ET of the N0 treatment was significantly higher than that of the other three treatments. At the R3−R6 stage in 2020, there was no significant difference in ET between treatments.

3.4. Grain Yield and WUE

For wheat, grain yield and WUE were significantly affected by the growing season, N application rate, and their interaction (Table 8). The grain yield in the 2018–2019, 2019–2020, and 2020–2021 seasons ranged from 6803 to 9984, 6173 to 10,016, and 6118 to 9843 kg hm−2, respectively, and WUE ranged from 1.46 to 1.99, 1.52 to 2.22, and 0.87 to 1.86 kg m−3, respectively. Throughout the three wheat seasons, there was no significant difference between the N3 and N2 treatments for grain yield and WUE. For the N2, N1, and N0 treatments, both grain yield and WUE showed N2 > N1 > N0, and the difference in grain yield and WUE caused by different N application rates increased with the growing season.
For maize, grain yield and WUE were significantly affected by the growing season, N application rate, and their interaction (the WUE for 2020 was not calculated due to the failure to calculate ET for 2020) (Table 9). In 2018, the grain yield and WUE of each treatment ranged from 9985 to 10,174 kg hm−2 and 2.58 to 2.73 kg m−3, respectively, with no significant difference between treatments. In 2019 and 2020, grain yield ranged from 7511 to 10,364 and 6118 to 9843 kg hm−2, respectively. In 2019, when the N application rate did not exceed N2 treatment, the WUE and grain yield increased with the increase in the N application rate. Throughout the three maize seasons, the difference in grain yield caused by different N application rates increased with the growing season.

3.5. Relationship between LAI, Total ET, Grain Yield, and WUE

A Pearson correlation analysis of the LAI, total ET, grain yield, and WUE for this 3-year experiment was performed (Table 10). The analysis showed that the Pearson correlation coefficients for maize and wheat were relatively similar; the LAI, total ET, grain yield, and WUE were all positively correlated with each other for both maize and wheat.
For both wheat and maize, the Pearson correlation coefficient (r) of GY with yield and total ET were all >0.9 (highly significant), the correlation coefficient of ET with WUE was the smallest and not significant, and the LAI also showed good correlation with total ET and WUE (0.7 < r < 0.9, significant). Overall, the correlation coefficients of total ET with the other three indicators of maize were lower than those of wheat, which was mainly due to the fact that the N application rate in the 2018 and 2019 maize seasons did not have significant effects on the total ET.

4. Discussion

4.1. LAI, Grain Yield, and WUE

It is widely recognized that moderate increases in the N application rate within a certain range can promote growth and grain yield, while excessive N application rates may also have negative effects on crop growth and grain yield [28,29,30]. In our study, we found no significant difference in the LAI and yield between treatments for maize in 2018, but the difference in the LAI and yield of wheat and maize caused by the N application rate increased with the growing season. There are two main reasons for this: (1) The soil N supply can meet the needs of crop growth in the first maize season, and then in the subsequent growing seasons, as the low-nitrogen treatment depletes the stored N in the soil, N begins to become a crop-limiting factor for growth. (2) Many studies have demonstrated that N deficiency would also cause a decrease in a series of soil physical, chemical, and biological indicators [31,32,33,34]. Chen et al. [31] conducted a 2-year wheat–maize rotation experiment and found that reducing N application within a certain range reduced soil dehydrogenase and urease activities, basic respiration and nitrification potential, and slightly increased soil pH. Wang et al. [32] found that reducing N application decreased the activity of soil autotrophic bacterial communities, leading to a decrease in soil organic carbon. Zeng et al. [33] reported that N deficiency accelerates soil organic carbon decomposition in temperate degraded grasslands. Lu et al. [34] reported that low N reduced soil aggregation in terrestrial ecosystems in China.
Olson et al. [35] reported that if the inorganic N in the soil exceeds 120 kg hm−2, the response of the wheat grain yield to the N application rate is very small. Li et al. [36] conducted a 4-year wheat experiment and found that in the first growing season of wheat, a nitrate N content of 138 kg hm−2 in a 0–100 cm soil profile was sufficient to maintain wheat growth, while in the following three seasons, a low N treatment became inadequate for crop growth. Liu et al. [37] found that N fertilizer had little effect on the yield of wheat in the first season, but N fertilizer did promote crop growth in subsequent seasons (the total N content of the soil in the 0–100 cm layer before the experiment was 0.69 g kg−1). In this experiment, the average value of soil nitrate N content in the 0–140 cm layer before maize sowing in 2018 was 195 kg hm−2, which was able to satisfy the growth demand of maize in 2018, so there was no significant difference in maize LAI in 2018. In subsequent seasons, the difference in crop LAI caused by the N application rate gradually increased both for wheat and maize.
With the main consideration of crop yield, the optimal N application rate for wheat and maize in the NCP reported by many studies was in the range of 110–250 kg hm−2 [3,36,38,39,40]. Our study found that the yield and WUE increased with the increase in the N application rate in the range of 0–167 kg hm−2 for wheat and maize seasons from 2020 to 2021. However, when the N application rate increased from 167 to 250 kg hm−2, it had no significant effects on yield and WUE. This indicates that the threshold of the N application rate for promoting yield and WUE in this experiment may be 167 kg hm−2.

4.2. Soil Water Content

4.2.1. Soil Water Content in the 0–60 cm Layer

Many research reports indicated that wheat and maize root systems mainly absorb soil water in the 0–60 cm layer [41,42,43,44,45], and considering the observations of the present experiment, we divided the SWC into three layers: 0–60, 60–100, and 100–140 cm (Figure 4).
In three maize seasons, it was found that the SWU amount in the 0–60 cm layer was mainly affected by its SWC; a higher SWC led to a higher SWU (Figure 5b,c). This indicates that the SWC in the 0–60 cm layer in maize seasons is highly susceptible to surface soil evaporation; within a certain SWC range, a decrease in root water uptake in the 0–60 cm layer is accompanied by an increase in soil evaporation, which compensates for the difference in the SWC caused by root uptake, resulting in the non-significant difference in the SWC in the 0–60 cm layer.
In wheat seasons, the N application rate significantly affected the SWC in the 0–60 cm layer (Figure 4a–c), contrary to the findings of the experiment in the maize seasons. There are three main reasons for this: (1) Compared with the maize season, the wheat season has lower solar radiation and air temperature, resulting in a weaker soil evaporation capacity. (2) The mean values of the LAI of wheat and maize at the reproductive growth stage in the three-year experiment were 7.2 and 6.3, respectively, whereas the maximum plant heights of wheat and maize in the NCP were about 62 cm [46] in wheat and about 265 cm in maize [47]. This indicates that compared to maize, the wheat canopy is more concentrated on the surface, resulting in a much lower level of solar radiation and ventilation that the surface soil can accept in the wheat season compared to the maize season, resulting in weaker soil evaporation capacity in the wheat season. (3) The wheat season has less precipitation, while the maize season has more precipitation, which causes the SWC in the 0–60 cm layer in the maize season to often be in a relatively high state, with soil evaporation playing a dominant role, whereas in the wheat season, the SWC in the 0–60 cm layer is relatively dry, with relatively low soil evaporation, and water absorption by the root system plays a dominant role.

4.2.2. Soil Water Content in the 60–100 and 100–140 cm Layers

Many studies reported that the water uptake of maize root system was mainly in the 0–60 cm soil layer [42,43,44,48]. Our study showed a similar result, except for 71–88 days after sowing (VT−R3 stage) in 2019 (Figure 5b,e,h), when the SWU of this period in the 60–100 cm and 100–140 cm layers increased rapidly compared to the preceding period. Through the analysis of the SWC in this period, it was found that there was no input of precipitation and irrigation in this period, and the SWC in the 0–60 cm layer in each treatment was low (only about 0.15–0.17 cm−3 cm−3) and continued to decline (Figure 5b). At the same time, the SWU in the 60–100 and 100–140 cm layers in this period increased rapidly compared to the previous period and a higher N application rate led to a higher SWU, except for the fact that the SWC dynamics in the N4 and N3 treatments were similar (Figure 5e,h). In other periods, SWU in the 60–100 and 100–140 cm layers was almost the same (Figure 5d–i), except for 7–40 days after maize sowing in 2020 (Figure 5f,i), when the SWC was influenced by heavy precipitation.
Based on the above analysis, we concluded that, due to the frequent precipitation in maize seasons (the precipitation in the 2018 and 2019 maize seasons reached 309.2 mm and 512.9 mm, respectively), most of the time, the SWC in the 0–60 cm layer was sufficient to provide most of the water uptake of maize root, so the root water uptake in the 60–100 and 100–140 cm layers was little; as a result, the N application rate showed no significant effects on SWU in the 60–100 and 100–140 cm layers (Figure 5d,i). When the SWC in the 0–60 cm layer was inadequate for maize (71–88 days after sowing in 2019), SWU in the 60–100 and 100–140 cm layers began to increase rapidly (Figure 5b,e,h). Since soil evaporation had relatively small effects on the 60–100 and 100–140 cm layers, the soil water difference in the 60–100 and 100–140 cm layers between treatments caused by the N application rate increased rapidly (Figure 5e,h).
Lv et al. [49] reported that a water deficit in the surface layer could stimulate water uptake in the 50–100 cm soil layer. Zhao et al. [50] reported that increasing the irrigation amount directly increased the SWC in the 0–60 cm layer and indirectly reduced the water use of wheat in the 60–140 cm soil layer. Xu et al. [51] found that limited irrigation enhanced the uptake of soil-stored water from the subsoil layer. These reports support the findings of our study. For maize in the R3−R6 stage in 2019, we also found that the SWC in the 0–60 cm layer was small, but the SWU in the 60–100 and 100–140 cm layers showed no significant difference between treatments (Figure 5b). The main reason was that the daily ET at the R3−R6 stage was low, making the root water uptake difference between treatments relatively small at the R3−R6 stage.
Throughout the three wheat seasons, the N application rate showed significant effects on the SWC in the 60–100 and 100–140 cm layers (Figure 4d–i), which was different from the results of maize seasons, when the N application rate had no significant effects on the SWC in the 60–100 and 100–140 cm layers (Figure 5d–i), except at the VT−R3 stage in the 2019 maize season (Figure 5e,h). There are two main reasons for this: (1) as mentioned above, the large precipitation and number of precipitation events during the maize seasons resulted in the 0–60 cm soil layer tending to be in a state of high SWC, while the lower precipitation during wheat seasons resulted in the 0–60 cm soil layer tending to be in a state of low SWC, which resulted in the root water uptake in the 60–100 and 100–140 cm soil layers tending to be in a high state in wheat seasons; (2) the root structures of wheat and maize are different, and many studies have shown that within a certain soil depth range, wheat roots have a smaller proportion in the upper soil layer compared to maize [52,53,54].

4.3. Evapotranspiration

Moderate increases in the N application rate can increase ET [21,22,23]. For wheat, after the first two seasons of this experiment, there was no significant change in ET in the third season when the N application rate exceeded the N2 treatment.
For maize, in 2018, no significant difference was detected in ET between treatments due to the soil basic N being able to meet crop growth needs. In 2019 and 2020, we found that the ET of the N0 treatment at the VE−V6 stage was instead higher than that of the other three treatments. As mentioned in Section 4.1, this is mainly due to the influence of the previous wheat season’s experiments, which resulted in a higher SWC in the N0 treatment before maize sowing, leading to higher ET in the N0 treatment. For other growth stages in the 2019 maize season, the N application rate only showed significant effects on ET at the VT−R3 stage. As mentioned in Section 4.1, this is mainly because the N application rate had no significant effects on SWU in the 0–60 cm layer, but had significant effects on SWU in the 60–100 and 100–140 cm layers at the VT−R3 stage. Overall, the N application rate showed no significant effects on the total ET in the 2019 maize season; this is mainly because SWU increased with the N application rate at the VE−V6 stage, but decreased with the N application rate at the R3−R6 stage, resulting in no significant difference in the total ET in the 2019 maize season.

5. Conclusions

(1)
For the 0–60 cm soil layer, N deficiency could lead to reduced SWU in the 0–60 cm layer in wheat seasons, but not in maize seasons.
(2)
For the 60–140 cm soil layer, N deficiency could lead to reduced SWU in the 60–140 cm layer in wheat seasons, but in maize seasons, the effects of N deficiency on SWU in the 60–140 cm layer varied with the SWC in the 0–60 cm layer. When the SWC in the 0–60 cm layer was high enough to meet the water needs of maize, SWU was mainly concentrated in the 0–60 cm layer, resulting in the N application rate showing no significant effects on SWU in the 60–140 cm layer in maize seasons; When the SWC in the 0–60 cm layer was inadequate for maize, SWU in the 60–140 cm layer increased rapidly, and N deficiency could significantly reduce the SWU in the 60–140 cm layer in maize seasons.
(3)
In the three-year experiment, due to the negative effects of low N treatment (N1 and N0) on soil, the ET, LAI, yield, and WUE of the soil that received a low N treatment decreased with the growing season.
(4)
The LAI, total ET, grain yield, and WUE were all positively correlated with each other for both maize and wheat.
(5)
Considering grain yield and WUE, a single-season N application rate of 167 kg hm−2 (N2 treatment) in the NCP can meet the growth needs of the wheat–maize rotation system.

Author Contributions

Conceptualization, J.Q. and M.L.; methodology, J.Q.; Investigation, X.F., X.W. and M.J.; data curation, X.F., X.W. and M.J.; formal analysis, X.F., X.W. and M.J.; writing—original draft preparation, J.Q.; writing—review and editing, M.L; resources, J.Q.; project administration, J.Q. All authors have read and agreed to the published version of the manuscript.

Funding

This study was funded by key R&D and promotion projects in Henan Province, China: Science and Technology Research Projects (222102110022).

Data Availability Statement

Data are contained within the article.

Conflicts of Interest

The authors declare no conflicts of interest.

References

  1. National Bureau of Statistics of China. Available online: http://www.stats.gov.cn/sj (accessed on 25 November 2023).
  2. Feng, W.; Shum, C.; Zhong, M.; Pan, Y. Groundwater storage changes in China from satellite gravity: An overview. Remote Sens. 2018, 10, 674. [Google Scholar] [CrossRef]
  3. Hu, S.; Qiao, B.; Yang, Y.; Rees, R.M.; Huang, W.; Zou, J.; Zhang, L.; Zheng, H.; Liu, S.; Shen, S. Optimizing nitrogen rates for synergistically achieving high yield and high nitrogen use efficiency with low environmental risks in wheat production–Evidences from a long-term experiment in the North China Plain. Eur. J. Agron. 2023, 142, 126681. [Google Scholar] [CrossRef]
  4. Yang, X.; Lu, Y.; Ding, Y.; Yin, X.; Raza, S. Optimising nitrogen fertilisation: A key to improving nitrogen-use efficiency and minimising nitrate leaching losses in an intensive wheat/maize rotation (2008–2014). Field Crop. Res. 2017, 206, 1–10. [Google Scholar] [CrossRef]
  5. Ren, S.; Zhang, Q.; Li, T.; Zhang, F. Spatiotemporal variation of winter wheat yield and nitrogen management in five provinces of North China Plain. Sci. Agric. Sin. 2019, 52, 4527–4539. [Google Scholar] [CrossRef]
  6. Fowler, D.; Coyle, M.; Skiba, U.; Sutton, M.A.; Cape, J.N.; Reis, S.; Sheppard, L.J.; Jenkins, A.; Grizzetti, B.; Galloway, J.N.; et al. The global nitrogen cycle in the twenty-first century. Phil. Trans. R. Soc. B 2013, 368, 20130164. [Google Scholar] [CrossRef] [PubMed]
  7. Ladha, J.; Tirol-Padre, A.; Reddy, C.; Cassman, K.; Verma, S.; Powlson, D.; Van Kessel, C.; de B Richter, D.; Chakraborty, D.; Pathak, H. Global nitrogen budgets in cereals: A 50-year assessment for maize, rice and wheat production systems. Sci. Rep. 2016, 6, 1–9. [Google Scholar] [CrossRef] [PubMed]
  8. Yu, C.; Huang, X.; Chen, H.; Godfray, H.C.J.; Wright, J.S.; Hall, J.W.; Gong, P.; Ni, S.; Qiao, S.; Huang, G. Managing nitrogen to restore water quality in China. Nature 2019, 567, 516–520. [Google Scholar] [CrossRef]
  9. Ludemann, C.; Gruere, A.; Heffer, P.; Dobermann, A. Global data on fertilizer use by crop and by country. Sci. Data 2022, 9, 501. [Google Scholar] [CrossRef]
  10. Gu, B.; Ju, X.; Chang, J.; Ge, Y.; Vitousek, P.M. Integrated reactive nitrogen budgets and future trends in China. Proc. Natl. Acad. Sci. USA 2015, 112, 8792–8797. [Google Scholar] [CrossRef]
  11. Tian, H.; Liang, X.; Gong, Y.; Qi, L.; Liu, Q.; Kang, Z.; Sun, Q.; Jin, H. Health Risk Assessment of Nitrate Pollution in Shallow Groundwater: A Case Study in China. Pol. J. Environ. Stud. 2019, 29, 7. [Google Scholar] [CrossRef]
  12. Weil, R.R.; Weismiller, R.A.; Turner, R.S. Nitrate Contamination of Groundwater under Irrigated Coastal Plain Soils. J. Environ. Qual. 1990, 19, 441. [Google Scholar] [CrossRef]
  13. Galloway, J.N.; Aber, J.D.; Erisman, J.W.; Seitzinger, S.P.; Howarth, R.W.; Cowling, E.B.; Cosby, B.J. The nitrogen cascade. Biosci 2003, 53, 341–356. [Google Scholar] [CrossRef]
  14. Liao, Z.; Zeng, H.; Fan, J.; Lai, Z.; Zhang, C.; Zhang, F.; Wang, H.; Cheng, M.; Guo, J.; Li, Z. Effects of plant density, nitrogen rate and supplemental irrigation on photosynthesis, root growth, seed yield and water-nitrogen use efficiency of soybean under ridge-furrow plastic mulching. Agric. Water Manag. 2022, 268, 107688. [Google Scholar] [CrossRef]
  15. Vos, J.; Van Der Putten, P.; Birch, C. Effect of nitrogen supply on leaf appearance, leaf growth, leaf nitrogen economy and photosynthetic capacity in maize (Zea mays L.). Field Crop. Res. 2005, 93, 64–73. [Google Scholar] [CrossRef]
  16. Rahman, M.; Islam, M.; Islam, M.; Karim, M. Dry matter accumulation, leaf area index and yield responses of wheat under different levels of nitrogen. Bangladesh J. Agric. 2014, 7, 27–32. [Google Scholar]
  17. Comfort, S.; Malzer, G.; Busch, R. Nitrogen fertilization of spring wheat genotypes: Influence on root growth and soil water depletion. Agron. J. 1988, 80, 114–120. [Google Scholar] [CrossRef]
  18. Liu, W.; Wang, J.; Wang, C.; Ma, G.; Wei, Q.; Lu, H.; Xie, Y.; Ma, D.; Kang, G. Root growth, water and nitrogen use efficiencies in winter wheat under different irrigation and nitrogen regimes in North China Plain. Front. Plant Sci. 2018, 9, 1798. [Google Scholar] [CrossRef]
  19. Wu, B.; Zhang, L.; Tian, J.; Zhang, G.; Zhang, W. Fine root dynamics, longevity, and canopy characteristics of cotton under varying water and nitrogen levels. Plant Soil 2023, 482, 191–209. [Google Scholar] [CrossRef]
  20. Qi, D.L.; Hu, T.T.; Xue, S. Effects of nitrogen application rates and irrigation regimes on grain yield and water use efficiency of maize under alternate partial root-zone irrigation. J. Integr. Agric. 2020, 19, 2792–2806. [Google Scholar] [CrossRef]
  21. Brown, P.L. Water Use and Soil Water Depletion by Dryland Winter Wheat as Affected by Nitrogen Fertilization 1. Agron. J. 1971, 63, 43–46. [Google Scholar] [CrossRef]
  22. Wang, L.; Palta, J.A.; Chen, W.; Chen, Y.; Deng, X. Nitrogen fertilization improved water-use efficiency of winter wheat through increasing water use during vegetative rather than grain filling. Agric. Water Manag. 2018, 197, 41–53. [Google Scholar] [CrossRef]
  23. Rudnick, D.; Irmak, S.; Djaman, K.; Sharma, V. Impact of irrigation and nitrogen fertilizer rate on soil water trends and maize evapotranspiration during the vegetative and reproductive periods. Agric. Water Manag. 2017, 191, 77–84. [Google Scholar] [CrossRef]
  24. Reddy, M.D.; Murthy, I.K.; Reddy, K.A.; Venkatachari, A. Consumptive use and daily evapotranspiration of corn under different levels of nitrogen and moisture regimes. Plant Soil 1980, 56, 143–147. [Google Scholar] [CrossRef]
  25. Lenka, N.K.; Lenka, S.; Thakur, J.K.; Yashona, D.S.; Shukla, A.; Elanchezhian, R.; Singh, K.; Biswas, A.; Patra, A. Carbon dioxide and temperature elevation effects on crop evapotranspiration and water use efficiency in soybean as affected by different nitrogen levels. Agric. Water Manag. 2020, 230, 105936. [Google Scholar] [CrossRef]
  26. Xing, H.; Zhou, W.; Wang, C.; Li, L.; Li, X.; Cui, N.; Hao, W.; Liu, F.; Wang, Y. Excessive nitrogen application under moderate soil water deficit decreases photosynthesis, respiration, carbon gain and water use efficiency of maize. Plant Physiol. Biochem. 2021, 166, 1065–1075. [Google Scholar] [CrossRef] [PubMed]
  27. Ritchie, S.; Hanway, J.; Benson, G.; Herman, J. How a Corn Plant Develops; Special Report No. 48; Iowa State University of Science and Technology Cooperative Extension Service: Ames, IA, USA, 1997. [Google Scholar]
  28. Mon, J.; Bronson, K.; Hunsaker, D.; Thorp, K.; White, J.; French, A. Interactive effects of nitrogen fertilization and irrigation on grain yield, canopy temperature, and nitrogen use efficiency in overhead sprinkler-irrigated durum wheat. Field Crop. Res. 2016, 191, 54–65. [Google Scholar] [CrossRef]
  29. Wang, H.; Wu, L.; Cheng, M.; Fan, J.; Zhang, F.; Zou, Y.; Chau, H.W.; Gao, Z.; Wang, X. Coupling effects of water and fertilizer on yield, water and fertilizer use efficiency of drip-fertigated cotton in northern Xinjiang, China. Field Crop. Res. 2018, 219, 169–179. [Google Scholar] [CrossRef]
  30. Wang, H.; Zhang, Y.; Chen, A.; Liu, H.; Zhai, L.; Lei, B.; Ren, T. An optimal regional nitrogen application threshold for wheat in the North China Plain considering yield and environmental effects. Field Crop. Res. 2017, 207, 52–61. [Google Scholar] [CrossRef]
  31. Chen, L.; Zhang, J.; Zhao, B.; Ma, D. Crop yield and soil biochemical properties under different nitrogen fertilization and irrigation management schemes. Zhongguo Shengtai Nongye Xuebao/Chin. J. Eco-Agric. 2014, 22, 501–508. [Google Scholar]
  32. Lu, X.; Hou, E.; Guo, J.; Gilliam, F.S.; Li, J.; Tang, S.; Kuang, Y. Nitrogen addition stimulates soil aggregation and enhances carbon storage in terrestrial ecosystems of China: A meta-analysis. Glob. Change Biol. 2021, 27, 2780–2792. [Google Scholar] [CrossRef]
  33. Zeng, W.; Wang, Z.; Chen, X.; Yao, X.; Ma, Z.; Wang, W. Nitrogen deficiency accelerates soil organic carbon decomposition in temperate degraded grasslands. Sci. Total Environ. 2023, 881, 163424. [Google Scholar] [CrossRef] [PubMed]
  34. Wang, J.; Xie, J.; Li, L.; Luo, Z.; Zhang, R.; Jiang, Y. Nitrogen application increases soil microbial carbon fixation and maize productivity on the semiarid Loess Plateau. Plant Soil 2023, 488, 9–22. [Google Scholar] [CrossRef]
  35. Olson, R.; Frank, K.; Deibert, E.; Dreier, A.; Sander, D.; Johnson, V. Impact of Residual Mineral N in Soil on Grain Protein Yields of Winter Wheat and Corn 1. Agron. J. 1976, 68, 769–772. [Google Scholar] [CrossRef]
  36. Li, Y.; Liu, H.; Huang, G. The effect of nitrogen rates on yields and nitrogen use efficiencies during four years of wheat–maize rotation cropping seasons. Agron. J. 2016, 108, 2076–2088. [Google Scholar] [CrossRef]
  37. Liu, X.; Ju, X.; Zhang, F.; Pan, J.; Christie, P. Nitrogen dynamics and budgets in a winter wheat-maize cropping system in the North China Plain. Field Crop. Res. 2003, 83, 111–124. [Google Scholar] [CrossRef]
  38. Si, Z.; Zain, M.; Mehmood, F.; Wang, G.; Gao, Y.; Duan, A. Effects of nitrogen application rate and irrigation regime on growth, yield, and water-nitrogen use efficiency of drip-irrigated winter wheat in the North China Plain. Agric. Water Manag. 2020, 231, 106002. [Google Scholar] [CrossRef]
  39. Si, Z.; Zain, M.; Li, S.; Liu, J.; Liang, Y.; Gao, Y.; Duan, A. Optimizing nitrogen application for drip-irrigated winter wheat using the DSSAT-CERES-Wheat model. Agric. Water Manag. 2021, 244, 106592. [Google Scholar] [CrossRef]
  40. Gheysari, M.; Mirlatifi, S.M.; Homaee, M.; Asadi, M.E.; Hoogenboom, G. Nitrate leaching in a silage maize field under different irrigation and nitrogen fertilizer rates. Agric. Water Manag. 2009, 96, 946–954. [Google Scholar] [CrossRef]
  41. Sha, Y.; Liu, Z.; Hao, Z.; Huang, Y.; Shao, H.; Feng, G.; Chen, F.; Mi, G. Root growth, root senescence and root system architecture in maize under conservative strip tillage system. Plant Soil. 2024, 495, 253–269. [Google Scholar] [CrossRef]
  42. Zhang, F.L.; Niu, X.K.; Zhang, Y.M.; Xie, R.Z.; Xin, L.; Li, S.K.; Gao, S.J. Studies on the Root Characteristics of Maize Varieties of Different Eras. J. Integr. Agric. 2013, 12, 426–435. [Google Scholar] [CrossRef]
  43. Jha, S.K.; Gao, Y.; Liu, H.; Huang, Z.; Wang, G.; Liang, Y.; Duan, A. Root development and water uptake in winter wheat under different irrigation methods and scheduling for North China. Agric. Water Manag. 2017, 182, 139–150. [Google Scholar] [CrossRef]
  44. Jia, Q.; Xu, Y.; Ali, S.; Sun, L.; Ding, R.; Ren, X.; Zhang, P.; Jia, Z. Strategies of supplemental irrigation and modified planting densities to improve the root growth and lodging resistance of maize (Zea mays L.) under the ridge-furrow rainfall harvesting system. Field Crop. Res. 2018, 224, 48–59. [Google Scholar] [CrossRef]
  45. Liu, J.; Si, Z.; Wu, L.; Chen, J.; Gao, Y.; Duan, A. Using stable isotopes to quantify root water uptake under a new planting pattern of high-low seed beds cultivation in winter wheat. Soil Tillage Res. 2021, 205, 104816. [Google Scholar] [CrossRef]
  46. Qin, X.; Zhang, F.; Liu, C.; Yu, H.; Cao, B.; Tian, S.; Liao, Y.; Siddique, K.H. Wheat yield improvements in China: Past trends and future directions. Field Crop. Res. 2015, 177, 117–124. [Google Scholar] [CrossRef]
  47. Ren, B.; Li, L.; Dong, S.; Liu, P.; Zhao, B.; Zhang, J. Photosynthetic characteristics of summer maize hybrids with different plant heights. Agron. J. 2017, 109, 1454–1462. [Google Scholar] [CrossRef]
  48. Li, L.; Jian-ping, H.; Hong-ting, W. Effects of nitrogen and irrigation interaction on water consumption characteristics and use efficiency in winter wheat. J. Soil Water Conserv. 2012, 26, 291–296. [Google Scholar]
  49. Lv, G.; Kang, Y.; Li, L.; Wan, S. Effect of irrigation methods on root development and profile soil water uptake in winter wheat. Irrig. Sci. 2010, 28, 387–398. [Google Scholar] [CrossRef]
  50. Zhao, L.; Xue, L.; Sun, Q.; Zhang, J. Effect of Different Irrigation and Nitrogen Application on Water Consumption Characteristics and the Water and Nitrogen Use Efficiencies under Drip Irrigation in Winter Wheat. J. Triticeae Crops 2016, 36, 80–89. [Google Scholar] [CrossRef]
  51. Xu, C.; Tao, H.; Tian, B.; Gao, Y.; Ren, J.; Wang, P. Limited-irrigation improves water use efficiency and soil reservoir capacity through regulating root and canopy growth of winter wheat. Field Crop. Res. 2016, 196, 268–275. [Google Scholar] [CrossRef]
  52. Mu, X.; Zhao, Y.; Liu, K.; Ji, B.; Guo, H.; Xue, Z.; Li, C. Responses of soil properties, root growth and crop yield to tillage and crop residue management in a wheat–maize cropping system on the North China Plain. Eur. J. Agron. 2016, 78, 32–43. [Google Scholar] [CrossRef]
  53. Bennie, A.; Botha, F. Effect of deep tillage and controlled traffic on root growth, water-use efficiency and yield of irrigated maize and wheat. Soil Tillage Res. 1986, 7, 85–95. [Google Scholar] [CrossRef]
  54. Hirte, J.; Leifeld, J.; Abiven, S.; Mayer, J. Maize and wheat root biomass, vertical distribution, and size class as affected by fertilization intensity in two long-term field trials. Field Crop. Res. 2018, 216, 197–208. [Google Scholar] [CrossRef]
Figure 1. Daily and accumulated precipitation for three wheat–maize rotation periods.
Agronomy 14 01006 g001
Figure 2. Daily average air temperature at 2 m for three wheat–maize rotation periods.
Agronomy 14 01006 g002
Figure 3. Leaf area index (LAI) for wheat and maize. (a,b) represent the LAI of wheat at the anthesis and maize at the VT stage, respectively. Different letters in the figure mean significant differences at the p < 0.05 probability level.
Agronomy 14 01006 g003
Figure 4. SWC in different layers in wheat seasons. (ac) represent SWC in 0–60 cm layer in 2018–2019, 2019–2020, and 2020–2021 seasons, respectively; (df) represent SWC in 60–100 cm layer in 2018–2019, 2019–2020, and 2020–2021 seasons, respectively; (gi) represent SWC in 100–140 cm layer in 2018–2019, 2019–2020, and 2020–2021 seasons, respectively.
Agronomy 14 01006 g004
Figure 5. SWC in 0–60, 60–100, and 100–140 cm layers in maize seasons. (ac) represent SWC in 0–60 cm layer in 2018, 2019, and 2020, respectively; (df) represent SWC in 60–100 cm layer in 2018, 2019, and 2020, respectively; (gi) represent SWC in 100–140 cm layer in 2018, 2019, and 2020, respectively.
Agronomy 14 01006 g005
Table 1. Main soil physical properties of experimental soil in 0–140 cm soil layer.
Soil Depth (cm)Percentage of Particle Content (%)Bulk Density
(g cm−3)
Field Capacity
(cm3 cm−3)
Saturated Water Content (cm3 cm−3)
(0–0.002 mm)(0.002–0.02 mm)(0.02–2 mm)
0–206.8350.6342.541.5333.80%41.23%
20–406.4339.5354.041.6133.26%41.25%
40–606.3138.4055.291.5631.87%41.12%
60–806.2836.9056.821.5030.67%43.52%
80–1005.6638.9855.361.4629.45%45.02%
100–1205.9732.7861.251.4127.36%47.24%
120–1403.4330.20 66.371.4127.89%47.14%
Table 2. Soil nutrient content in the 0–140 cm soil layer.
Soil Depth
(cm)
Nitrate Nitrogen
(mg kg−1)
Ammonium Nitrogen
(mg kg−1)
Available Potassium
(mg kg−1)
Available Phosphorus
(mg kg−1)
Organic Matter
(%)
0–2028.45 2.36 153.7113.851.47
20–4018.44 2.21 113.4412.641.25
40–6010.89 2.76 98.918.771.08
60–808.37 2.50 77.627.880.90
80–10010.63 2.97 51.243.690.66
100–1207.49 2.40 39.541.430.47
120–1406.84 2.38 33.471.900.49
Average13.02 2.51 81.13 7.17 0.90
Table 3. Date and days after sowing of different growth stages for wheat.
Growth Stage2018–20192019–20202020–2021
Sowing10 October (1)12 October (1)10 October (1)
Reviving22 February (136)25 February (137)22 February (136)
Jointing15 March (157)15 March (156)14 March (156)
Anthesis23 April (196)22 April (194)25 April (198)
Maturity3 June (237)3 June (236)3 June (237)
Table 4. Date and days after sowing of different growth stages for maize.
Growth Stage201820192020
Sowing14 June (1)14 June (1)9 June (1)
VE20 June (7)20 June (7)14 June (7)
V67 July (24)7 July (24)2 July (25)
VT7 August (55)7 August (55)2 August (56)
R39 September (88)9 September (88)6 September (91)
R63 October (112)3 October (112)30 September (115)
Table 5. Irrigation date and days after sowing in wheat seasons.
201920202021Growth Stage
12 March (154)9 March (150)/reviving–jointing
19 April (192)19 April (191)11 April (184)jointing–anthesis
15 May (218)15 May (217)14 May (217)filling–maturity
Table 6. Total evapotranspiration and evapotranspiration (mm) at each growth stage in three wheat seasons.
Growing SeasonN Application RateSowing to JointingJointing to AnthesisAnthesis to MaturityTotal
2018–2019N3127.4 cd142.5 ab231.1 a501.0 a
N2123.3 cd153.1 a226.1 a502.5 a
N1120.6 d142.6 ab230.8 a494.0 a
N0122.5 cd128.9 bc214.6 ab466.0 b
2019–2020N3134.6 bcd119.7 cd196.2 bc450.4 bc
N2136.7 bc127.1 bc189.1 c452.9 bc
N1138.0 bc116.5 cd183.9 cd438.5 c
N0123.4 cd105.8 d177.0 cd406.2 d
2020–2021N3158.4 a161.3 a186.5 cd506.2 a
N2156.5 a161.0 a191.2 c508.8 a
N1148.8 ab143.9 ab161.6 de454.3 bc
N0144.8 ab110.2 d141.8 e396.8 d
ANVOANNS0.0000.0000.000
(p-value)GS0.0000.0000.0000.000
N × GSNS0.0470.0200.000
Note: Different letters in the same column mean significant differences at the p < 0.05 probability level; NS means no significant difference; N means nitrogen application rate; GS means growing season; N × GS means the interaction of N and GS.
Table 7. Total evapotranspiration and evapotranspiration (mm) at each growth stage in three maize seasons.
Growing SeasonN application RateVE−V6V6−VT VT−R3 R3−R6Total
2018N356.8 bc122.7140.6 a54.1374.2
N250.6 c126.6147.2 a47.8372.1
N162.3 bc126.8137.6 a51.7378.4
N056.8 bc128.2140.6 a48.7374.3
2019N357.9 bc122.6143.9 a50.8375.2
N264.2 bc116.9144.3 a55.2380.6
N167.8 abc113.8136.0 ab50.1367.7
N072.3 ab122.6118.9 b50.1363.9
2020N367.3 abc//46.1/
N255.1 bc//46.7/
N150.5 c//40.0/
N082.6 a//48.0/
ANVOAN0.020NS0.037NS NS
(p-value)GSNSNSNSNSNS
N × GS0.027NS0.002NSNS
Note: Different letters in the same column mean significant differences at the p < 0.05 probability level; NS means no significant difference; N means nitrogen application rate; for total ET and ET at the V6−VT, VT−R3, R3−R6 stages, GS means the 2019 and 2020 growing seasons; for ET at the VE−V6 stage, GS means the 2019, 2020 and 2021 growing seasons; N × GS means the interaction of N and GS. “/” means no data.
Table 8. Grain yield and WUE of wheat for each treatment.
Growing SeasonN Application RateGrain Yield
(kg hm−2)
WUE
(kg m−3)
2018–2019N39984 a1.99 b
N29834 a1.96 bc
N19051 bc1.83 c
N06803 d1.46 de
2019–2020N310,016 a2.22 a
N29708 ab2.14 ab
N18469 c1.93 bc
N06173 d1.52 d
2020–2021N39441 ab1.86 c
N29327 ab1.83 c
N16435 d1.42 e
N03462 e0.87 f
ANVOAN0.0000.000
(p-value)GS0.0000.000
N × GS0.0000.000
Note: Different letters in the same column mean significant differences at the p < 0.05 probability level. N means nitrogen application rate; GS means growing season; N × GS means interactions of N and GS.
Table 9. Grain yield and WUE of maize for each treatment.
Growing SeasonN Application RateGrain Yield
(kg hm−2)
WUE
(kg m−3)
2018N310,069 ab2.69 a
N210,174 a2.73 a
N19755 ab2.58 ab
N09985 ab2.67 a
2019N310,236 a2.73 a
N210,364 a2.72 a
N19160 b2.49 b
N07511 c2.06 c
2020N39843 ab/
N29837 ab/
N18128 c/
N06118 d/
ANVOAN0.0000.005
(p-value)GS0.0000.026
N × GS0.0000.014
Note: Different letters in the same column mean significant differences at the p < 0.05 probability level; N means nitrogen application rate; GS means 2018 and 2019 growing seasons; N × GS means interactions of N and GS.
Table 10. Pearson correlation coefficient between LAI, total ET, grain yield, and WUE.
VariablesLAITotal ETGrain YieldWUE
WheatLAI1
Total ET0.856 **1
Grain yield0.963 **0.752 **1
WUE 0.869 **0.5460.961 **1
MaizeLAI1
Total ET0.743 *1
Grain yield0.983 **0.6311
WUE 0.859 **0.3180.936 **1
Note: * means significant correlation at p < 0.05 probability level (two-tailed); ** means significant correlation at p < 0.01 probability level (two-tailed); positive values indicate positive correlation between indicated variables.
Disclaimer/Publisher’s Note: The statements, opinions and data contained in all publications are solely those of the individual author(s) and contributor(s) and not of MDPI and/or the editor(s). MDPI and/or the editor(s) disclaim responsibility for any injury to people or property resulting from any ideas, methods, instructions or products referred to in the content.

