Article

Effect of Biochar Types and Rates on SOC and Its Active Fractions in Tropical Farmlands of China

Sanya Institute of Breeding and Multiplication, School of Tropical Agriculture and Forestry (School of Agricultural and Rural, School of Rural Revitalization), Hainan University, Haikou 570228, China
*
Author to whom correspondence should be addressed.
Agronomy 2024, 14(4), 676; https://doi.org/10.3390/agronomy14040676
Submission received: 22 February 2024 / Revised: 23 March 2024 / Accepted: 24 March 2024 / Published: 26 March 2024
(This article belongs to the Section Agricultural Biosystem and Biological Engineering)

Abstract

:
To date, most studies have shown that biochar has great potential in carbon sequestration and reduction, as well as soil quality improvement. However, there is limited knowledge of its effect on soil organic carbon (SOC) fractions in tropical farmland. This study aimed to determine the impact of different types and rates of biochar applied in tropical farmlands on so SOC and its active fractions. The SOC, microbial biomass carbon (MBC), dissolved organic carbon (DOC), and soil mineralizable carbon (SMC) in the 0–30 cm soil layers under rice hull (R) and peanut shell (P) biochar treatments were measured. The results showed that the application of R and P biochar increased the contents, stocks, and cumulative stocks of SOC, MBC, and DOC in the 0–10 cm, 10–20 cm, and 20–30 cm soil layers. The contents, stocks, and cumulative stocks increased with increasing biochar application rates. Compared with CK, the ranges of the increased SOC, MBC, and DOC cumulative stocks were 10.76–46.36%, 30.04–195.65%, and 0.02–17.03%, respectively. However, the R60 and P60 had the lowest cumulative stocks of SMC, decreasing by 14.69% and 8.05%, respectively. The biochar treatment of more than 20 t ha−1 reduced the ratio of SMC:SOC and active fractions:SOC. Therefore, it can be inferred that the application of biochar improved the levels of SOC, MBC, and DOC, and the application of more than 20 t ha−1 biochar could decrease soil carbon mineralization, thus improving the stability of SOC in tropical farmlands.

1. Introduction

As far as we know, the tropics cover approximately 40% of the Earth’s surface and support approximately 40% of the world’s population. This proportion is likely to rise to 50% by the end of 2030 [1]. However, soil organic carbon (SOC) deficiency in most tropical regions, rapid decomposition in high-temperature and humid environments, low overall nutrient content, and the overuse of synthetic fertilizers that damage soil structure pose major challenges to sustainable agriculture in the tropics [2,3,4,5]. Importantly, SOC is one of the indicators that measures the fertility and quality of farmland soil [3]. We can enhance and store SOC by applying carbon (C)-rich amendments to improve soil fertility in tropical regions. Considering the unique climate environment of tropical regions, when choosing C-rich amendments, we need to consider whether they can resist the impact of climatic factors. In other words, can they be stored in soil for a long time and not easily decompose?
Biochar provides us with a good option as it is a carbon sequestration material produced through thermochemical reactions from biomass such as straw, wood, and fertilizers in low-oxygen or anaerobic environments [6,7,8]. To date, biochar has been widely used for crop production, soil improvement, and waste management [9,10,11,12]. Numerous studies have demonstrated that biochar can enhance soil organic matter content, improve soil physical and chemical properties, increase crop yield, and decrease soil greenhouse gas emissions [13,14,15,16,17]. In temperate planting systems, although composite biochar mixtures can replace mineral fertilizers and be directly used for crop growth and development [18], their potential to increase crop yield is relatively small [19]. As tropical soils are highly weathered, nutrient-poor, and have a low pH, biochar correction has more potential to improve soil fertility and quality. Our previous research also demonstrated that the use of biochar has a substantial effect on the physical and chemical characteristics as well as the enzyme activities of dry red soil in tropical farmlands [20].
Biochar application is an essential measure for increasing the soil carbon pool [16]. A large amount of biochar added to soil will directly change the quantity and composition of SOC. Dong et al. [21] used biochar made from rice husks and cottonseed husks at different application rates (0, 30, 60, and 90 t/ha), and the SOC content increased with the increase in application rate. The main reason for this increase was the direct contribution of stable carbon sources in biochar [22]. Biochar not only increases the content of SOC but also promotes the formation of soil macroaggregates, thereby increasing the stability of SOC [23]. Applying biochar to soil improves the soil’s physicochemical properties, increases the soil’s microbial biomass [24,25], and then increases the MBC content [26]. Researchers’ conclusions on the impact of biochar on SOC mineralization are inconsistent [27,28,29], obtaining positive, negative, or neutral results. Adding aged sugarcane bagasse and rice husk biochar can inhibit soil respiration and reduce the absolute accumulation of CO2-C [30]. However, the application of straw or straw + biochar alone will increase CO2-C emissions in the soil, and only adding biochar alone (2%) can reduce them [31], indicating that biochar can reduce SOC mineralization. Dong et al. [21] found that an increase in the biochar application rate significantly reduced the content of SOC active fractions, with 60 t ha−1 and 90 t ha−1 treatments significantly reducing the content by 33.2% and 47.7%, respectively. In summary, the effect of biochar application on the soil carbon pool varies with the type of biochar, the rates of biochar application, and the type of soil.
The stability of SOC can be evaluated by analyzing the proportion of active fractions to SOC [26], and the common active fractions of SOC include microbial biomass carbon (MBC), dissolved organic carbon (DOC), and soil mineralizable carbon (SMC) [32,33]. The MBC to SOC ratio can be used as an indicator of soil carbon availability, carbon loss, and carbon stability [34,35]. The DOC to SOC ratio can also be used as a stability indicator. Zhang et al. [36] showed that the DOC to SOC ratio near the Yellow River is relatively high, indicating that the stability of SOC is relatively low under strong hydrological processes. Therefore, considering the key role of SOC in soil carbon cycling in farmlands, improving farmland carbon sequestration and revealing the mechanism affecting the stability of SOC are of great significance in soil carbon sequestration.
Extensive research on biochar has also been conducted in tropical regions, but it mainly focuses on improving the soil to increase crop yield or slow greenhouse gas emissions. However, there is still insufficient research on SOC and active fractions, and it is crucial to conduct research on the effects of biochar on SOC and stability in tropical regions. Therefore, we conducted a field experiment to investigate the influence of two biochar types (rice hull and peanut shell) with four application rates on the SOC and active fractions. Our aims were to (1) identify the changes in the SOC and active fractions upon biochar’s addition and (2) assess the possible relationships of the active carbon fractions and carbon stability with the soil physicochemical properties and soil enzyme activity when treated with an application of biochar.

2. Materials and Methods

2.1. Experimental Site and Design

The experiment was conducted at the experimental base for tropical crops at the College of Hainan University in Ledong County, Hainan Province (18°39′6″ N, 108°46′22″ E, 66.8 m a.s.l). The region has a tropical monsoon climate, with an average annual rainfall of 1279.1 mm, an average annual temperature of 24.5 °C, and an average evaporation of 2400–2600 mm, and rainfall is concentrated from May to October [37]. The soil type studied is Lixisols [38]. The specific precipitation and temperature data can be found in Figure S1. The basic physicochemical properties of the soil (0–20 cm) before the experiment are listed in Table 1.
The R biochar and P biochar used in this experiment were pyrolyzed under high-temperature anaerobic conditions at 500 °C (commercially purchased from Henan Sanli New Energy Co., Ltd., Nanyang, China). The characteristics of the biochar are listed in Table 1.
Two types of biochar, rice hull (signature R) and peanut shell (signature P), were used in this study. The application rates of biochar were 10 t ha−1, 20 t ha−1, 40 t ha−1, and 60 t ha−1, designated R10, R20, R40, R60, P10, P20, P40, and P60, respectively. No biochar treatment was used as the control (signature CK). There were nine treatments and three replicates for each treatment. Each replicate consisted of a plot with a size of 25.2 m2 (length × width: 7.2 m × 3.5 m), and the plots were separated by a 0.5 m isolation zone.
The experiment began in October 2019. Biochar was thoroughly mixed with topsoil (0–20 cm) by a mechanical method. Biochar will not be supplemented in future experiments. We adopted the Solanum lycopersicum Mill–spring maize–summer maize rotation tillage system with Solanum lycopersicum Mill planted in October and harvested in early March, spring maize planted in mid-March and harvested in early June, and summer maize planted in early July and harvested in late September. When planting Solanum lycopersicum Mill, compound fertilizer (N: P2O5: K2O, ratio: 15:15:15) was applied five times, for a total of 1949.03 kg ha−1. When planting spring maize, compound fertilizer (N: P2O5: K2O, ratio: 15:15:15) was applied once, for a total of 750 kg ha−1; 46% urea was applied twice, for a total of 450 kg ha−1. The fertilization of the summer maize was the same as that of spring maize. Soil samples were collected after the summer maize harvest on 28 September 2021 (two years after biochar application). All farming operations were consistent with those of local high-yield fields.

2.2. Soil Sampling and Index Determination

The five-point sampling method was adopted in each plot to collect soil samples with a soil drill. The sampling depths were 0–10 cm, 10–20 cm, and 20–30 cm. Five soil samples from the same soil layer within the same plot were mixed to form one soil sample. The soil samples were divided into two parts: fresh soil samples were stored in a 20 °C refrigerator for laboratory culture experiments and to determine the fresh sample index, and the others were naturally air dried. These air-dried samples were used to determine the basic properties of soil once the fine roots had been manually removed and the samples had been ground and passed through 2 mm and 1 mm sieves successively.
Soil pH (H2O) was determined with a glass electrode (soil:solution = 1 g:2.5 mL) [39]. Soil bulk density (BD) was measured by ring knife method. Soil moisture content (MC) was measured by weighing method [40]. SOC was measured by the “wet combustion method” [41]. Samples were digested with an accelerator (K2SO4:CuSO4:Se = 100:10:1) [41], and then total nitrogen (TN) was measured with the French AMS Alliance Futura continuous flow analyzer. MBC was determined by the fumigation extraction method [42]. DOC was extracted via 0.5 M K2SO4 and determined by a TOC analyzer (TOC-L Shimadzu, Tokyo, Japan). Soil sucrase activity was measured by 3,5-dinitrosalicylic acid; soil catalase activity was measured by potassium permanganate titration; soil urease activity was measured by indiophenol blue; and soil acid phosphatase activity was measured by bisodium benzene phosphate [43].
The pH of the biochar was determined in ultrapure water at a ratio of 1:10 w:v by a pH meter (Seven Compact S220). The hydrocarbon, oxygen, and nitrogen elements of biochar were determined by an element analyzer (PrecisION, ELEMENTARY, Frankfurt, Germany).

2.3. Mineralizable Carbon Determination

The SMC was determined by the alkali absorption method, and the specific operation steps were as follows: to make the culture conditions relatively consistent, the soil samples were precultured in a 25 °C constant-temperature incubator for seven days to restore the soil samples from −20 °C to the average temperature. To make the soil absorb water evenly, a piece of filter paper with a diameter of 7 cm was placed at the bottom of the 250 mL plastic culture bottle, and 60 g of soil sample that had passed through the 5 mm sieve was placed on the filter paper. The water demand was calculated when the maximum water-holding capacity of the soil was 60%, which was supplemented by the weighing method to determine if more water was needed. After the preculture was complete, the planting basket was placed into a 250 mL plastic culture bottle and then placed into a small beaker containing 5 mL 0.5 mol L−1 NaOH solution. The cap of the culture bottle was tightened and properly sealed. The small beaker was removed on the 2nd, 5th, 8th, 11th, 14th, 17th, 24th, 31st, 38th, 45th, 52nd, 59th, 66th, 73rd, 80th, 87th, and 90th days after culture was complete. The solution was transferred into a 50 mL triangular flask, 2 mL of 1 mol L−1 BaCl2 solution and two drops of phenolphthalein indicator were added, and the solution was titrated with 0.1 mol L−1 HCl until the red color disappeared. At the same time, a new NaOH solution was added to the small beaker.

2.4. Statistical Analysis

We used the following equation to calculate SOC (MBC, DOC, and SMC) stocks [44]:
SOC stock (t ha−1) = BD (g cm−3) × SOC (g kg−1) × D (cm)/10
where BD is the soil bulk density, SOC is the SOC content, and D is the soil sampling thickness.
To evaluate the difference between the average values of biochar treatment, SPSS Statistics 25 was used for one-way and multi-way ANOVAs, the Duncan method was used for multiple comparisons, and the significance level was set as 0.05. The redundancy analysis (RDA) method and Pearson’s linear correlation coefficient analysis were used to evaluate the relationships among soil properties, soil enzyme activities, active fractions, and SOC stability.

3. Results

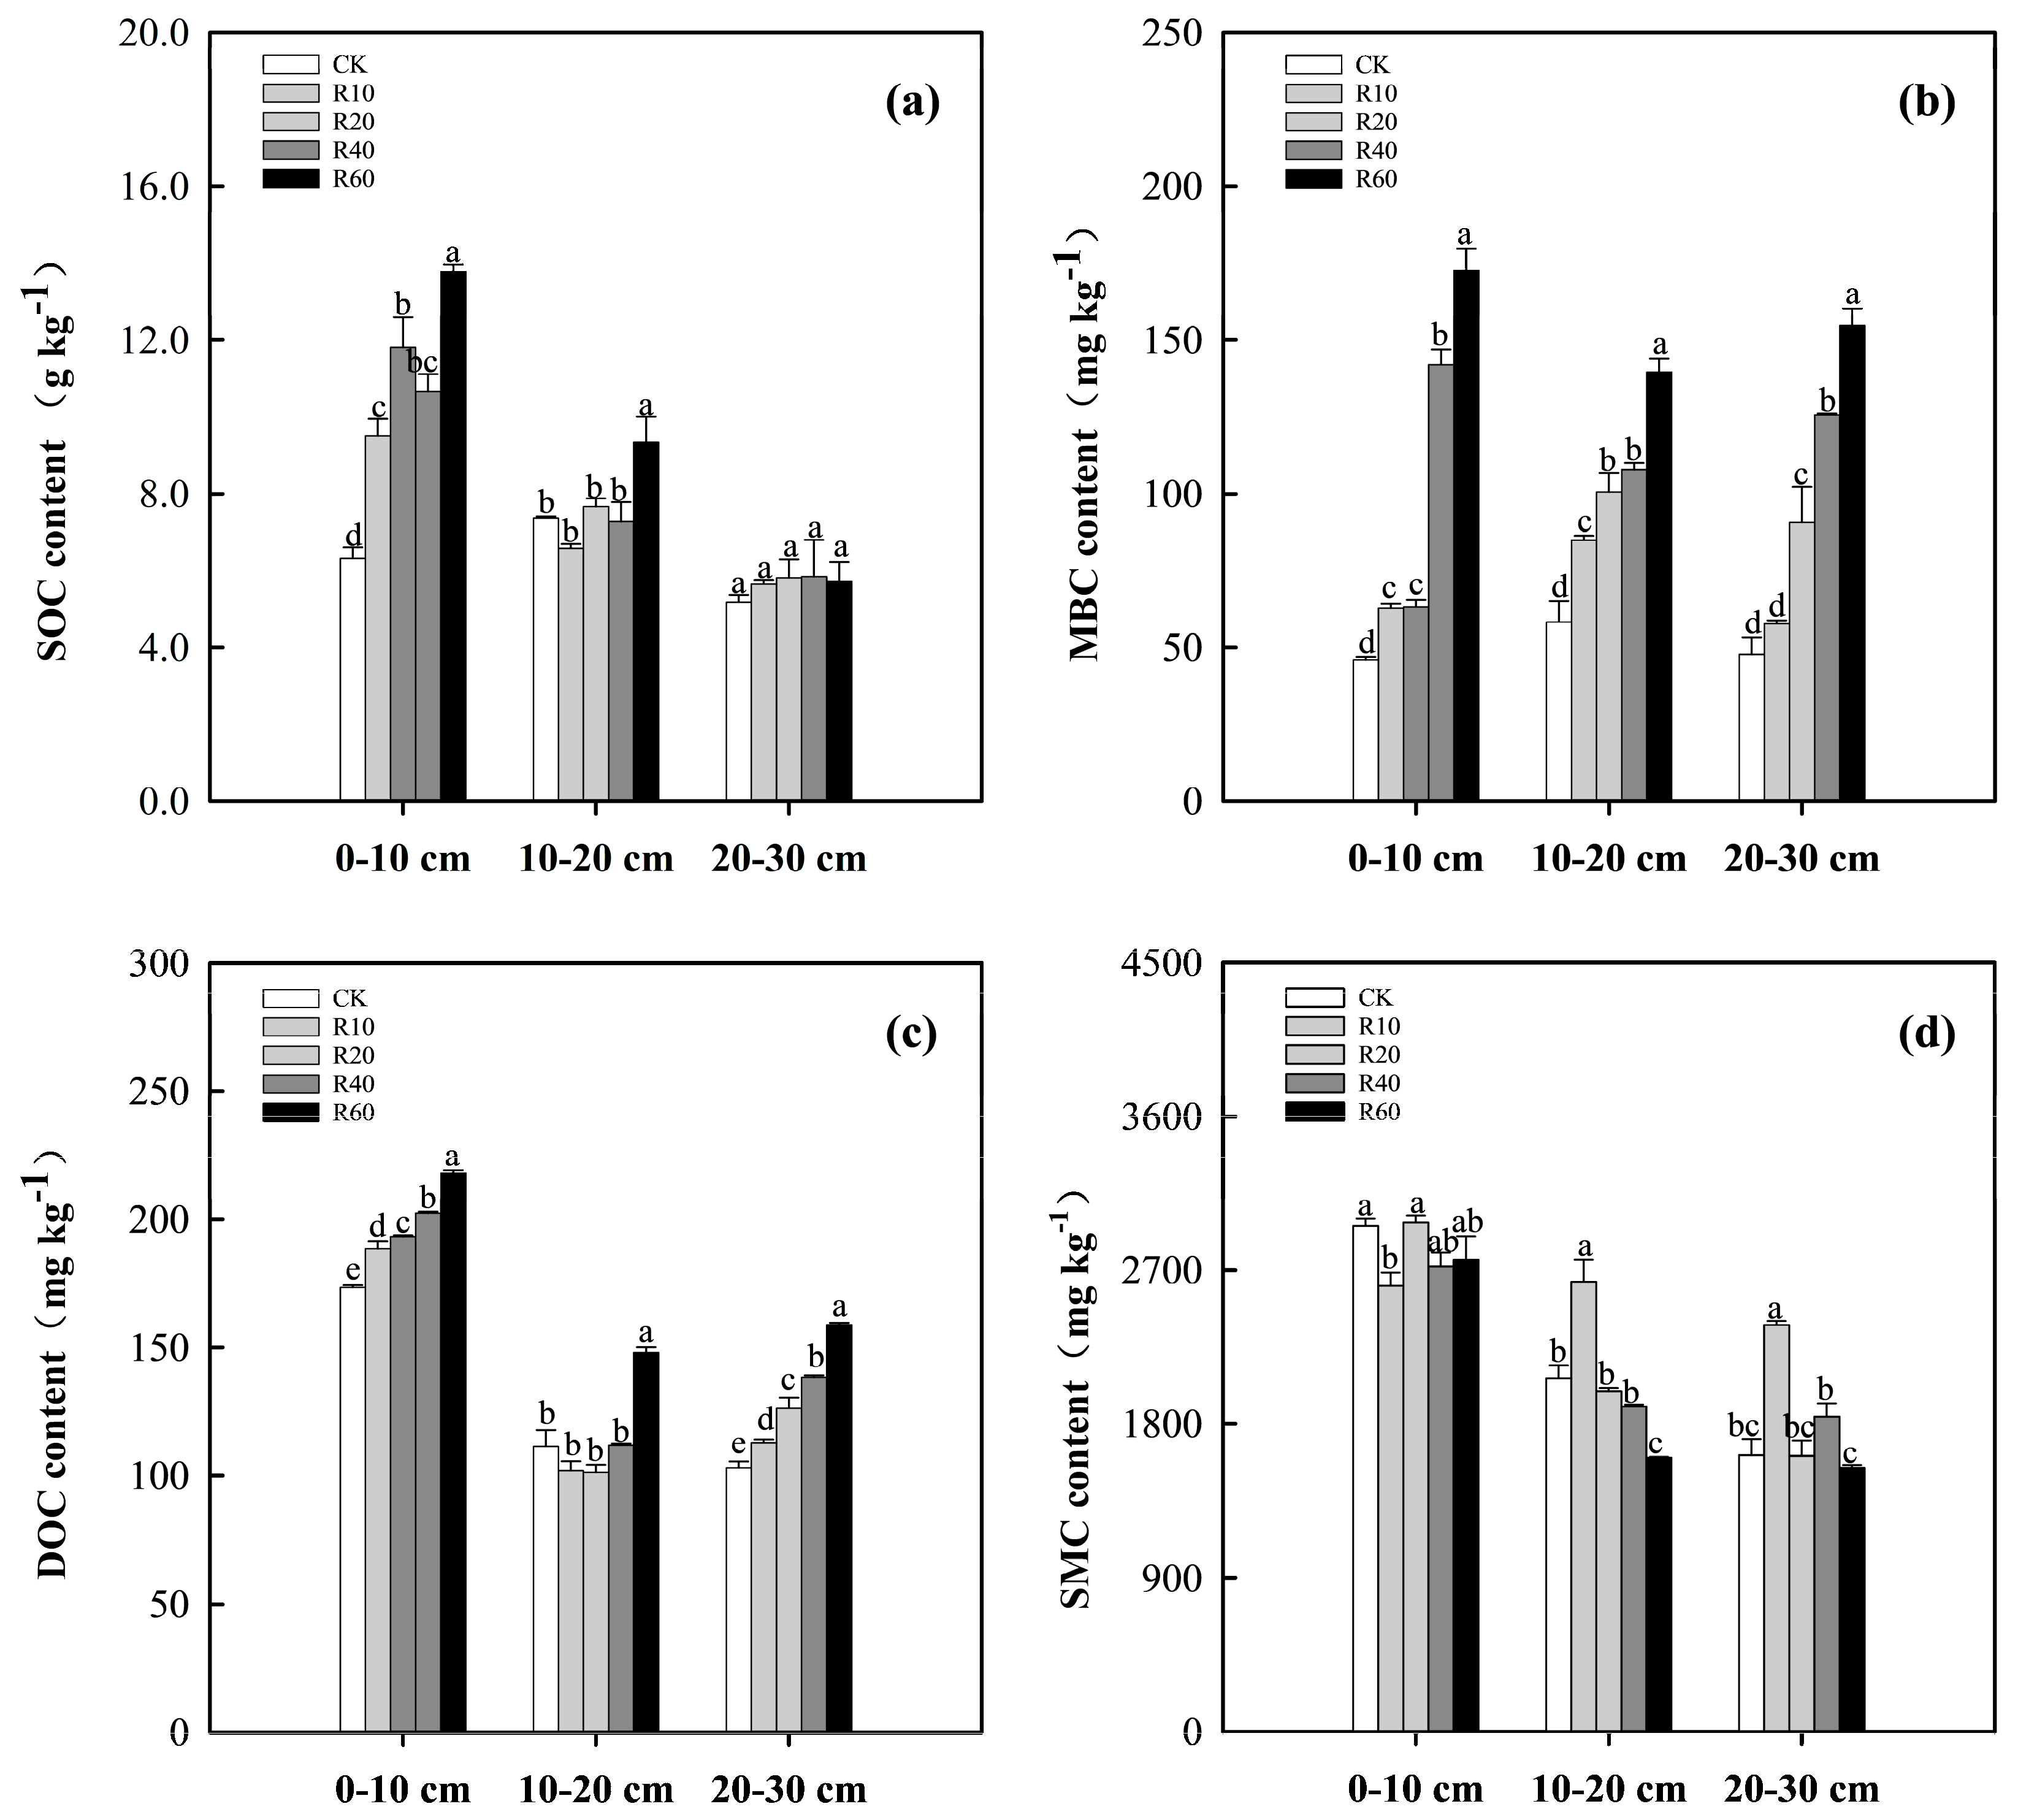
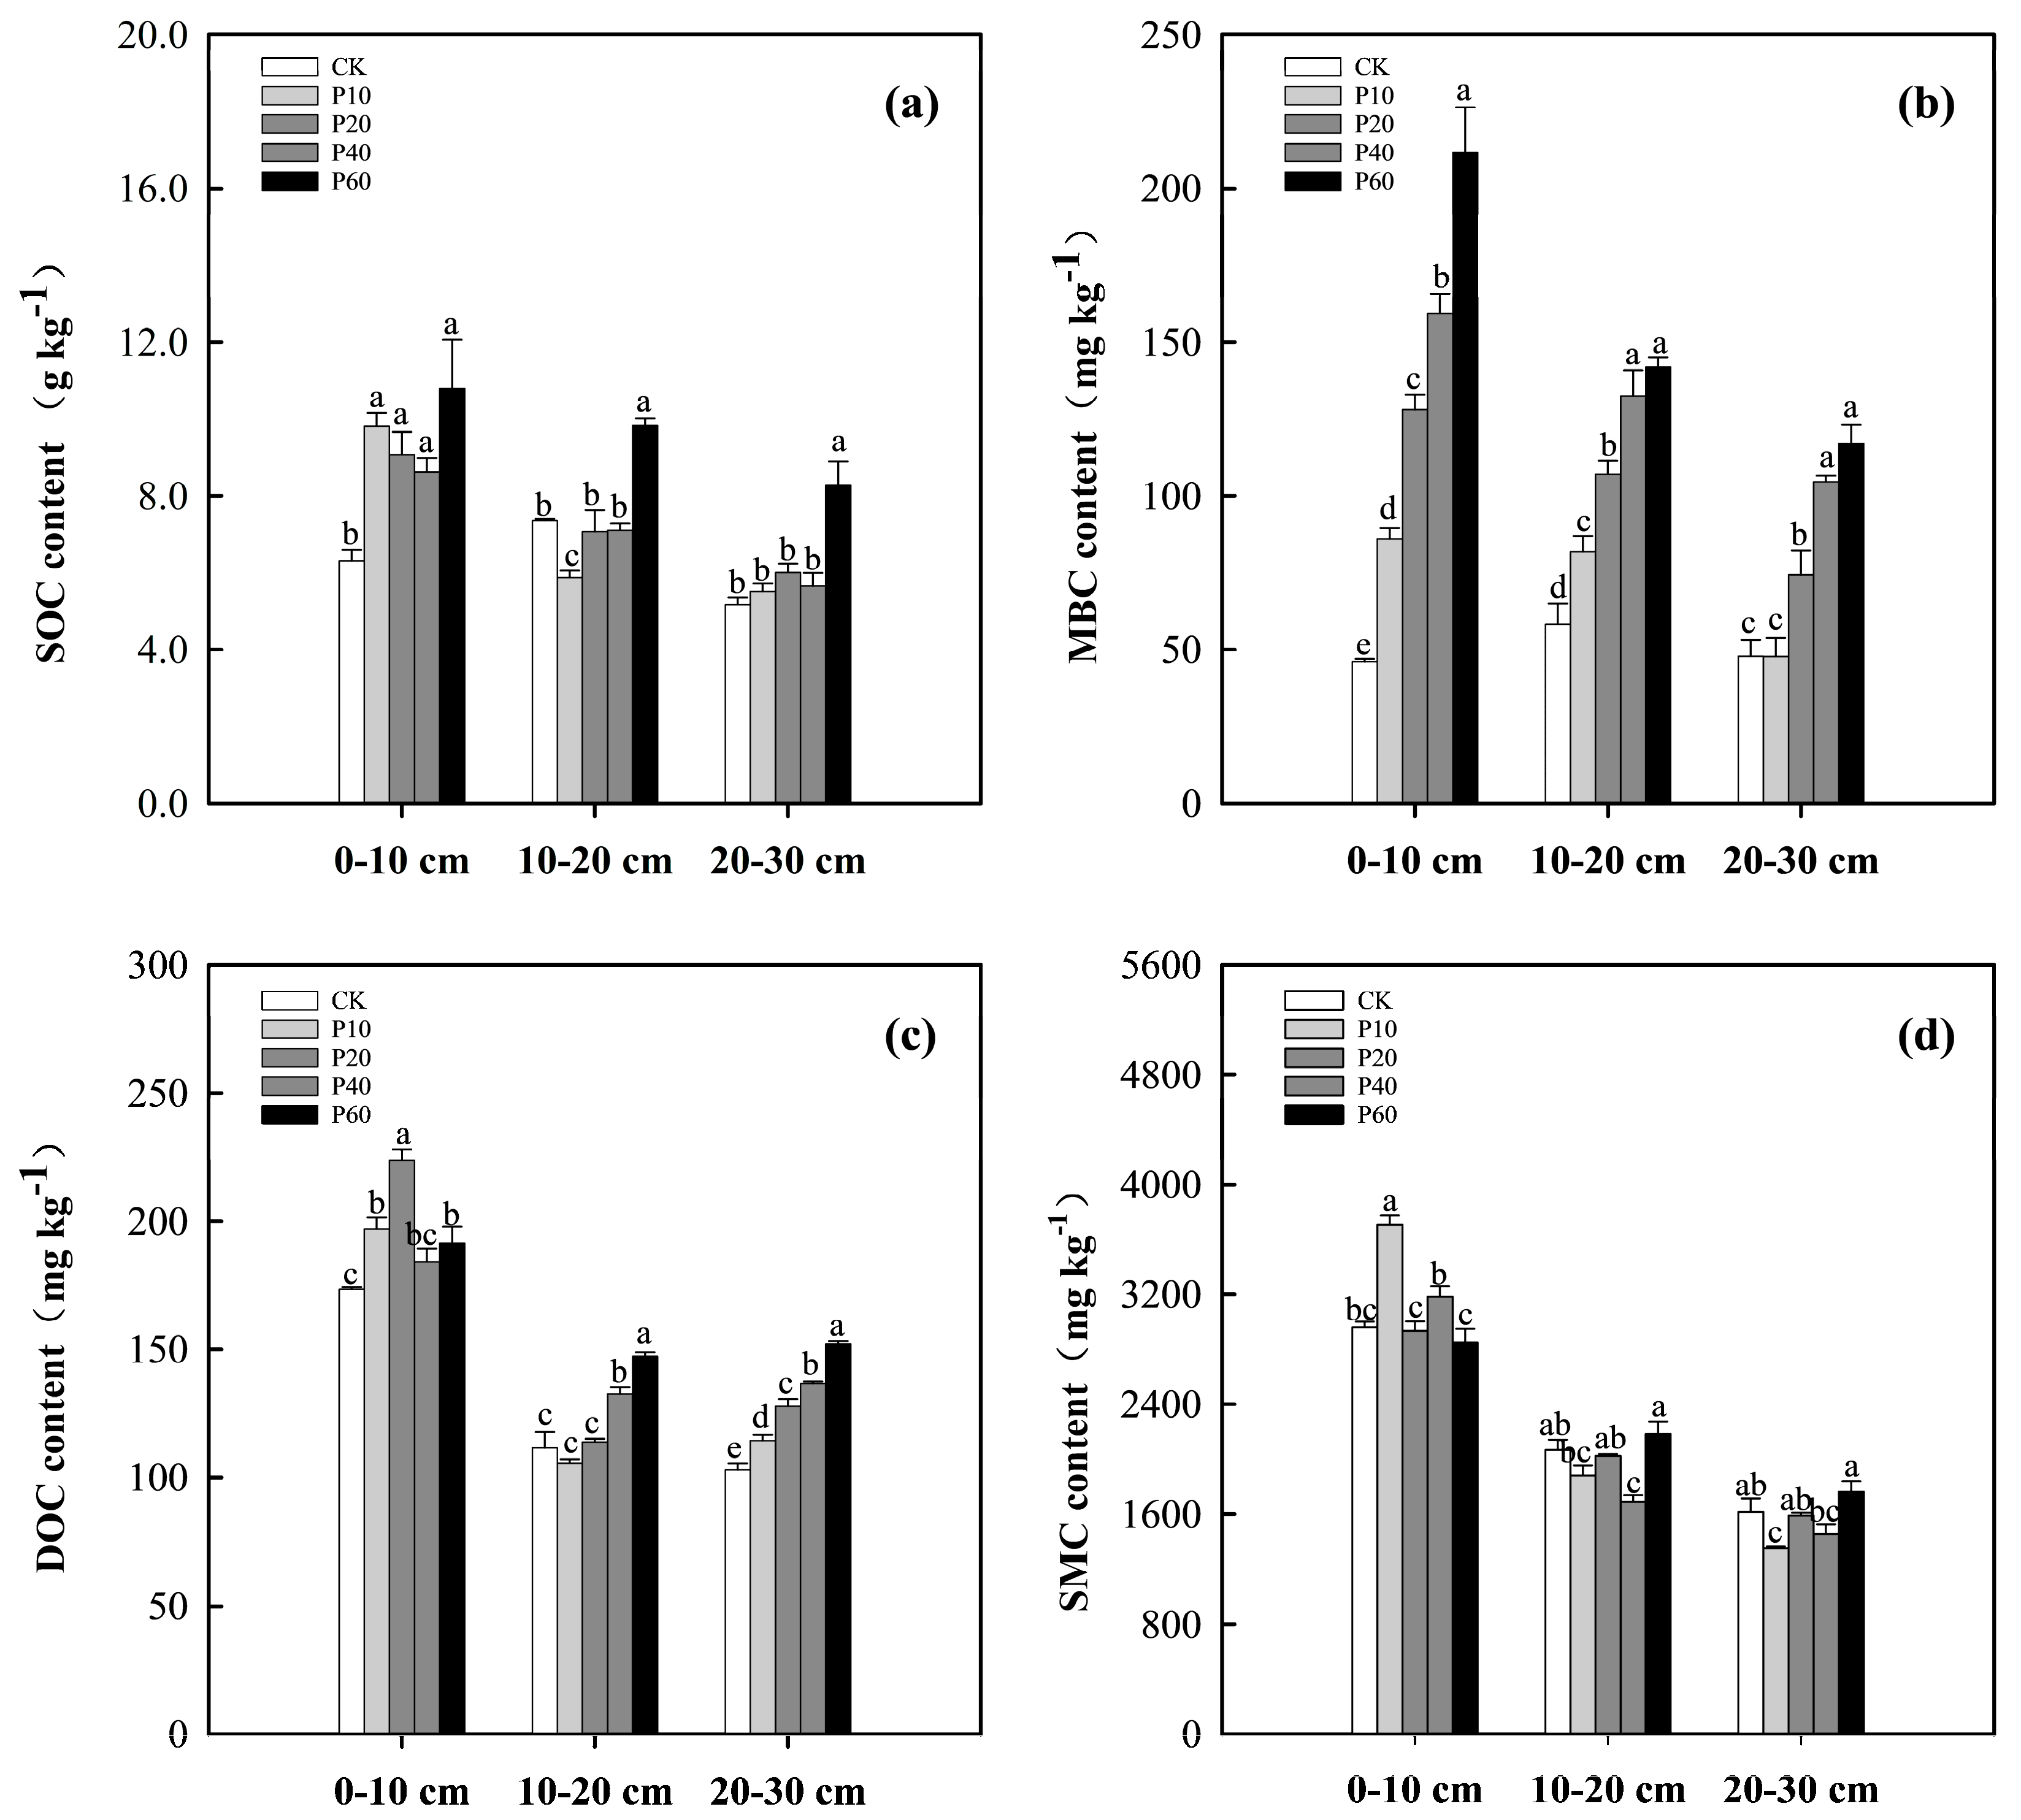
3.1. Changes in SOC and Active Fraction Contents

The biochar types, rates, and soil depths all had significant impacts on the contents of SOC and the active fractions (Table 2). The application of R biochar significantly increased the SOC contents at 0–10 cm. Compared with CK, the SOC contents of R10, R20, R40, and R60 increased by 50.44%, 86.95%, 68.71%, and 118.15%, respectively, and the SOC content of the R60 treatment was the highest at 13.79 g kg−1. In the 10–20 cm soil layer, the SOC of the R60 treatment was the highest at 9.34 g kg−1, which was significantly higher than that of the CK, R10, R20, and R40 treatments (Figure 1a). After applying R biochar, the MBC contents increased significantly with increasing biochar application rates in the 0–10 cm, 10–20 cm, and 20–30 cm soil layers; the R60 treatment had the highest MBC contents, with values of 172.73 mg kg−1, 139.62 mg kg−1, and 154.77 mg kg−1, respectively, which were significantly higher than those of the other treatments (p < 0.05). Compared with the CK treatment, the MBC contents of R60 increased by 274.87%, 139.37%, and 223.83%, respectively (Figure 1b).
In the 0–10 cm, 10–20 cm, and 20–30 cm soil layers, the R60 treatment had the highest DOC contents at 218.03 mg kg−1, 147.97 mg kg−1, and 158.77 mg kg−1, respectively. The DOC contents increased with increasing biochar application rates in the 0–10 cm and 20–30 cm soil layers, and there were significant differences among the treatments (Figure 1c). In the 0–10 cm soil layer, the R10 treatment had the lowest SMC content, which was 2607.09 mg kg−1. The R10 treatment had the highest SMC contents in the 10–20 cm and 20–30 cm soil layers, with 2630.09 mg kg−1 and 2377.68 mg kg−1, respectively, which were significantly higher than those of the other treatments. There were increases of 27.37% and 47.18%, respectively, compared to CK. The R60 treatment had the lowest SMC contents (Figure 1d).
The application of P biochar significantly increased the SOC contents in the 0–10 cm layer. The highest contents of SOC were recorded for P60 in the 0–10 cm, 10–20 cm, and 20–30 cm soil layers, which were 10.84 g kg−1, 9.84 g kg−1, and 8.28 g kg−1, respectively, and were significantly higher than those of the other treatments, with an increase of 33.47–70.87% compared with the CK (Figure 2a). In the 0–10 cm, 10–20 cm, and 20–30 cm soil layers, the MBC contents increased significantly with increasing P biochar application rates, and the P60 treatment had the highest MBC contents, while the CK had the lowest MBC contents (Figure 2b). After applying P shell biochar, the DOC contents improved significantly in most cases. The highest DOC content was recorded for the P20 treatment in the 0–10 cm soil layer (223.63 mg kg−1), while the lowest DOC content was recorded in the CK (173.27 mg kg−1). In the 10–20 cm and 20–30 cm soil layers, the R60 treatment had the highest DOC contents (Figure 2c). In the 0–10 cm soil layer, the P10 treatment had the highest SMC content, which was 3708.08 mg kg−1 and increased by 25.38% compared with that of the CK. In the 10–20 cm and 20–30 cm soil layers, the P60 treatment had the highest SMC contents, with 2182.23 mg kg−1 and 1760.62 mg kg−1, respectively (Figure 2d).

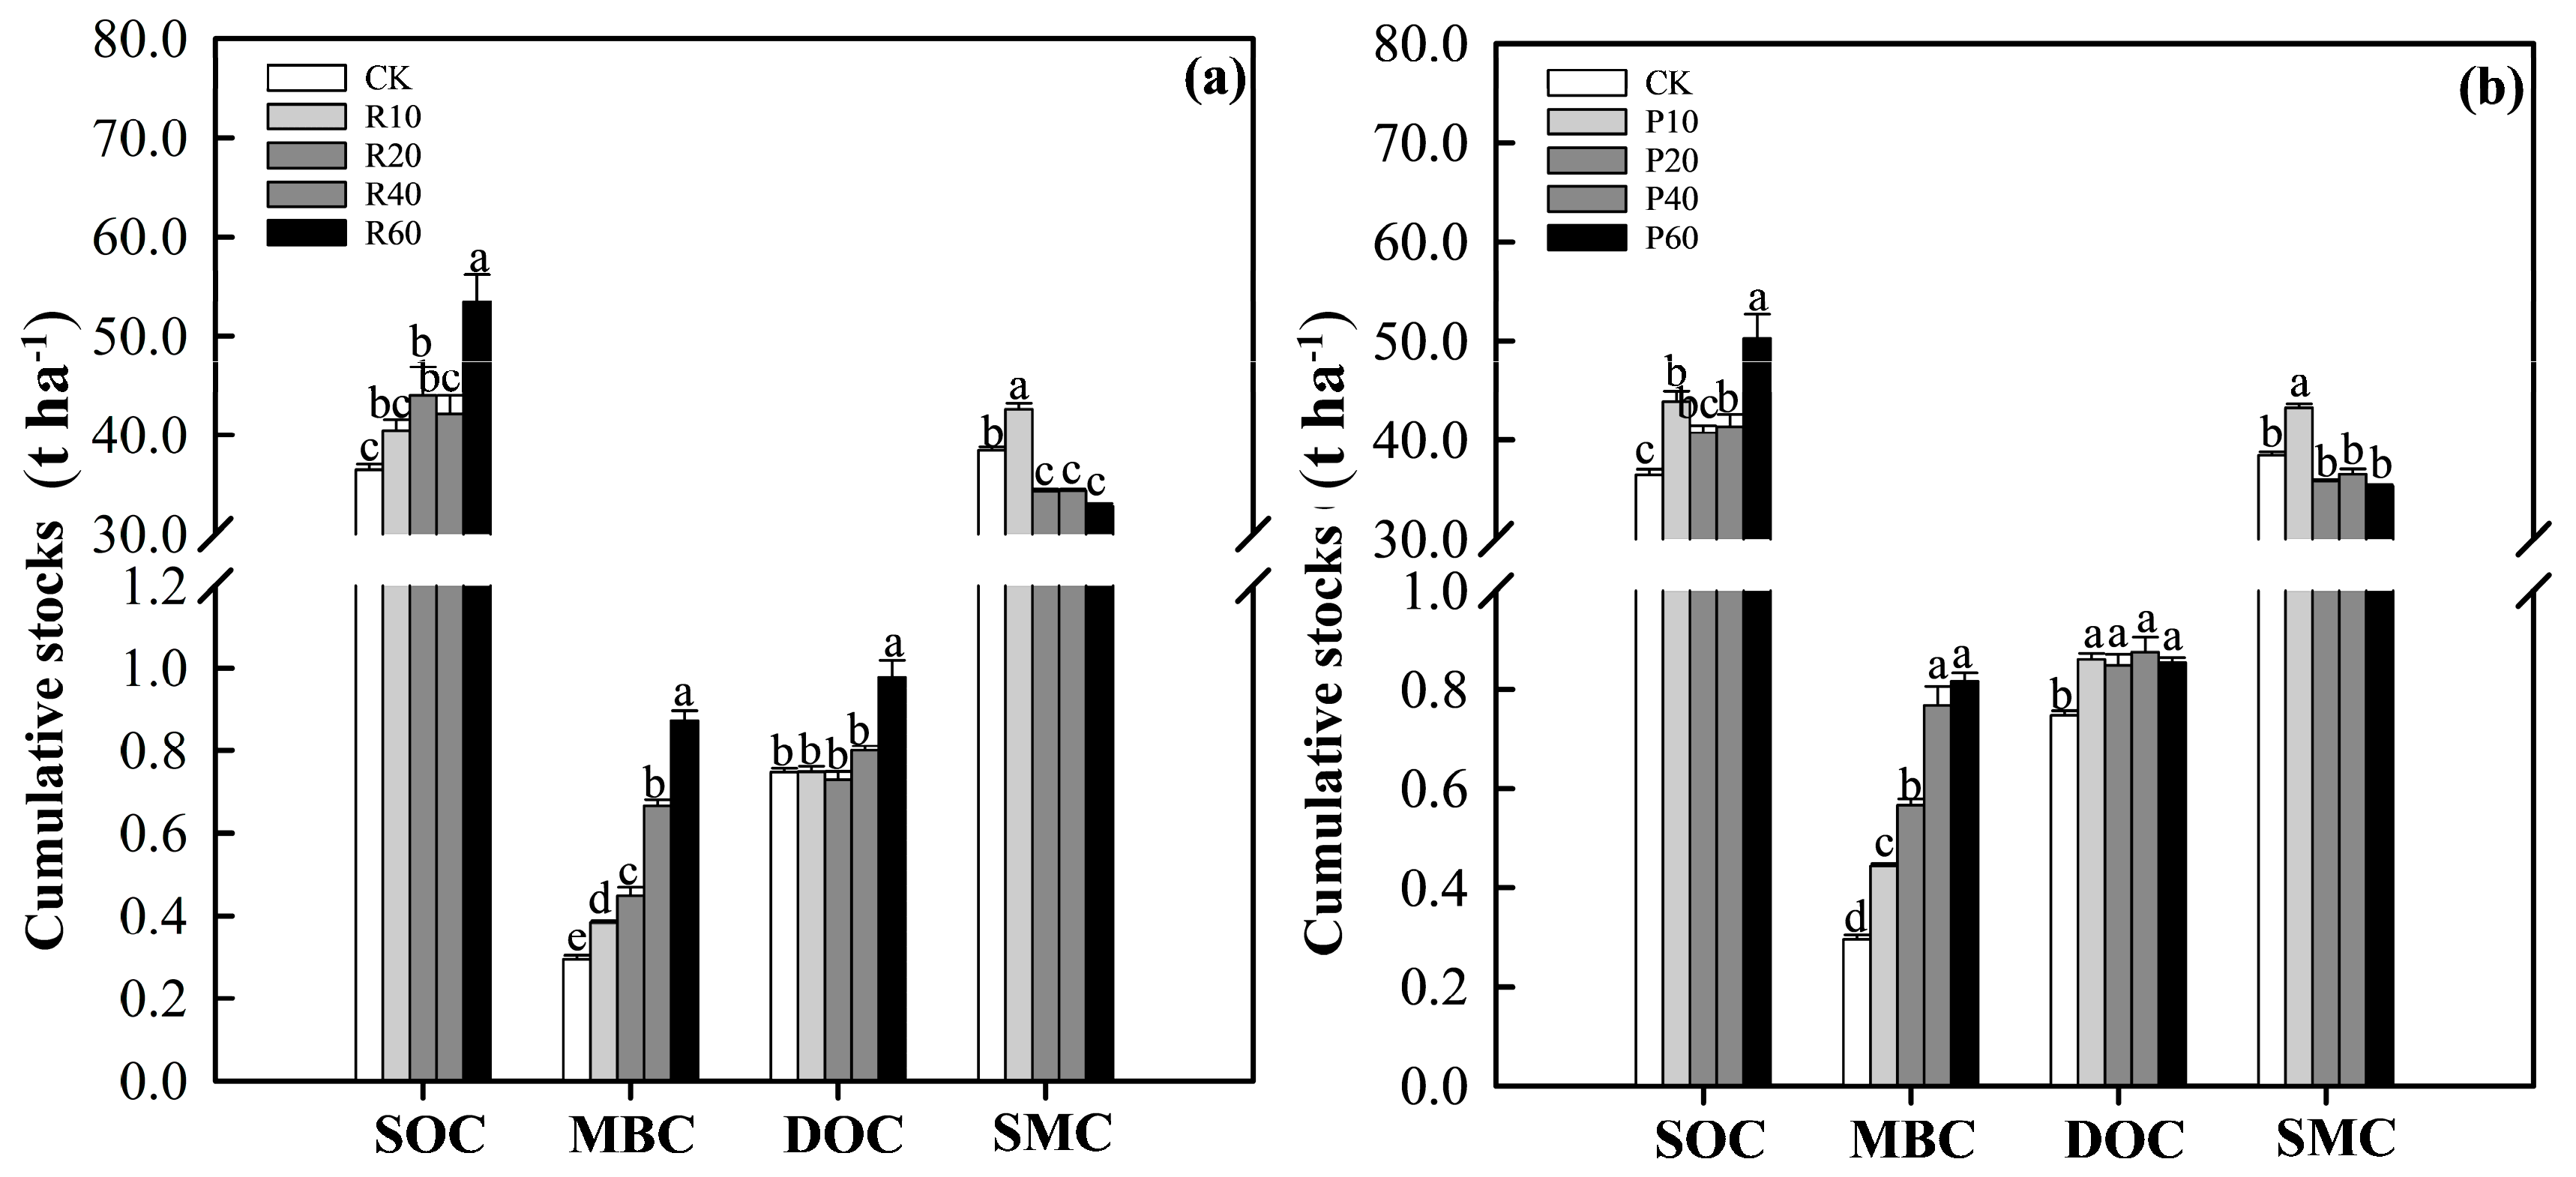
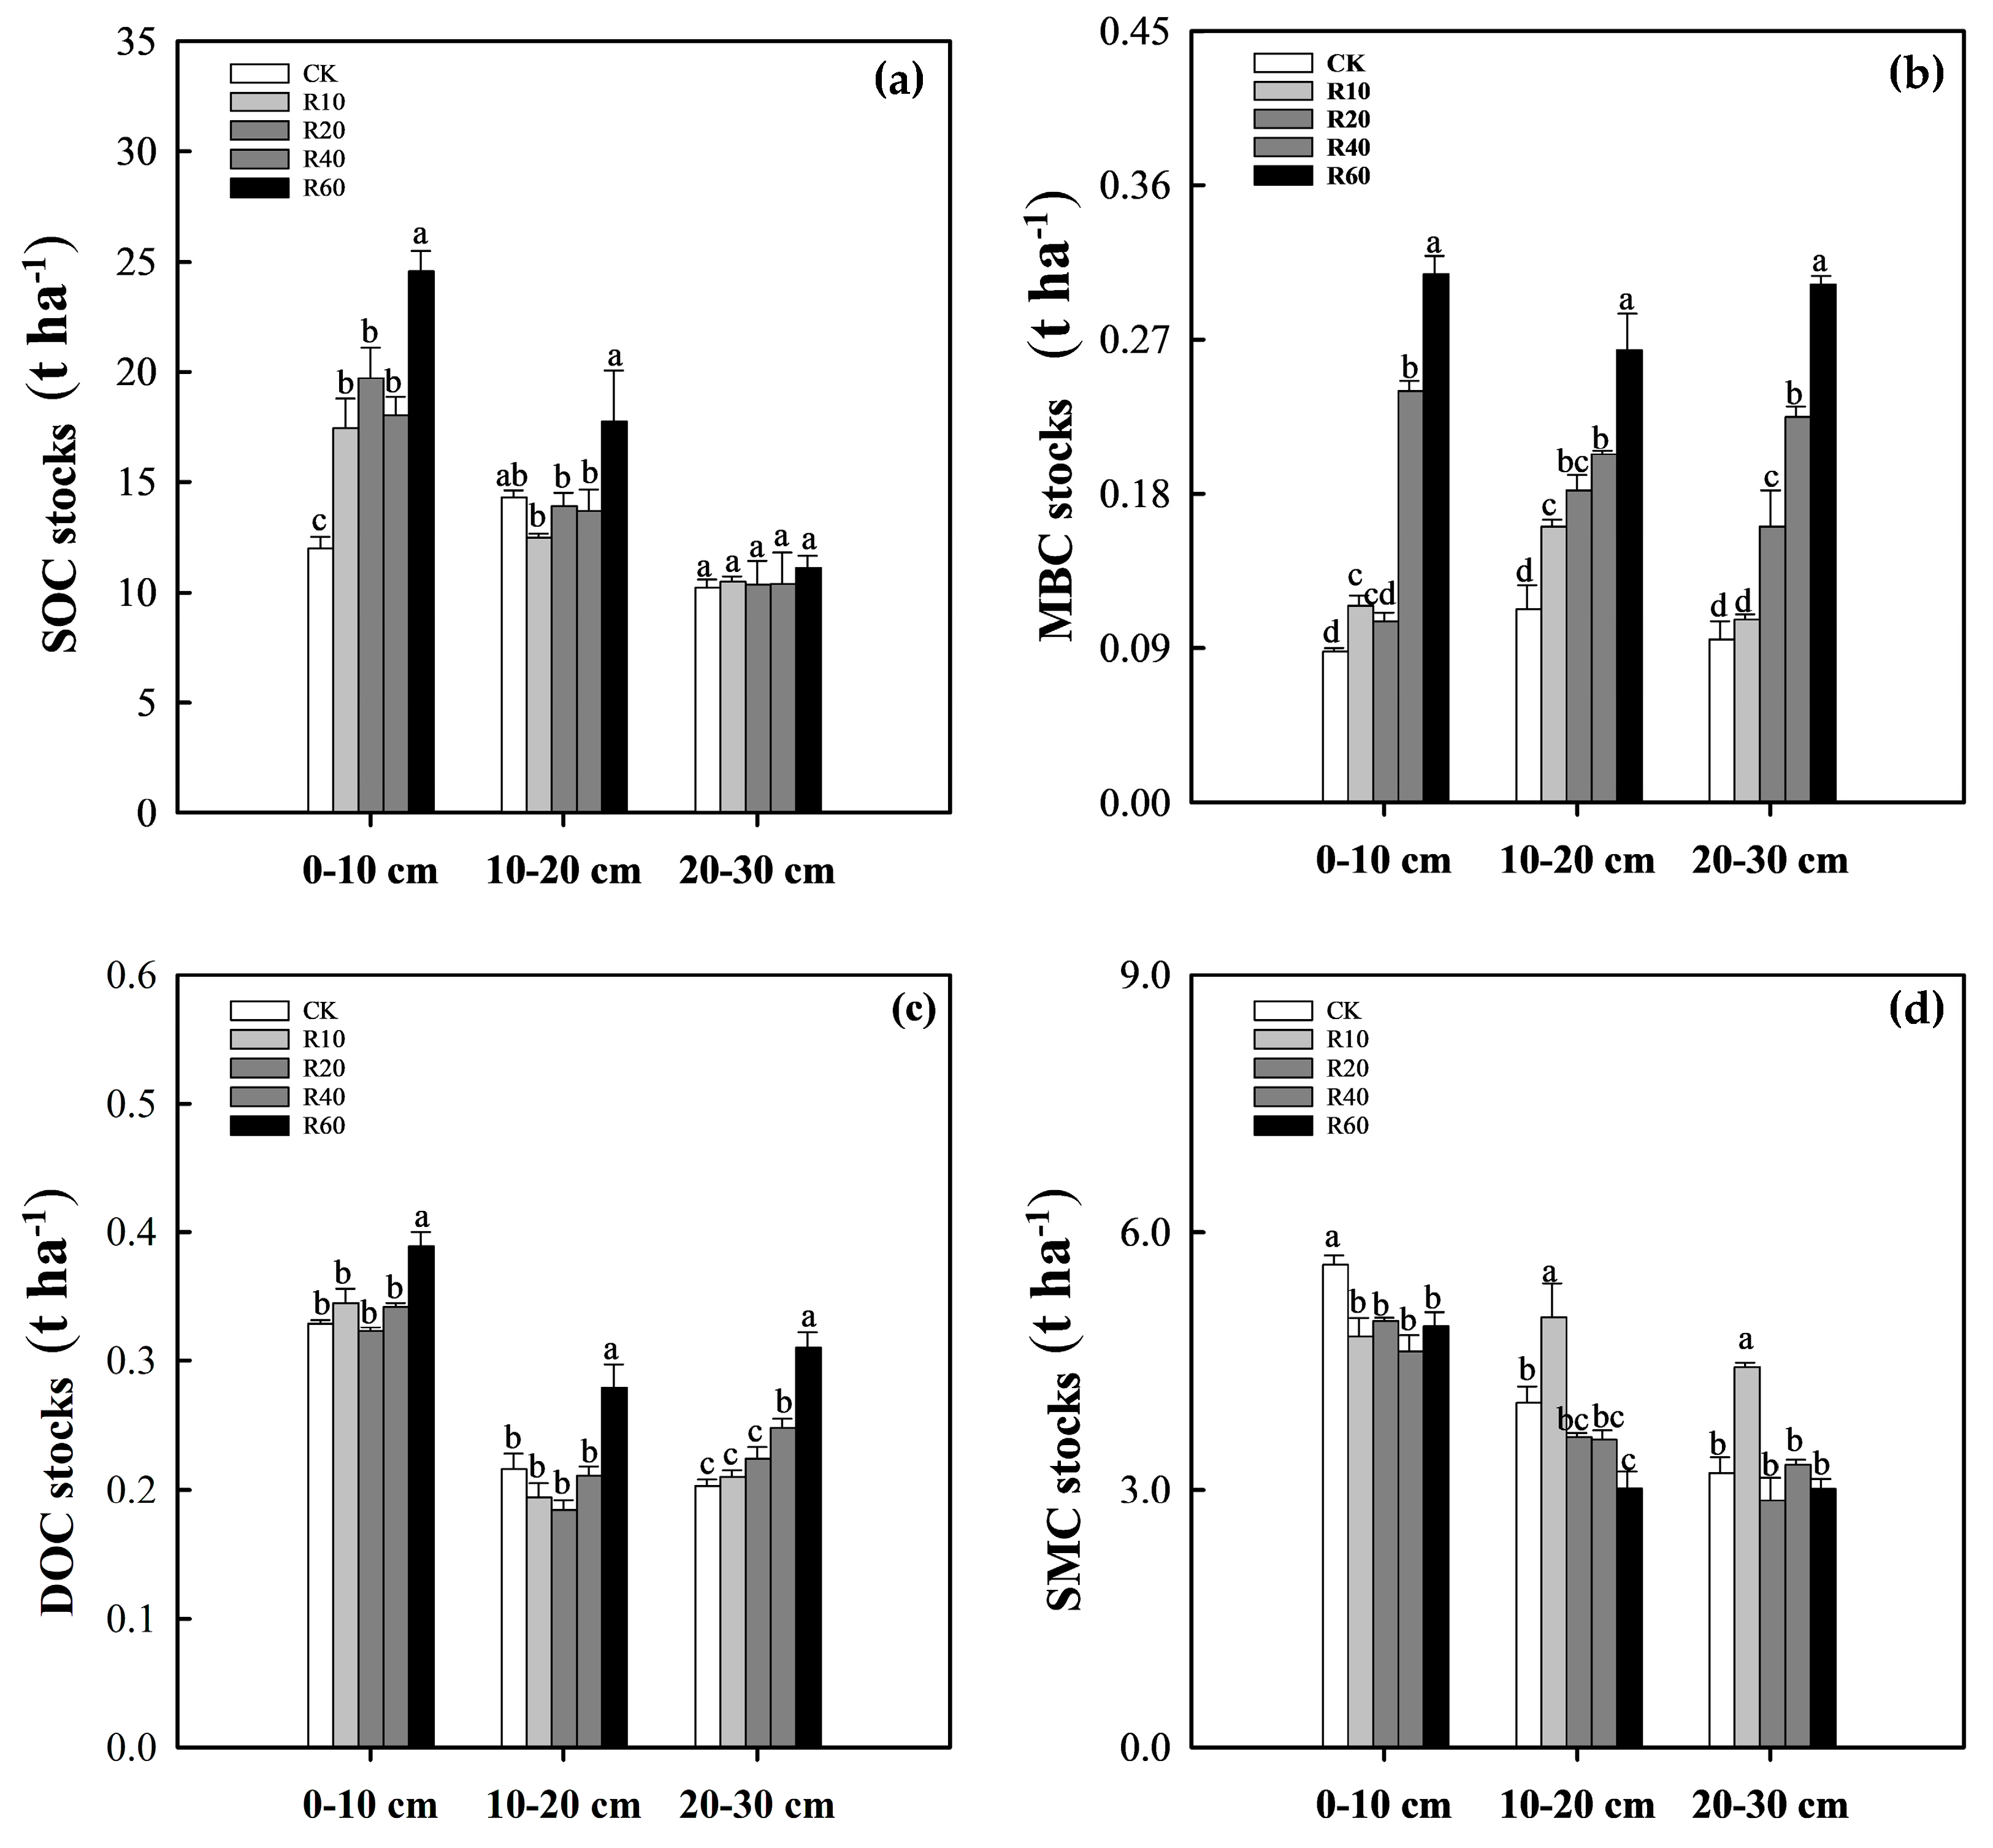
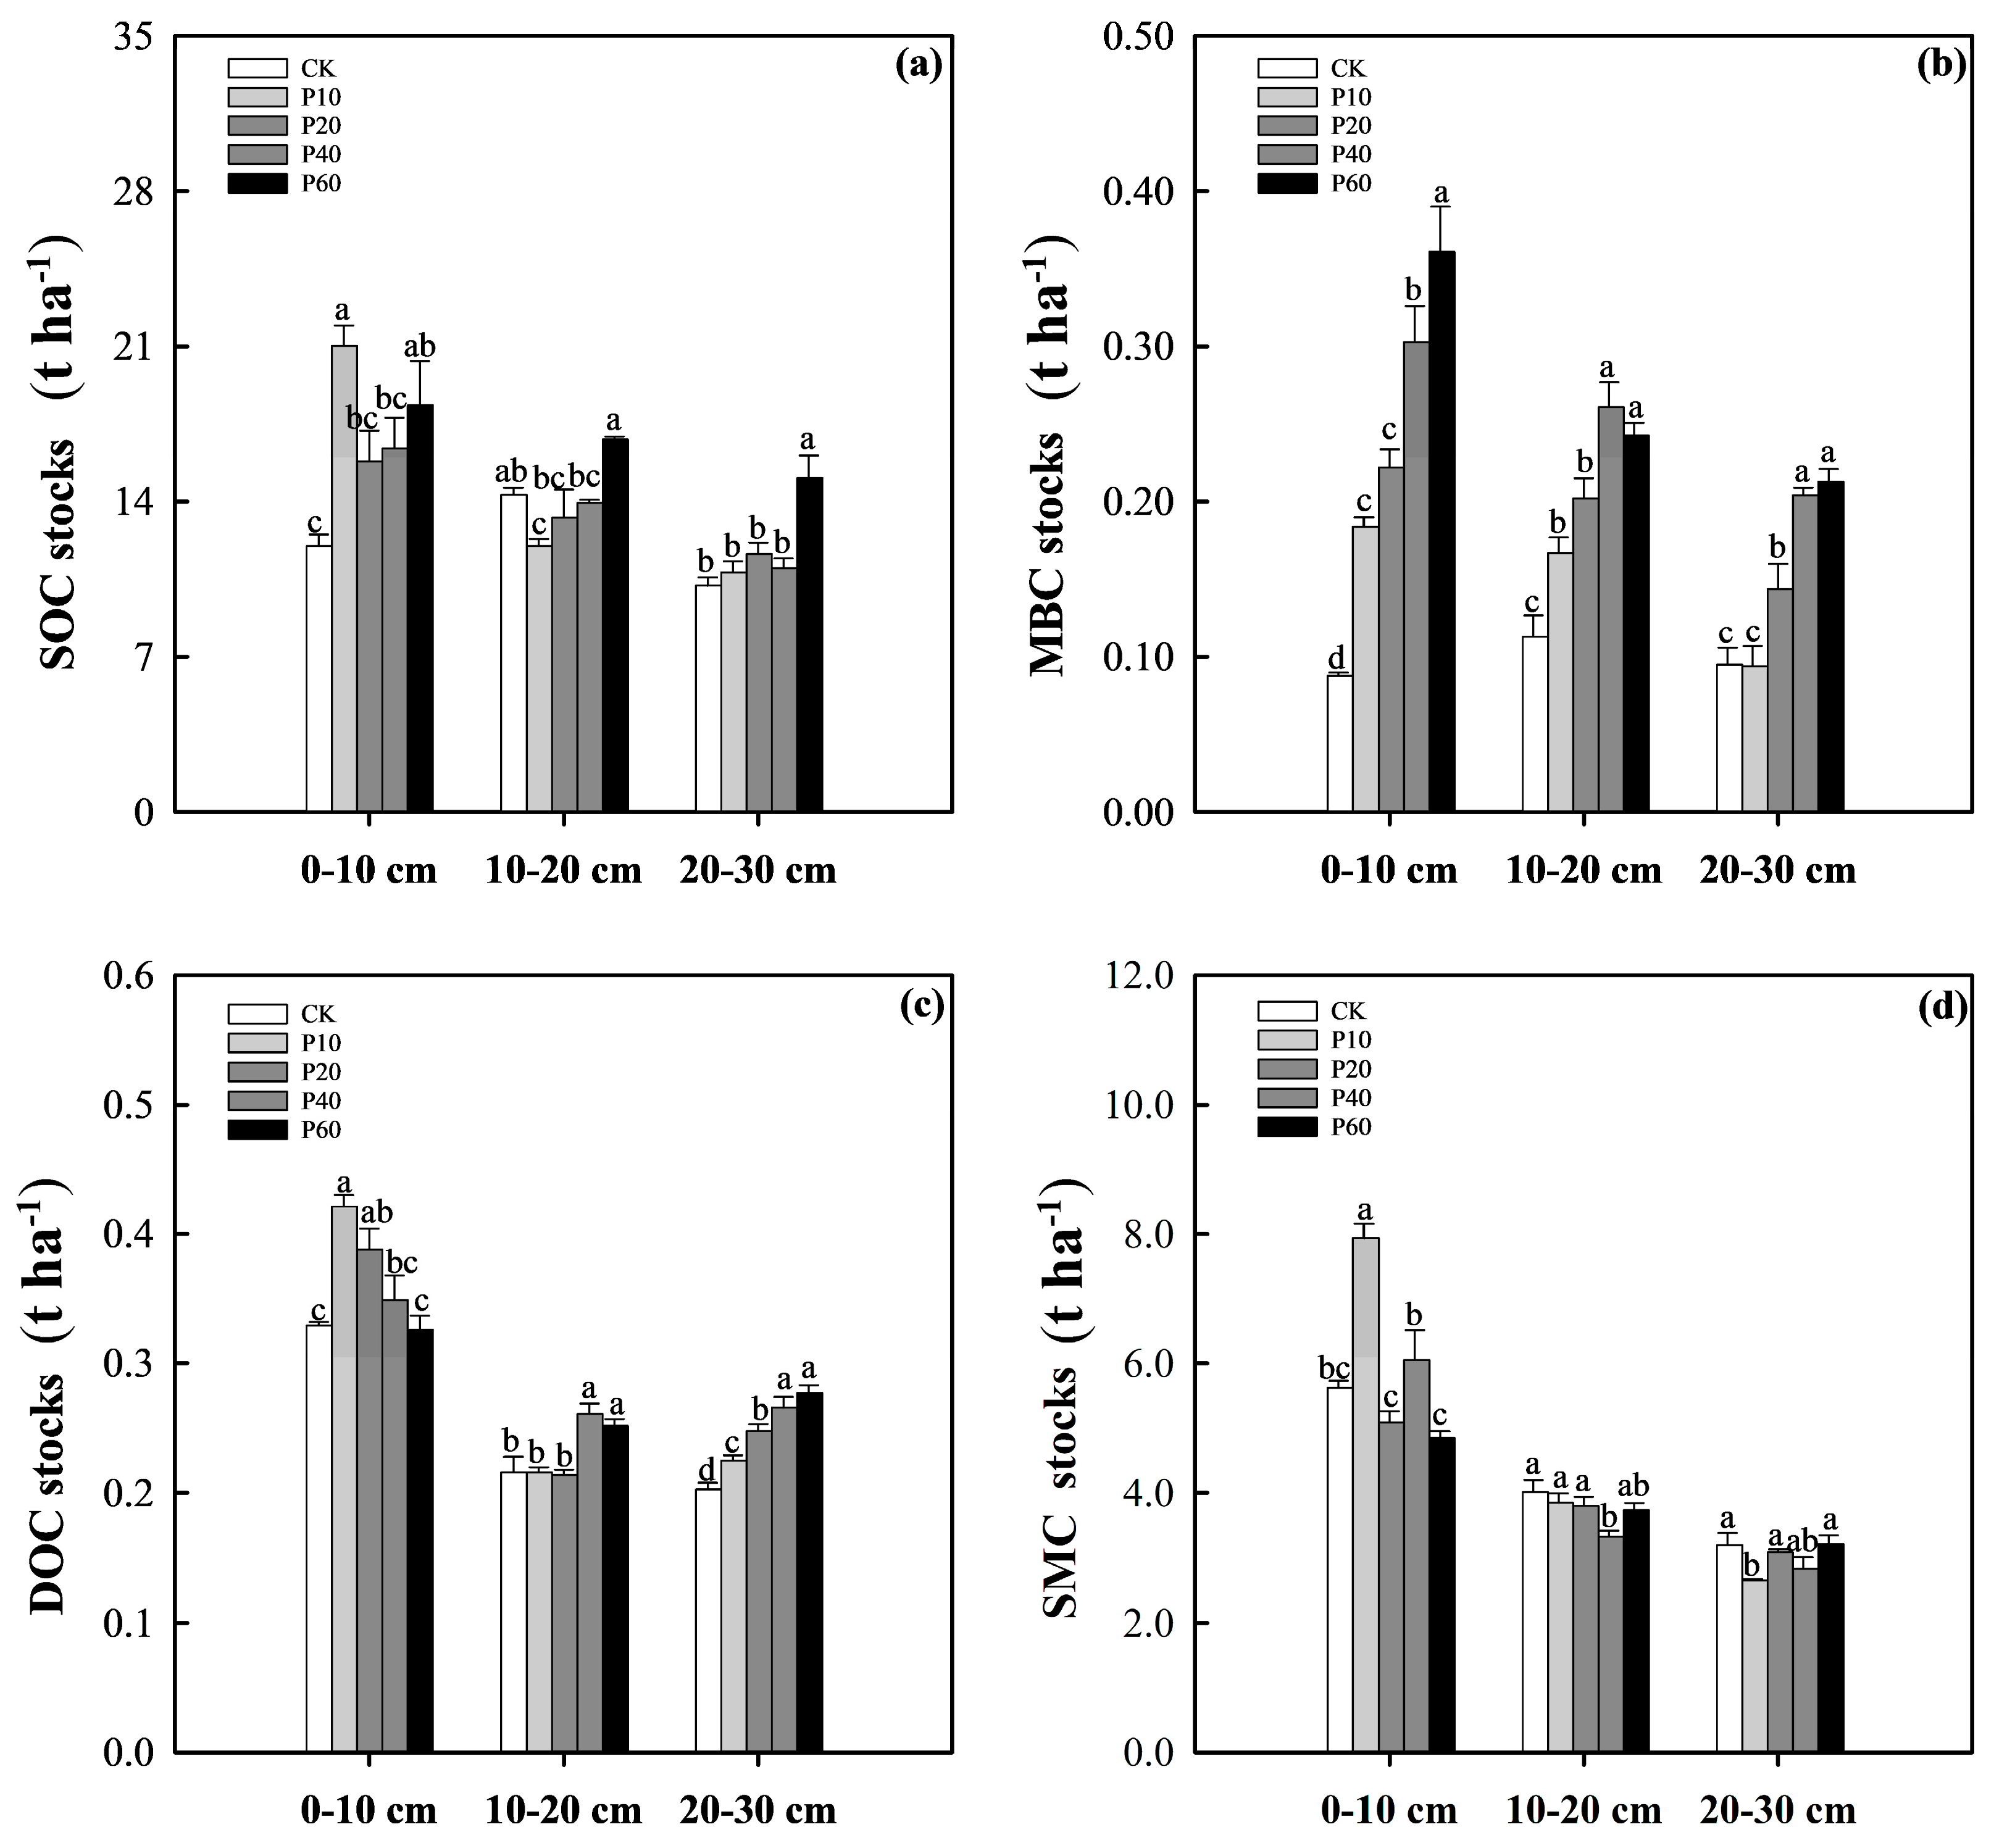
3.2. Changes in SOC and Active Fraction Stocks

The SOC stocks of the R60 treatment in the 0–10 cm, 10–20 cm, and 20–30 cm soil layers were the highest at 24.58 t ha−1, 17.77 t ha−1, and 11.13 t ha−1, respectively (Figure 3a). The soil MBC stocks increased with increasing R biochar application rates. The MBC stocks of the R60 treatment were the highest at 0.308 t ha−1, 0.264 t ha−1, and 0.302 t ha−1, respectively, which were significantly higher than the CK, with an increase of 132.91–251.21% (Figure 3b). The soil DOC stocks of the R60 treatment in the 0–10 cm and 10–20 cm soil layers were the highest and were significantly higher than those of the CK, R10, R20, and R40 treatments, with an increase of 14.83–54.30% compared with the other treatments (Figure 3c). In the 0–10 cm soil layer, the SMC stocks of the CK treatment were significantly higher than those of the R10, R20, R40, and R60 treatments. In the 10–20 cm and 20–30 cm soil layers, the R10 treatment had the highest SMC stocks, with 5.01 t ha−1 and 4.42 t ha−1, respectively (Figure 3d).
The application of P biochar significantly increased SOC stocks in the 0–10 cm layer, and the P10 treatment had the highest SOC stocks, with 21.03 t ha−1. In the 10–20 cm and 20–30 cm soil layers, the P60 treatment had the highest SOC stocks, which were 16.83 t ha−1 and 15.07 t ha−1, respectively (Figure 4a). The application of P biochar increased MBC stocks in the 0–10 cm, 10–20 cm, and 20–30 cm soil layers, and MBC stocks increased with increasing biochar application rates. The MBC stocks of the P40 and P60 treatments were the highest, with 0.303 t ha−1 and 0.361 t ha−1 (0–10 cm), 0.261 t ha−1 and 0.243 t ha−1 (10–20 cm), and 0.204 t ha−1 and 0.213 t ha−1 (20–30 cm), respectively (Figure 4b). The soil DOC stocks decreased with increasing biochar application rates in the 0–10 cm soil layer. In the 20–30 cm soil layer, the DOC stocks increased with increasing biochar application rates (Figure 4c). The SMC stocks decreased with increasing soil depths. In the 0–10 cm soil layer, the SMC stocks of the P10 treatment were the highest at 7.94 t ha−1 and were significantly higher than those of the other treatments (Figure 4d).
The application of R biochar increased the cumulative stocks of SOC and MBC, and the cumulative stocks of MBC increased significantly with increasing biochar application rates. The cumulative SMC stocks in the R10 treatment were the highest and were significantly higher than those in the CK, with an increase of 10.90%. The cumulative SMC stocks in the R20, R40, and R60 treatments were significantly lower than those in the CK (Figure 5a). The application of P biochar significantly increased the cumulative stocks of SOC, MBC, and DOC, and the cumulative stocks of SOC and MBC in the P60 treatment were the highest, at 50.26 t ha−1 and 0.82 t ha−1, respectively. The cumulative stocks of soil DOC were not significantly different in terms of the amount of biochar applied, but they increased by 14.24–17.03% compared with the CK. The cumulative stocks of SMC in the P10-treated soil were the highest at 14.43 t ha−1 and were significantly higher than those in the other treatments (Figure 5b).

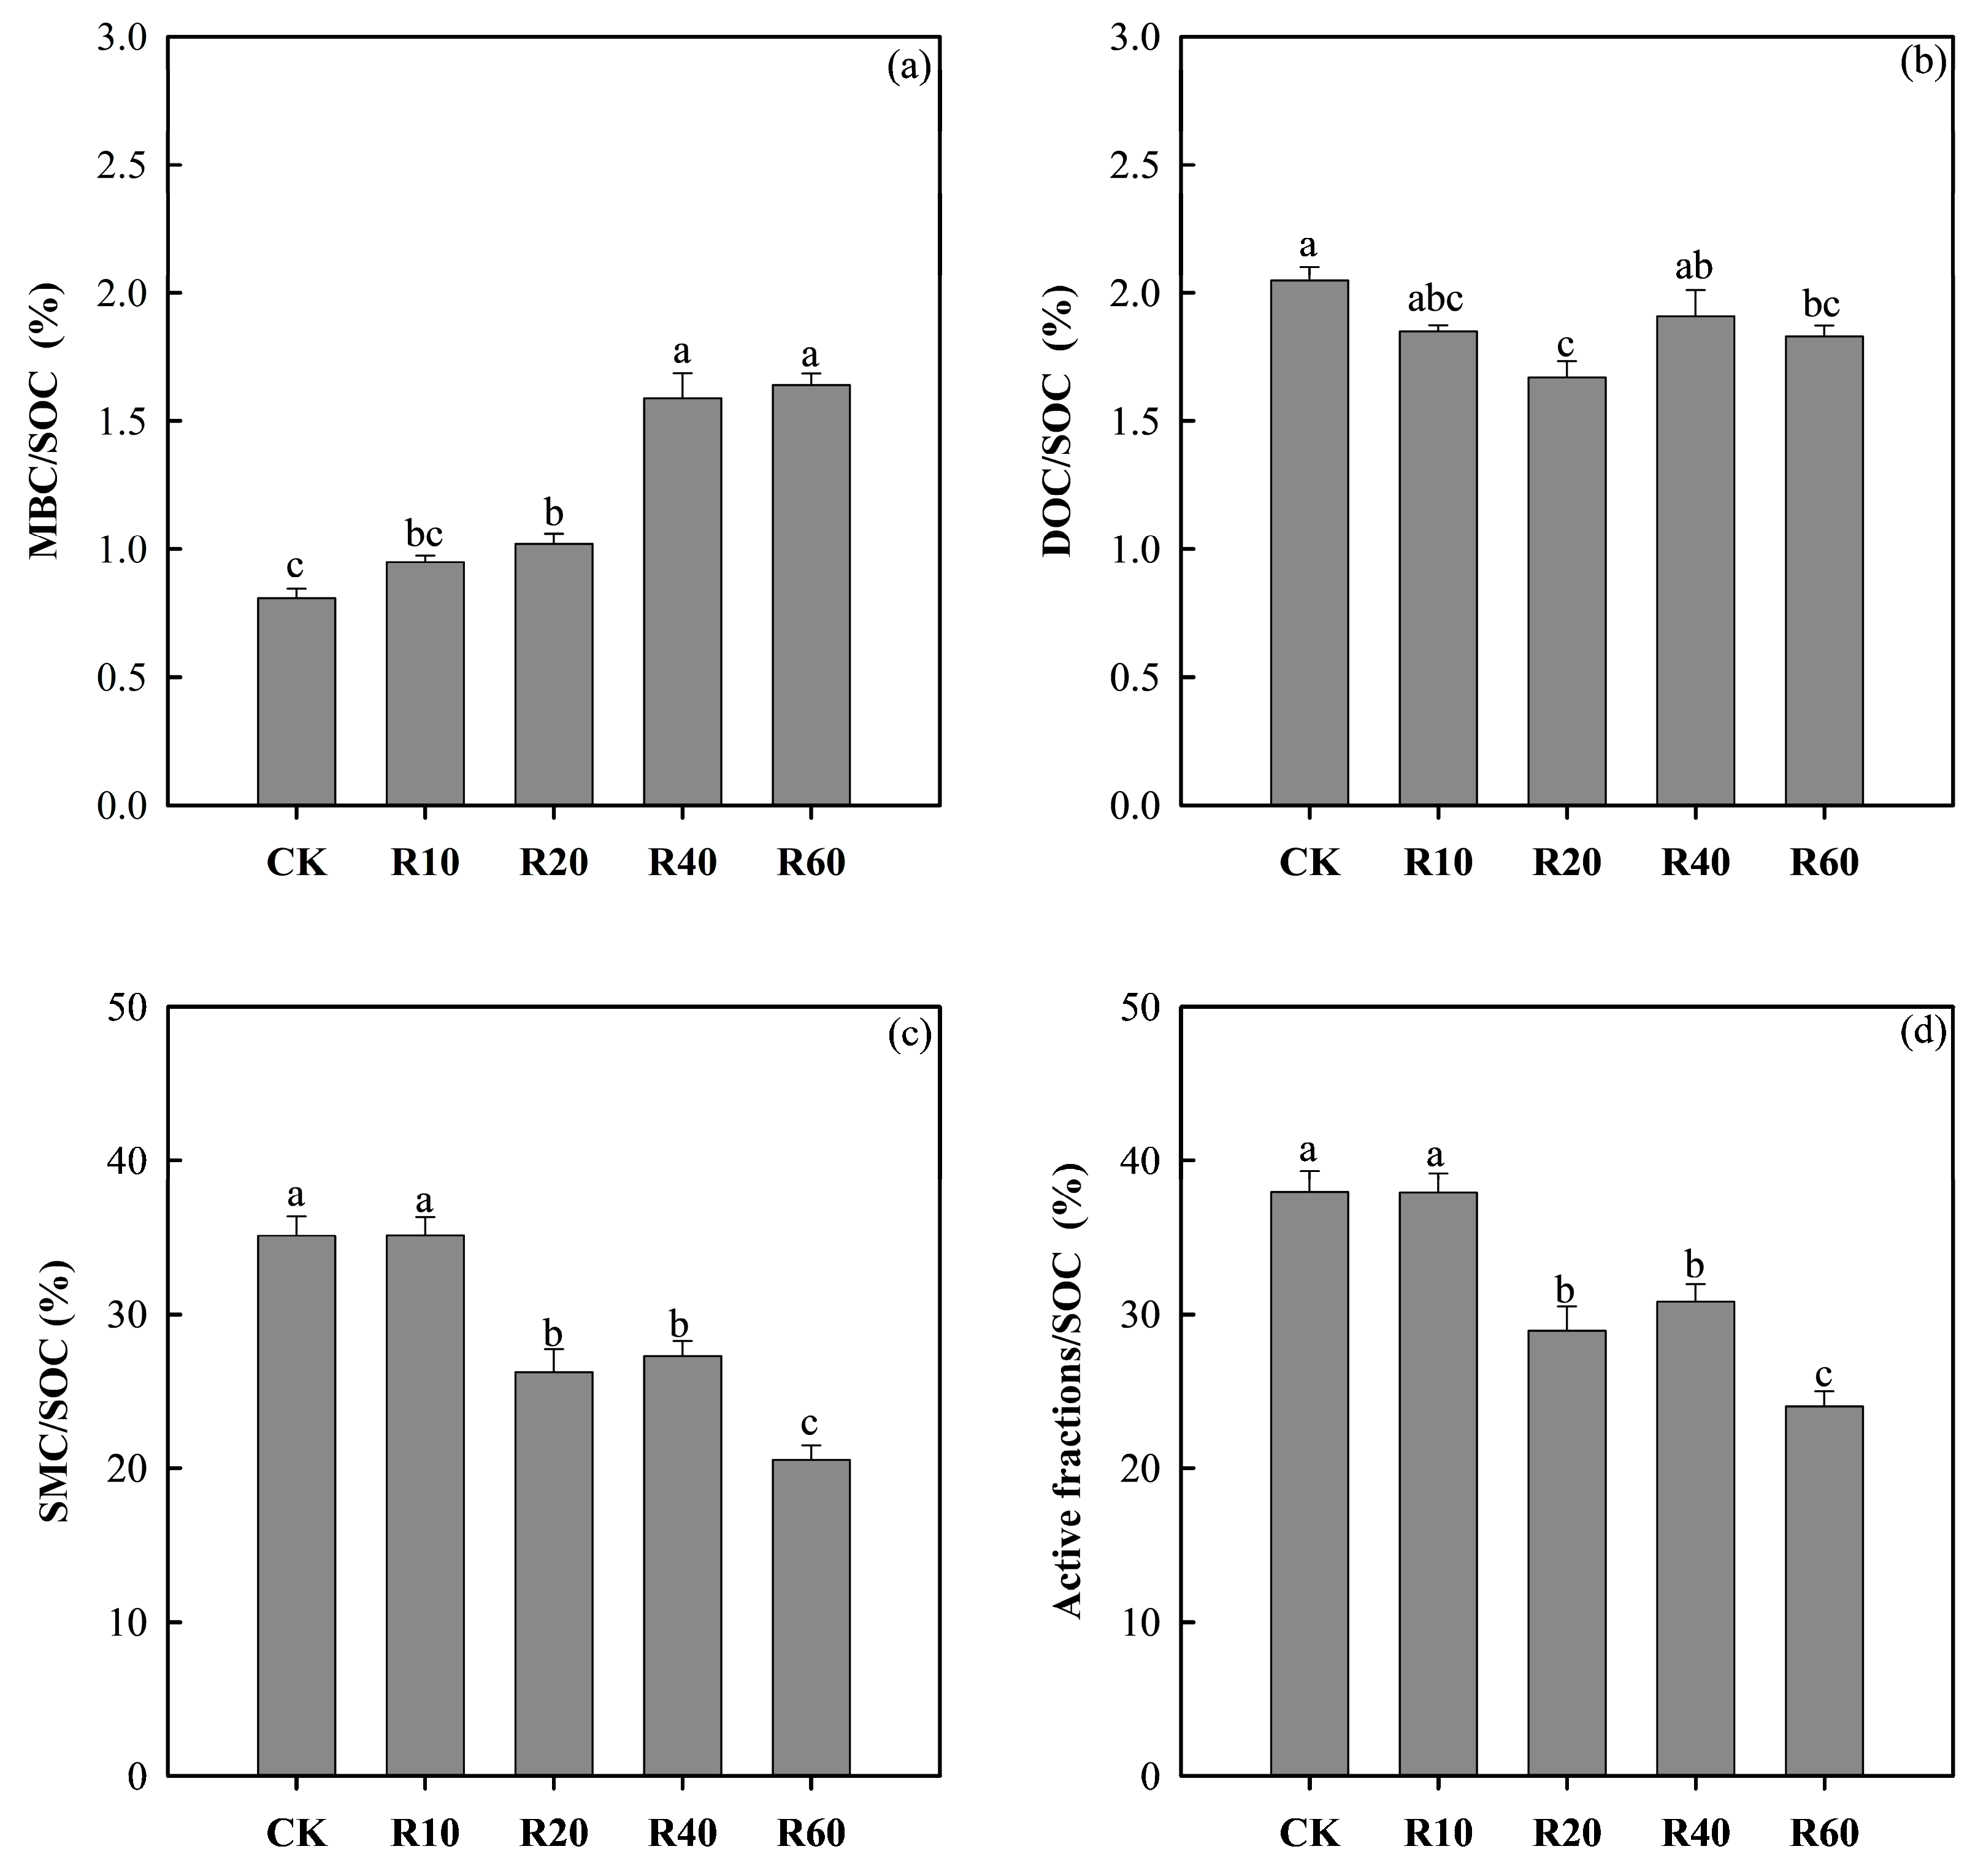
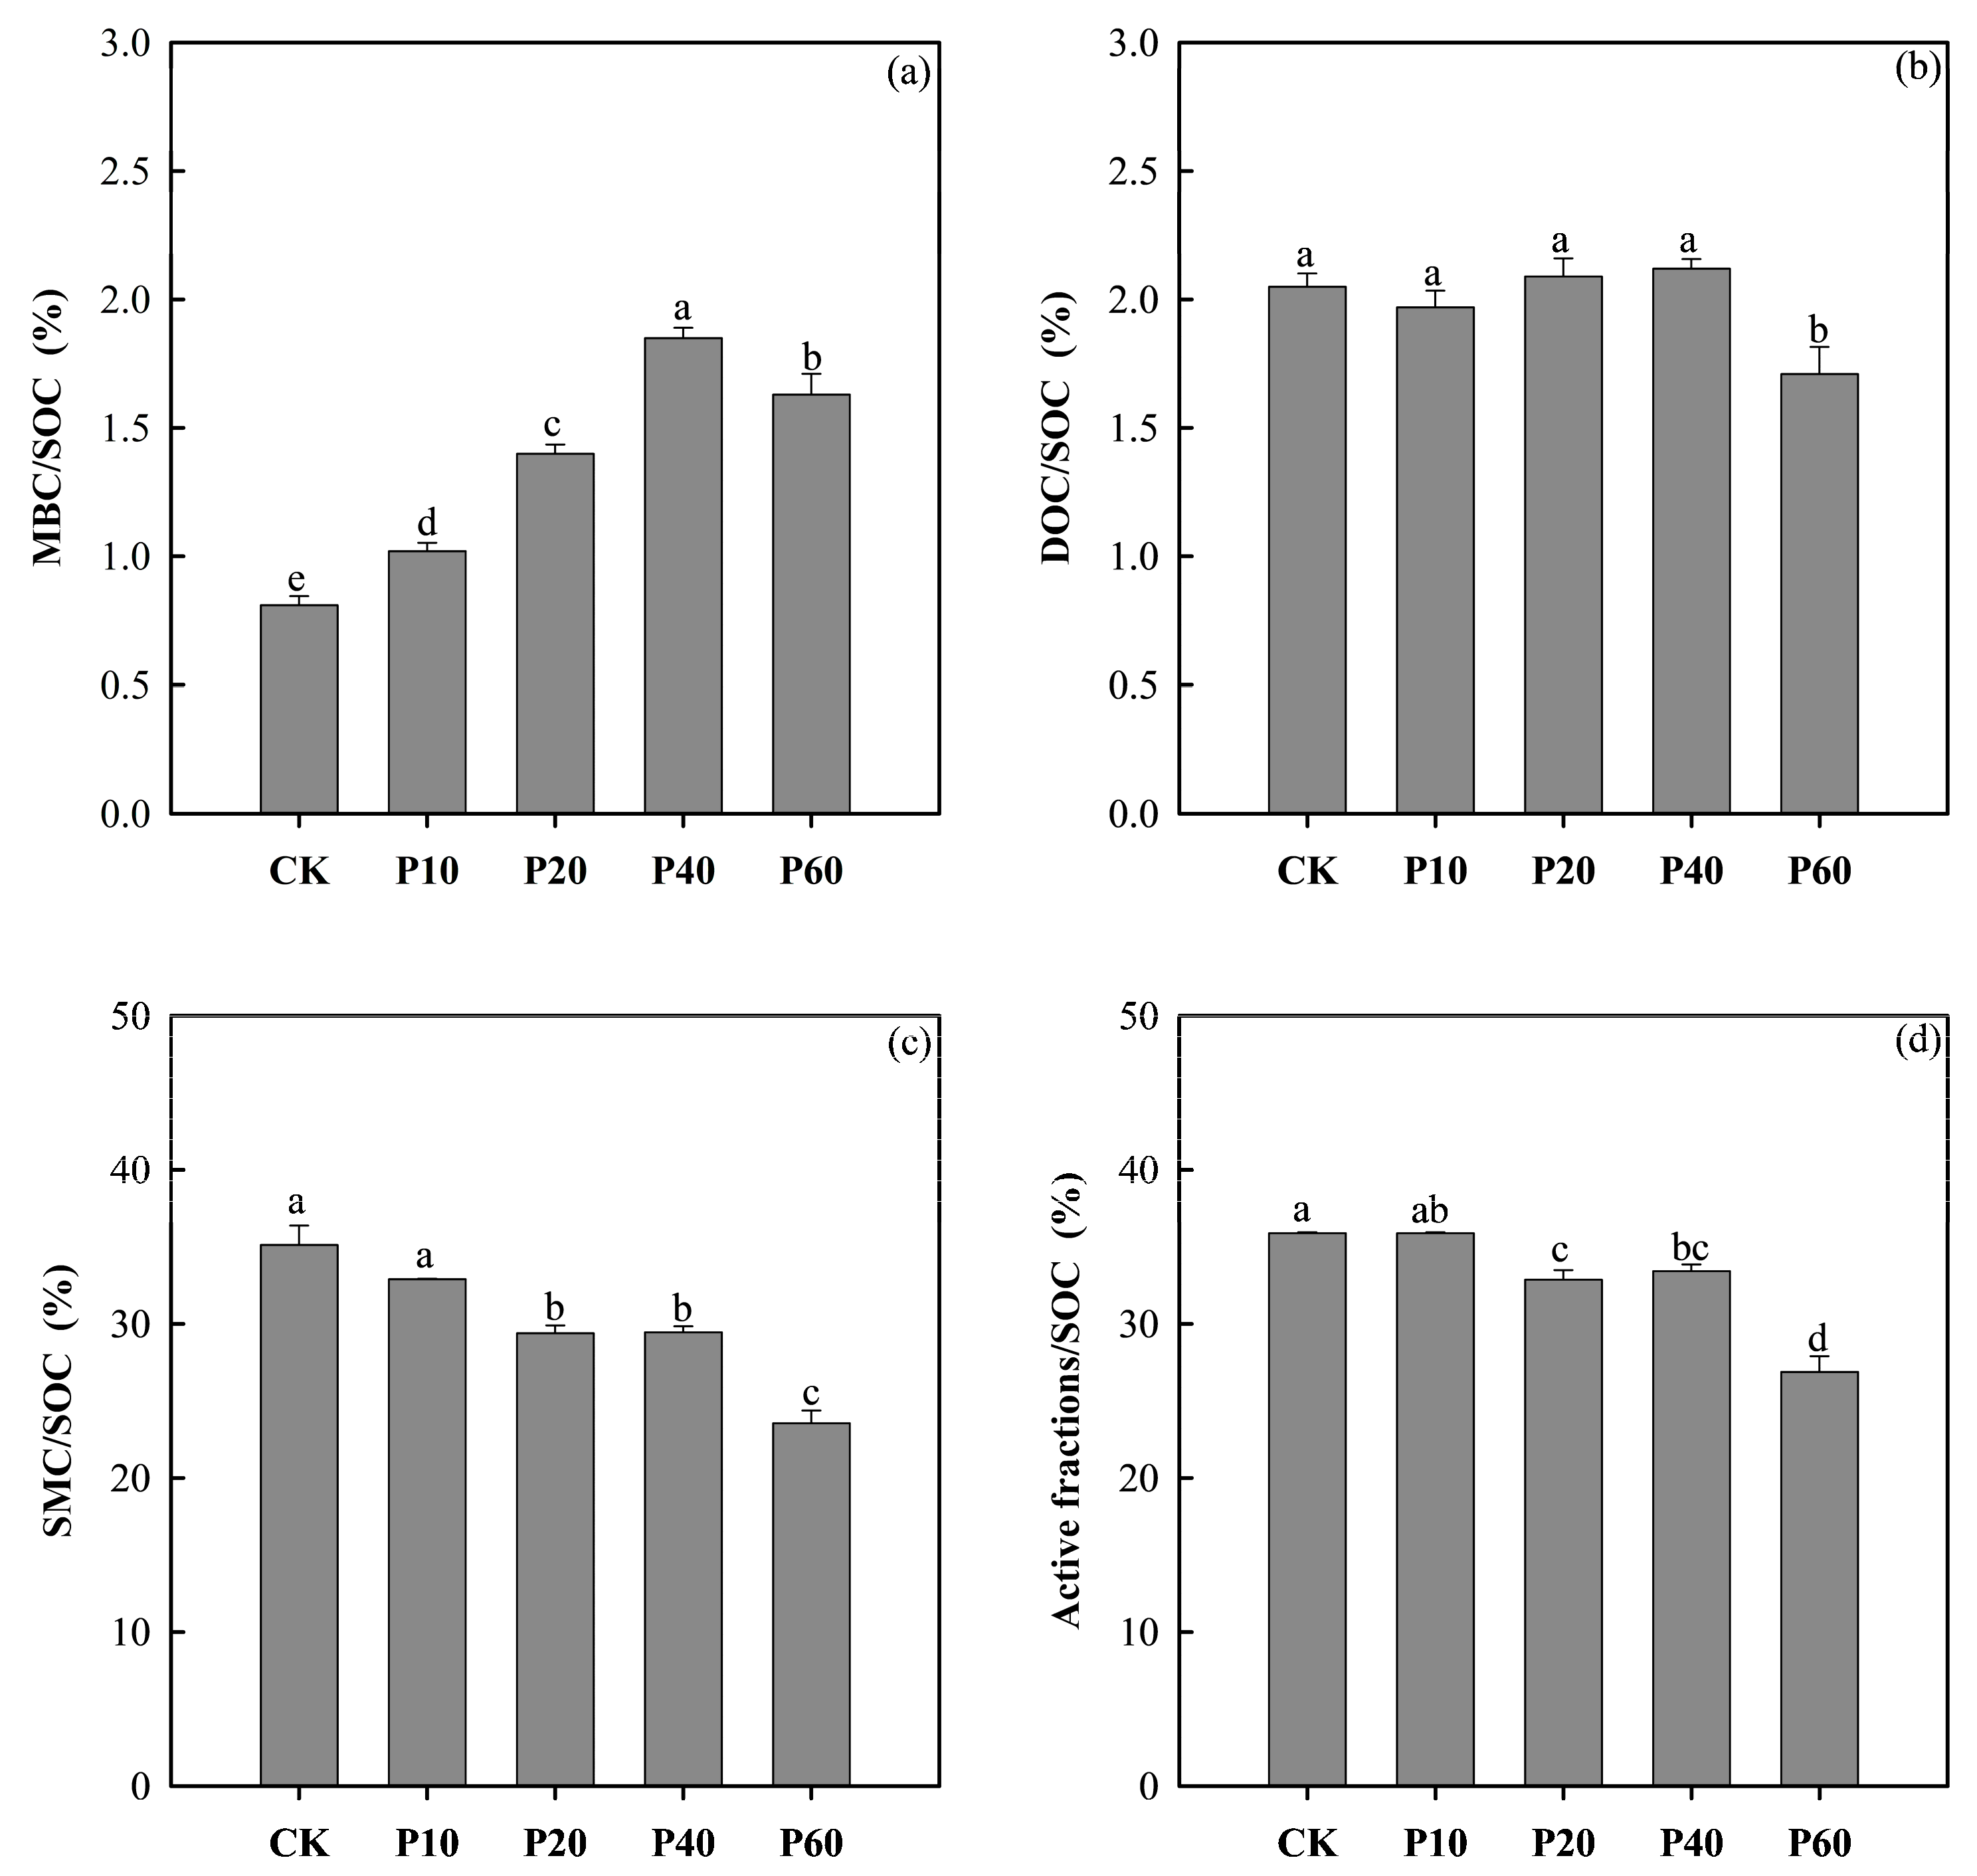
3.3. Changes in SOC Stability

The application of R biochar significantly increased the proportions of MBC:SOC, and the R40 and R60 treatments had significantly higher proportions than the CK, R10, and R20 treatments (Figure 6a). The SMC had the highest proportions, and the MBC accounted for the lowest proportions among the three active carbon fractions, with 20.53–35.15% and 0.81–1.64% of the SOC, respectively (Figure 6a,c). The proportions of active carbon fractions accounting for the SOC decreased with increasing R biochar application rates, and the proportions of active carbon fractions in the R20, R40, and R60 treatments were significantly lower than those in the CK and R10 treatments (Figure 6d).
The application of P biochar significantly increased the proportions of MBC:SOC, and the R40 treatment had the highest proportions, which were significantly higher than those of the CK, with an increase of 82.21% (Figure 7a). The proportion of DOC:SOC for the R60 treatment was the lowest at 1.71% (Figure 7b). The SMC:SOC proportions showed a downward trend with increasing P biochar application rates, and the R60 treatment was the lowest at 23.54% (Figure 7c). The proportion of active carbon fractions accounting for SOC decreased with increasing P biochar application rates (Figure 7d).

3.4. Change in Physicochemical Properties and Enzyme Activities of Soil with Biochar Addition

According to Table 3, the application of biochar changed the soil pH value, but there was no significant difference among the treatments. Biochar can reduce the soil bulk density, with the R20 and P60 treatments having the lowest soil bulk densities of 1.75 g cm−3 and 1.75 g cm−3, respectively. The soil moisture content, total nitrogen, total phosphorus, available phosphorus, and available potassium were the highest under the R60 treatment, with values of 11.46%, 0.77 g kg−1, 0.35 g kg−1, 152.90 mg kg−1, and 137.14 mg kg−1, respectively. Compared with the CK, it increased by 28.33%, 35.09%, 16.67%, 19.29%, and 122.56%, respectively. The soil moisture content, total nitrogen, and available phosphorus contents were the highest under the P60 treatment, with values of 11.67%, 0.81 g kg−1, and 137.74 mg kg−1, respectively. Biochar increased the soil enzyme activity (Suc, Ure, A Pho, Cat) and showed an increasing trend with the increase in biochar application rates. The Suc and Cat enzyme activities were the highest in the R10 treatment, with 120.32 μg g−1 h−1 and 0.45 mL g−1 0.5 h−1, respectively, and were significantly higher than other treatments. The Ure and A Pho activities were the highest in the R20 treatment, with values of 6.19 μg g−1 h−1 and 0.36 mg g−1 10 h−1, respectively. The soil enzyme activity was the highest in the P60 treatment, significantly higher than that of the other treatments.

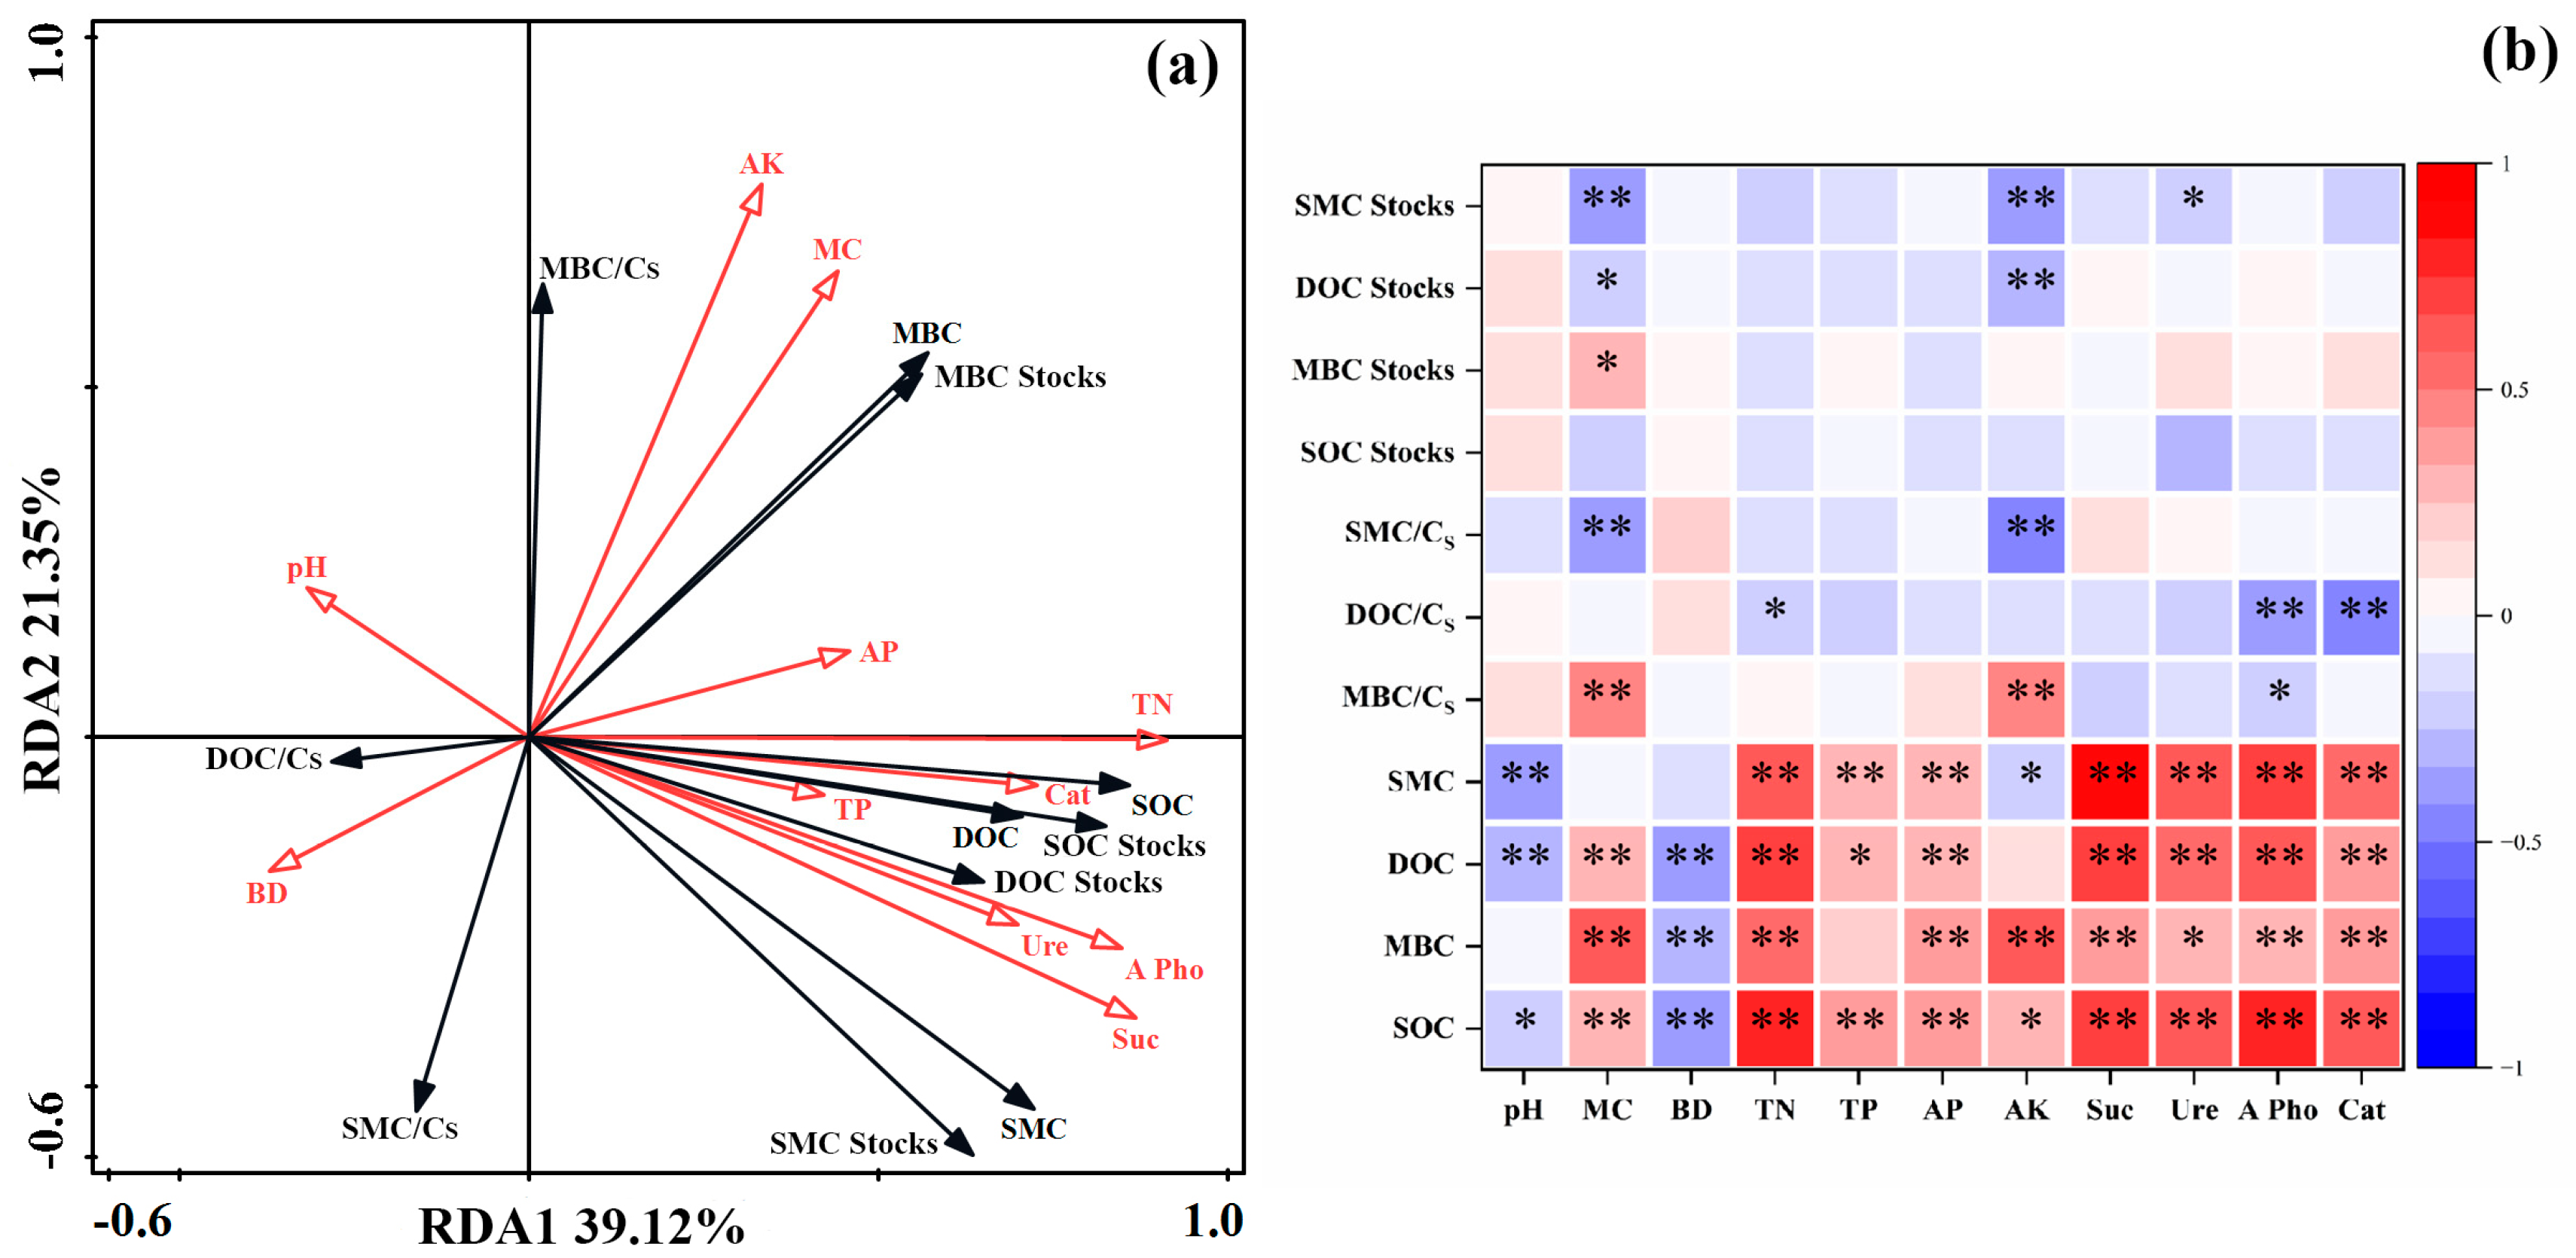
3.5. Correlations among Active Carbon Fractions, Carbon Stability, and Soil Properties

The RDA showed that the soil physicochemical properties and enzyme activities explained 60.47% of the total variation in the active carbon fractions and SOC stability characteristics (Figure 8). The contribution rate of Suc to activated carbon fractions and carbon stability was the highest, accounting for 50.7% (Table S1). The correlations among the active carbon fractions, carbon stability, soil physical and chemical properties, and enzyme activities are shown in Figure 8b. The SOC was significantly or extremely significantly correlated with the soil physicochemical properties and soil enzyme activities. The MBC was significantly negatively correlated with BD and was significantly positively correlated with MC, TN, AP, AK, and soil enzyme activities (Suc, Ure, A Pho, Cat). The DOC had a significantly positive correlation with MC, TN, TP, AP, and soil enzyme activities (Suc, Ure, A Pho, Cat). The SMC was significantly positively correlated with TN, TP, AP, and soil enzyme activities (Suc, Ure, A Pho, Cat). Soil physicochemical properties and enzyme activity had little correlation with the proportions of active fractions accounting for the SOC and the stocks of SOC, MBC, DOC, and SMC (Figure 8b).

4. Discussion

4.1. Effects of Biochar Application on SOC Contents and Stocks in Tropical Farmlands

The results of this study indicated that the biochar types and application rates had significant impacts on the contents and stocks of SOC (Figure 1, Figure 2, Figure 3 and Figure 4 and Table 2), which align with the results of some previous studies [18,22]. The application of biochar led to an increase in SOC contents and stocks, with a corresponding increase in application rates in the 0–10 cm soil profile, and the effects of the biochar application on SOC decreased with increasing soil depths. This phenomenon may be attributed to the fact that the soil used in this experiment was developed in a low-carbon environment (4.00 g kg−1), and the carbon contents of the R and P biochar were 43.42% and 39.66% (Table 1), but with little heterogeneity between the two, respectively. Additionally, the biochar is stable and able to persist in soil for extended periods [45,46]. It has the capability to sequester carbon by modifying the physical and chemical properties of soil, which ultimately leads to a reduction in carbon emissions [47,48,49,50], thus resulting in an increase in SOC.
According to Lin et al. [51], topsoil is more susceptible to agricultural practices and climatic changes than subsoil. In this study, the biochar was mixed with the soil in the 0–20 cm layer after its application, which resulted in the surface soil being more sensitive than the 20–30 cm soil profile to the biochar application; thus, the organic carbon was primarily clustered in the topsoil. However, studies have indicated that the subsoil often contains a higher proportion of stable organic carbon [52], and the soil with the lowest SOC stocks has the highest potential to sequester carbon and increase its SOC stocks [53]. Therefore, more research needs to be conducted in the future.

4.2. Effects of Biochar on the Active Fractions of SOC in Tropical Farmlands

MBC is considered an important indicator for measuring soil microbial biomass, and subtle changes in MBC affect the conversion of SOC and nutrients [54]. This study found that the MBC contents increased with increasing biochar application rates in the 0–10 cm, 10–20 cm, and 20–30 cm soil profiles. Furthermore, the MBC content under the 10 t ha−1 treatment was significantly higher than that under the control (CK). These results may be due to the following reasons: first, biochar can be absorbed and utilized by microorganisms [55], providing a sufficient carbon source for them. This guarantees material provision for microbial growth and reproduction, ultimately increasing microbial biomass [56,57]. Second, a low C:N ratio of less than 50 (Table 1), combined with the unstable carbon within biochar, can stimulate the accumulation of soil microbial biomass [58,59]. However, when a high C:N ratio was added to the soil, the MBC content was reduced [59]. Third, the biochar porosity is beneficial in retaining carbon, nitrogen, phosphorus, sulfur, and other elements, as well as improving the soil environment, which is more conducive to the reproduction and growth of microorganisms [60], and the varying sizes of these pores make them ideal shelters that can provide physical protection for soil microorganisms [61,62].
It has been confirmed that biochar contains unstable organic carbon fractions [57] and DOC [63]. The release of DOC and the selective adsorption capacity of small-molecule DOC in soil contributed to the increase in DOC [64]. Therefore, the DOC increased with increasing biochar application rates, and the DOC of the biochar treatment was significantly higher than that of the CK (p < 0.05). A positive correlation between the application amount of biochar and DOC was found by Qiu et al. [65]. This aligns with our research results. However, importantly, the composition and quantity of DOC can vary depending on the type of biochar [66]. The increase in soil pH may lead to the deprotonation of weak functional groups in DOC molecules, resulting in an increase in the concentration of DOC when it easily dissolves in water [67,68,69]. While the pH in this study only increased by 0.09–0.14 units, the impact of soil pH on DOC cannot be denied. The content and stocks of DOC in the 0–10 cm soil layer treated with biochar were generally higher than those in the 10–20 cm and 20–30 cm layers (Figure 1c, Figure 2c, Figure 3c and Figure 4c). Previous studies have demonstrated that the stocks of DOC in soil are primarily concentrated in the 0–10 cm layer, with the highest stocks observed in tropical regions [70].
Activated carbon in soil is vulnerable to microbial attack and is the main factor leading to soil carbon mineralization [30]. As the addition of carbon-rich additives alters the balance between stable and unstable carbon storage in soils, biochar may have positive or negative effects on carbon mineralization [71]. Our findings indicate that the SMC decreased with the soil depth and that the impact of the biochar type and application amount varied across different soil layers (Figure S2). Compared to deep soil, the stability of SOC in surface soil is relatively lower [72,73], while the biological activity in surface soil is higher [74]. Therefore, mineralization is more likely to occur in surface soil and lead to an increase in mineralization accumulation [75].
In this study, the highest cumulative stocks of SMC were observed in the R10 and P10 treatments. However, when the application amount of biochar exceeded 20 t ha−1, the SMC cumulative stocks decreased (Figure 5a,b). The reduction in cumulative SMC stocks caused by biochar treatment may be caused by many reasons. First, SOC can trigger the decomposition of biochar in the initial stage, and biochar may be responsible for delaying the decomposition of SOC in the later stage [75]. Second, DOC, nutrients, and microorganisms are adsorbed onto biochar, leading to an enhanced carbon utilization efficiency and a reduction in the activity of enzymes responsible for carbon mineralization [76]. Additionally, CO2-C can be adsorbed on the surface of biochar as carbonate [60,77]. It was observed that the CO2 flux decreased with increasing biochar application rates [59]. Importantly, biochar may cause short-term SMC release and still has the potential for long-term carbon sequestration [78]. Biochar can reduce the mineralization rate of SOC by promoting the formation of organic mineral complexes [28,79] and adsorbing unstable SOC [80]. The O:C and H:C values of biochar indicate the level of polarization and aromatization, which can serve as indicators of the biochar’s stability [81,82,83]. A recent study demonstrated that as the pyrolysis temperature increased, the O:C and H:C ratios of biomass decreased. And these ratios showed significant negative correlations with FC (fixed carbon) [84]. Our study found that rice hull biochar (R), with lower O:C and H:C ratios (Table 1), had a greater impact on reducing SMC:SOC after its application, especially in treatments with application rates exceeding 20 t ha−1 (Figure 6 and Figure 7). It suggested that rice hull biochar may have a higher carbon sequestration potential.

4.3. Effect of Biochar on SOC Stability in Tropical Farmlands

The stability of soil organic matter (carbon) is influenced by various factors, including soil physical and chemical properties, soil microbial activity, and environmental conditions [85]. For poor tropical farmland soils, biochar has great potential to improve the stability of SOC. In this study, the proportions of active fractions to SOC decreased significantly when biochar applications exceeded 20 t ha−1 (Figure 6d and Figure 7d), improving SOC stability. However, among the proportions of active fractions to SOC, SMC accounted for the highest proportion, followed by DOC and MBC.
The increase in SMC in tropical farmland soil treated with biochar was found to be lower than 10 t ha−1. This can be attributed to the fact that the treatment leads to an increase in microbial habitats and available carbon in soils that initially had a low organic matter content. Additionally, the adaptability of soil bacteria to nutrient restriction is better in soils with insufficient organic matter than in soils with sufficient organic matter [86]. According to Lehmann and Kleber [87], the decomposition of SOC is influenced by the accessibility of microorganisms and enzymes to carbon. Based on the RDA results and Pearson correlations, the application of biochar to tropical farmland soil resulted in significantly positive correlations between soil enzyme activity and soil physicochemical properties with the active carbon fractions (Figure 8); among them, the contribution rate ranking was Suc > AK > MC >A pho > Cat (Table S1). These findings suggest that soil enzyme activity and physicochemical properties have a significant impact on soil active carbon fractions. The ratio of DOC to SOC can be used as an indicator of SOC stability [88]. The application of biochar in tropical soil directly reduces the leaching of DOC, thereby reducing C leaching and enhancing the stability of SOC [89]. The results of this study demonstrated that the ratio of DOC to SOC in both types of biochar decreased as the application rate increased (Figure 6b and Figure 7b), which is consistent with the findings of Zhang et al. [88]. Biochar treatment leads to an increase in the MBC:SOC ratio, which increases with increasing application rates, and a higher MBC:SOC ratio indicates a better stability of SOC in agricultural systems [90].

5. Conclusions

The application of biochar can effectively increase the stocks of SOC in farmlands located in tropical areas, leading to long-term soil carbon sequestration. The effects of biochar application rates on MBC and DOC showed a positive correlation. Both R biochar and P biochar exhibited similar effects. The application of 10 t ha−1 biochar increases the cumulative stocks of SMC. However, applying more than 20 t ha−1 biochar reduces the cumulative stocks of SMC. The MBC:SOC ratio increased as the biochar rates increased, whereas the SMC:SOC ratio and active fraction:SOC ratio showed the opposite trend. This suggests that a low rate of biochar use promotes carbon emissions, while a high rate of biochar use inhibits carbon emissions and increases soil stability. Furthermore, the rice hull biochar demonstrated a greater potential for soil C sequestration compared to the peanut shell biochar. Further observations of the specific mechanism should be undertaken and the long-term effects in the tropics should be determined.

Supplementary Materials

The following supporting information can be downloaded at: https://www.mdpi.com/article/10.3390/agronomy14040676/s1, Figure S1: The monthly mean temperature and monthly precipitation in the experimental site across the two years after the biochar application (from October 2019 to October 2021); Figure S2: The dynamics of cumulative CO2-C mineralization in dry red soil under different biochar applications. R10, R20, R40, and R60 indicate that the biomass applied to rice hull is 10 t ha−1, 20 t ha−1, 40 t ha−1, and 60 t ha−1, respectively. P10, P20, P40, and P60 indicate that the biomass of peanut shell is 10 t ha−1, 20 t ha−1, 40 t ha−1, and 60 t ha−1, respectively. CK: no biochar. Table S1: Contribution rate of soil physicochemical indicators and enzyme activity to active carbon fractions and carbon stability.

Author Contributions

Conceptualization, D.L. and J.Q.; methodology, S.L. and X.J.; software, H.L.; investigation, C.L. (Chen Li); data curation, C.L. (Changjiang Li); writing—original draft preparation, M.C.; writing—review and editing, X.S. and C.L. (Changzhen Li); funding acquisition, C.L. (Changzhen Li). All authors have read and agreed to the published version of the manuscript.

Funding

This work was financially supported by the Natural Science Foundation of Hainan Province (Grant No. 322RC566) and the National Natural Science Foundation of China (Grant No. 32160307).

Institutional Review Board Statement

Since this article is a study of plants and does not involve animals or humans, it did not require ethical review or approval.

Informed Consent Statement

Not applicable.

Data Availability Statement

Upon request, the authors will make all data used in this study available.

Conflicts of Interest

The authors declare no conflicts of interest.

Abbreviations

SOC: soil organic carbon; MBC: microbial biomass carbon; DOC: dissolved organic carbon; SMC: soil mineralizable carbon; R biochar: rice hull biochar; P biochar: peanut shell biochar; CK: control (no biochar); ANOVA: analysis of variance; RDA: redundancy analysis.

References

  1. World Population Review. 2021. Available online: https://worldpopulationreview.com/country-rankings/tropical-countries (accessed on 12 December 2021).
  2. Anda, M.; Shamshuddin, J.; Ishak, C. Improving chemical properties of a highly weathered soil using finely ground basalt rocks. Catena 2015, 124, 147–161. [Google Scholar] [CrossRef]
  3. Bruun, T.B.; Elberling, B.; de Neergaard, A.; Magid, J. Organic Carbon Dynamics in Different Soil Types After Conversion of Forest to Agriculture. Land Degrad. Dev. 2015, 26, 272–283. [Google Scholar] [CrossRef]
  4. Li, T.; Hong, X.; Liu, S.; Wu, X.; Fu, S.; Liang, Y.; Li, J.; Li, R.; Zhang, C.; Song, X.; et al. Cropland degradation and nutrient overload on Hainan Island: A review and synthesis. Environ. Pollut. 2022, 313, 120100. [Google Scholar] [CrossRef] [PubMed]
  5. Nyssen, J.; Frankl, A.; Zenebe, A.; Poesen, J.; Deckers, J. Environmental Conservation for Food Production and Sustainable Livelihood in Tropical Africa. Land Degrad. Dev. 2015, 26, 629–631. [Google Scholar] [CrossRef]
  6. Brassard, P.; Godbout, S.; Raghavan, V. Soil biochar amendment as a climate change mitigation tool: Key parameters and mechanisms involved. J. Environ. Manag. 2016, 181, 484–497. [Google Scholar] [CrossRef]
  7. Hussain, M.; Farooq, M.; Nawaz, A.; Al-Sadi, A.M.; Solaiman, Z.M.; Alghamdi, S.S.; Ammara, U.; Ok, Y.S.; Siddique, K.H.M. Biochar for crop production: Potential benefits and risks. Eur. J. Soil Sci. 2017, 49, 685–716. [Google Scholar] [CrossRef]
  8. IBI, Standardized Product Definition and Product Testing Guidelines for Biochar That Is Used in Soil. 2012. Available online: https://biochar-international.org/ibi-biochar-standards (accessed on 15 December 2021).
  9. Grutzmacher, P.; Puga, A.; Bibar, M.; Coscione, A.; Packer, A.P.; Andrade, C. Carbon stability and mitigation of fertilizer induced N2O emissions in soil amended with biochar. Sci. Total Environ. 2018, 625, 1459. [Google Scholar] [CrossRef]
  10. Joseph, S.; Peacocke, C.; Lehmann, J.; Munroe, P. Developing a biochar classification and test methods. In Biochar for Environmental Management: Science and Technology, 1st ed.; Routledge: Abingdon-on-Thames, UK, 2009. [Google Scholar] [CrossRef]
  11. Sohi, S.; Krull, E.; Lopez-Capel, E.; Bol, R. A Review of Biochar and Its Use and Function in Soil. Adv. Agron. 2010, 105, 47–82. [Google Scholar] [CrossRef]
  12. Xia, S.; Jeyakumar, P.; Rinklebe, J.; Ok, Y.S.; Bolan, N.; Wang, H. A critical review on bioremediation technologies for Cr (VI)-contaminated soils and wastewater. Crit. Rev. Environ. Sci. Technol. 2019, 49, 1027–1078. [Google Scholar] [CrossRef]
  13. Laird, D.A. The Charcoal Vision: A Win-Win-Win Scenario for Simultaneously Producing Bioenergy, Permanently Sequestering Carbon, while Improving Soil and Water Quality. Agron. J. 2008, 100, 178–181. [Google Scholar] [CrossRef]
  14. Lehmann, J.; Gaunt, J.; Rondon, M. Bio-char Sequestration in Terrestrial Ecosystems—A Review. Mitig. Adapt. Strateg. Glob. Change 2006, 11, 403–427. [Google Scholar] [CrossRef]
  15. Marris, E. Black is the new green. Nature 2006, 442, 624–626. [Google Scholar] [CrossRef] [PubMed]
  16. Schmidt, H.P.; Andrés, A.C.; Hagemann, N.; Werner, C.; Gerten, D.; Lucht, W.; Kammann, C. Pyrogenic carbon capture and storage. GCB Bioenergy 2019, 11, 573–591. [Google Scholar] [CrossRef]
  17. Zhang, A.; Bian, R.; Pan, G.; Cui, L.; Hussain, Q.; Li, L.; Zheng, J.; Zheng, J.; Zhang, X.; Han, X.; et al. Effects of biochar amendment on soil quality, crop yield and greenhouse gas emission in a Chinese rice paddy: A field study of 2 consecutive rice growing cycles. Field Crops Res. 2012, 127, 153–160. [Google Scholar] [CrossRef]
  18. Nobile, C.; Lebrun, M.; Védère, C.; Honvault, N.; Aubertin, M.-L.; Faucon, M.-P.; Girardin, C.; Houot, S.; Kervroëdan, L.; Dulaurent, A.-M.; et al. Biochar and compost addition increases soil organic carbon content and substitutes P and K fertilizer in three French cropping systems. Agron. Sustain. Dev. 2022, 42, 119. [Google Scholar] [CrossRef]
  19. Verheijen, F.; Jeffery, S.; Prodana, M.; Bastos, A.; Abalos, D.; Van Groenigen, J.W.; Hungate, B. Biochar boosts tropical but not temperate crop yields. Environ. Res. Lett. 2017, 12, 053001. [Google Scholar] [CrossRef]
  20. Chen, M.W.; Jin, X.; Li, C.; Yuan, H.Y.; Lan, C.J.; Li, C.J.; Li, C.Z. Effects of Biochar Application on Basic Physicochemical Properties and Enzyme Activities of Dry Red Soil. Chin. J. Soil Sci. 2022, 53, 919. [Google Scholar] [CrossRef]
  21. Dong, X.; Singh, B.P.; Li, G.; Lin, Q.; Zhao, X. Biochar application constrained native soil organic carbon accumulation from wheat residue inputs in a long-term wheat-maize cropping system. Agric. Ecosyst. Environ. 2018, 252, 200–207. [Google Scholar] [CrossRef]
  22. Yin, Y.; He, X.; Gao, R.; Ma, H.; Yang, Y. Effects of Rice Straw and Its Biochar Addition on Soil Labile Carbon and Soil Organic Carbon. J. Integr. Agric. 2014, 13, 491–498. [Google Scholar] [CrossRef]
  23. Han, L.; Sun, K.; Yang, Y.; Xia, X.; Li, F.; Yang, Z.; Xing, B. Biochar’s stability and effect on the content, composition of soil organic carbon. Geoderma 2020, 364, 114184. [Google Scholar] [CrossRef]
  24. Bi, Y.; Cai, S.; Wang, Y.; Zhao, X.; Wang, S.; Xing, G.; Zhu, Z. Structural and microbial evidence for different soil carbon sequestration after four-year successive biochar application in two different paddy soils. Chemosphere 2020, 254, 126881. [Google Scholar] [CrossRef] [PubMed]
  25. Liu, S.; Kong, F.; Li, Y.; Jiang, Z.; Xi, M.; Wu, J. Mineral-ions modified biochars enhance the stability of soil aggregate and soil carbon sequestration in a coastal wetland soil. Catena 2020, 193, 104618. [Google Scholar] [CrossRef]
  26. Wu, L.; Zheng, H.; Wang, X. Effects of soil amendments on fractions and stability of soil organic matter in saline-alkaline paddy. J. Environ. Manag. 2021, 294, 112993. [Google Scholar] [CrossRef] [PubMed]
  27. Fang, Y.; Singh, B.P.; Singh, B. Temperature sensitivity of biochar and native carbon mineralisation in biochar-amended soils. Agric. Ecosyst. Environ. 2014, 191, 158–167. [Google Scholar] [CrossRef]
  28. Keith, A.; Singh, B.; Singh, B.P. Interactive Priming of Biochar and Labile Organic Matter Mineralization in a Smectite-Rich Soil. Environ. Sci. Technol. 2011, 45, 9611–9618. [Google Scholar] [CrossRef] [PubMed]
  29. Kuzyakov, Y.; Subbotina, I.; Chen, H.; Bogomolova, I.; Xu, X. Black carbon decomposition and incorporation into soil microbial biomass estimated by 14C labeling. Soil Biol. Biochem. 2009, 41, 210–219. [Google Scholar] [CrossRef]
  30. Rahman, M.A.; Kader, M.A.; Jahiruddin, M.; Islam, M.R.; Solaiman, Z.M. Carbon mineralization in subtropical alluvial arable soils amended with sugarcane bagasse and rice husk biochars. Pedosphere 2022, 32, 475. [Google Scholar] [CrossRef]
  31. Odugbenro, G.; Liu, Z.; Sun, Y. Dynamics of C and N in a clay loam soil amended with biochar and corn straw. Indian J. Agric. Sci. 2019, 53, 675–680. [Google Scholar] [CrossRef]
  32. Chen, S.; Xu, C.; Yan, J.; Zhang, X.; Zhang, X.; Wang, D. The influence of the type of crop residue on soil organic carbon fractions: An 11-year field study of rice-based cropping systems in southeast China. Agric. Ecosyst. Environ. 2016, 223, 261–269. [Google Scholar] [CrossRef]
  33. Haynes, R.J. Labile organic matter fractions as central components of the quality of agricultural soils: An overview. Adv. Agron. 2005, 85, 221–268. [Google Scholar] [CrossRef]
  34. de Brito, G.S.; Bautista, S.; López-Poma, R.; Pivello, V.R. Labile soil organic carbon loss in response to land conversion in the Brazilian woodland savanna (cerradão). Biogeochemistry 2019, 144, 31–46. [Google Scholar] [CrossRef]
  35. Melero, S.; Madejon, E.; Ruiz, J.C.; Herencia, J.F. Chemical and biochemical properties of a clay soil under dryland agriculture system as affected by organic fertilization. Eur. J. Agron. 2007, 26, 327–334. [Google Scholar] [CrossRef]
  36. Zhang, W.; Wang, X.; Lu, T.; Zhao, Y. Influences of soil properties and hydrological processes on soil carbon dynamics in the cropland of North China Plain. Agric. Ecosyst. Environ. 2020, 295, 106886. [Google Scholar] [CrossRef]
  37. Liang, Z.; Jin, X.; Zhai, P.; Zhao, Y.; Cai, J.; Li, S.; Yang, S.; Li, C.; Li, C. Combination of organic fertilizer and slow-release fertilizer increases pineapple yields, agronomic efficiency and reduces greenhouse gas emissions under reduced fertilization conditions in tropical areas. J. Clean. Prod. 2022, 343, 131054. [Google Scholar] [CrossRef]
  38. IUSS Working Group WRB. World Reference Base for Soil Resources 2014, Update 2015 International Soil Classification System for Naming Soils and Creating Legends for Soil Maps. In World Soil Resources Reports No. 106; FAO: Rome, Italy, 2015; Available online: https://www.fao.org/3/i3794en/I3794en.pdf (accessed on 1 January 2023).
  39. Pansu, M.; Gautheyrou, J. Organic and Total C, N (H, O, S) Analysis. In Handbook of Soil Analysis; Springer: Berlin/Heidelberg, Germany, 2006. [Google Scholar] [CrossRef]
  40. de Rooij, G. Methods of Soil Analysis: Part 4. Physical Methods. Vadose Zone J. 2004, 3, 722–723. [Google Scholar] [CrossRef]
  41. Richard, H.L.; Donald, L.S. Methods of Soil Analysis. Part 3. Chemical Methods; Book Series No. 5; Soil Science of America and American Society of Agronomy: Madison, WI, USA, 1996. [Google Scholar]
  42. Vance, E.D.; Brookes, P.C.; Jenkinson, D.S. Microbial biomass measurements in forest soils: The use of the chloroform fumigation-incubation method in strongly acid soils. Soil Biol. Biochem. 1987, 19, 697–702. [Google Scholar] [CrossRef]
  43. Shukla, G.; Varma, A. Soil Enzyme: The State-of-Art. In Soil Enzymology. Soil Biology; Shukla, G., Varma, A., Eds.; Springer: Berlin/Heidelberg, Germany, 2011; Volume 22. [Google Scholar] [CrossRef]
  44. Guo, L.B.; Gifford, R.M. Soil carbon stocks and land use change: A meta analysis. Glob. Change Biol. 2002, 8, 345–360. [Google Scholar] [CrossRef]
  45. Kuzyakov, Y.; Bogomolova, I.; Glaser, B. Biochar stability in soil: Decomposition during eight years and transformation as assessed by compound-specific 14C analysis. Soil Biol. Biochem. 2014, 70, 229–236. [Google Scholar] [CrossRef]
  46. Vaccari, F.P.; Baronti, S.; Lugato, E.; Genesio, L.; Castaldi, S.; Fornasier, F.; Miglietta, F. Biochar as a strategy to sequester carbon and increase yield in durum wheat. Eur. J. Agron. 2011, 34, 231–238. [Google Scholar] [CrossRef]
  47. Paymaneh, Z.; Gryndler, M.; Konvalinková, T.; Benada, O.; Borovička, J.; Bukovská, P.; Püschel, D.; Řezáčová, V.; Sarcheshmehpour, M.; Jansa, J. Soil Matrix Determines the Outcome of Interaction Between Mycorrhizal Symbiosis and Biochar for Andropogon gerardii Growth and Nutrition. Front. Microbiol. 2018, 9, 2862. [Google Scholar] [CrossRef]
  48. Ye, J.; Joseph, S.D.; Ji, M.; Nielsen, S.; Mitchell, D.R.G.; Donne, S.; Horvat, J.; Wang, J.; Munroe, P.; Thomas, T. Chemolithotrophic processes in the bacterial communities on the surface of mineral-enriched biochars. ISME J. 2017, 11, 1087–1101. [Google Scholar] [CrossRef] [PubMed]
  49. Yu, J.; Deem, L.M.; Crow, S.E.; Deenik, J.; Penton, C.R. Comparative Metagenomics Reveals Enhanced Nutrient Cycling Potential after 2 Years of Biochar Amendment in a Tropical Oxisol. Appl. Environ. Microbiol. 2019, 85, 1. [Google Scholar] [CrossRef]
  50. Zheng, J.; Chen, J.; Pan, G.; Liu, X.; Zhang, X.; Li, L.; Bian, R.; Cheng, K.; Jinwei, Z. Biochar decreased microbial metabolic quotient and shifted community composition four years after a single incorporation in a slightly acid rice paddy from southwest China. Sci. Total Environ. 2016, 571, 206–217. [Google Scholar] [CrossRef]
  51. Lin, H.; Zhou, M.; Zeng, F.; Xu, P.; Ma, S.; Zhang, B.; Li, Z.; Wang, Y.; Zhu, B. How do soil organic carbon pool, stock and their stability respond to crop residue incorporation in subtropical calcareous agricultural soils? Agric. Ecosyst. Environ. 2022, 332, 107927. [Google Scholar] [CrossRef]
  52. Rumpel, C.; Koegel-Knabner, I. Deep soil organic matter—A key but poorly understood component of terrestrial C cycle. Plant Soil 2011, 338, 143–158. [Google Scholar] [CrossRef]
  53. Rowe, R.L.; Keith, A.M.; Elias, D.; Dondini, M.; Smith, P.; Oxley, J.; McNamara, N.P. Initial soil C and land-use history determine soil C sequestration under perennial bioenergy crops. GCB Bioenergy 2016, 8, 1046–1060. [Google Scholar] [CrossRef]
  54. Yang, K.; Zhu, J.; Zhang, M.; Yan, Q.; Sun, O.J. Soil microbial biomass carbon and nitrogen in forest ecosystems of Northeast China: A comparison between natural secondary forest and larch plantation. J. Plant Ecol. 2010, 3, 175–182. [Google Scholar] [CrossRef]
  55. Farrell, M.; Kuhn, T.K.; Macdonald, L.M.; Maddern, T.M.; Murphy, D.V.; Hall, P.A.; Singh, B.P.; Baumann, K.; Krull, E.S.; Baldock, J.A. Microbial utilisation of biochar-derived carbon. Sci. Total Environ. 2013, 465, 288–297. [Google Scholar] [CrossRef]
  56. Oladele, S.; Adeyemo, A.; Adegaiye, A.; Awodun, M. Effects of biochar amendment and nitrogen fertilization on soil microbial biomass pools in an Alfisol under rain-fed rice cultivation. Biochar 2019, 1, 163–176. [Google Scholar] [CrossRef]
  57. Smith, J.L.; Collins, H.P.; Bailey, V.L. The effect of young biochar on soil respiration. Soil Biol. Biochem. 2010, 42, 2345–2347. [Google Scholar] [CrossRef]
  58. Chagas, J.K.M.; de Figueiredo, C.C.; Ramos, M.L.G. Biochar increases soil carbon pools: Evidence from a global meta-analysis. J. Environ. Manag. 2022, 305, 114403. [Google Scholar] [CrossRef] [PubMed]
  59. Liu, S.; Zhang, Y.; Zong, Y.; Hu, Z.; Wu, S.; Zhou, J.; Jin, Y.; Zou, J. Response of soil carbon dioxide fluxes, soil organic carbon and microbial biomass carbon to biochar amendment: A meta-analysis. GCB Bioenergy 2016, 8, 392–406. [Google Scholar] [CrossRef]
  60. Lehmann, J.; Rillig, M.C.; Thies, J.; Masiello, C.A.; Hockaday, W.C.; Crowley, D. Biochar effects on soil biota—A review. Soil Biol. Biochem. 2011, 43, 1812–1836. [Google Scholar] [CrossRef]
  61. Cassidy, M.B.; Lee, H.; Trevors, J.T. Environmental applications of immobilized microbial cells: A review. J. Ind. Microbiol. Biot. 1996, 16, 79–101. [Google Scholar] [CrossRef]
  62. Rivera-Utrilla, J.; Bautista-Toledo, I.; Ferro-Garcia, M.A.; Moreno-Castilla, C. Activated carbon surface modifications by adsorption of bacteria and their effect on aqueous lead adsorption. J. Chem. Technol. Biotechnol. 2001, 76, 1209–1215. [Google Scholar] [CrossRef]
  63. Uchimiya, M.; Ohno, T.; He, Z. Pyrolysis temperature-dependent release of dissolved organic carbon from plant, manure, and biorefinery wastes. J. Anal. Appl. Pyrolysis. 2013, 104, 84–94. [Google Scholar] [CrossRef]
  64. Feng, Z.; Fan, Z.; Song, H.; Li, K.; Lu, H.; Liu, Y.; Cheng, F. Biochar induced changes of soil dissolved organic matter: The release and adsorption of dissolved organic matter by biochar and soil. Sci. Total Environ. 2021, 783, 147091. [Google Scholar] [CrossRef] [PubMed]
  65. Qiu, H.; Liu, J.; Boorboori, M.R.; Li, D.; Chen, S.; Ma, X.; Cheng, P.; Zhang, H. Effect of biochar application rate on changes in soil labile organic carbon fractions and the association between bacterial community assembly and carbon metabolism with time. Sci. Total Environ. 2023, 855, 158876. [Google Scholar] [CrossRef] [PubMed]
  66. Lin, Y.; Munroe, P.; Joseph, S.; Henderson, R.; Ziolkowski, A. Water extractable organic carbon in untreated and chemical treated biochars. Chemosphere 2012, 87, 151–157. [Google Scholar] [CrossRef]
  67. de Wit, H.; Groseth, T.; Mulder, J. Predicting Aluminum and Soil Organic Matter Solubility Using the Mechanistic Equilibrium Model WHAM. Soil Sci. Soc. Am. J. 2001, 65, 1089–1100. [Google Scholar] [CrossRef]
  68. Kang, H.; Kwon, M.J.; Kim, S.; Lee, S.; Jones, T.G.; Johncock, A.C.; Haraguchi, A.; Freeman, C. Biologically driven DOC release from peatlands during recovery from acidification. Nat. Commun. 2018, 9, 3807. [Google Scholar] [CrossRef]
  69. Oulehle, F.; Jones, T.G.; Burden, A.; Cooper, M.D.A.; Lebron, I.; Zielinski, P.; Evans, C.D. Soil-solution partitioning of DOC in acid organic soils: Results from a UK field acidification and alkalization experiment. Eur. J. Soil Sci. 2013, 64, 787–796. [Google Scholar] [CrossRef]
  70. Nakhavali, M.; Lauerwald, R.; Regnier, P.; Guenet, B.; Chadburn, S.; Friedlingstein, P. Leaching of dissolved organic carbon from mineral soils plays a significant role in the terrestrial carbon balance. Glob. Change Biol. 2021, 27, 1083–1096. [Google Scholar] [CrossRef]
  71. Munda, S.; Nayak, A.K.; Kumar, A.; Bhaduri, D.; Chatterjee, D.; Jangde, H.K.; Shahid, M.; Bhattacharyya, P.; Tripathi, R.; Mohanty, S.; et al. Dynamics of soil organic carbon mineralization and C fractions in paddy soil on application of rice husk biochar. Biomass Bioenergy 2018, 115, 1–9. [Google Scholar] [CrossRef]
  72. Jobbagy, E.G.; Jackson, R.B. The vertical distribution of soil organic carbon and its relation to climate and vegetation. Ecol. Appl. 2000, 10, 423–436. [Google Scholar] [CrossRef]
  73. Schimel, J.P.; Wetterstedt, J.; Holden, P.A.; Trumbore, S.E. Drying/rewetting cycles mobilize old C from deep soils from a California annual grassland. Soil Biol. Biochem. 2011, 43, 1101–1103. [Google Scholar] [CrossRef]
  74. Alekseev, I.; Abakumov, E. Soil organic carbon stocks and stability of organic matter in permafrost-affected soils of Yamal region, Russian Arctic. Geoderma Reg. 2022, 28, e00454. [Google Scholar] [CrossRef]
  75. Zimmerman, A.R.; Gao, B.; Ahn, M.-Y. Positive and negative carbon mineralization priming effects among a variety of biochar-amended soils. Soil Biol. Biochem. 2011, 43, 1169–1179. [Google Scholar] [CrossRef]
  76. Bailey, V.L.; Fansler, S.J.; Smith, J.L.; Bolton, H. Reconciling apparent variability in effects of biochar amendment on soil enzyme activities by assay optimization. Soil Biol. Biochem. 2011, 43, 296–301. [Google Scholar] [CrossRef]
  77. Joseph, S.D.; Camps-Arbestain, M.; Lin, Y.; Munroe, P.; Chia, C.H.; Hook, J.; van Zwieten, L.; Kimber, S.; Cowie, A.; Singh, B.P.; et al. An investigation into the reactions of biochar in soil. Soil Res. 2010, 48, 501–515. [Google Scholar] [CrossRef]
  78. Jones, D.L.; Murphy, D.V.; Khalid, M.; Ahmad, W.; Edwards-Jones, G.; DeLuca, T.H. Short-term biochar-induced increase in soil CO2 release is both biotically and abiotically mediated. Soil Biol. Biochem. 2011, 43, 1723–1731. [Google Scholar] [CrossRef]
  79. Weng, Z.; Van Zwieten, L.; Singh, B.P.; Kimber, S.; Morris, S.; Cowie, A.; Macdonald, L.M. Plant-biochar interactions drive the negative priming of soil organic carbon in an annual ryegrass field system. Soil Biol. Biochem. 2015, 90, 111–121. [Google Scholar] [CrossRef]
  80. Pignatello, J.; Kwon, S.; Lu, Y. Effect of Natural Organic Substances on the Surface and Adsorptive Properties of Environmental Black Carbon (Char): Attenuation of Surface Activity by Humic and Fulvic Acids. Environ. Sci. Technol. 2006, 40, 7757–7763. [Google Scholar] [CrossRef] [PubMed]
  81. Schimmelpfennig, S.; Glaser, B. One step forward toward characterization: Some important material properties to distinguish biochars. J. Environ. Qual. 2012, 41, 1001–1013. [Google Scholar] [CrossRef] [PubMed]
  82. Leng, L.; Huang, H.; Li, H.; Li, J.; Zhou, W. Biochar stability assessment methods: A review. Sci. Total Environ. 2019, 647, 210–222. [Google Scholar] [CrossRef] [PubMed]
  83. Spokas, K.A. Review of the stability of biochar in soils: Predictability of O:C molar ratios [Review]. Carbon Manag. 2010, 1, 289–303. [Google Scholar] [CrossRef]
  84. Ghorbani, M.; Konvalina, P.; Neugschwandtner, R.W.; Soja, G.; Bárta, J.; Chen, W.; Amirahmadi, E. How do different feedstocks and pyrolysis conditions effectively change biochar modification scenarios? A critical analysis of engineered biochars under H2O2 oxidation. Energy Convers. Manag. 2024, 300, 117924. [Google Scholar] [CrossRef]
  85. Yang, Y.; Sun, K.; Han, L.; Chen, Y.; Liu, J.; Xing, B. Biochar stability and impact on soil organic carbon mineralization depend on biochar processing, aging and soil clay content. Soil Biol. Biochem. 2022, 169, 108657. [Google Scholar] [CrossRef]
  86. Kolb, S.E.; Fermanich, K.J.; Dornbush, M.E. Effect of Charcoal Quantity on Microbial Biomass and Activity in Temperate Soils. Soil Sci. Soc. Am. J. 2009, 73, 1173–1181. [Google Scholar] [CrossRef]
  87. Lehmann, J.; Kleber, M. The contentious nature of soil organic matter. Nature 2015, 528, 60–68. [Google Scholar] [CrossRef]
  88. Zhang, J.; Zhang, X.; Sun, H.; Wang, C.; Zhou, S. Carbon sequestration and nutrients improvement meditated by biochar in a 3-year vegetable rotation system. J. Soils Sediments 2022, 22, 1385–1396. [Google Scholar] [CrossRef]
  89. Eykelbosh, A.J.; Johnson, M.S.; Couto, E.G. Biochar decreases dissolved organic carbon but not nitrate leaching in relation to vinasse application in a Brazilian sugarcane soil. J. Environ. Manag. 2015, 149, 9–16. [Google Scholar] [CrossRef] [PubMed]
  90. George, J.; Singh, R.; Patra, A.; Kumar, A. Soil carbon pools and carbon management index under different land use systems in the Central Himalayan region. Acta Agric. Scand. 2013, 63, 200–205. [Google Scholar] [CrossRef]
Figure 1. Changes in SOC (a) and active carbon (bd) contents under R biochar treatment. R10, R20, R40, and R60 indicate that the rates of R biochar applied are 10 t ha−1, 20 t ha−1, 40 t ha−1, and 60 t ha−1, respectively. CK: no biochar. SOC, soil organic carbon; MBC, microbial biomass carbon; DOC, dissolved organic carbon; SMC, soil mineralizable carbon. Different lowercase letters indicate significant differences among the different treatments in the same soil layer at the 0.05 level.
Agronomy 14 00676 g001
Figure 2. Changes in SOC (a) and active carbon (bd) contents under P biochar treatment. P10, P20, P40, and P60 indicate that the rates of P biochar applied are 10 t ha−1, 20 t ha−1, 40 t ha−1, and 60 t ha−1, respectively. CK: no biochar. SOC, soil organic carbon; MBC, microbial biomass carbon; DOC, dissolved organic carbon; SMC, soil mineralizable carbon. Different lowercase letters indicate significant differences among the different treatments in the same soil layer at the 0.05 level.
Agronomy 14 00676 g002
Figure 3. Changes in SOC (a) and active carbon fraction (bd) stocks under the R biochar treatment. R10, R20, R40, and R60 indicate that the rates of R biochar applied are 10 t ha−1, 20 t ha−1, 40 t ha−1, and 60 t ha−1, respectively. CK: no biochar. SOC, soil organic carbon; MBC, microbial biomass carbon; DOC, dissolved organic carbon; SMC, soil mineralizable carbon. Different lowercase letters indicate significant differences among the different treatments in the same soil layer at the 0.05 level.
Agronomy 14 00676 g003
Figure 4. Changes in SOC (a) and active carbon fraction (bd) stocks under P biochar treatment. P10, P20, P40, and P60 indicate that the rates of P biochar applied are 10 t ha−1, 20 t ha−1, 40 t ha−1, and 60 t ha−1, respectively. CK: no biochar. SOC, soil organic carbon; MBC, microbial biomass carbon; DOC, dissolved organic carbon; SMC, soil mineralizable carbon. Different lowercase letters indicate significant differences among the different treatments in the same soil layer at the 0.05 level.
Agronomy 14 00676 g004
Figure 5. Changes in cumulative stocks of SOC (a) and active carbon fractions (b) under R and P biochar treatments. R10, R20, R40, and R60 indicate that the rates of R biochar applied are 10 t ha−1, 20 t ha−1, 40 t ha−1, and 60 t ha−1, respectively. P10, P20, P40, and P60 indicate that the rates of R biochar applied are 10 t ha−1, 20 t ha−1, 40 t ha−1, and 60 t ha−1, respectively. CK: no biochar. SOC, soil organic carbon; MBC, microbial biomass carbon; DOC, dissolved organic carbon; SMC, soil mineralizable carbon. Different lowercase letters indicate significant differences among the different treatments in the same soil layer at the 0.05 level.
Agronomy 14 00676 g005
Figure 6. The proportions of active carbon fractions accounting for SOC under the R biochar treatment. R10, R20, R40, and R60 indicate that the rates of R biochar applied are 10 10 t ha−1, 20 t ha−1, 40 t ha−1, and 60 t ha−1, respectively. CK: no biochar. SOC, soil organic carbon; MBC, microbial biomass carbon; DOC, dissolved organic carbon; SMC, soil mineralizable carbon; (a): MBC:SOC, the proportion of MBC stock accounting for the SOC stock (0–30 cm); (b): DOC:SOC, the proportion of DOC stock accounting for the SOC stock (0–30 cm); (c): SMC:SOC, the proportion of SMC stock accounting for the SOC stock (0–30 cm); (d): active fraction, the sum of MBC, DOC, and SMC; active fraction:SOC, the proportion of active fraction stock accounting for the SOC stock (0–30 cm). Different lowercase letters indicate significant differences among the different treatments in the same soil layer at the 0.05 level.
Agronomy 14 00676 g006
Figure 7. The proportions of active carbon fractions accounting for SOC under the P biochar treatment. P10, P20, P40, and P60 indicate that the rates of P biochar applied are 10 t ha−1, 20 t ha−1, 40 t ha−1, and 60 t ha−1, respectively. CK: no biochar. SOC, soil organic carbon; MBC, microbial biomass carbon; DOC, dissolved organic carbon; SMC, soil mineralizable carbon; (a): MBC:SOC, the proportion of MBC stock accounting for the SOC stock (0–30 cm); (b): DOC:SOC, the proportion of DOC stock accounting for the SOC stock (0–30 cm); (c): SMC:SOC, the proportion of SMC stock accounting for the SOC stock (0–30 cm); (d): active fraction, the sum of MBC, DOC, and SMC; active fraction:SOC, the proportion of active fraction stock accounting for the SOC stock (0–30 cm). Different lowercase letters indicate significant differences among the different treatments in the same soil layer at the 0.05 level.
Agronomy 14 00676 g007
Figure 8. Redundancy analysis (RDA) (a) and Pearson correlation (b) among active carbon fractions, carbon stability, soil physicochemical properties, and soil enzyme activity under biochar application. Pearson correlation is shown; * represents p ≤ 0.05 and ** represents p ≤ 0.01; the intensity of the color gradient indicates the relationship. MC, soil moisture content; BD, soil bulk density; SOC, soil organic carbon; TN, total nitrogen; TP, total phosphorus; AP, available phosphorus; AK, available potassium. Suc, sucrase activity; Ure, urease activity; A Pho, acid phosphatase activity; Cat, catalase activity; MBC, microbial biomass carbon; DOC, dissolved organic carbon; SMC, soil mineralizable carbon; CS, SOC stock.
Agronomy 14 00676 g008
Table 1. Basic physicochemical properties of experimental site and biochar.
PropertySoilRice Hull BiocharPeanut Shell Biochar
Sand%77.81--
Silt%18.89--
Clay%3.30--
SOC (g kg−1)4.00--
Alkali hydrolyzed nitrogen (mg kg−1)34.24--
Available phosphorus (mg kg−1)187.50--
Available potassium (mg kg−1)183.79--
EC (μS cm−1)-14451375
pH5.979.8310.05
Carbon content (%)-43.4239.66
Hydrogen content (%)-1.681.73
Oxygen content (%)-14.7515.11
Nitrogen content (%)-0.711.40
C:N-25.8528.33
O:C-0.250.29
H:C-0.470.52
(O+N):C-0.270.32
Table 2. A two-way ANOVA for SOC, MBC, DOC, and SMC content and corresponding stocks in the experiment.
VariablesF (p) Values
Factors SOCMBCDOCSMCSOC StocksMBC StocksDOC StocksSMC Stocks
Biochar type5.443
(0.023)
7.862
(0.007)
1398.609
(<0.001)
0.009
(0.925)
0.535
(0.468)
11.022
(0.002)
13.211
(0.001)
5.333
(0.024)
Application rates41.105
(<0.001)
321.791
(<0.001)
145.764
(<0.001)
18.365
(<0.001)
21.581
(<0.001)
220.728
(<0.001)
31.193
(<0.001)
29.291
(<0.001)
Biochar type * Application rates1.64
(0.176)
2.395
(0.06)
15.43
(<0.001)
10.469
(<0.001)
1.332
(0.268)
5.781
(0.001)
20.014
(<0.001)
0.631
(0.624)
Note: * represents p ≤ 0.05. SOC, soil organic carbon; MBC, microbial biomass carbon; DOC, dissolved organic carbon; SMC, cumulative SOC mineralization.
Table 3. Basic physicochemical properties and enzyme activities of dry red soil in 0–30 cm soil layer after two years of application.
Biochar TypeRatesBasic Physicochemical PropertiesSoil Enzyme Activities
pHSoil Moisture Content
(%)
Soil Bulk Density
(g cm−3)
Total Nitrogen
(g kg−1)
Total Phosphorus
(g kg−1)
Available Phosphorus
(mg kg−1)
Available Potassium
(mg kg−1)
Suc
(μg g−1 h−1)
Ure
(μg g−1 h−1)
A Pho
(mg g−1 10 h−1)
Cat
(mL g−1 0.5 h−1)
Rice hull biocharCK5.89 ± 0.14 a8.93 ± 0.05 b1.94 ± 0.02 a0.57 ± 0.02 d0.30 ± 0.01 ab128.17 ± 3.42 bc61.62 ± 3.24 d78.47 ± 1.48 b4.74 ± 0.21 b0.28 ± 0.02 c0.29 ± 0.0 c
R105.98 ± 0.14 a10.79 ± 0.3 a1.87 ± 0.03 ab0.69 ± 0.01 b0.31 ± 0.01 ab129.23 ± 0.87 bc74.72 ± 1.18 c120.32 ± 8.83 a5.15 ± 0.63 ab0.31 ± 0.01 bc0.45 ± 0.0 a
R205.94 ± 0.1 a10.73 ± 0.38 a1.75 ± 0.03 b0.62 ± 0.01 cd0.31 ± 0.01 ab142.97 ± 1.06 ab76.06 ± 4.73 c85.41 ± 5.4 b6.19 ± 0.12 a0.36 ± 0.01 a0.39 ± 0.0 b
R405.78 ± 0.04 a10.65 ± 0.23 a1.79 ± 0.03 b0.65 ± 0.02 bc0.28 ± 0.01 b125.85 ± 3.19 c109.93 ± 1.18 b89.47 ± 3.13 b5.44 ± 0.18 ab0.32 ± 0.01 b0.37 ± 0.0 b
R605.98 ± 0.27 a11.46 ± 0.18 a1.87 ± 0.07 ab0.77 ± 0.02 a0.35 ± 0.03 a152.9 ± 9.93 a137.14 ± 3.86 a93.36 ± 5.09 b5.06 ± 0.32 ab0.32 ± 0.01 b0.38 ± 0.0 b
Peanut shell biocharCK5.89 ± 0.14 a8.93 ± 0.05c 1.94 ± 0.02 b0.57 ± 0.02 c0.30 ± 0.01 ab128.17 ± 3.42 ab61.62 ± 3.24 c78.47 ± 1.48 d4.74 ± 0.21 c0.28 ± 0.02 b0.29 ± 0.0 c
P105.76 ± 0.28 a9.84 ± 0.1 b2.05 ± 0.01 a0.55 ± 0.01 b0.28 ± 0.01 ab110.52 ± 2.85 b70.95 ± 2.61 bc106.85 ± 2.04 b6.85 ± 0.27 ab0.3 ± 0.01 b0.38 ± 0.0 b
P205.89 ± 0.34 a10.96 ± 0.24 a1.85 ± 0.03 b0.67 ± 0.01 c0.27 ± 0.02 b144.45 ± 5.13 a78.72 ± 6.12 b67.41 ± 2.8 e4.72 ± 0.49 c0.28 ± 0.01 b0.43 ± 0.0 b
P405.91 ± 0.33 a11.07 ± 0.35 a1.94 ± 0.07 b0.59 ± 0.02 c0.33 ± 0.03 a138.64 ± 16.4 ab82.39 ± 3.2 b94.09 ± 4.08 c6.14 ± 0.16 b0.3 ± 0.01 b0.39 ± 0.0 b
P606.03 ± 0.21 a11.67 ± 0.22 a1.75 ± 0.01 c0.81 ± 0.01 a0.31 ± 0.01 ab137.74 ± 11.67 ab138.58 ± 0.62 a135.16 ± 3.29 a7.29 ± 0.16 a0.35 ± 0.01 a0.52 ± 0.0 a
R10, R20, R40, and R60 indicate that the rates of R biochar applied are 10 t ha−1, 20 t ha−1, 40 t ha−1, and 60 t ha−1, respectively. P10, P20, P40, and P60 indicate that the rates of R biochar applied are 10 t ha−1, 20 t ha−1, 40 t ha−1, and 60 t ha−1, respectively. CK: no biochar. Suc, sucrase activity; Ure, urease activity; A Pho, acid phosphatase activity; Cat, catalase activity. Different lowercase letters indicate significant differences among the different treatments in the same soil layer at the 0.05 level.
Disclaimer/Publisher’s Note: The statements, opinions and data contained in all publications are solely those of the individual author(s) and contributor(s) and not of MDPI and/or the editor(s). MDPI and/or the editor(s) disclaim responsibility for any injury to people or property resulting from any ideas, methods, instructions or products referred to in the content.

