Article

Incorporation of Photoperiod Insensitivity and High-Yield Genes into an Indigenous Rice Variety from Myanmar, Paw San Hmwe

by
Khin Thanda Win
1,*,
Moe Moe Hlaing
1,2,
Aye Lae Lae Hlaing
2,
Zin Thu Zar Maung
2,
Khaing Nwe Oo
2,
Thinzar Nwe
2,
Sandar Moe
2,
Thein Lin
2,
Ohm Mar Saw
2,
Thado Aung
2,
Mai Swe Swe
2,
San Mar Lar
2,
Ei Shwe Sin
2,
Yoshiyuki Yamagata
1,
Enrique R. Angeles
1,
Yuji Matsue
3,
Hideshi Yasui
1,
Min San Thein
2,
Naing Kyi Win
2,
Motoyuki Ashikari
4 and
Atsushi Yoshimura
1,*
add Show full author list remove Hide full author list
1
Plant Breeding Laboratory, Faculty of Agriculture, Kyushu University, 744 Motooka, Nishi-ku, Fukuoka 819-0395, Japan
2
Department of Agricultural Research, Ministry of Agriculture Livestock and Irrigation, Naypyitaw 15013, Myanmar
3
Global Innovation Center, Kyushu University, 4-9-1 Shiobara, Minami-ku, Fukuoka 815-8581, Japan
4
Bioscience and Biotechnology Center, Nagoya University, Nagoya 464-0813, Japan
*
Authors to whom correspondence should be addressed.
Agronomy 2024, 14(3), 632; https://doi.org/10.3390/agronomy14030632
Submission received: 12 February 2024 / Revised: 11 March 2024 / Accepted: 14 March 2024 / Published: 20 March 2024
(This article belongs to the Special Issue Marker Assisted Selection and Molecular Breeding in Major Crops)

Abstract

:
Paw San Hmwe (PSH) is an indigenous rice variety from Myanmar with a good taste, a pleasant fragrance, and excellent elongation ability during cooking. However, its low yield potential and strong photoperiod sensitivity reduce its productivity, and it is vulnerable to climate changes during growth. To improve the photoperiod insensitivity, yield, and plant stature of PSH, the high-yield genes Grain number 1a (Gn1a) and Wealthy Farmer’s Panicle (WFP), together with the photoperiod insensitivity trait, were introgressed into PSH via marker-assisted backcross breeding and phenotype selection. For the photoperiod insensitivity trait, phenotypic selection was performed under long-day conditions during the dry season. After foreground selection of Gn1a and WFP via simple sequence repeat genotyping, genotyping-by-sequencing was conducted to validate the introgression of target genes and determine the recurrent parent genome recovery of the selected lines. The improved lines were insensitive to photoperiod, and the Gn1a and WFP introgression lines showed significantly higher numbers of primary panicle branches and spikelets per panicle than the recurrent parent, with comparative similarity in cooking and eating qualities. This study successfully improved PSH by decreasing its photoperiod sensitivity and introducing high-yield genes via marker-assisted selection. The developed lines can be used for crop rotation and double-season cropping of better-quality rice.

1. Introduction

Paw San Hmwe (PSH), a fine-grained aromatic rice cultivar, is cultivated in many areas of Myanmar and considered the national pride [1]. Myanmar’s indigenous PSH, also known as “Pearl Rice”, is a premium quality aromatic rice that achieved the “World’s Best Rice” prize at The Rice Trader’s “3rd World Rice Conference 2011” held in Ho Chi Minh and is a market-driven export rice. A good taste, a pleasant aroma, and excellent elongation ability during cooking are key characteristics of PSH rice. Rice is not only a staple food but also an important exported cereal for Myanmar. The demand for high-quality rice varieties has increased owing to recent changes in consumer preferences and market requirements.
PSH is well adapted to particular environmental conditions, especially in the Ayeyarwady Delta region, and its cultivation has extended throughout the country. Singh et al. [2] showed that an aromatic rice cultivar can grow and yield satisfactorily over a wide area; however, its quality traits are best expressed in the native area of cultivation. To date, a number of Paw San cultivars have been observed and called different names depending on the cultivation location, plant lifespan, and seed color. None of the Paw San cultivars headed under long-day (LD) conditions. However, the Paw San cultivars showed variation in photoperiod sensitivity under short-day (SD) conditions. Paw San Gyi had strong photoperiod sensitivity (flowering in the 3rd week of November), Paw San Lat had moderate photoperiod sensitivity (flowering in the 3rd week of October), and Paw San Yin had the lowest photoperiod sensitivity (flowering in the 1st week of October) when sown at the conventional sowing time of June–July in the monsoon season [3]. Because of their prolonged growth period influenced by photoperiod sensitivity, these varieties can be cultivated once a year (single cropping) during the monsoon season.
Rice grain quality is determined by many factors, including grain appearance, processing behavior, nutritional value, cooking, and taste [4], which are directly related to three chemical properties of the rice grain starch: amylose content (AC) [5], gel consistency (GC) [6], and gelatinization temperature (GT) [7]. Although consumer preferences vary among different groups and cultures, rice grains with pleasant fragrances and soft textures usually achieve high prices in both national and international rice markets. PSH is a unique rice variety with a strong aroma and good taste. However, because the highest-quality Paw San cultivars have strong photoperiod sensitivity, the cultivation of PSH is limited to a single crop per year, for example, in the form of rain-fed lowland monsoon rice, and its grain yield is relatively low compared with that of photoperiod-insensitive high-yielding varieties. Hence, new improved rice varieties with quality traits similar to those of PSH are necessary to produce the desired yield potential, and good-quality PSH rice that can be grown year-round without photoperiod sensitivity is preferred.
Rice (Oryza sativa L.) is typically classified as an SD plant, and flowering is promoted under SD conditions and inhibited under LD conditions, although there are variations among different rice varieties. However, in the early growth stage of the vegetative growth phase, flowering cannot be initiated even under inductive day-length conditions; this stage is called the basic vegetative phase (BVP). Once the BVP is completed, rice can respond to photoperiodic stimuli for flowering; this stage is called the photoperiod-sensitive phase [8,9]. Photoperiod sensitivity in rice is a complex trait that is regulated by genetic, hormonal, and environmental factors. Most traditional cultivars in tropical and subtropical Asia mature in 160–170 days with strong photoperiod sensitivity and are only suitable for a single crop per year, not for multiple cropping [10]. The cultivation of rice varieties with strong photoperiod sensitivity may have limitations in specific geographic ranges and/or specific growing seasons, facing challenges of vulnerability to climate variability, delayed or no flowering, and adaptability. To overcome these limitations and challenges, advances in rice breeding and genetics have allowed researchers to develop rice varieties with rapid vigor and shorter growth durations by incorporating early-heading genes for early maturity or photoperiod insensitivity, thereby contributing to increased crop productivity and adaptability [11,12].
The most complex agronomic traits, such as grain yield and yield-related components, are controlled by many genes and are highly influenced by the environment. Panicle size is a critical determinant of rice grain yield. The characteristics of a rice panicle that mainly determine grain yield in rice are panicle length (PL), number of primary branches per panicle (PB), and number of spikelets per panicle (NS). Large panicles with more branches and spikelets are preferred in breeding programs for new rice plant types with high grain yields [13].
Several quantitative trait loci (QTLs) controlling yield and yield-related traits, such as grain size and weight (GS3, GW2, and GW5 [14,15,16]), grain number (Gn1a and DEP1 [17,18]), and panicle branching (WFP/IPA1 [18]), have been identified by various groups. The major QTL Grain number 1a (Gn1a) was initially identified in the high-yielding indica rice variety Habataki. This gene encodes cytokinin oxidase/dehydrogenase (OsCKX2), an enzyme degrading the bioactive cytokinins. When the expression of OsCKX2 is reduced, cytokinins accumulate, resulting in increased inflorescence branching [17]. Furthermore, Wealthy Farmer’s Panicle (WFP) was first isolated from the rice line ST12. This gene encodes the SQUAMOSA promoter-binding protein-like 14 (OsSPL14), and an increase in the expression of OsSPL14 during the vegetative stage suppresses tillering and enhances panicle branching. In the rice line ST12, the abundance of OsSPL14 transcripts is regulated by heritable epigenetic mechanisms [19]. The major QTLs Gn1a and WFP were previously used in breeding programs to improve indica and japonica rice cultivars [20,21,22] and the stacking of these QTLs in NERICA (New Rice for Africa) [23]. However, the performance of introgression and pyramiding of these QTLs in high-quality aromatic rice, such as PSH, has not yet been evaluated.
Backcross breeding enables the transfer of a desired trait to the target locus of the favored genetic background of another trait with declining donor genome content in the progenies. However, conventional backcrossing is laborious and takes many iterations to generate lines with high recurrent parent genome recovery (RPGR). Marker-assisted backcrossing (MAB), a combination of DNA markers that are tightly linked to or flank the target locus in conventional backcrossing programs, has become widely used in plant breeding programs to develop new varieties, especially in rice [24]. MAB accelerates the recovery of the RP genome during backcrossing, thereby reducing the number of necessary backcrosses [24]. MAB alters the selection criteria from the selection of phenotypes to the selection of genotypes or genes that control the traits of interest. MAB has the ability to improve selection efficiency compared with phenotype selection in traditional breeding programs [24]. Several breeding programs for biotic stress [25] and abiotic stress [26] have been successfully applied to the MAB method.
Currently, with the advent of genome sequencing technology and availability of rice genome sequences, single nucleotide polymorphism (SNP) markers are preferred over simple sequence repeat (SSR) markers in rice breeding programs. Genotyping-by-sequencing (GBS), a rapid approach for the reduced-representation library sequencing of multiplexed DNA samples, facilitates genome-wide molecular marker discovery and genotyping [27]. GBS provides an abundance of molecular markers and greater read depths, which are advantageous for detecting heterozygous regions compared to other genotyping approaches [27]. GBS has been successfully used for molecular marker discovery and genomic selection in plant breeding programs, QTL mapping, and genetic resource development [28,29].
In this study, we aimed to (1) decrease the photoperiod sensitivity of the PSH rice variety for year-round production via introgression of photoperiod insensitivity alleles; (2) improve the high-yielding traits and plant stature of PSH via introgression of Gn1a, WFP, and semi-dwarf 1 (sd1) genes; (3) identify promising lines with improved grain number and primary branching; and (4) evaluate the effects on the grain yield and yield-related components of rice.

2. Materials and Methods

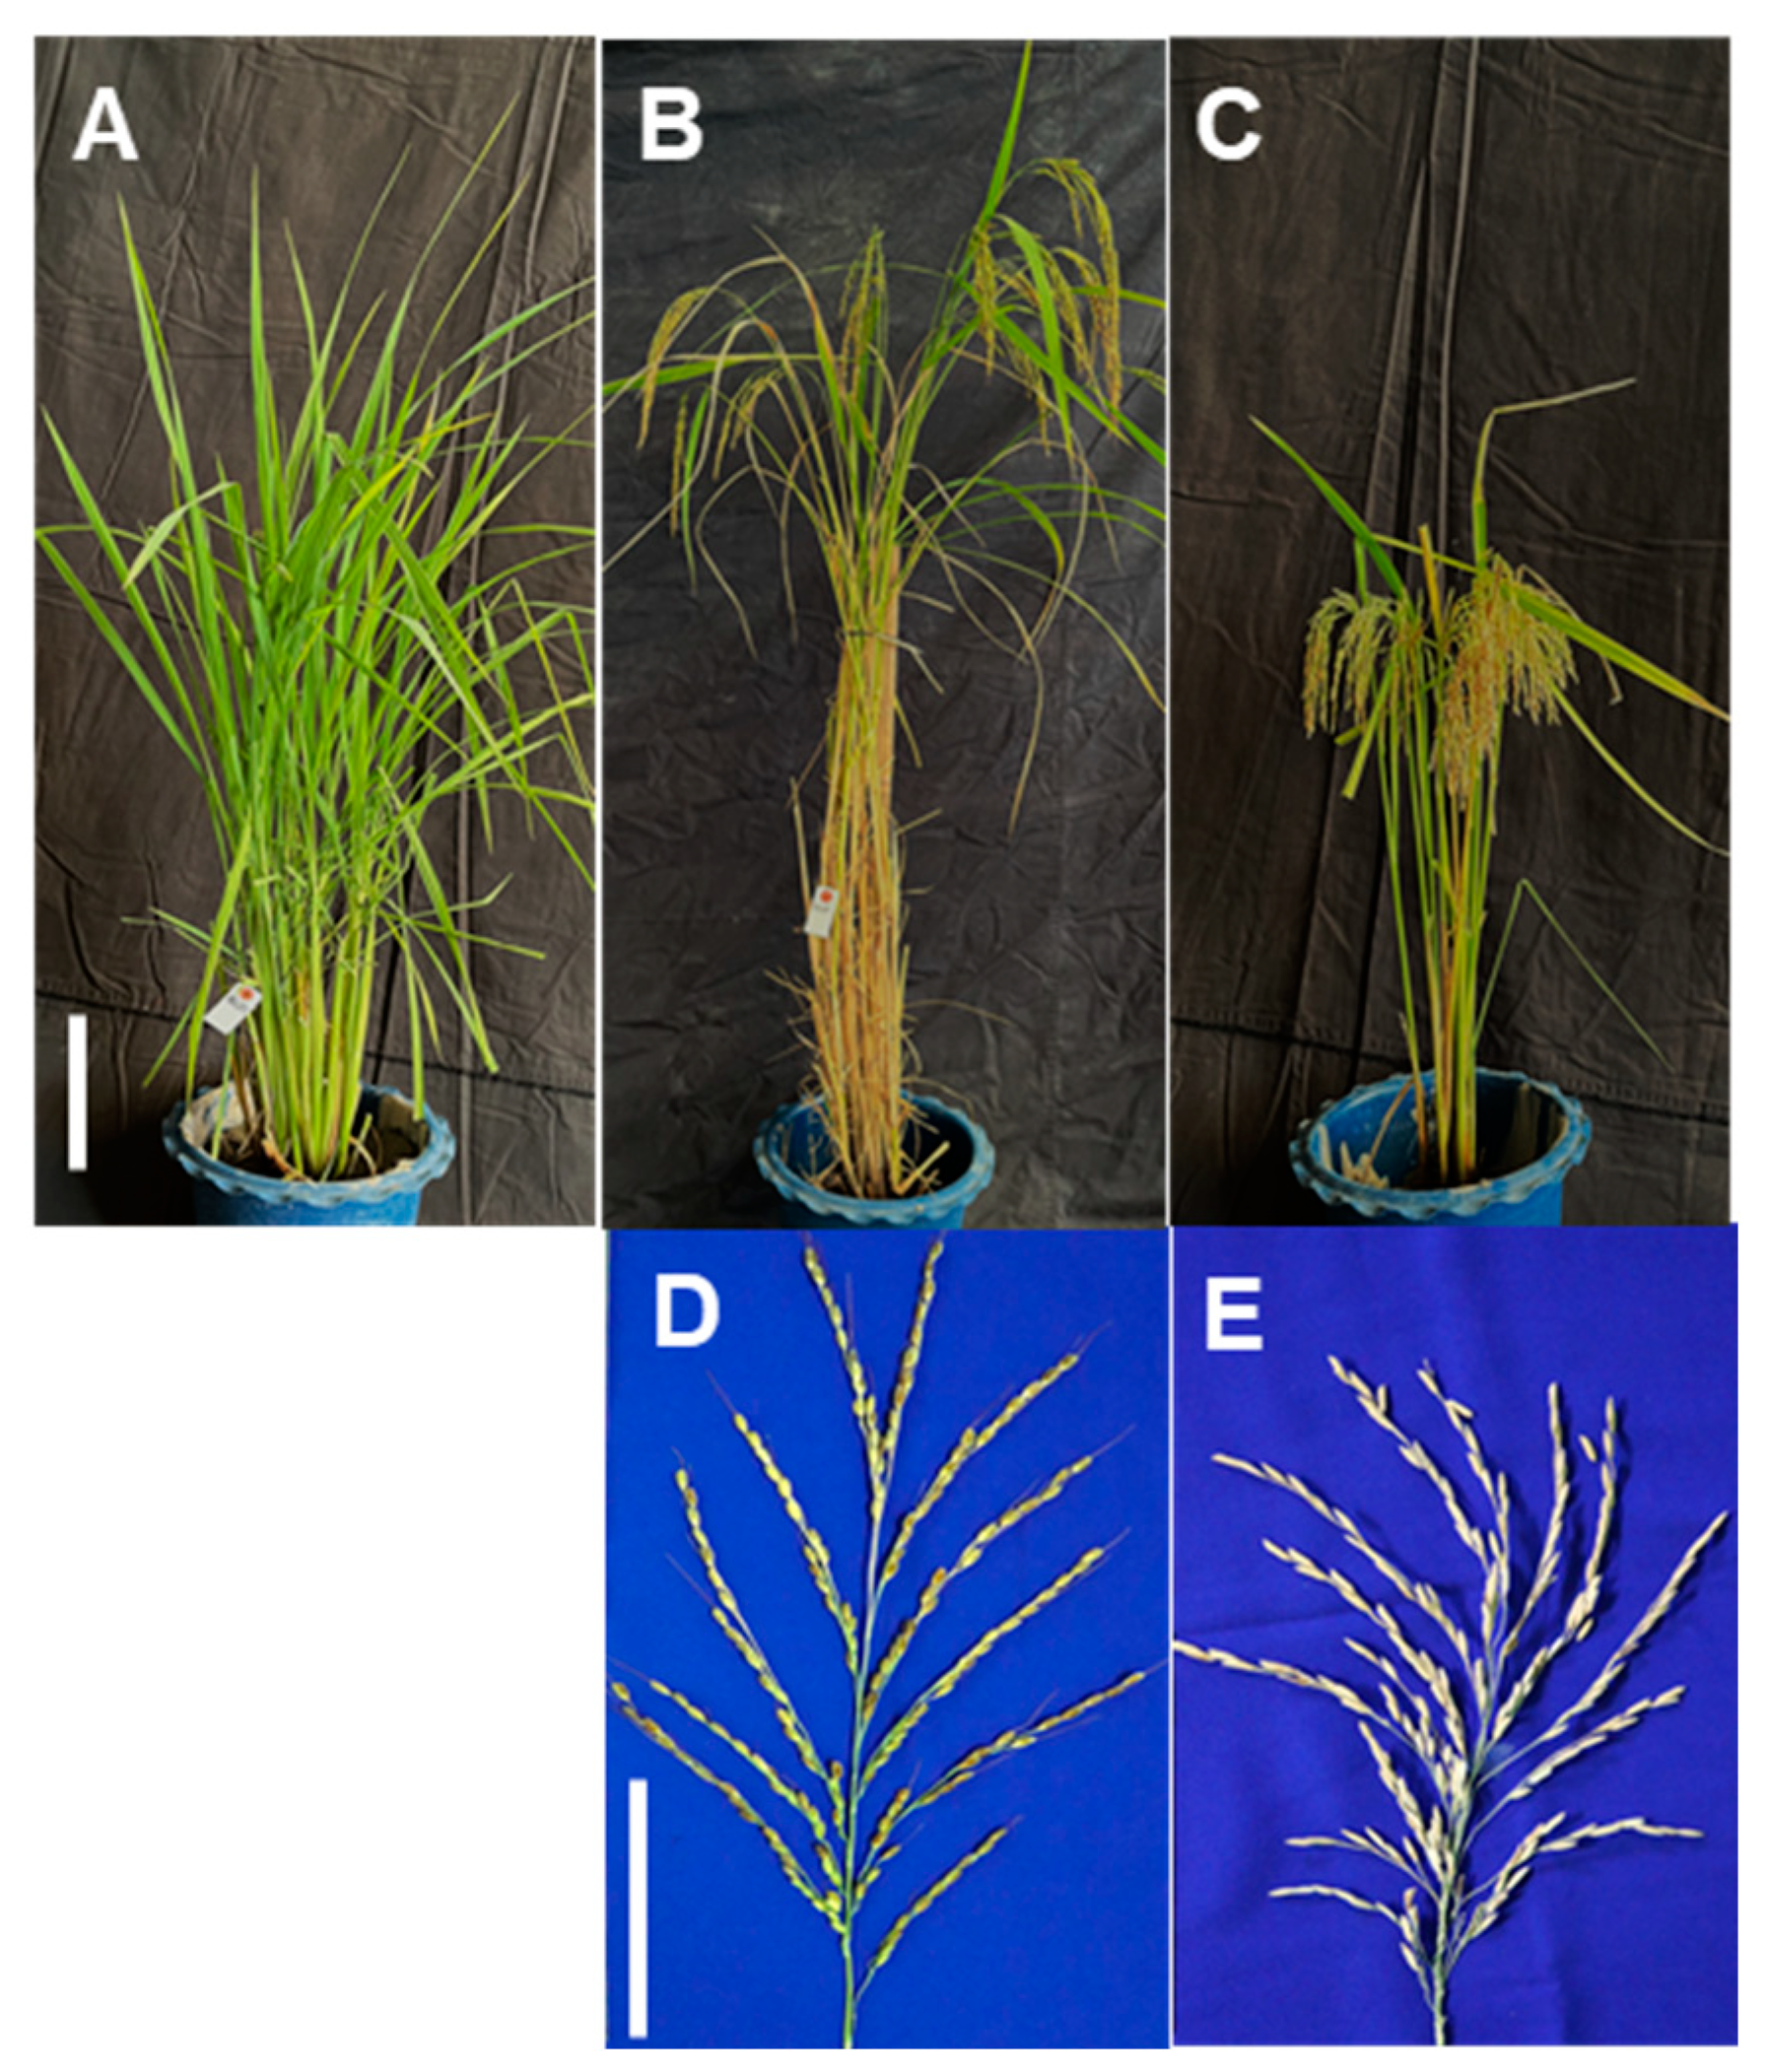
2.1. Plant Materials and Growth

Myanmar’s famous indigenous rice variety, PSH (Acc. no. 002082) was obtained from the Seed Bank (Department of Agricultural Research (DAR), MOALI, Myanmar) and used as the recurrent parent. PSH has strong photoperiod sensitivity; therefore, it cannot head under LD conditions in the dry season (Figure 1A) and generally heads around the 3rd week of November in the monsoon season (Figure 1B). The donor rice line ST12, a high-yielding rice line on an indica background, was used as the donor for the high-yield genes Gn1a and WFP. ST12 is a photoperiod-insensitive variety with a short growth duration (108–115 d) until maturity. ST12 is a semi-dwarf plant associated with sd1 (Figure 1C). The ST12 line was obtained from the Bioscience and Biotechnology Center, Nagoya University, Japan.

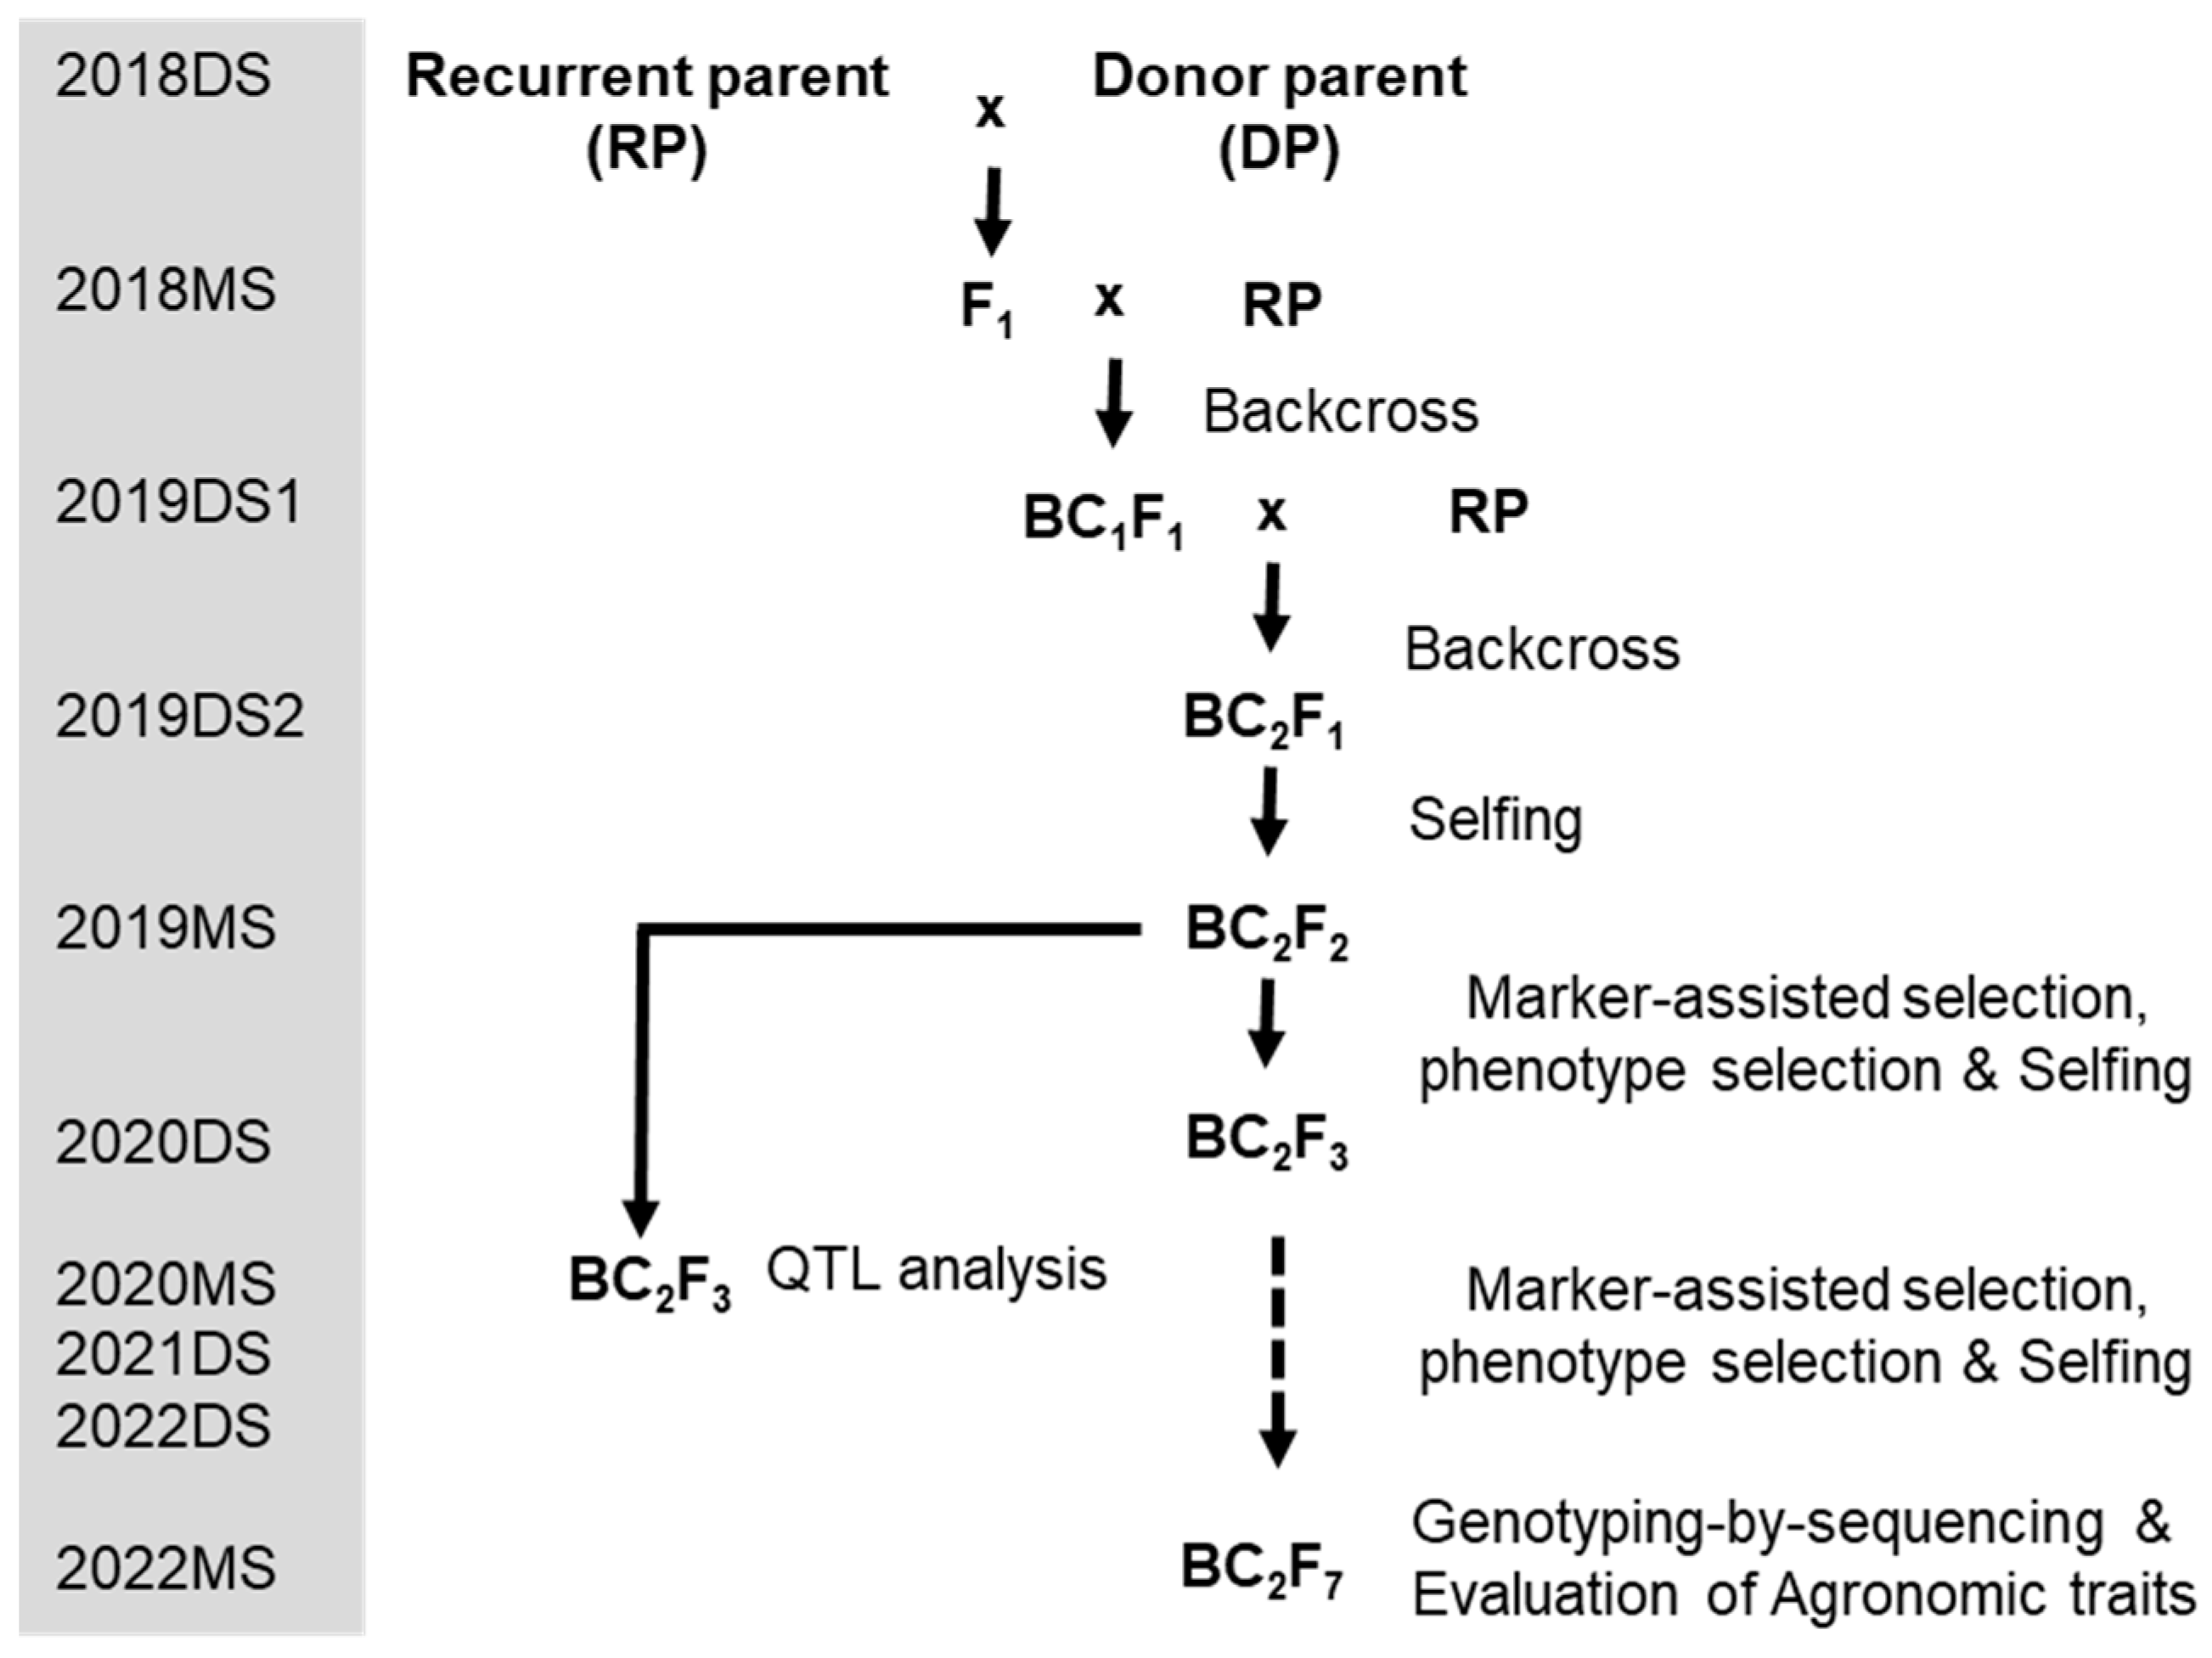
2.2. Development of Promising Lines

PSH was used as the female parent and crossed with ST12 to produce F1 plants with PSH cytoplasm at the DAR, Yezin, Naypyitaw, Myanmar, during the dry season of 2018 (2018DS). Because PSH has strong photoperiod sensitivity, a short-day treatment (8 h:16 h, light/dark) was applied to PSH to synchronize the flowering time with that of the donor parent in the dry season. These F1 plants were successively backcrossed twice with PSH as the male parent during the monsoon season in 2018 (2018MS) and DS in 2019 (2019DS) to generate BC2F1 lines. We performed backcrossing only twice because we wanted to incorporate useful genes without clarifying the genetic basis of favorable traits; the focus was on the observation and selection of individuals that expressed favorable traits. Twenty selected BC2F1 plants were advanced to the BC2F2 generation during the MS in 2019 (2019MS). Heading-date evaluation was continuously conducted from the F1 generation, and we observed the segregation of heading dates among the BC2F2 populations during 2019MS. To confirm that the photoperiod response of some early heading lines was screened again in the DS in 2020 (2020DS), only lines that could emerge during the dry season were selected for the development of photoperiod-insensitive lines for future generations. Heading-date evaluation was successively performed to ensure the uniformity of the heading date or photoperiod insensitivity, even under LD conditions. Marker-assisted selection was first started for F1 screening and carried out again from the BC2F2 generation derived from 20 BC2F1 plants and every later generation to ensure the presence of donor alleles of Gn1a and WFP using the DNA markers RM5423 and RM8098 for Gn1a and RM531 and RM264 for WFP. Simultaneously, phenotypic evaluation was initiated in the BC2F2 and later generations. BC2F2 lines homozygous for the donor alleles at Gn1a and WFP were selected and advanced to BC2F7 by 2022MS (Figure 2). In the BC2F7 generation, promising lines were genotyped using the GBS method and phenotypically evaluated.

2.3. GBS

Total genomic DNA of individual lines was extracted according to the method described by Dellaporta et al. [30], with minor modifications. Genomic DNA was double-digested using two enzymes, PstI and MspI, to construct a sequencing library for Illumina SBS technology with minor modifications [31]. Library sequencing was performed using an Illumina NovaSeq 150 PE platform (Azenta, Tokyo, Japan). Short read sequences (in .fastq format) of the GBS library were processed using the TASSEL GBS V2 pipeline [32] to conduct genotype calling. LB-Impute software V1.1 was used to impute missing genotypes [33]. The single nucleotide variants with minor allele frequencies of more than 5% (--maf 0.05), more than 90% of individuals genotyped (--max-missing 0.9), and thinned intervals within 1 kbp genomic region (--thin 1000) were used for subsequent analyses.

2.4. QTL Analysis of Days to Heading (DTH) in the BC2F3 Population

To infer the genetic inheritance of photoperiod insensitivity or early heading in the promising lines, one segregating BC2F2 population was selected for QTL analysis. A total of 120 individuals of the BC2F3 population were grown in the experimental field of DAR using a spacing of 25 × 20 cm between and within rows in 2020DS and evaluated for the segregation of heading and non-heading in the dry season. To confirm the heading date segregation of this population, 55 individuals from the same seed source as the BC2F3 population were grown again in 2020MS and the heading date was evaluated. To evaluate the heading date, each BC2F3 individual plant and its parents were evaluated for DTH, which was recorded as the number of days from sowing to the emergence of the first panicle from the flag leaf sheath (2 cm above the panicle) assessed at two-day intervals starting from the first emergence of the panicle in the population.
After GBS and genotype calling, 1191 polymorphic SNPs covering 12 rice chromosomes from the mapping population were used for linkage map construction. The QTL analysis was performed using marker regression with the scanone () function in the R/qtl library [34]. The threshold of the logarithm of the odds (LOD) was determined by the top 5% level of the empirical distribution of LOD in 1000 permutation tests.

2.5. Foreground Selection of Gn1a and WFP Alleles

The SSR markers used to identify the lines carrying Gn1a and WFP alleles are summarized in Table 1. Genomic DNA was extracted from vacuum-dried leaf samples, as described by Dellaporta et al. [30], with minor modifications. PCR was performed in 15 µL of reaction mixture containing 50 mM KCl, 10 mM Tris–HCl (pH 9.0), 1.5 mM MgCl2, 200 µM of each dNTP, 0.2 µM of each primer, 0.75 units of Taq polymerase (Takara, Otsu, Japan), and approximately 25 ng of template DNA in a PCRmax ® Alpha Cycler (Cole-Parmer, Vernon Hills, IL, USA). The PCR program used was 95 °C for 5 min, followed by 35 cycles of 95 °C for 30 s, 55 °C for 30 s, and 72 °C for 30 s. PCR products were run in 4% agarose gels (Agarose; Sigma Aldrich, St. Louis, MO, USA) with Redsafe DNA staining solution (Chembio Ltd., St. Albans, UK), in 0.5x TBE buffer. Gel results were visualized by using an AE6933FXES−U (Atto Ltd., Tokyo, Japan) Gel Documentation System.

2.6. Recurrent Parent Genome Recovery (RPGR) Analysis

To determine RPGR, 54 progenies from seven BC2F7 populations and both parents were genotyped using GBS with a combination of the restriction enzymes, PstI and MspI. After filtering and processing of the sequence data, the single nucleotide polymorphisms (SNPs) between the parents were used to calculate the RPGR of the BC2F7 lines using the following formula [35]:
RPG (%) = [A + (0.5H)/(A + B + H)] × 100
A, B, and H represent the genotype frequencies of homozygotes for the recurrent parent, homozygotes for the donor parent, and heterozygotes, respectively. Graphical genotypes were drawn using Chromosome Substitution Strain View (CSSView, http://shigen.nig.ac.jp/shigen/tool/tool.jsp (accessed on 4 September 2023)) software.

2.7. Field Trials and Evaluation of the Agronomic Traits and Yield Performance

Field experiments were conducted at the DAR, Naypyitaw (19.8367° N, 96.2721° E), Myanmar. The promising lines were planted with 30 plants per row and eight rows per line with 20 cm × 20 cm spacing (9.6 m2 plot) for three replications. Field management was based on the standard practices of the DAR. In summary, fertilizer was applied three times: the basal dressing at the final harrowing stage, the first topdressing at the maximum tillering stage, and the second topdressing at the early panicle initiation stage. Pests and diseases were controlled using chemicals to avoid yield losses. At maturity, approximately 10 plants that were homozygous at the target loci were selected from each line and evaluated for agronomic traits. Days to heading (DTH) was determined from seeding day until 50% of plants per line were flowering. Culm length (CL) was measured from the base of the main stem (soil surface) to the base of the primary panicle. The tiller number per plant (TN) was recorded as the number of productive tillers on a single plant. PL was measured from the base to the tip of the primary panicle. PB was the total number of branches issuing directly from the peduncle. NS was calculated as the total number of spikelets per panicle. The percent fertility (PF) was measured as the total number of filled grains per panicle ×100. The thousand-grain weight (TGW) was measured as the total weight of 1000 grains.
To estimate the actual yield of each promising line, after selecting individual plants for the next generation, the remaining plants from the entire plot (9 m2, 240 plants/plot) were harvested. After the spikelets were separated from all panicles, we separated the filled and unfilled grains; then, the filled grains with husks were weighed, and the moisture content was measured using a grain moisture tester PM450 (Kett Electric Laboratory, Tokyo, Japan). The grain yield was expressed as unhulled grain weight at 14% moisture.

2.8. Evaluation of the Physical Properties and Cooking and Eating Qualities

Among the seven promising lines, the four lines selected for varietal registration were evaluated for their physical properties and cooking and eating qualities. To evaluate the physical properties of rice grains, ten random samples of de-husked rice grain and ten seeds of milled rice kernel were selected for measurements of length and width using a Vernier caliper (0.02 mm (Mitutoyo, Sakado, Japan)), and the length-to-width ratio was then calculated by dividing the length by the width. To determine the elongation ratio, 20 random kernels from each rice sample were taken, measured for length, and steamed with a rice cooker for twenty minutes. The cooked kernels were removed and placed on blotting paper using a bent wire to absorb excess water. The length of the cooked rice kernels was measured by spacing them on graph paper. The kernel elongation ratio was calculated as follows: KER = length of cooked kernels/length of raw kernels.
For evaluation of three cooking quality traits, AC, GC, and GT were evaluated at the Grain Quality Laboratory, Rice Research Section, DAR. Grain samples (100 g) were polished using a miniature polisher, and then 50 g of milled rice grains were used as the material for the grain quality test. The AC was determined by the color method using a cereal amylose tester (DPCZ-II, Zhejiang Top Cloud-Agri Technology Co. Ltd., Hangzhou, China). GC was measured according to the graphical method described by Cagampang et al. [6]. Gelatinization Temperature (GT) was measured as the alkali spread value (ASV) using the alkali digestion method described by Little et al. [7].
The physical properties of the cooked rice were measured using a Tensipresser (MyBoy texture analyzer, Takemoto Electric, Co., Tokyo, Japan) using the high-compression/low-compression method under the conditions used by Okadome et al. [36] and the continuous progressive compression method used by Okadome et al. [37] and Takeyama et al. [38].
To evaluate palatability by sensory tests [39], we used white rice polished with a Testing Husker (THU35B, Satake Corporation) and a Testing Mill (TM05C (CE model), Satake Corporation, Hiroshima, Japan). Rice samples were steamed using rice cookers (Digital Rice Cooker, HD-3000; Philips, Tokyo, Japan). Rice (300 g) was cooked at a water/rice ratio of 1.5:1. After the rice was fully cooked and the rice cooker automatically switched to warm mode, the cooked rice was gently and thoroughly mixed using a plastic ladle before being transferred to a small plastic tray for sensory evaluation. A team of 22 panelists participated in the sensory evaluation, and two replicates of each cooked rice line were evaluated for sensory traits. The sensory quality indices of the rice included overall eating quality, appearance, taste, aroma, stickiness, and hardness. The rating score ranged from −3 (considerably poor) to +3 (excellent) for overall eating quality, appearance, taste, and aroma and from −3 (considerably weak) to +3 (considerably strong) for stickiness. Hardness was graded in seven levels from −3 (considerably soft) to +3 (considerably hard), and 0 indicated that the rice matched the standard or reference rice, PSH.

2.9. Data Analyses

Agronomic data were analyzed using Microsoft Excel statistical tools (Microsoft Office Professional Plus 2019, Microsoft Corporation, Redmond, WA, USA). To determine the significant differences between the recurrent parent and promising lines, one-way analysis of variance and Student’s t-test at a 95% confidence level (α = 0.05) were used.

3. Results

3.1. MAB for the Development of Promising Lines

Initial crosses of the materials were developed at the Department of Agricultural Research (DAR) in Myanmar in 2018DS (Figure 2). Marker-assisted backcrossed breeding was performed to transfer the major genes, Gn1a and WFP, from the donor line (ST12) to PSH. RM5423 and RM8098, which flank the Gn1a locus, and RM531 and RM264, which flank the WFP locus, were used for foreground selection. The selected twenty BC1F1 plants were advanced to BC2F1, followed by the selfing of generations to identify the plants homozygous for donor alleles at the target loci. The BC2F2 progenies were genotyped using the SSR markers to ensure the presence of target genes of Gn1a and WFP (Figure 3). The BC2F2 lines with homozygous genotypes for the target loci were evaluated for target agronomic traits and advanced until BC2F7 in 2022MS, and foreground selection for target loci via SSR genotyping and phenotypic evaluation were continuously performed for every generation. Further genotyping of the BC2F7 generation was performed to verify the introgression of the donor segment and estimate the RPGR.

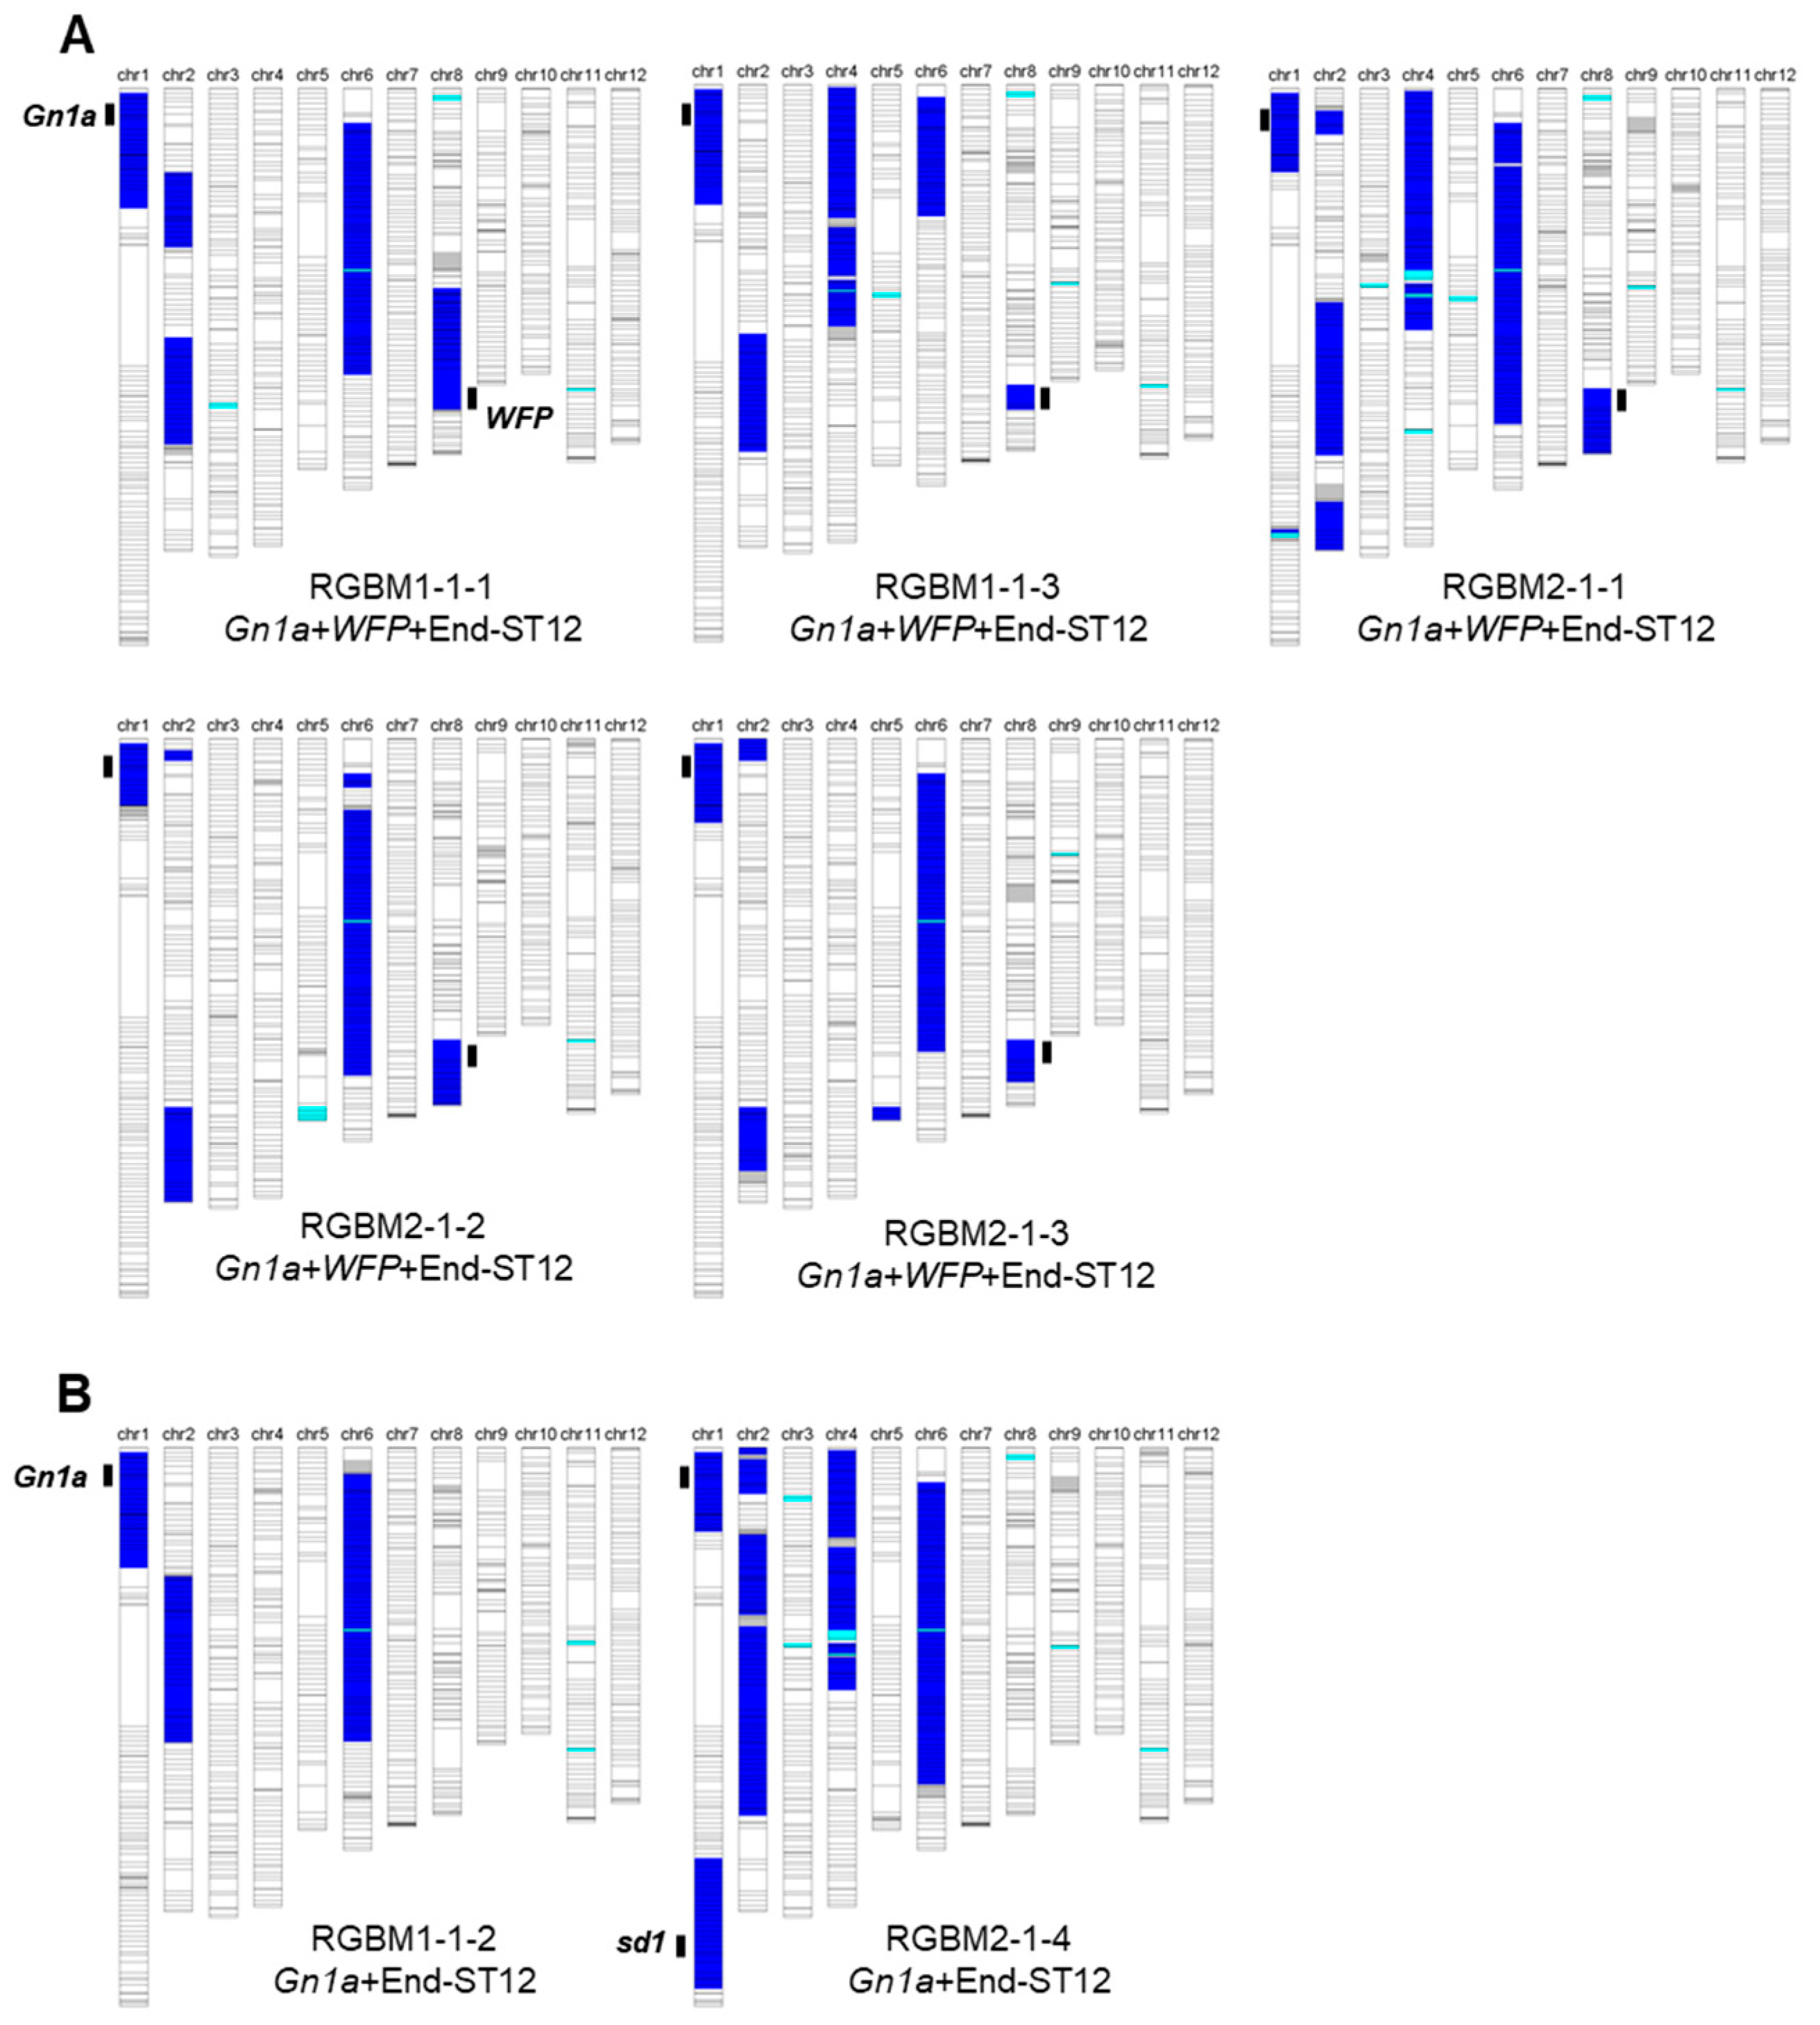
3.2. RPGR Analysis of the Promising Lines

To validate introgression and determine RPGR, 54 BC2F7 lines and both parents were genotyped using GBS and a total of 18.58 Gb of sequence data were generated, and after the initial filtering and processing, a total of 12,189 SNPs were obtained. Another set of filtering was performed, which trimmed down the SNPs every 400 kb while avoiding the recombination sites. After error correction and manual curation, an average of approximately 1000 high-quality SNPs were obtained and used for further analysis. The total number of SNPs in the RPGR range for each BC2F7 population and the RPGR of the representative BC2F7 lines from each population are summarized in Table 2.
The 34 progenies from five populations carrying a combination of both Gn1a and WFP alleles from ST12, designated as Gn1a + WFP-ST12, had an RPGR of 79.8–89.8%. Among the five populations, the RGBM2-1-3 population had the highest RPGR of 89.8%, and the RGBM2-1-1 population had the lowest RPGR of 79.8%. The graphical genotypes of the lines with the highest RPGR in each population carrying Gn1a + WFP-ST12 are shown in Figure 4A. The 20 progenies from two populations carrying only Gn1a allele from ST12, designated as Gn1a-ST12, had an RPGR of 73.7–88.4%. Among those two populations, the RGBM1-1-2 population had a higher RPGR (88.4%) than RGBM2-1-4 (76.5%). Graphical genotypes of the lines with the highest RPGR in each population carrying Gn1a-ST12 are shown in Figure 4B.

3.3. Introgression of Early Heading (Ehd) Genes into the Promising Lines

PSH exhibits strong photoperiod sensitivity and normally flowers in the 3rd week of November under natural day-length conditions. It cannot emerge panicles during the 2022DS (Figure 1A). The original F1 plants were derived from a PSH × ST12 cross that headed around 18 October 2018, and segregation in DTH was observed among the BC2F2 populations in 2019MS. The variation in DTH of some early heading lines was confirmed again in 2020DS, and only the lines that could produce panicles during the DS were selected for subsequent generations. All promising lines showed heading even in the DS and showed an average day-to-heading of 100–112 days during 2022DS and 83–94 days during 2022MS (Table 3). The average number of days to heading was longer in the DS than in the MS. To confirm the photoperiod insensitivity of these promising lines under LD conditions, they were sown three times, specifically, on 15 March, 31 March, and 15 April, in the 2022DS in DAR. All promising lines showed a stable lifespan of 94–107, 97–103, and 92–98 days for 15 March, 31 March, and 15 April, respectively (Supplementary Table S1) and consistently showed an almost stable growing period at different sowing times under LD conditions. Therefore, the promising lines would be photoperiod-insensitive lines in Naypyitaw, with a critical day length shorter than 13.35 h in the photoperiod-sensitive phase. Moreover, local yield trials using the selected promising lines were conducted in the dry and monsoon rice-growing seasons of 2023 at three different locations: Myaungmya (Ayeyarwady, 16.5834° N, 12.93 h as the longest day length in summer), Latpadan (West Bago, 17.7917° N, 13.15 h as the longest day length in summer), and Kyaukse (Mandalay, 21.6098° N, 13.33 h as the longest day length in summer). The selected promising lines, RGBM2-1-1, RGBM2-1-3, RGBM2-1-4, and RGBM1-1-2, were photoperiod-insensitive and had an average lifespan of 98–110 days during 2023DS and 88–99 days during 2023MS (Supplementary Table S2).
As the recurrent parent, PSH, exhibited strong photoperiod sensitivity, whereas the donor parent, ST12, was photoperiod-insensitive or period-fixed; early heading or photoperiod insensitivity in the promising lines was inherited from the donor parent. According to the graphical genotype of the promising lines, all lines consistently showed introgression of a short arm of chromosome 1, which involved the Gn1 region; a middle to long arm of chromosome 2; most of the middle part of chromosome 6; and a long arm of chromosome 8, which involved the WFP gene in Gn1a + WFP-ST12 lines but not in Gn1a-ST12 lines. Chromosomes 3, 4, 5, 7, 9,10, 11, and 12 were consistently conserved in the recurrent parent genome, except for chromosome 4 in RGBM2-1-4 (Figure 4). Among the donor segments consistently maintained in all promising lines, the introgressed segment on 0.72–5.72 Mb of chromosome 1 may not control the photoperiod insensitivity of the promising lines because we found one line that did not have that segment but headed in 2022DS . The other donor segments, 2.12–10.59 Mb on chromosome 6, would mainly control the photoperiod response. The 8.47 Mb spanning 2.12–10.59 Mb on chromosome 6 involves 8 cloned genes controlling heading in rice [40]: Hd17 (2.23 Mb), RFT1 (2.93 Mb), Hd3a (2.94 Mb), Hd1 (9.33 Mb), SDG711 (9.36 Mb), SE5 (2.38 Mb), OsFTIP1 (2.45 Mb), and OsNF-YC4 (2.76 Mb); one of these or an epistatic effect of more than one gene was responsible for the photoperiod insensitivity of these promising lines.

3.4. QTL Analysis of Days to Heading in the BC2F3 Population

A total of 120 and 55 BC2F3 individuals were evaluated for the segregation of heading dates in 2020DS and 2020MS, respectively. Since the dry growing season is between February and May, which have a long day length, the recurrent parent, PSH, with strong photoperiod sensitivity, could not produce panicles in the DS. Among the 120 BC2F3 individuals, 89 headed, whereas 31 individuals did not head until the end of the growing season. The segregation ratio of headed and non-headed plants was 3:1 (χ2 = 0.045, p = 0.83), indicating that a single Mendelian factor influenced heading in this population. This result suggests that a single gene governs heading in this population (Supplementary Figure S1A).
In the monsoon growing season, the recurrent parent, PSH, exhibited 120 DTH, while the donor parent, ST12, showed a DTH of 78 days. The DTH of 55 BC2F3 individuals ranged from 94 to 120 days (Supplementary Figure S1B). This result suggests a continuous distribution of DTH in this population.
GBS was performed using 55 individuals of the BC2F3 population grown in 2020MS and a total of 1911 SNPs covering 12 rice chromosomes of the mapping population were used for marker regression in single-marker analysis. A major QTL, designated qDTH6, with an LOD score of 12.68, was detected on chromosome 6 at the peak SNP 2,040,863 bp (Supplementary Figure S1C,D). qDTH6 region spans a 4.6 Mb region from SNP position 1,955,920–6,595,302 bp (Supplementary Table S3). It explained 66.08% of the phenotypic variance in this population. qDTH6 exhibited a negative additive effect of 7.79 and a negative dominant effect of 5.07, suggesting that the ST12 allele decreases the DTH in this population. The 4.6 Mb region spanning qDTH6 involves three major heading-date genes, namely Hd17/Hd3b, RFT1, and Hd3a, and these genes may be involved in the photoperiod response of these promising lines.

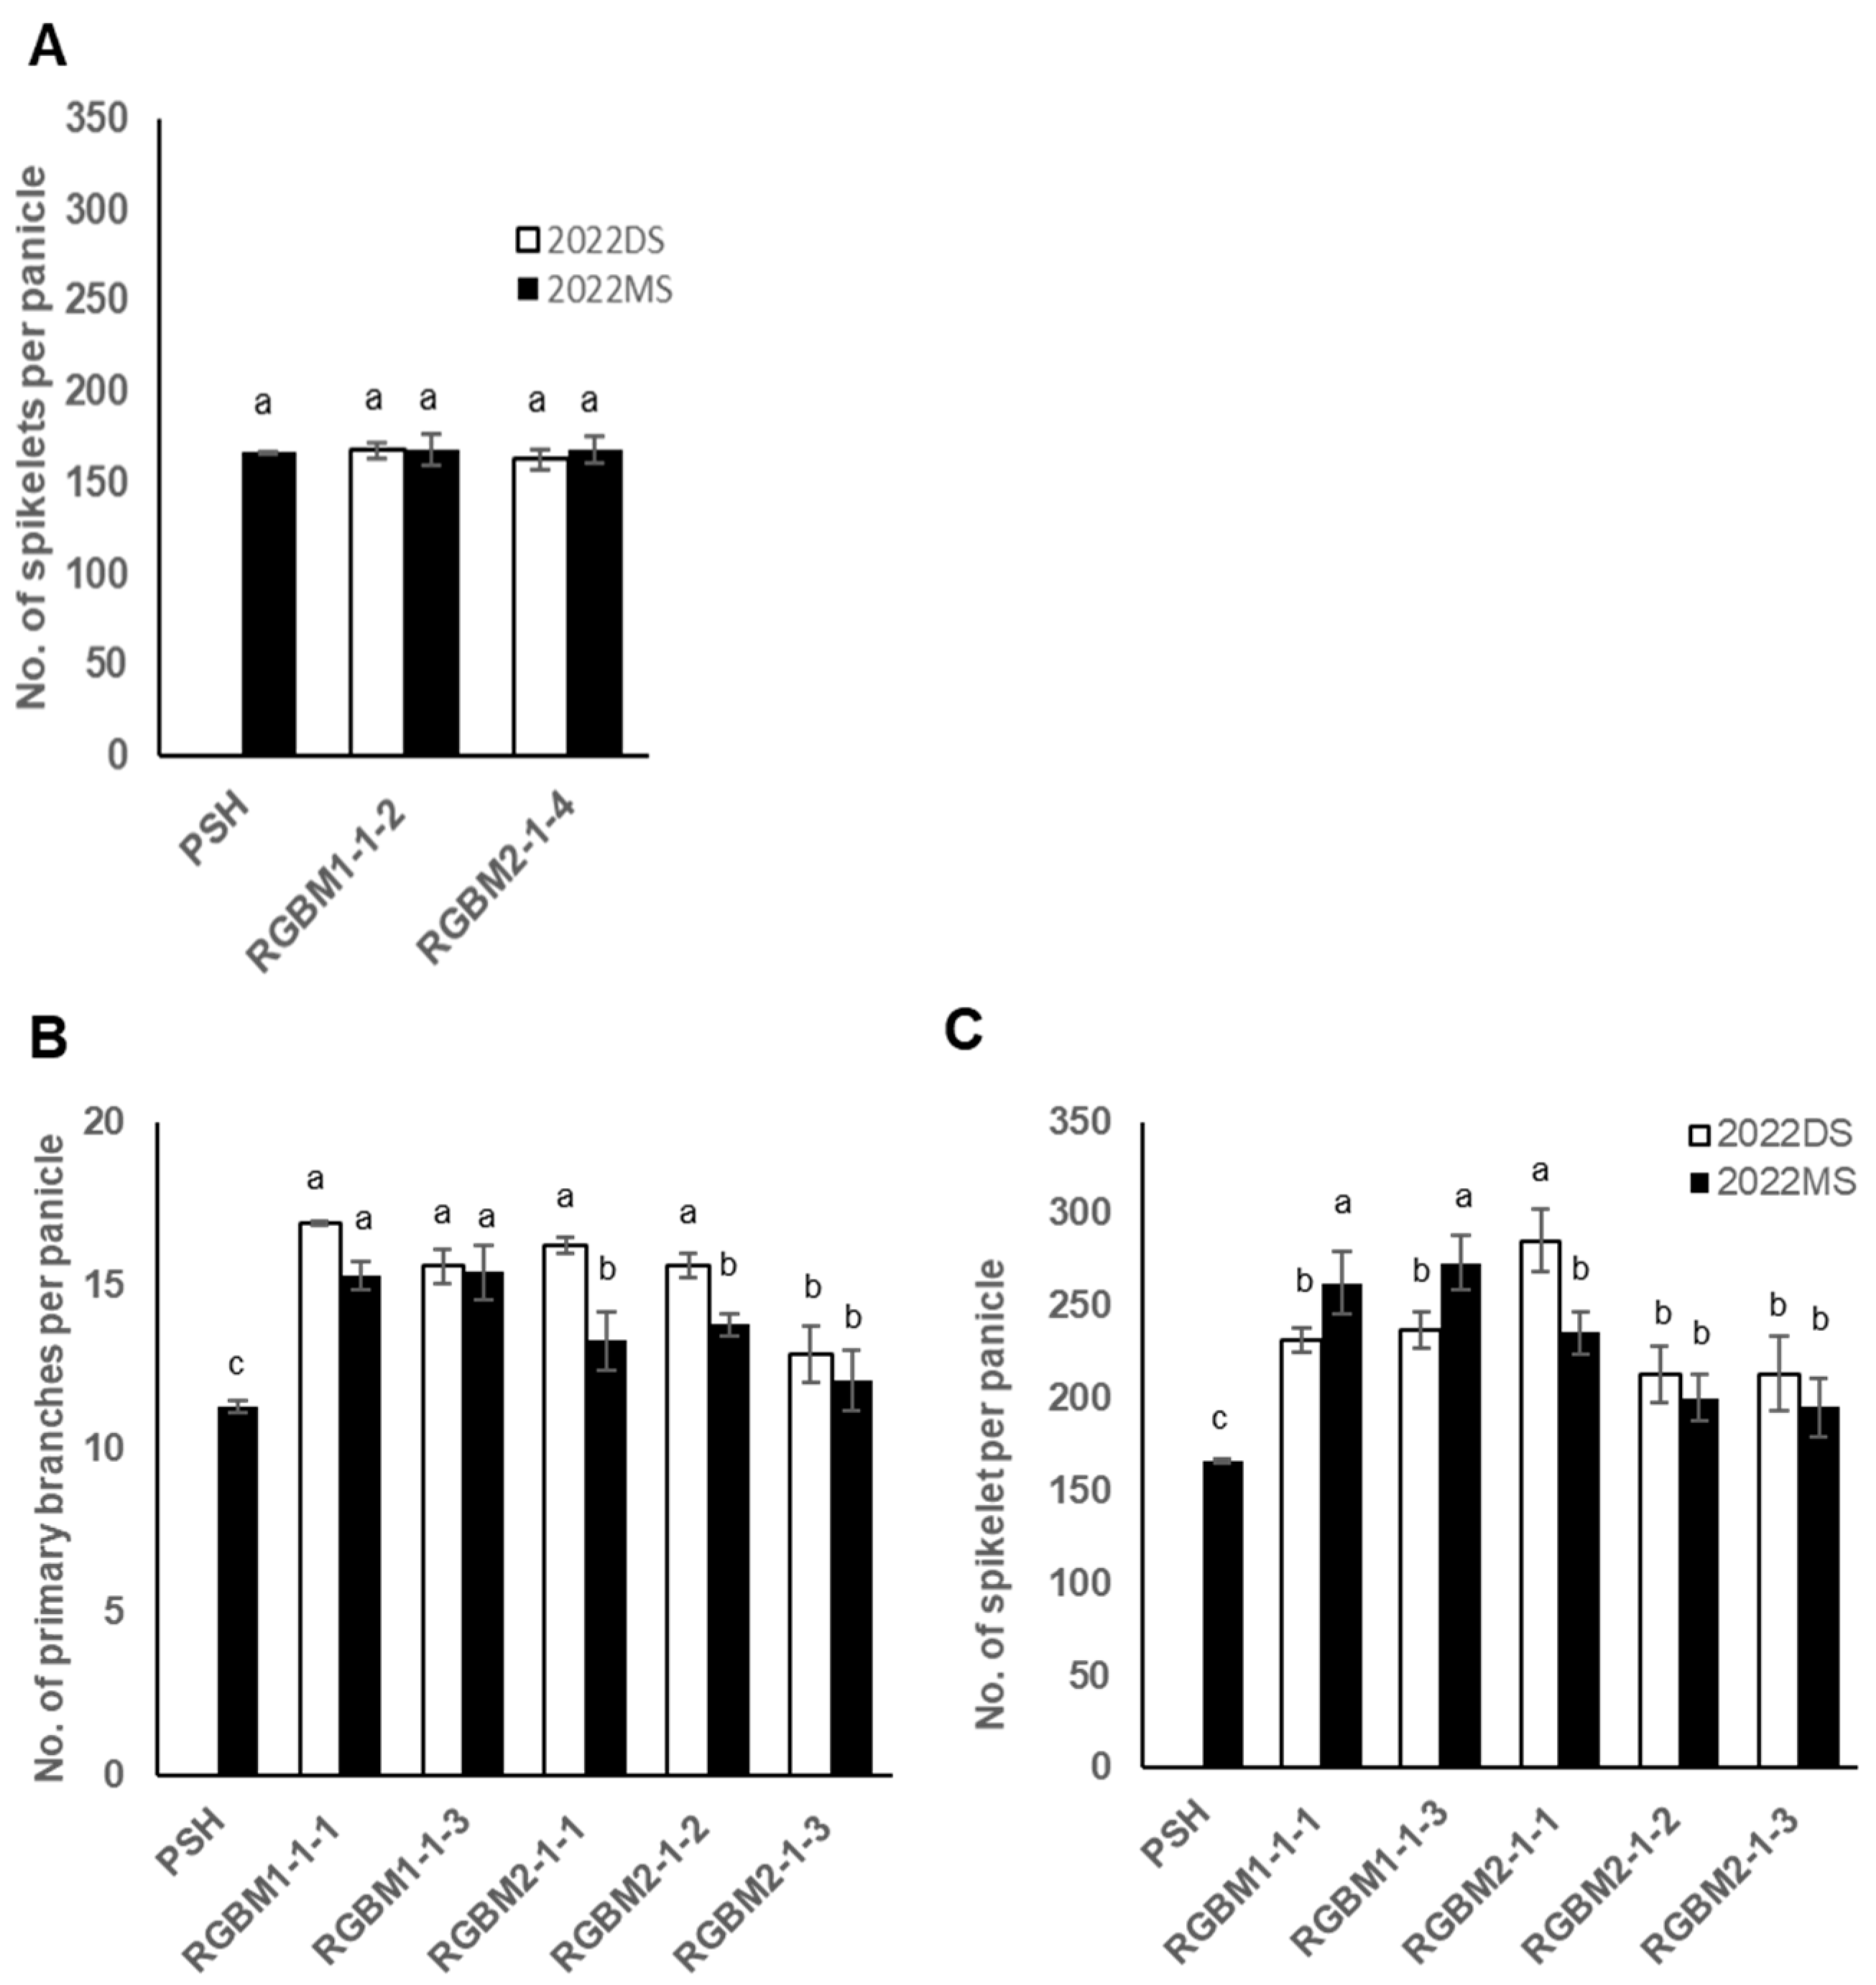
3.5. Effect of Gn1a Allele on the Spikelet Number

The effects of Gn1a on the spikelet number were evaluated during the DS and MS of 2022. On the PSH genetic background, both lines (RGBM1-1-2 and RGBM2-1-4) carrying Gn1a-ST12 showed no significant improvement in NS in either 2022DS or 2022MS (Figure 5A; Table 4).

3.6. Effects of the Combination of Gn1a and WFP Alleles on the Spikelet Number and Primary Branching

When the yield QTLs Gn1a and WFP were combined in PSH, all five lines, RGBM1-1-1, RGBM1-1-3, RGBM2-1-1, RGBM2-1-2, and RGBM2-1-3, showed a significant improvement in PB, ranging from 14.16% to 49.56% during the DS and from 7.08% to 36.28% during the MS (Figure 5B and Figure 6). Consistently, all five lines showed a significant improvement in NS, ranging from 28.27% to 71.31% during the DS and from 17.29% to 64.23% during the MS (Figure 5C and Figure 6). During the DS, RGBM1-1-3 showed comparatively high PB (16.2) and NS (285.4), whereas during the MS, RGBM2-1-1 showed the highest PB (15.4) and NS (273.6) (Table 3 and Table 4).

3.7. Agronomic Traits and Yield Performance of the Promising Lines

In this study, four other major agronomic traits (CL, TN, PL, and PF) and two yield components (TGW and grain yield) were evaluated for the 2022DS and 2022MS. CL became significantly shorter in all promising lines, ranging from 89.9 to 100.8 cm in the DS and from 88.9 to 111.5 cm in the MS. RGBM1-1-3 showed the longest CL and RGBM2-1-4 showed the shortest CL in both seasons (Table 3). The TN of the promising lines carrying Gn1a and WFP alleles was not significantly different from that of the recurrent parent, except for RGBM2-1-3 during MS, which showed a significant improvement at p < 0.05, Student’s t-test (Table 3). Among the promising lines carrying a Gn1a allele, RGBM1-1-3 showed a significant improvement in TN during the DS, whereas RGBM2-1-4 showed a significant improvement in TN during the MS (Table 3). Because PSH did not emerge panicles in DS, panicle traits and grain yield compared with the recurrent parent for the promising lines in DS were also based on PSH in MS. Among Gn1a + WFP-ST12 lines, RGBM1-1-1 and RGBM1-1-3 showed significantly improved PL, whereas RGBM2-1-2 showed significantly reduced PL during both seasons (Table 3). RGBM2-1-1 and RGBM2-1-3 showed no significant differences from the recurrent parent in PL during DS; however, they exhibited significantly reduced PL during MS (Table 3). PF was comparatively lower in the DS than in the MS for all tested lines, and the lines carrying only a Gn1a allele showed a comparatively higher PF than those carrying both Gn1a and WFP alleles (Table 4). Among the Gn1a + WFP-ST12 lines, the PF of RGBM2-1-2 and RGBM2-1-3 were not significantly different from that of the recurrent parent in either season, whereas the PF of the three remaining lines significantly decreased during both seasons (Table 4). Both Gn1a-ST12 lines showed a significant improvement in PF during the MS, whereas no significant difference was observed during the DS.
The TGW of Gn1a + WFP-ST12 lines ranged from 28.4 g to 29.6 g during the DS and 28.4 g to 31.2 g during the MS, while that of the recurrent parent was 30.2 g in the MS (Table 4). Among Gn1a-ST12 lines, RGBM2-1-4 had significantly reduced TGW in both growing seasons (Table 4). Grain yield (GY) showed a significant difference among the growing seasons, and a comparatively high grain yield was observed in the MS, except in RGBM1-1-3 (Table 4). Among Gn1a + WFP-ST12 lines, RGBM1-1-1 recorded a significantly higher GY than PSH, with the rate of increase reaching up to 16.5 and 26.7% of those of the recurrent parent in the DS and MS, respectively (Table 4). In contrast, RGBM1-1-3 showed no significant differences in GY during either of the growing seasons. Three remaining lines, RGBM2-1-1, RGBM2-1-2, and RGBM2-1-3 increased significantly GY ranged from 13.8% to 32.9% of the PSH during the MS; however, GY of those lines showed no significant difference during the DS (Table 4). Among the Gn1a-ST12 lines, RGBM1-1-2 showed consistently higher GY than PSH, with an increase rate ranging from 16.5% to 25.9% of PSH in the DS and the MS, respectively, whereas RGBM2-1-4 showed no significant differences in GY during either growing season (Table 4).

3.8. Evaluation of the Physical Properties and Cooking and Eating Qualities of the Selected Promising Lines

We examined the appearance of the polished rice grains from 2022MS; all four promising lines (RGBM2-1-1, RGBM2-1-3, RGBM1-1-2, and RGBM2-1-4) showed slightly increased grain length and width, but not significantly different from that of PSH (Table 5). The ratio of grain length to width of these lines was also not significantly different from that of PSH (Table 5). Three promising lines (RGBM2-1-1, RGBM2-1-3, and RGBM2-1-4) had similar appearances with 80–90% opacity, whereas RGBM1-1-2 showed an approximately 30% opaque grain type that was slightly different from that of the recurrent parent (Table 5). Three lines, RGBM2-1-1, RGBM2-1-3, and RGBM2-1-4, showed similar AC, ranging from 21.48 to 22.66% compared to 21.29% in the recurrent parent, whereas RGBM1-1-2 had a significantly decreased AC of 15.98% (Table 5). GC showed a similar pattern to AC; three lines with similar AC exhibited similar GC ranging from 30 to 34 mm compared to 31 mm of PSH, whereas the lower-AC line, RGBM1-1-2, exhibited increased GC up to 53 mm (Table 5). The GTs of all promising lines were very similar (75–79 °C) to that of the recurrent parent (Table 5). The elongation ratios of three lines (RGBM2-1-1, RGBM2-1-3, and RGBM2-1-4) were similar to that of PSH, ranging from 2.0 to 2.27, whereas that of RGBM1-1-2 decreased significantly to 1.69, compared to 2.3 in PSH (Table 5).
The hardness of the grain surface as measured with a Tensipresser varied among the promising lines ranging, from 727.3 to 1377.4 g/cm2, whereas that of PSH was 969.4 g/cm2 (Table 5). The stickiness of the grain surface varied from 42.78 to 88.75 g/cm2 compared to 51.65 g/cm2 of PSH (Table 5). The hardness/stickiness (H1/S1) ratio of cooked rice in textural characteristics ranged from 8.38 to 22.23 compared to 18.91 of PSH. Among the tested lines, RGBM1-1-2 showed a significantly lower H1/S1 ratio than PSH and other promising lines.
The five sensory quality indices of rice (overall eating quality, appearance, taste, aroma, and stickiness) were slightly better than those of the reference, PSH, whereas hardness showed negative values for all promising lines, indicating that the promising lines had a softer texture than PSH (Table 6). Sensory testing revealed that RGBM1-1-2 showed better palatability and greater stickiness than the other lines.

3.9. Evaluation of the Aroma-Associated Genes

Recessive Os2AP gene, located on rice chromosome 8, is associated with rice aroma trait [41,42] and plays a key role in the synthesis of 2AP [41]. Two major variations, an 8 bp deletion in exon 7 and a 3 bp insertion in exon 13 of Os2AP, control the Myanmar aromatic accessions; the latter is a major allele found in aromatic rice varieties from Myanmar [43]. To estimate the involvement of aroma in our promising lines, we evaluated the retention of the recurrent parent genome segment around the Os2AP (20.28 Mb) gene on chromosome 8 by observing the graphical genotypes. As RGBM1-1-1 has an introgressed donor segment in Os2AP region, it is a non-aromatic line. RGBM2-1-1, RGBM2-1-2, RGBM2-1-3, and RGBM1-1-2 conserved the recurrent parent segment and maintained the rice aroma similar to that of the recurrent parent. Segregation in Os2AP gene region was observed among sister lines RGBM1-1-3 and RGBM2-1-4. We selected the lines carrying the homozygous recurrent parent segment in Os2AP region as promising lines.

4. Discussion

Myanmar’s indigenous aromatic rice, PSH, is a commonly adapted high-quality rice throughout Myanmar and is widely grown in Ayeyarwady, Sagaing, and Yangon as rain-fed lowland rice. Since consumer preferences have recently changed to better-quality rice and created market requirements for high-quality rice, PSH has the potential to be a market-driven export rice for Myanmar. However, the traditional varieties of PSH are long-growth-duration varieties that reach maturity in late November to December depending on the PSH genotype [3]. The long growth duration, tall plant stature, and poor culm strength of PSH varieties makes them vulnerable to lodging. Furthermore, PSH varieties have comparatively low productivity, which increases production costs. These constraints could be overcome by developing improved PSH varieties carrying photoperiod-insensitive alleles, high-yielding QTLs, good plant stature, while maintaining the appearance, aroma, and physical and eating qualities of the traditional PSH varieties. Marker-assisted breeding (MAB) and marker-assisted backcross breeding (MABB) are efficient approaches for improving several traits across different crops. Currently, rapid advancements in sequencing technology and the availability of whole-genome rice sequencing have enhanced the efficiency of foreground selection for the transfer of the desired trait and background selection to maintain the recurrent parent genome [20,21,23].
Developing photoperiod-insensitive or early flowering rice varieties that retain the original quality of premium-quality rice would enhance adaptability to various regions and environments and efficient utilization of arable land, resulting in high productivity. The improved lines derived from the photoperiod-sensitive PSH and the photoperiod-insensitive ST12, begins heading towards the 1st week to the 3rd week of October during monsoon growing season, 30–40 days earlier than the traditional PSH. The improved lines in this study became photoperiod-insensitive at a critical day length shorter than 12.93 h (Myaungmya, lower Myanmar) to 13:33 h (Kyaukse, upper Myanmar) in the photoperiod-sensitive phase, and panicles emerged during the DS with LD conditions. Furthermore, a multi-location adaptability test of these lines in different rice-growing seasons revealed the photoperiod insensitivity of the improved lines. Because heading date is a complex trait that is affected by a combination of genetic, environmental, and physiological factors, the results of our study showed considerable variation in DTH across growing seasons, growing locations, and related environments. A globally popular aromatic rice, traditional “Basmati”, has also been improved through plant breeding methodologies to lessen its long growth duration and photoperiod sensitivity [11]. The improved varieties of traditional Basmati mature from the end of September to the 2nd week of October, when the temperature is conducive to the accumulation and retention of aroma during the grain-filling process. The improved varieties reached the harvesting stage approximately 20–30 days earlier than traditional varieties. According to the graphical genotypes of the promising lines, the introgression of 8.47 Mb (2.12–10.59 Mb) on chromosome 6 from the donor parent may be involved in the early heading of promising lines. Moreover, QTL analysis using the BC2F3 segregating population revealed that a 4.64 Mb (1.95–6.59 Mb) region spanning the major qDTH6 governs early heading in the promising lines, contributed by the donor parent ST12. Three major heading date genes, Hd17/Hd3b, RFT1, and Hd3a, located in a 4.47 Mb (2.12–6.59 Mb) region of chromosome 6, mainly govern the photosynthetic insensitivity of the promising lines individually or epistatically. This information is valuable for future breeding programs to further improve Myanmar’s famous PSH variety.
The effect of introgression of the Gn1a allele from ST12 in this study involved no significant improvement in NS in either promising line (RGBM1-1-2 and RGBM2-1-4) during both seasons, while RGBM1-1-2 showed a significant improvement in PL only during DS. This finding is similar to that of a previous study [20], in which the introgression of Gn1a alleles from Habataki, ST12, and ST6 was found to be ineffective in some indica rice cultivars because they have the same type of Gn1a allele as the donor parent. However, Furuta et al. [44] revealed that aromatic Paw San accessions are more similar to japonica than indica, but an independent cluster of japonica and intermediate types of PSH groups formed admixtures with indica. Therefore, PSH carries this type of Gn1a allele, and why Gn1a-ST12 is ineffective requires further study. However, RGBM1-1-2 had significantly increased grain yield compared to the recurrent parent during both growing seasons. Important agronomic and yield-related traits, such as increased TN, long PL, higher PF, and larger grain size with higher TGW, may contribute to the higher grain yield in RGBM1-1-2.
To enhance trait performance by combining two or more complementary genes, gene pyramiding on the same genetic background is mostly applied in MAS breeding programs for biotic and abiotic stresses [45]. However, only a few breeding programs use pyramiding of yield-enhancing traits. In this study, pyramiding of the yield-enhancing genes from the donor parent ST12 showed a significant improvement in PB and NS in both cropping seasons, suggesting the positive effects of introgression of WFP from ST12. Almost all promising lines showed no significant difference in tiller number with the recurrent parent, except for three lines, RGBM2-1-3, RGBM1-1-2, and RGBM2-1-4, which showed a slight increase in TN.
In a previous study by Jiao et al. [46], OsSPL14 from the japonica cultivar Shaoniejing significantly increased PB and NS of indica genetic background, with a significant reduction in TN. In contrast, the lines carrying the WFP-Aikawa (japonica donor) allele showed significant improvement in PB and NS but a significant reduction in TN, whereas the WFP-ST12 (indica donor) allele significantly improved PB and NS without reducing TN [20]. These results suggest that the WFP allele from a japonica donor induces a reduction in TN in the indica genetic background, which may be due to incompatibility of the japonica-indica intraspecific cross. Yamada et al. [21] found that introgression of WFP-ST12 into the genetic background of IRBB60 significantly improved PB, with a slight decrease in TN compared to that of the recipient. A recent study by [23] also revealed that TN levels in WISH lines expressing WFP-ST12 and WFP-ST6 were significantly reduced. The recipient background of the RGBM lines did not belong to japonica or indica clusters according to the PCA analysis by Furuta et al. [44]; however, PSH originated in Myanmar, as tropical areas are the origin of indica rice. Therefore, there was no specific incompatibility between the PSH group and indica, meaning that the effect of WFP-ST12 could improve PB and NS without reducing TN on the PSH genetic background. Because we do not have promising lines with introgression of the WFP-ST12 allele alone and capable of heading during the dry season, we could not compare the additive effect of pyramiding lines with that of the lines carrying the WFP-ST12 gene alone. However, the pyramiding lines carrying Gn1a + WFP showed significantly improved PB and NS compared with those carrying Gn1a-ST12 alone. However, RGBM2-1-4 carrying a Gn1a allele alone showed a comparatively high grain yield, similar to the lines carrying both Gn1a and WFP alleles in both growing seasons. The high grain yield in RGBM2-1-4 could be attributed to the higher TN, PF, and TGW. In addition to high-yielding traits, the agronomic morphology of the promising lines significantly improved the plant types, resulting, for example, in short plant stature.
In this study, background genome recovery was determined by GBS. GBS can provide not only a greater number of markers per sample but also a greater number of alleles per marker than SSR [47]. Furthermore, GBS offers a low cost per sample or data point compared to other traditional DNA markers and is becoming increasingly important as a cost-effective and unique tool for genomics-assisted breeding of a range of plant species [48]. The RPGR of the BC2 generation should theoretically be at 87.5%. Among seven promising lines, four lines showed the similar RPGR ranged from 87.1% to 89.0%. However, we observed the other three lines had an RPGR lower than the theoretical mean; RGBM1-2-4 was observed to have the lowest RPGR, at 76.5%. Neeraja et al. [49] and Yi et al. [50] also reported similar results. Additionally, Sundaram et al. [51] described a “pull” through an unknown mechanism, which leads the gene of interest to favor the transmission of additional loci from the donor gene, resulting in a percentage RPGR that is less than the theoretical mean.
Among the important agronomic traits, the plant stature of the promising lines was significantly improved, with shorter CL and erect type than the traditional PSH with higher CL and droopy leaves. This high-yield variety, including its plant stature, can be optimized to maximize the grain yield while minimizing lodging. All promising lines became shorter, with RGBM2-1-4 having the shortest CL; according to the GBS sequence data and graphical genotypes, this line showed introgression of the sd1 gene region from the donor parent ST12.
To adopt improved varieties derived from PSH by local farmers, grain appearance, cooking qualities, and eating qualities must be comparable with the specific characteristics of PSH because it is commonly accepted as premium-quality aromatic rice. The selected promising lines developed in this study have similar appearance to polished rice: approximately 80% opacity; similar cooking characteristics, such as AC, GC, and GT; and similar hardness/stickiness (H1/S1) ratio of texture characteristics, which are the distinct characteristics of PSH group varieties, except RGBM1-1-2, which showed approximately 30% opacity of polished rice appearance with a significantly lower AC, higher GC, and lower H1/S1 ratio (Table 5). According to the palatability evaluation, all selected promising lines except RGBM1-1-2 showed slightly better sensory quality indices, such as overall eating quality, appearance, taste, stickiness, and softness, than PSH, whereas RGBM1-1-2 showed better palatability and greater stickiness than the other promising lines (Table 6). Aroma is another important feature of PSH, and all selected promising lines showed a similar or greater aroma than PSH. Even though RGBM1-1-2 showed significantly different physical and physiochemical properties, its distinct, desirable stickiness similar to that of Japanese rice, combined with comparable palatability and aroma, would make it a potential PSH-derived variety for consumers who prefer stickier aromatic rice.

5. Conclusions

An indigenous high-quality rice variety from Myanmar, Paw San Hmwe, is famous for its good taste quality, strong aroma, and excellent elongation ability during cooking and is considered a market-driven export rice variety for Myanmar. However, the cultivation of PSH is limited to a single crop per year in the monsoon season with low productivity because of its strong photoperiod-sensitive nature and low yield potential. Thus, developing new photoperiod-insensitive PSH varieties with high yield potential has become a prerequisite to increase farmers’ income and national income. This study demonstrated the successful introgression of the photoperiod insensitivity trait and Gn1a and WFP alleles into Myanmar’s indigenous aromatic rice PSH using MABB, while retaining the original key characteristics, such as good taste, quality, aroma, and excellent elongation ability during cooking. The improved lines showed heading even in the dry season and headed 30–40 days earlier than PSH during the monsoon growing season. Gn1a-introgressed lines increased grain yield 16.5% to 25.5% compared to PSH in the dry and monsoon seasons, respectively. The improved lines carrying both Gn1a and WFP were significantly improved in number of primary panicle branch per panicle and number of spikelets per panicle and had an increase in their grain yield by 13.8% to 32.9% in the monsoon season except for one line, which showed no significant difference. Among two Gn1a-introgressed lines, one line showed a semi-dwarf phenotype with introgression of the sd1 gene region from the donor parent. The recurrent parent genome recovery of the improved lines ranged from 76.48% to 89.03%. The physical appearance and physiochemical properties of grain, the eating quality, and the presence of aroma were conserved in the improved lines. These rice genotypes open up the possibility of a change in crop rotation and double-season cropping of high-quality, pleasant-tasting rice. This will be the first report to improve an indigenous rice variety from Myanmar with strong photoperiod sensitivity using a marker-assisted backcross breeding method. The photoperiod insensitive nature of the improved lines would enhance adaptability to different geographical regions and multiple cropping systems, resulting in higher productivity. These improved lines could be used as intermediate parents for a further breeding program for PSH because their photoperiod-insensitive nature could shorten the breeding period.

Supplementary Materials

The following supporting information can be downloaded from https://www.mdpi.com/article/10.3390/agronomy14030632/s1, Table S1: Days to heading and heading dates of the RGBM lines grown at different times under long-day condition. Table S2: Days to heading of the selected promising lines grown at different locations in the 2023 dry and monsoon seasons. Table S3: QTL analysis of days to heading in BC2F3 population derived from PSH/ST12. Figure S1: Quantitative trait locus (QTL) analysis of days to heading in the BC2F3 population.

Author Contributions

Conceptualization, A.Y.; methodology, A.Y. and K.T.W.; software, K.T.W. and M.M.H.; validation, A.Y. and K.T.W.; formal analysis, K.T.W., M.M.H., E.R.A., A.L.L.H., Z.T.Z.M. and S.M.L.; investigation, K.T.W., K.N.O., T.N., S.M., T.L., T.A., M.S.S. and E.S.S.; resources, H.Y., M.A., M.S.T., O.M.S. and Y.M.; data curation, K.T.W.; writing—original draft preparation, K.T.W.; writing—review and editing, K.T.W., A.Y. and Y.Y.; visualization, K.T.W.; supervision, A.Y.; project administration, A.Y., H.Y., M.A., M.S.T. and N.K.W.; funding acquisition, A.Y. All authors have read and agreed to the published version of the manuscript.

Funding

This research was supported by the Science and Technology Research Partnership for Sustainable Development (SATREPS) in collaboration with the Japan Science and Technology Agency [JST; JPMJSA1706] and the Japan International Cooperation Agency (JICA).

Data Availability Statement

All data analyzed in this study are included in this article and the Supplementary Materials file.

Acknowledgments

We are grateful to Tetsuro Usui and Ko Ko Naing for their continuous support in handling and managing the JICA funds.

Conflicts of Interest

The authors declare no conflicts of interest.

References

  1. Oo, K.S.; Kongjaimun, A.; Khanthong, S.; Yi, M.; Myint, T.T.; Korinsak, S.; Siangliw, J.L.; Myint, K.M.; Vanavichit, A.; Malumpong, C.; et al. Characterization of Myanmar Paw San Hmwe accessions using functional genetic markers. Rice Sci. 2015, 22, 53–64. [Google Scholar] [CrossRef]
  2. Singh, R.K.; Singh, U.S.; Khush, G.S.; Rohilla, R.; Singh, J.P.; Singh, G.; Shekhar, K.H. Small and medium grained aromatic rices of India. In Aromatic Rices; Singh, R.K., Singh, U.S., Khush, G.S., Eds.; Science Publishers: Enfield, CT, USA; Oxford & IBH Publishing: New Delhi, India, 2000; pp. 155–179. [Google Scholar]
  3. Thet, K.M. Myanmar Paw San rice varieties. In Proceedings of the Past, Present and Future of Myanmar Paw San Hmwe Conference, Naypyitaw, Myanmar, 14–15 June 2018; Myanmar Rice Federation (MRF): Yangon, Myanmar, 2018; pp. 134–143. [Google Scholar]
  4. Juliano, B.O.; Perez, C.M.; Kaosa-Ard, M. Grain quality characteristics of export rices in selected markets. Cereal Chem. 1990, 67, 192–197. [Google Scholar]
  5. Webb, B.D. Rice quality and grades. In Rice: Production and Utilization; Luh, B.S., Ed.; AVI Pub Co.: Westport, CT, USA, 1980; pp. 543–565. [Google Scholar]
  6. Cagampang, G.B.; Perez, C.M.; Juliano, B.O. A gel consistency test for the eating quality of rice. J. Sci. Food Agric. 1973, 24, 1589–1594. [Google Scholar] [CrossRef]
  7. Little, R.R.; Hilder, G.B.; Dawson, E.H. Differential effect of dilute alkali on 25 varieties of milled white rice. Cereal Chem. 1958, 35, 111–126. [Google Scholar]
  8. Vergara, B.S.; Chang, T.T. The Flowering Response of the Rice Plant to Photoperiod, a Review of the Literature, 4th ed.; International Rice Research Institute: Los Banos, Philippines, 1985. [Google Scholar]
  9. Nishida, H.; Okumoto, Y.; Nakagawa, H.; Ichitani, K.; Inoue, H.; Tanisaka, T. Analysis of tester lines for rice (Oryza sativa L.) heading-time genes using reciprocal photoperiodic transfer treatments. Ann. Bot. 2001, 88, 527–536. [Google Scholar] [CrossRef]
  10. Khush, G.S. Green revolution: The way forward. Nat. Rev. Genet. 2001, 2, 815–822. [Google Scholar] [CrossRef]
  11. Singh, V.P. The Basmati Rice of India. In Aromatic Rices; Singh, R.K., Singh, U.S., Khush, G.S., Eds.; Science Publishers: Enfield, CT, USA; Oxford & IBH Publishing: New Delhi, India, 2000; pp. 135–154. [Google Scholar]
  12. Sarkarung, S.; Somrith, B.; Chitrakorn, S. Aromatic Rices of Thailand. In Aromatic Rices; Singh, R.K., Singh, U.S., Khush, G.S., Eds.; Science Publishers: Enfield, CT, USA; Oxford & IBH Publishing: New Delhi, India, 2000; pp. 180–183. [Google Scholar]
  13. Khush, G.S. New plant type of rice for increasing the genetic yield potential. In Rice Breeding and Genetics; Nanda, J.S., Ed.; Science Publishers: Boca Raton, FL, USA, 2000; pp. 99–108. [Google Scholar]
  14. Fan, C.; Xing, Y.; Mao, H.; Lu, T.; Han, B.; Xu, C.; Li, X.; Zhang, Q. GS3, a major QTL for grain length and weight and minor QTL for grain width and thickness in rice, encodes a putative transmembrane protein. Theor. Appl. Genet. 2006, 112, 1164–1171. [Google Scholar] [CrossRef]
  15. Song, X.J.; Huang, W.; Shi, M.; Zhu, M.Z.; Lin, H.X. A QTL for rice grain width and weight encodes a previously unknown RING-type E3 ubiquitin ligase. Nat. Genet. 2007, 39, 623–630. [Google Scholar] [CrossRef]
  16. Weng, J.; Gu, S.; Wan, X.; Gao, H.; Guo, T.; Su, N.; Lei, C.; Zhang, X.; Cheng, Z.; Guo, X.; et al. Isolation and initial characterization of GW5, a major QTL associated with rice grain width and weight. Cell Res. 2008, 18, 1199–1209. [Google Scholar] [CrossRef]
  17. Ashikari, M.; Sakakibara, H.; Lin, S.; Yamamoto, T.; Takashi, T.; Nishimura, A.; Angeles, E.R.; Qian, Q.; Kitano, H.; Matsuoka, M. Cytokinin oxidase regulates rice grain production. Science 2005, 309, 741–745. [Google Scholar] [CrossRef]
  18. Huang, X.; Qian, Q.; Liu, Z.; Sun, H.; He, S.; Luo, D.; Xia, G.; Chu, C.; Li, J.; Fu, X. Natural variation at the DEP1 locus enhances grain yield in rice. Nat. Genet. 2009, 41, 494–497. [Google Scholar] [CrossRef]
  19. Miura, K.; Ikeda, M.; Matsubara, A.; Song, X.J.; Ito, M.; Asano, K.; Matsuoka, M.; Kitano, H.; Ashikari, M. OsSPL14 promotes panicle branching and higher grain productivity in rice. Nat. Genet. 2010, 42, 545–549. [Google Scholar] [CrossRef]
  20. Kim, S.-R.; Ramos, J.M.; Hizon, R.J.M.; Ashikari, M.; Virk, P.S.; Torres, E.A.; Nissila, E.; Jena, K.K. Introgression of a functional epigenetic OsSPL14WFP allele into elite indica rice genomes greatly improved panicle traits and grain yield. Sci. Rep. 2018, 8, 3833. [Google Scholar] [CrossRef]
  21. Yamada, S.; Kurokawa, Y.; Nagai, K.; Angeles-Shim, R.B.; Yasui, H.; Furuya, N.; Yoshimura, A.; Doi, K.; Ashikari, M.; Sunohara, H. Evaluation of backcrossed pyramiding lines of the yield-related gene and the bacterial leaf blight resistant genes. J. Intl. Cooper Agric. Dev. 2020, 18, 18–28. [Google Scholar]
  22. Feng, X.; Wang, C.; Nan, J.; Zhang, X.; Wang, R.; Jiang, G.; Yuan, Q.; Lin, S. Updating the elite rice variety Kongyu 131 by improving the Gn1a locus. Rice 2017, 10, 35. [Google Scholar] [CrossRef]
  23. Reyes, V.P.; Angeles-Shim, R.B.; Mendioro, M.S.; Manuel, M.C.C.; Lapis, R.S.; Shim, J.; Sunohara, H.; Nishiuchi, S.; Kikuta, M.; Makihara, D.; et al. Marker-assisted introgression and stacking of major QTLs controlling grain number (Gn1a) and number of primary branching (WFP) to NERICA cultivars. Plants 2021, 10, 844. [Google Scholar] [CrossRef]
  24. Hasan, M.M.; Rafii, M.Y.; Ismail, M.R.; Mahmood, M.; Rahim, H.A.; Alam, M.A.; Ashkani, S.; Malek, M.A.; Latif, M.A. Marker-assisted backcrossing: A useful method for rice improvement. Biotechnol. Biotechnol. Equip. 2015, 29, 237–254. [Google Scholar] [CrossRef]
  25. Chen, S.; Lin, X.H.; Xu, C.G.; Zhang, Q. Improvement of bacterial blight resistance of ‘Minghui 63’, an elite restorer line of hybrid rice, by molecular marker-assisted selection. Crop Sci. 2000, 40, 239–244. [Google Scholar] [CrossRef]
  26. Septiningsih, E.M.; Pamplona, A.M.; Sanchez, D.L.; Neeraja, C.N.; Vergara, G.V.; Heuer, S.; Ismail, A.M.; Mackill, D.J. Development of submergence-tolerant rice cultivars: The Sub1 locus and beyond. Ann. Bot. 2009, 103, 151–160. [Google Scholar] [CrossRef]
  27. Elshire, R.J.; Glaubitz, J.C.; Sun, Q.; Poland, J.A.; Kawamoto, K.; Buckler, E.S.; Mitchell, S.E. A robust, simple Genotyping-by-Sequencing (GBS) approach for high diversity species. PLoS ONE 2011, 6, e19379. [Google Scholar] [CrossRef]
  28. Arbelaez, J.D.; Moreno, L.T.; Singh, N.; Tung, C.-W.; Maron, L.G.; Ospina, Y.; Martinez, C.P.; Grenier, C.; Lorieux, M.; McCouch, S. Development and GBS-genotyping of introgression lines (ILs) using two wild species of rice. O. meridionalis and O. rufipogon, in a common recurrent parent, O. sativa cv. Curinga. Mol. Breed. 2015, 35, 81. [Google Scholar] [CrossRef]
  29. Begum, H.; Spindel, J.E.; Lalusin, A.; Borromeo, T.; Gregorio, G.; Hernandez, J.; Virk, P.; Collard, B.; McCouch, S.R. Genome-wide association mapping for yield and other agronomic traits in an elite breeding population of tropical rice (Oryza sativa). PLoS ONE 2015, 10, e0119873. [Google Scholar] [CrossRef]
  30. Dellaporta, S.L.; Wood, J.; Hicks, J.B. A plant DNA minipreparation: Version II. Plant Mol. Biol. Rep. 1983, 1, 19–21. [Google Scholar] [CrossRef]
  31. Poland, J.A.; Brown, P.J.; Sorrells, M.E.; Jannink, J.L. Development of high-density genetic maps for barley and wheat using a novel two-enzyme genotyping-by-sequencing approach. PLoS ONE 2012, 7, e32253. [Google Scholar] [CrossRef] [PubMed]
  32. Bradbury, P.J.; Zhang, Z.; Kroon, D.E.; Casstevens, T.M.; Ramdoss, Y.; Buckler, E.S. TASSEL: Software for association mapping of complex traits in diverse samples. Bioinformatics 2007, 23, 2633–2635. [Google Scholar] [CrossRef]
  33. Fragoso, C.A.; Heffelfinger, C.; Zhao, H.; Dellaporta, S.L. Imputing genotypes in biallelic populations from low-coverage sequence data. Genetics 2016, 202, 487–495. [Google Scholar] [CrossRef] [PubMed]
  34. Broman, K.W.; Wu, H.; Sen, S.; Churchill, G.A. R/qtl: QTL mapping in experimental crosses. Bioinformatics 2003, 19, 889–890. [Google Scholar] [CrossRef] [PubMed]
  35. Benchimol, L.; Souza, C.L.D., Jr.; Souza, A.P.D. Microsatellite-assisted backcross selection in maize. Genet. Mol. Biol. 2005, 28, 789–797. [Google Scholar] [CrossRef]
  36. Okadome, H.; Toyoshima, H.; Ohtsubo, K. Multiple measurements of physical properties of individual cooked rice grains with a single apparatus. Cereal Chem. 1999, 76, 855–860. [Google Scholar] [CrossRef]
  37. Okadome, H.; Toyoshima, H.; Ohtsubo, K. Many-sided evaluation of physical properties of cooked rice grains with a single apparatus. J. Jpn. Soc. Food Sci. 1995, 43, 1004–1011. [Google Scholar] [CrossRef]
  38. Takeyama, S.; Toyama, R.; Fujiwara, Y.; Arakawa, Y. Physical properties of steamed cakes made of miscellaneous cereals. Res. Bull. Iwate Ind. Res. Inst. 1998, 5, 28. [Google Scholar]
  39. Matsue, Y. On a sensory test of cooked rice in which 10 cultivars were evaluated by 13 panel members. J. Home Econ. 1992, 43, 1027–1032. [Google Scholar]
  40. Zhou, S.; Zhu, S.; Cui, S.; Hou, H.; Wu, H.; Hao, B.; Cai, L.; Xu, Z.; Liu, L.; Jiang, L.; et al. Transcriptional and post-transcriptional regulation of heading date in rice. New Phytol. 2021, 230, 943–956. [Google Scholar] [CrossRef] [PubMed]
  41. Bradbury, L.M.T.; Fitzgerald, T.L.; Henry, R.J.; Jin, Q.; Waters, D.L.E. The gene for fragrance in rice. Plant Biotechnol. J. 2005, 3, 363–370. [Google Scholar] [CrossRef] [PubMed]
  42. Vanavichit, A.; Tragoonrung, S.; Toojinda, T.; Wanchana, S.; Kamolsukyunyong, W. Transgenic rice plants with reduced expression of Os2AP and elevated levels of 2-acetyl-1-pyrroline. U.S. Patent 7,319,181, 15 January 2008. [Google Scholar]
  43. Myint, K.M.; Courtois, B.; Risterucci, A.M.; Frouin, J.; Soe, K.; Thet, K.M.; Vanavichit, A.; Glaszmann, J.C. Specific patterns of genetic diversity among aromatic rice varieties in Myanmar. Rice 2012, 5, 20. [Google Scholar] [CrossRef] [PubMed]
  44. Furuta, T.; Saw, O.M.; Win, K.T.; Hlaing, M.M.; Yasui, H.; Ashikari, M.; Thein, M.S.; Yoshimura, A.; Yamagata, Y. Development of genomic and genetic resources facilitating molecular genetic studies on untapped Myanmar rice germplasms. Breed. Sci. 2024, in press.
  45. Dormatey, R.; Sun, C.; Ali, K.; Coulter, J.A.; Bi, Z.; Bai, J. Gene Pyramiding for Sustainable Crop Improvement against Biotic and Abiotic Stresses. Agronomy 2020, 10, 1255. [Google Scholar] [CrossRef]
  46. Jiao, Y.; Wang, Y.; Xue, D.; Wang, J.; Yan, M.; Liu, G.; Dong, G.; Zeng, D.; Lu, Z.; Zhu, X. Regulation of OsSPL14 by OsmiR156 defines ideal plant architecture in rice. Nat. Genet. 2010, 42, 541–544. [Google Scholar] [CrossRef] [PubMed]
  47. Chu, J.; Zhao, Y.; Beier, S.; Schulthess, A.W.; Stein, N.; Philipp, N.; Röder, M.S.; Reif, J.C. Suitability of single-nucleotide polymorphism arrays versus genotyping-by-sequencing for genebank genomics in wheat. Front. Plant Sci. 2020, 11, 42. [Google Scholar] [CrossRef]
  48. Kurokawa, Y.; Noda, T.; Yamagata, Y.; Angeles-Shim, R.; Sunohara, H.; Uehara, K.; Furuta, T.; Nagai, K.; Jena, K.K.; Yasui, H.; et al. Construction of a versatile SNP array for pyramiding useful genes of rice. Plant Sci. 2016, 242, 131–139. [Google Scholar] [CrossRef]
  49. Neeraja, C.N.; Maghirang-Rodriguez, R.; Pamplona, A.; Heuer, S.; Collard, B.C.; Septiningsih, E.M.; Vergara, G.; Sanchez, D.; Xu, K.; Ismail, A.M.; et al. A marker-assisted backcross approach for developing submergence-tolerant rice cultivars. Theor. Appl. Genet. 2007, 115, 767–776. [Google Scholar] [CrossRef]
  50. Yi, M.; Nwe, K.T.; Vanavichit, A.; Chai-arree, W.; Toojinda, T. Marker assisted backcross breeding to improve cooking quality traits in Myanmar rice cultivar Manawthukha. Field Crop Res. 2009, 113, 178–186. [Google Scholar] [CrossRef]
  51. Sundaram, R.M.; Vishnupriya, M.R.; Biradar, S.K.; Laha, G.S.; Reddy, G.A.; Rani, N.S.; Sarma, N.P.; Sonti, R.V. Marker assisted introgression of bacterial blight resistance in Samba Mahsuri, an elite indica rice variety. Euphytica 2008, 160, 411–422. [Google Scholar] [CrossRef]
Figure 1. Gross morphology of the parent plants used in this study. (A) Paw San Hmwe (PSH) in the dry season. (B,D) Morphology of a PSH plant (B) and panicle (D) in the monsoon season. (C,E) Morphology of an ST12 (donor parent of Gn1a and WFP) plant (C) and panicle (E). Scale bars = 20 cm for plants and 10 cm for panicles.
Agronomy 14 00632 g001
Figure 2. Marker-assisted backcross breeding for Grain number 1a (Gn1a) and Wealthy Farmer’s Panicle (WFP) introgression in PSH.
Agronomy 14 00632 g002
Figure 3. Marker-assisted selection of the progeny (BC2F2) using SSR markers flanking Gn1a and WFP. Progeny were screened using RM5423 (A) and RM8098 (B) for the Gn1a allele and RM531 (C) and RM264 (D) for the WFP allele. P1 and P2 indicates the recurrent parent and donor parent genotypes. A, B, and H refer to the recurrent parent homozygous (P1), donor homozygous (P2), and heterozygous genotypes, respectively.
Agronomy 14 00632 g003
Figure 4. Graphical genotypes of the representative plants of the promising lines. GBS markers are indicated by horizontal lines. White, dark blue, and light blue colored blocks indicate the recurrent parent, donor parent, and heterozygous regions, respectively. Chromosomes and marker positions are drawn to scale of physical lengths; positions of Gn1a,WFP and sd1 are indicated by short black bars. Representative plants with Gn1a + WFP + Ehd-ST12 (A) and Gn1a + End-ST12 (B).
Agronomy 14 00632 g004
Figure 5. Effect of the Gn1a allele and the combination of Gn1a and WFP alleles on the spikelet number and primary branching. (A) Number of spikelets per panicle (mean ± standard deviation [SD]) of the Gn1a-ST12 promising lines. (B) Number of primary panicle branches and (C) number of spikelets per panicle (mean ± SD) of the promising lines of Gn1a + WFP-ST12. White and solid bars show the results of 2022DS and 2022MS, respectively. Different letters above the bar graphs indicate significant differences at p < 0.05 by Student’s t-test.
Agronomy 14 00632 g005
Figure 6. Gross morphology of the plants and panicles of the promising lines in the 2022 dry season. Scale bars = 20 cm for plant and 10 cm for panicle.
Agronomy 14 00632 g006
Table 1. Simple sequence repeat (SSR) markers used for genotyping of Grain number 1a (Gn1a) and Wealthy Farmer’s Panicle (WFP) to develop new, promising lines.
MarkerForward Primer SequenceReverse Primer SequenceTarget GeneChr.Position (Mb) *
RM5423ATCCCACTTGCAGACGTAGGACAGCAGCAAGGTGCCTCGn1a12.17
RM8098GATACCGTTACGCCTATTCAGTAGTGGGCTTGATGAACTTGATTTCGTTGCAGTACAGn1a17.25
RM531GAAACATCCCATGTTCCCACTCGGTTTTTCAGACTCGGTCWFP822.47
RM264GTTGCGTCCTACTGCTACTTCGATCCGTGTCGATGATTAGCWFP827.93
* indicates the physical position in the Nipponbare reference genome (Os-Nipponbare-Reference-IRGSP-1.0).
Table 2. Total number of single nucleotide polymorphisms (SNPs) and recurrent parent genome recovery in the promising lines.
Line NameDesignationTotal No. of SNPsRecurrent Parent Genome Recovery Range of BC2F7 Population (%)Recurrent Parent Genome Recovery of Selected BC2F7 Lines (%)
RGBM1-1-1Gn1a + WFP + Ehd-ST12-191283.7–84.083.9
RGBM1-1-3Gn1a + WFP + Ehd-ST12-292284.4–87.587.2
RGBM2-1-1Gn1a + WFP + Ehd-ST12-391679.8–80.579.8
RGBM2-1-2Gn1a + WFP + Ehd-ST12-491584.4–88.688.6
RGBM2-1-3Gn1a + WFP + Ehd-ST12-592188.8–89.889.0
RGBM1-1-2Gn1a + Ehd-ST12-191987.6–88.487.7
RGBM2-1-4Gn1a + Ehd-ST12-292273.7–76.576.5
RGBM indicates Rice Genomic Breeding in Myanmar.
Table 3. Mean ± standard deviation (SD) values of the agronomic traits of the RGBM lines with Gn1a-ST12 and Gn1a + WFP-ST12 introgression.
Line NameDTHCL (cm)TNPL (cm)PB
DSMSDSMSDSMSDSMSDSMS
PSH-123 ± 0.0-134.3 ± 1.9-9.5 ± 0.5-25.7 ± 0.7-11.3 ± 0.3
ST1285 ± 078 ± 0.060.6 ± 3.565.3 ± 3.510.1 ± 0.59.20 ± 1.523.0 ± 1.923.4 ± 0.517.7 ± 0.515.4 ± 1.9
RGBM1-1-1112 ± 0 *94 ± 0.0 *103.4 ± 2.3 *106.8 ± 3.8 *8.4 ± 0.311.0 ± 1.626.8 ± 0.6 *27.2 ± 1.9 *16.9 ± 0.1 *15.3 ± 1.2 *
RGBM1-1-3104 ± 0 *87 ± 0.0 *108.3 ± 2.5 *111.5 ± 1.6 *8.5 ± 0.810.5 ± 0.727.9 ± 0.6 *27.6 ± 1.5 *15.6 ± 1.1 *15.4 ± 1.6 *
RGBM2-1-1100 ± 0 *83 ± 0.0 *98.4 ± 5.5 *101.3 ± 4.0 *10.6 ± 1.89.8 ± 0.626.1 ± 1.523.3 ± 1.0 *16.2 ± 0.5 *13.3 ± 1.8 *
RGBM2-1-2102 ± 0 *89 ± 0.0 *96.4 ± 1.3 *95.9 ± 1.9 *11.6 ± 1.111.4 ± 1.923.8 ± 1.5 *22.4 ± 0.3 *15.6 ± 0.8 *13.8 ± 0.7 *
RGBM2-1-3100 ± 0 *85 ± 0.0 *94.6 ± 4.2 *101.8 ± 3.9 *11.8 ± 1.712.4 ± 1.7 *25.5 ± 0.723.2 ± 0.2 *12.9 ± 1.7 *12.1 ± 1.9 *
RGBM1-1-2105 ± 0 *90 ± 0.0 *102.8 ± 2.4 *105.5 ± 1.9 *12.1 ± 0.9 *11.8 ± 1.627.7 ± 0.2 *25.1 ± 0.49.1 ± 0.2 *8.9 ± 0.19 *
RGBM2-1-4105 ± 0 *94 ± 0.0 *89.8 ± 1.1 *88.9 ± 5.6 *11.5 ± 1.012.4 ± 1.5 *25.9 ± 0.724.0 ± 1.1 *9.2 ± 0.2 *8.6 ± 0.37 *
DTH: days to heading; CL: culm length; TN: tiller number per plant; PL: panicle length; PB: number of primary branches per panicle; DS: dry season; MS: monsoon season. Numbers represent the average ± standard error. - indicates no data, as PSH cannot head during the dry season. * indicates that the line is significantly different from that of the recurrent parent (p < 0.05) by Student’s t-test. As PSH did not head in the DS, the agronomic traits of the promising lines in the DS were compared with those of PSH in the MS.
Table 4. Mean ± SD values of the yield and yield-related traits of the RGBM lines with Gn1a-ST12 and Gn1a + WFP-ST12 introgression.
Line NameNSPFTGW (g)GY (kg/ha)
DSMSDSMSDSMSDSMS
PSH-166.6 ± 1.9-81.8 ± 1.3-30.2 ± 0.3-5882.4 ± 142.0
ST12235.5 ± 26.2195.6 ± 26.269.6 ± 5.681.7 ± 4.021.2 ± 0.221.6 ± 0.86301.6 ± 791.25233.4 ± 438.5
RGBM1-1-1231.8 ± 13.8 *262.6 ± 34.3 *65.1 ± 5.6 *72.8 ± 5.7 *28.7 ± 0.7 *28.4 ± 0.5 *6851.0 ± 960.1 *7029.1 ± 959.1 *
RGBM1-1-3237.1 ± 20.2 *273.6 ± 29.4 *66.9 ± 3.9 *71.9 ± 4.7 *29.6 ± 0.229.4 ± 0.96086.9 ± 721.85829.6 ± 459.0
RGBM2-1-1285.4 ± 34.1 *235.6 ± 23.4 *66.9 ± 1.8 *72.2 ± 4.1 *28.4 ± 0.1 *29.6 ± 0.25493.4 ± 217.57240.1 ± 699.9 *
RGBM2-1-2213.1 ± 30.2 *200.6 ± 25.9 *74.4 ± 5.584.6 ± 0.629.3 ± 0.5 *29.4 ± 0.2 *5774.8 ± 491.87349.8 ± 814.7 *
RGBM2-1-3213.7 ± 26.1 *195.4 ± 31.6 *77.5 ± 2.983.3 ± 3.929.6 ± 0.530.2 ± 0.3 *5961.7 ± 807.87096.7 ± 160.3 *
RGBM1-1-2167.9 ± 8.9168.4 ± 16.879.1 ± 2.691.7 ± 0.9 *30.7 ± 0.331.2 ± 0.5 *6853.0 ± 643.0 *7408.8 ± 180.0 *
RGBM2-1-4162.8 ± 11.4168.0 ± 14.383.4 ± 7.791.6 ± 3.2 *25.8 ± 0.2 *26.9 ± 0.2 *6126.0 ± 1327.66296.0 ± 723.8
NS: number of spikelets per panicle; PF: percent fertility; TGW: thousand grain weight; GY: grain yield; DS: dry season; MS: monsoon season. Numbers represent the average ± standard error. - indicates no data, as PSH cannot head during the dry season. * indicates that the line is significantly different from that of the recurrent parent (p < 0.05) by Student’s t-test. As PSH did not head in the DS, the yield-related traits and grain yield of the promising lines in the DS were compared with those of PSH in the MS.
Table 5. Physiochemical properties of the grains of selected promising lines.
Line NameGL (mm)GW (mm)L/W RatioAppearance of Polished RiceAC (%)GC (mm) GT (°C)Elongation RatioHardness (H1)Stickiness (S1)H1/S1
PSH7.53.02.5~80% opaque21.33175–792.3969.451.718.9
RGBM2-1-18.13.02.7~80% opaque21.93475–792.1727.342.817.3
RGBM2-1-38.33.02.7~80% opaque22.73075–792.31192.454.622.2
RGBM1-1-28.33.52.4~30% opaque16.05375–791.7753.888.88.4
RGBM2-1-47.93.52.3~90% opaque22.03075–792.01377.485.816.0
GL, grain length; GW, grain width; L/W ratio, length to width ratio; appearance, appearance of polished rice; AC, amylose content; GC, gel consistency; GT, gelatinization temperature; H1/S1, hardness/stickiness ratio.
Table 6. Palatability of the selected promising lines.
Line NameOverall Eating QualityAppearanceTasteAromaStickinessHardness
PSH000000
RGBM2-1-10.66 *0.53 *0.390.250.24−0.21
RGBM2-1-30.72 *0.74 *0.76 *0.46 *0.38 *−0.51 *
RGBM1-1-20.85 *1.14 *0.87 *0.42 *0.89 *−0.96 *
RGBM2-1-40.76 *0.66 *0.51 *0.350.41 *−0.10
* indicates that the line is significantly different from that of the recurrent parent (Student’s t-test, p < 0.05).
Disclaimer/Publisher’s Note: The statements, opinions and data contained in all publications are solely those of the individual author(s) and contributor(s) and not of MDPI and/or the editor(s). MDPI and/or the editor(s) disclaim responsibility for any injury to people or property resulting from any ideas, methods, instructions or products referred to in the content.

