Article

Mechanisms Underlying the Differential Sensitivity to Mesotrione in Sweet Corn

Institute of Maize and Featured Upland Crops, Zhejiang Academy of Agricultural Sciences, Dongyang 322100, China
*
Authors to whom correspondence should be addressed.
These authors contributed equally to this work.
Agronomy 2024, 14(3), 555; https://doi.org/10.3390/agronomy14030555
Submission received: 6 February 2024 / Revised: 28 February 2024 / Accepted: 2 March 2024 / Published: 8 March 2024
(This article belongs to the Section Plant-Crop Biology and Biochemistry)

Abstract

:
Mesotrione is a widely used post-emergence herbicide for maize. The toxicity of mesotrione to maize (especially sweet corn) has been widely reported, and some sweet corn varieties are highly sensitive to mesotrione, which affects subsequent plant growth periods. However, the molecular mechanisms responsible for the differences in susceptibility to mesotrione are not known. By comparing changes in the transcriptome of mesotrione-tolerant line 301 and mesotrione-sensitive line 276 after mesotrione treatment, we found that the genes coding light-harvesting chlorophyll protein complex were induced in 301, and the genes coding loosening cell walls were overrepresented in 276. The net photosynthetic rate, maximum photochemical efficiency of leaf PSII, photochemical quenching of chlorophyll fluorescence, and the electron transport rate were significantly higher in 301 than in 276 after mesotrione treatment, and these effects became more severe as time passed. In addition, oxidative balance was also affected by mesotrione. Compared with 301, SOD, POD, and CAT activities were significantly reduced with longer exposure time in 276. The results suggested that sweet corn can mitigate herbicide mesotrione toxicity by improving photosynthesis, ROS scavenging, and cell wall synthesis.

1. Introduction

Mesotrione is a triketone herbicide with high activity, low potential for groundwater contamination, and low toxicity to mammals [1]. In addition to a wide range of annual and perennial grass weeds, the herbicide also provides some degree of control of some broadleaf weeds. Therefore, mesotrione is usually used in combination with broadleaf herbicides to control weeds over a broad spectrum [2].
The triketide herbicide is an HPPD-inhibiting herbicide developed by Syngenta (Switzerland) [3]. HPPD is present in plants and catalyzes the synthesis of plastoquinone and tocopherol, i.e., it catalyzes the oxidative decarboxylation of 4-hydroxypyruvic acid to urourocanic acid [4]. The conversion is a complex reaction involving oxidative decarboxylation of the substrate 2-ketoacid and hydroxylation of the benzene ring as well as the transfer of the 1, 2-carboxymethyl group. Meanwhile, since HPPD has isoprenoid precursors, it plays an important role in tyrosine degradation and participates in related metabolic reactions as a key carrier for the protection of photosynthesizing cells. HPPD inhibitors were found in many organisms and are involved in the conversion of tyrosine to plastoquinone [3]. Plastoquinone is a PDS cofactor and a key enzyme involved in carotenoid biosynthesis [5]. Tyrosine accumulation and plastoquinone deficiency in the cells of plant meristematic tissues after the application of HPPD inhibitors resulted in yellowing and whitening of leaves, and the plant ultimately died due to the whitening of leaves and the inability to photosynthesis properly. Crops can increase resistance to triketone herbicides by modulating the activity of related enzymes. Pandian et al. bred a new sorghum variety highly resistant to HPPD-inhibiting herbicides. The herbicides can be metabolized rapidly in the sorghum variety and the resistance trait was an incompletely dominant trait controlled by multiple genes with eight quantitative trait loci [6]. The mechanism underlying amaranth resistance to mesotrione was non-target-site resistance. In amaranth, herbicide detoxification was achieved by increasing the efficiency of plant metabolism after herbicide application and improving the expression of HPPD-related genes can also lead to the development of resistance [7]. Multiple generations of selection resulted in amaranth varieties resistant to mesotrione, with increased expression levels of HPPD-related genes and enhanced metabolism in the F3 generation compared to the parental varieties [8].
Sweet corn (Zea mays L. saccharata Sturt) is a very popular vegetable because of its relatively high sugar content, pleasant flavor, tenderness, juiciness, and high nutritional value [9]. Therefore, sweet corn has broad market prospects. With the increase in sweet corn planting area and market demand, herbicide has become an effective means to control weeds and improve yield. The triketone herbicide mesotrione is a widely used post-emergence herbicide in corn fields [10]. Although herbicides can prevent and control weeds, promote crop growth, and improve the yield of agricultural products, they can sometimes cause some damage or negative impacts on crops. Differences in response to mesotrione were observed among different sweet corn varieties [11,12]. In light of this, we wondered which mechanism is responsible for the differences in susceptibility to mesotrione. In this study, we compared the changes in the transcriptomes of mesotrione-tolerant line “301” and mesotrione-sensitive line “276” after mesotrione treatment and identified a series of genes that were likely responsible for sweet corn’s response to mesotrione. We then employed biochemical experiments to analyze the effects of mesotrione on physiological changes in mesotrione-tolerant line “301” and mesotrione-sensitive line “276”. Therefore, this study will enrich our knowledge of the genetic basis of mesotrione-tolerant sweet corn genotype and provide important clues for molecular-assisted screening and breeding of mesotrione-tolerant cultivars for sweet corn.

2. Materials and Methods

2.1. Plant Materials and Mesotrione Treatments

A pair of sister lines of sweet corn (mesotrione-tolerant line 301 and mesotrione-sensitive line 276) was chosen for this study. They were named the T line and the S line, respectively. The inbred lines used in the manuscript were bred by the Zhejiang Academy of Agricultural Sciences. Mesotrione screening had been performed previously. The seeds of T and S were surface sterilized with 70% ethanol for 1 min followed by incubation for 3 min in 3% sodium hypochlorite (NaClO, Sangon, Shanghai, China) solution and rinsing with sterilized water to remove NaClO. The sterilized seeds were germinated in petri dishes with moist filter paper and cultured for 3 days at 22 °C in the dark. Each seedling was then moved to pots containing plant ash, vermiculite, and Pindstrup soil mix (Denmark) (3:1:1). The pods were moved into a greenhouse at Zhejiang Academy of Agricultural Sciences (Dongyang, China) and grown for 20 days under a 16-h light/8-h dark photoperiod at 25 to 27 °C. The irradiance in the growth chamber was 200 μmol∙m−2s−1. Maize seedlings at the four-leaf stage were divided into two groups that were either sprayed with H2O or 0.3 g/L mesotrione (Zhejiang Zhongshan Chemical Industry Group Co. Ltd., Huzhou, China).

2.2. Transcription Sequencing and Data Analysis

Leaves tissues from H2O-treated and mesotrione-treated plants for both T and S genotypes were collected as pooled leaf tissues from three individual plants at designated timepoints according to the experimental design. A total of 24 samples consisted of those for two genotypes with two treatments (H2O-treated and mesotrione-treated) and three biological replicates at two timepoints (48 h and 72 h after treatments).
Total RNA was isolated using Trizol (ThermoFisher, Waltham, MA, USA). mRNA was enriched by Oligo (dT) beads. The cDNA library was constructed using the NEBNext Ultra RNA Library Prep Kit for Illumina (New England Biolabs, Ipswich, MA, USA) and sequenced on Illumina Novaseq6000 by Gene Denovo Biotechnology Co. (Guangzhou, China). Sequencing reads were mapped to the reference genome (Zm-B73-REFERENCE-NAM-5.0). Gene abundances were estimated using RSEM software v. 1.2.11. Differentially expressed genes (DEGs) were identified using DESeq2 software v. 1.20.0 with the parameter of false discovery rate (FDR) below 0.05 and absolute fold change ≥2.

2.3. Determination of Chlorophyll Fluorescence Parameters

Chlorophyll fluorescence was measured using a modulated fluorometer (PAM-2500; Walz, Effeltrich, Germany). By using the equations, the maximal quantum yield of PSII photochemistry (Fv/Fm), the effective quantum yield of PSII photochemistry (ΦPSII), and the electron transport rate (ETR) were calculated [13]. Calculations were also undertaken to determine the photochemical quenching coefficient (qP) and nonphotochemical quenching (NPQ), respectively: qP = F m     F s F m     F 0 ; NPQ = F m     F m F m .

2.4. C4 Pathway-Related Enzyme Activity Assay

A C4 pathway-related enzyme activity assay was performed following the method used in the work by Wang et al. [14]. The measurement of phosphoenolpyruvate carboxylase (PEPC) activity was performed using the PEPC Activity Assay Kit (Solarbio, Beijing, China). PEPC activity was articulated as U/g. Measurement of NADP-malate dehydrogenase (NAD-MDH) activity was performed using the NADP-MDH Activity Assay Kit (Solarbio, Beijing, China). NADP-MDH activity was articulated as U/g. Measurement of NADP malic enzyme (NADP-ME) activity was performed using the NADP-ME Activity Assay Kit (Solarbio, Beijing, China). NADP-ME activity was articulated as U/g. Measurement of pyruvate phosphate dikinase (PPDK) activity was performed using the PPDK Activity Assay Kit (Solarbio, Beijing, China). PPDK activity was articulated as U/g.

2.5. Observation of Chloroplast Structure

The observation of chloroplast structure was performed following the method used in the work by Wang et al. [14]. Transmission electron microscopy was utilized to observe the ultrastructure of chloroplasts. The leaf samples were fixed in a solution of 2.5% glutaraldehyde in phosphate buffer (pH 7.2) for 4 h at 4 °C. Then, the samples were washed three times in 0.1 mM sodium phosphate buffer, fixed with 1% osmium tetroxide, and cleaned again. The cleaned samples were then dehydrated with alcohol and impregnated with and embedded in resin. Ultrathin sections were extracted on a copper grid and stained with uranyl acetate solution for 2 min. The chloroplast ultrastructure of samples was observed using a transmission electron microscope (Hitachi H-7650, Hitachi Corp., Tokyo, Japan).

2.6. Superoxide Anion Content and Hydrogen Peroxide Content Assay

A superoxide anion content and hydrogen peroxide content assay were performed following the method used in the work by Wu et al. [15]. Measurement of superoxide anion content was performed using the Superoxide Anion Content Assay Kit (Solarbio, Beijing, China). Superoxide anion content was articulated as µmol/g. Measurement of hydrogen peroxide content was performed using the Hydrogen Peroxide Content Assay Kit (Solarbio, Beijing, China). Hydrogen peroxide content was articulated as µmol/g.

2.7. Determination of Antioxidant Enzymatic Activity

An antioxidant enzymatic activity assay was performed following the method used in the work by Wu et al. [15]. Measurement of peroxidase (POD) activity was performed using the POD Activity Assay Kit (Solarbio, Beijing, China). POD activity was articulated as U/g. Measurement of superoxide dismutase (SOD) activity was performed using the SOD Activity Assay Kit (Solarbio, Beijing, China). SOD activity was articulated as U/g. Measurement of catalase (CAT) activity was performed using the CAT Activity Assay Kit (Solarbio, Beijing, China). CAT activity was articulated as U/g. Measurement of ascorbate peroxidase (APX) activity was performed using the APX Activity Assay Kit (Solarbio, Beijing, China). APX activity was articulated as U/g.

2.8. Statistical Analysis

Data processing and mapping were undertaken using Microsoft Excel 2016 and SigmaPlot 12.5. Analysis of variance (ANOVA) and mean values were compared using Duncan’s multiple range test and the least significant difference (LSD) test in SPSS 14.0 (SPSS Inc., Chicago, IL, USA). Significant differences were identified at the p < 0.05 threshold.

3. Results

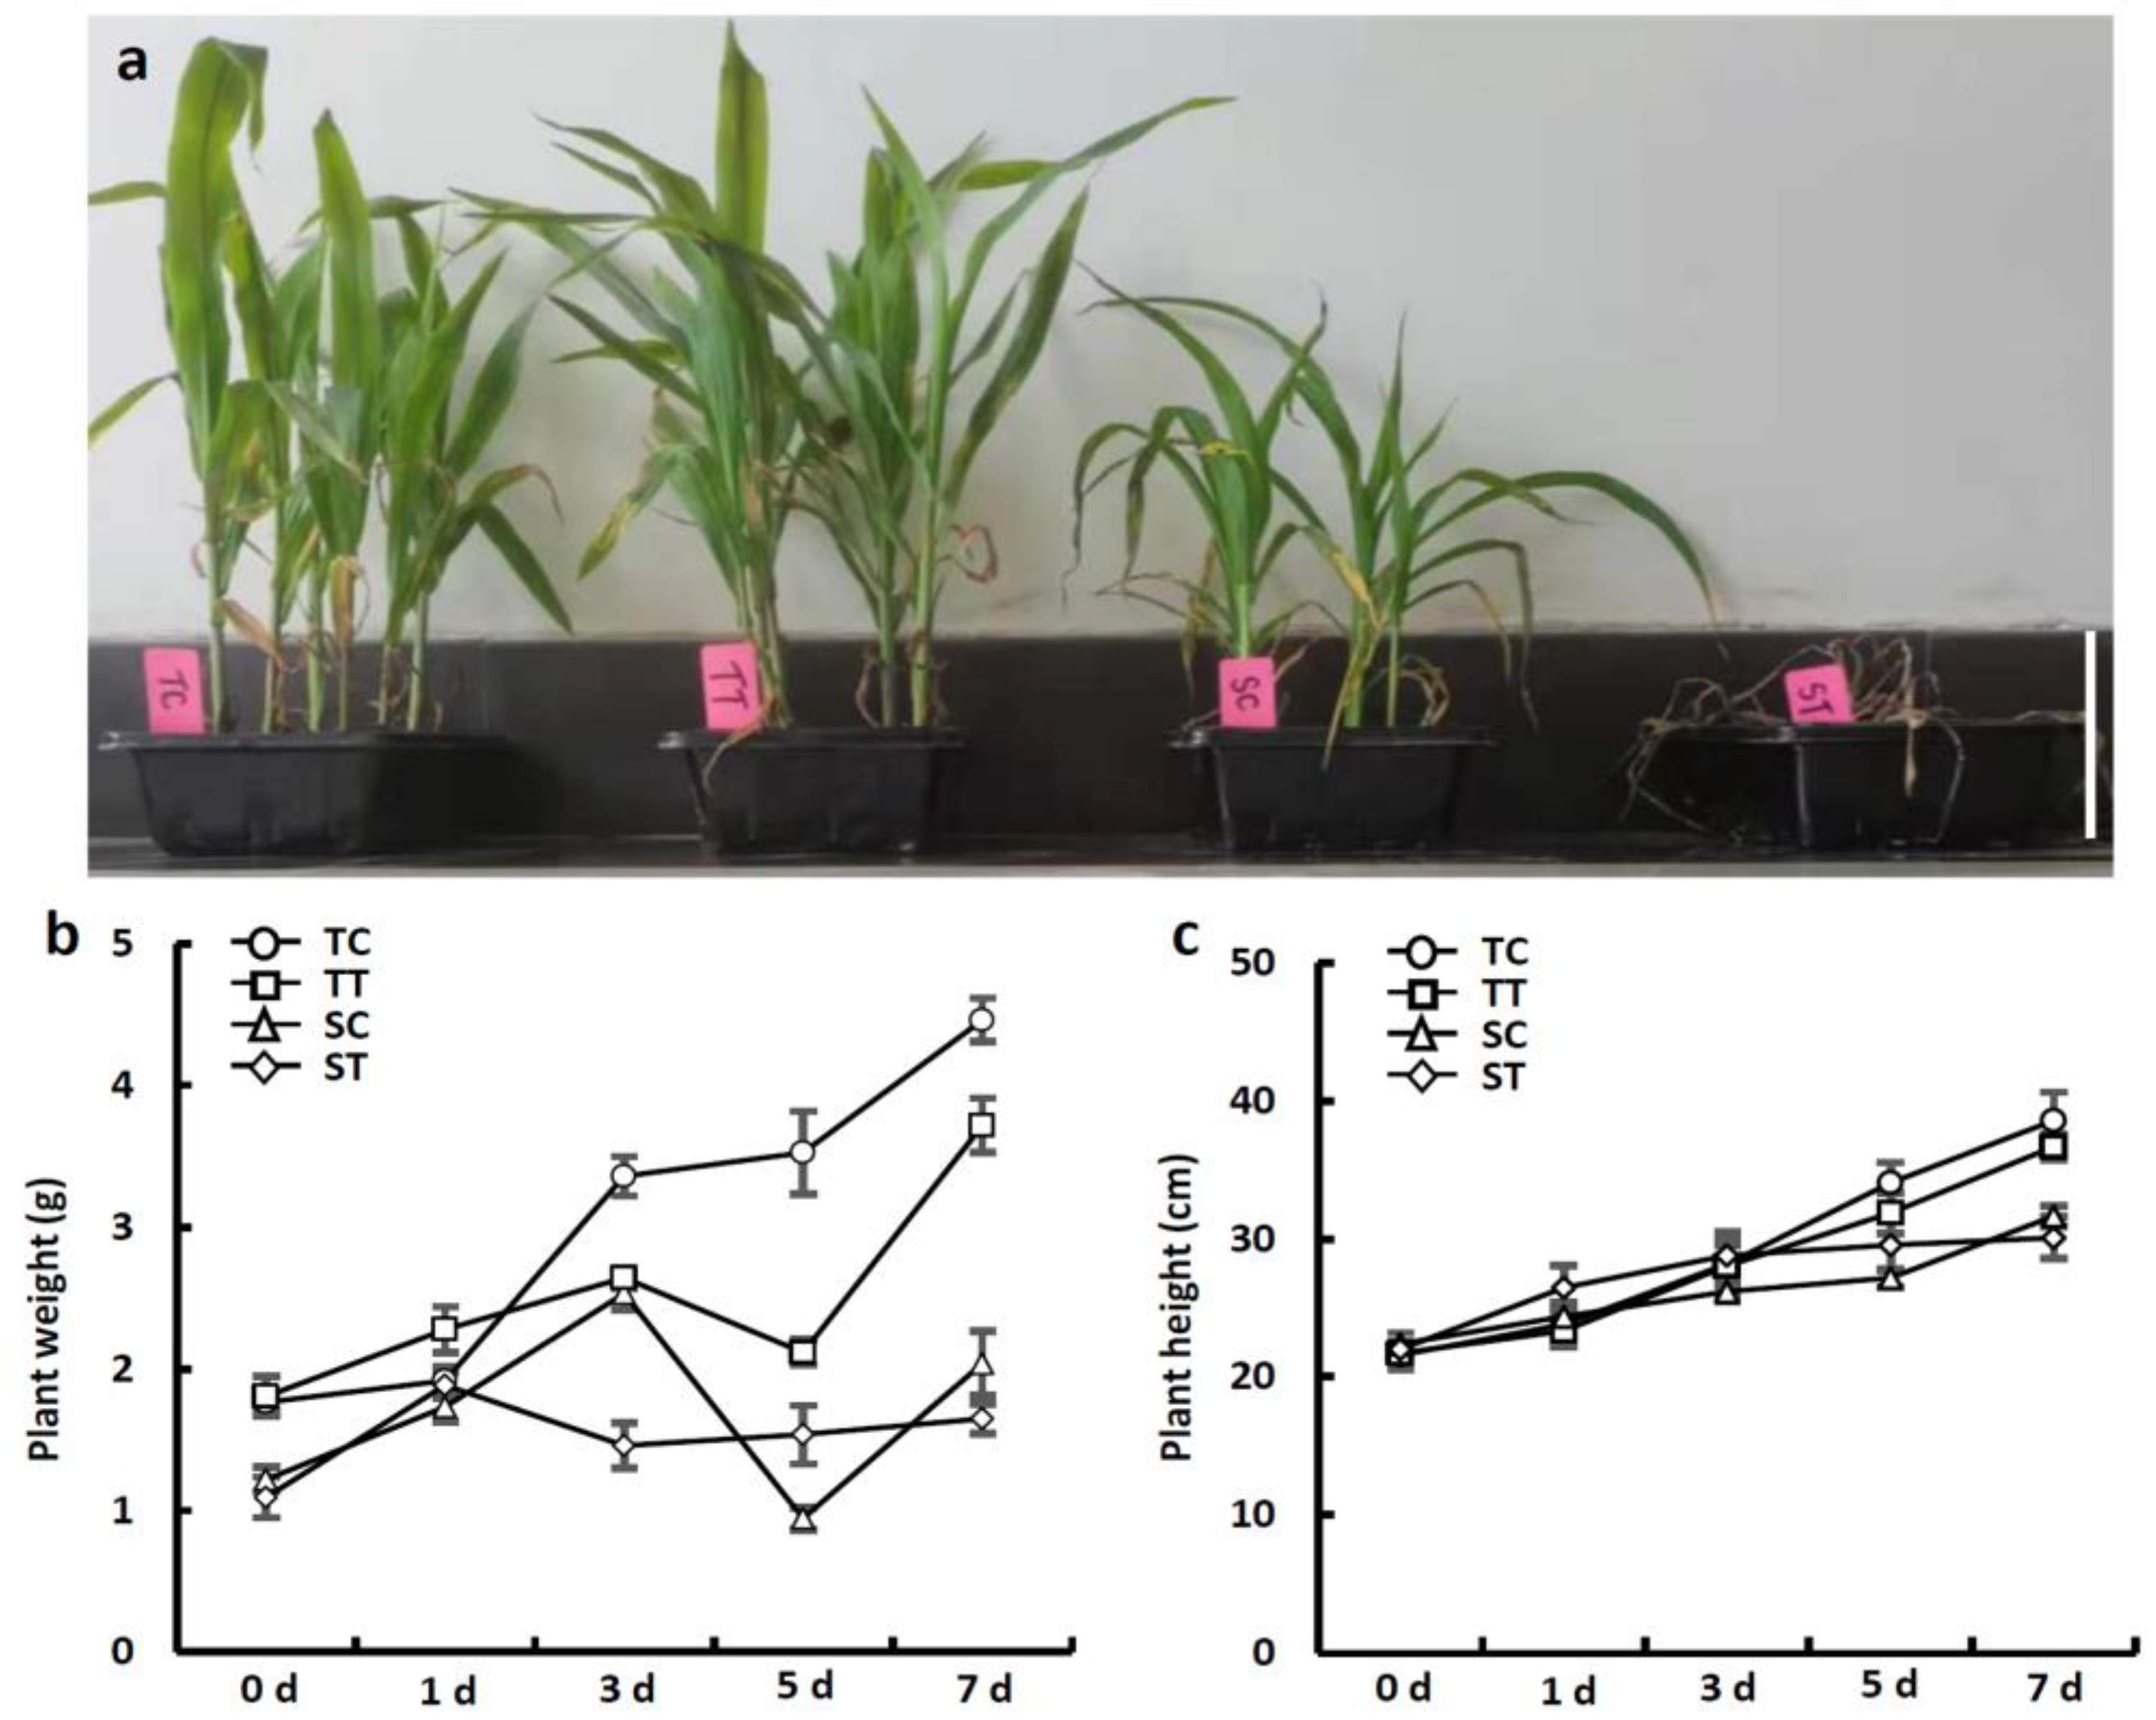
3.1. Phenotypic Responses of Two Sweet Corn Inbred Lines to Mesotrione Stress

To investigate the effect of mesotrione on sweet corn, a pair of sister lines (mesotrione-tolerant line 301 and mesotrione-sensitive line 276) were selected. They were named the T line and the S line, respectively. We analyzed the mesotrione stress response in the seedling stage of the two lines. After 14 days of mesotrione treatment, the T and S seedlings showed significant phenotypic differences. The T line could grow well. In contrast, the S line withered and died (Figure 1a). After the mesotrione treatment, the plant weight and height of both lines decreased significantly, but the change trends were different (Figure 1b,c). From 3 to 7 days after treatment, the plant weight and height of the T line decreased by 12.9–39.5% and 4.5–7.5% compared to the control, respectively, and the S line decreased by 19.6–47.8% and 5.5–41.1%. The average plant weight and height of the T line were 56.4% and 18.2% higher than that of the S line. The morphological analysis indicated that the T line had a greater capacity to adapt to mesotrione stress.

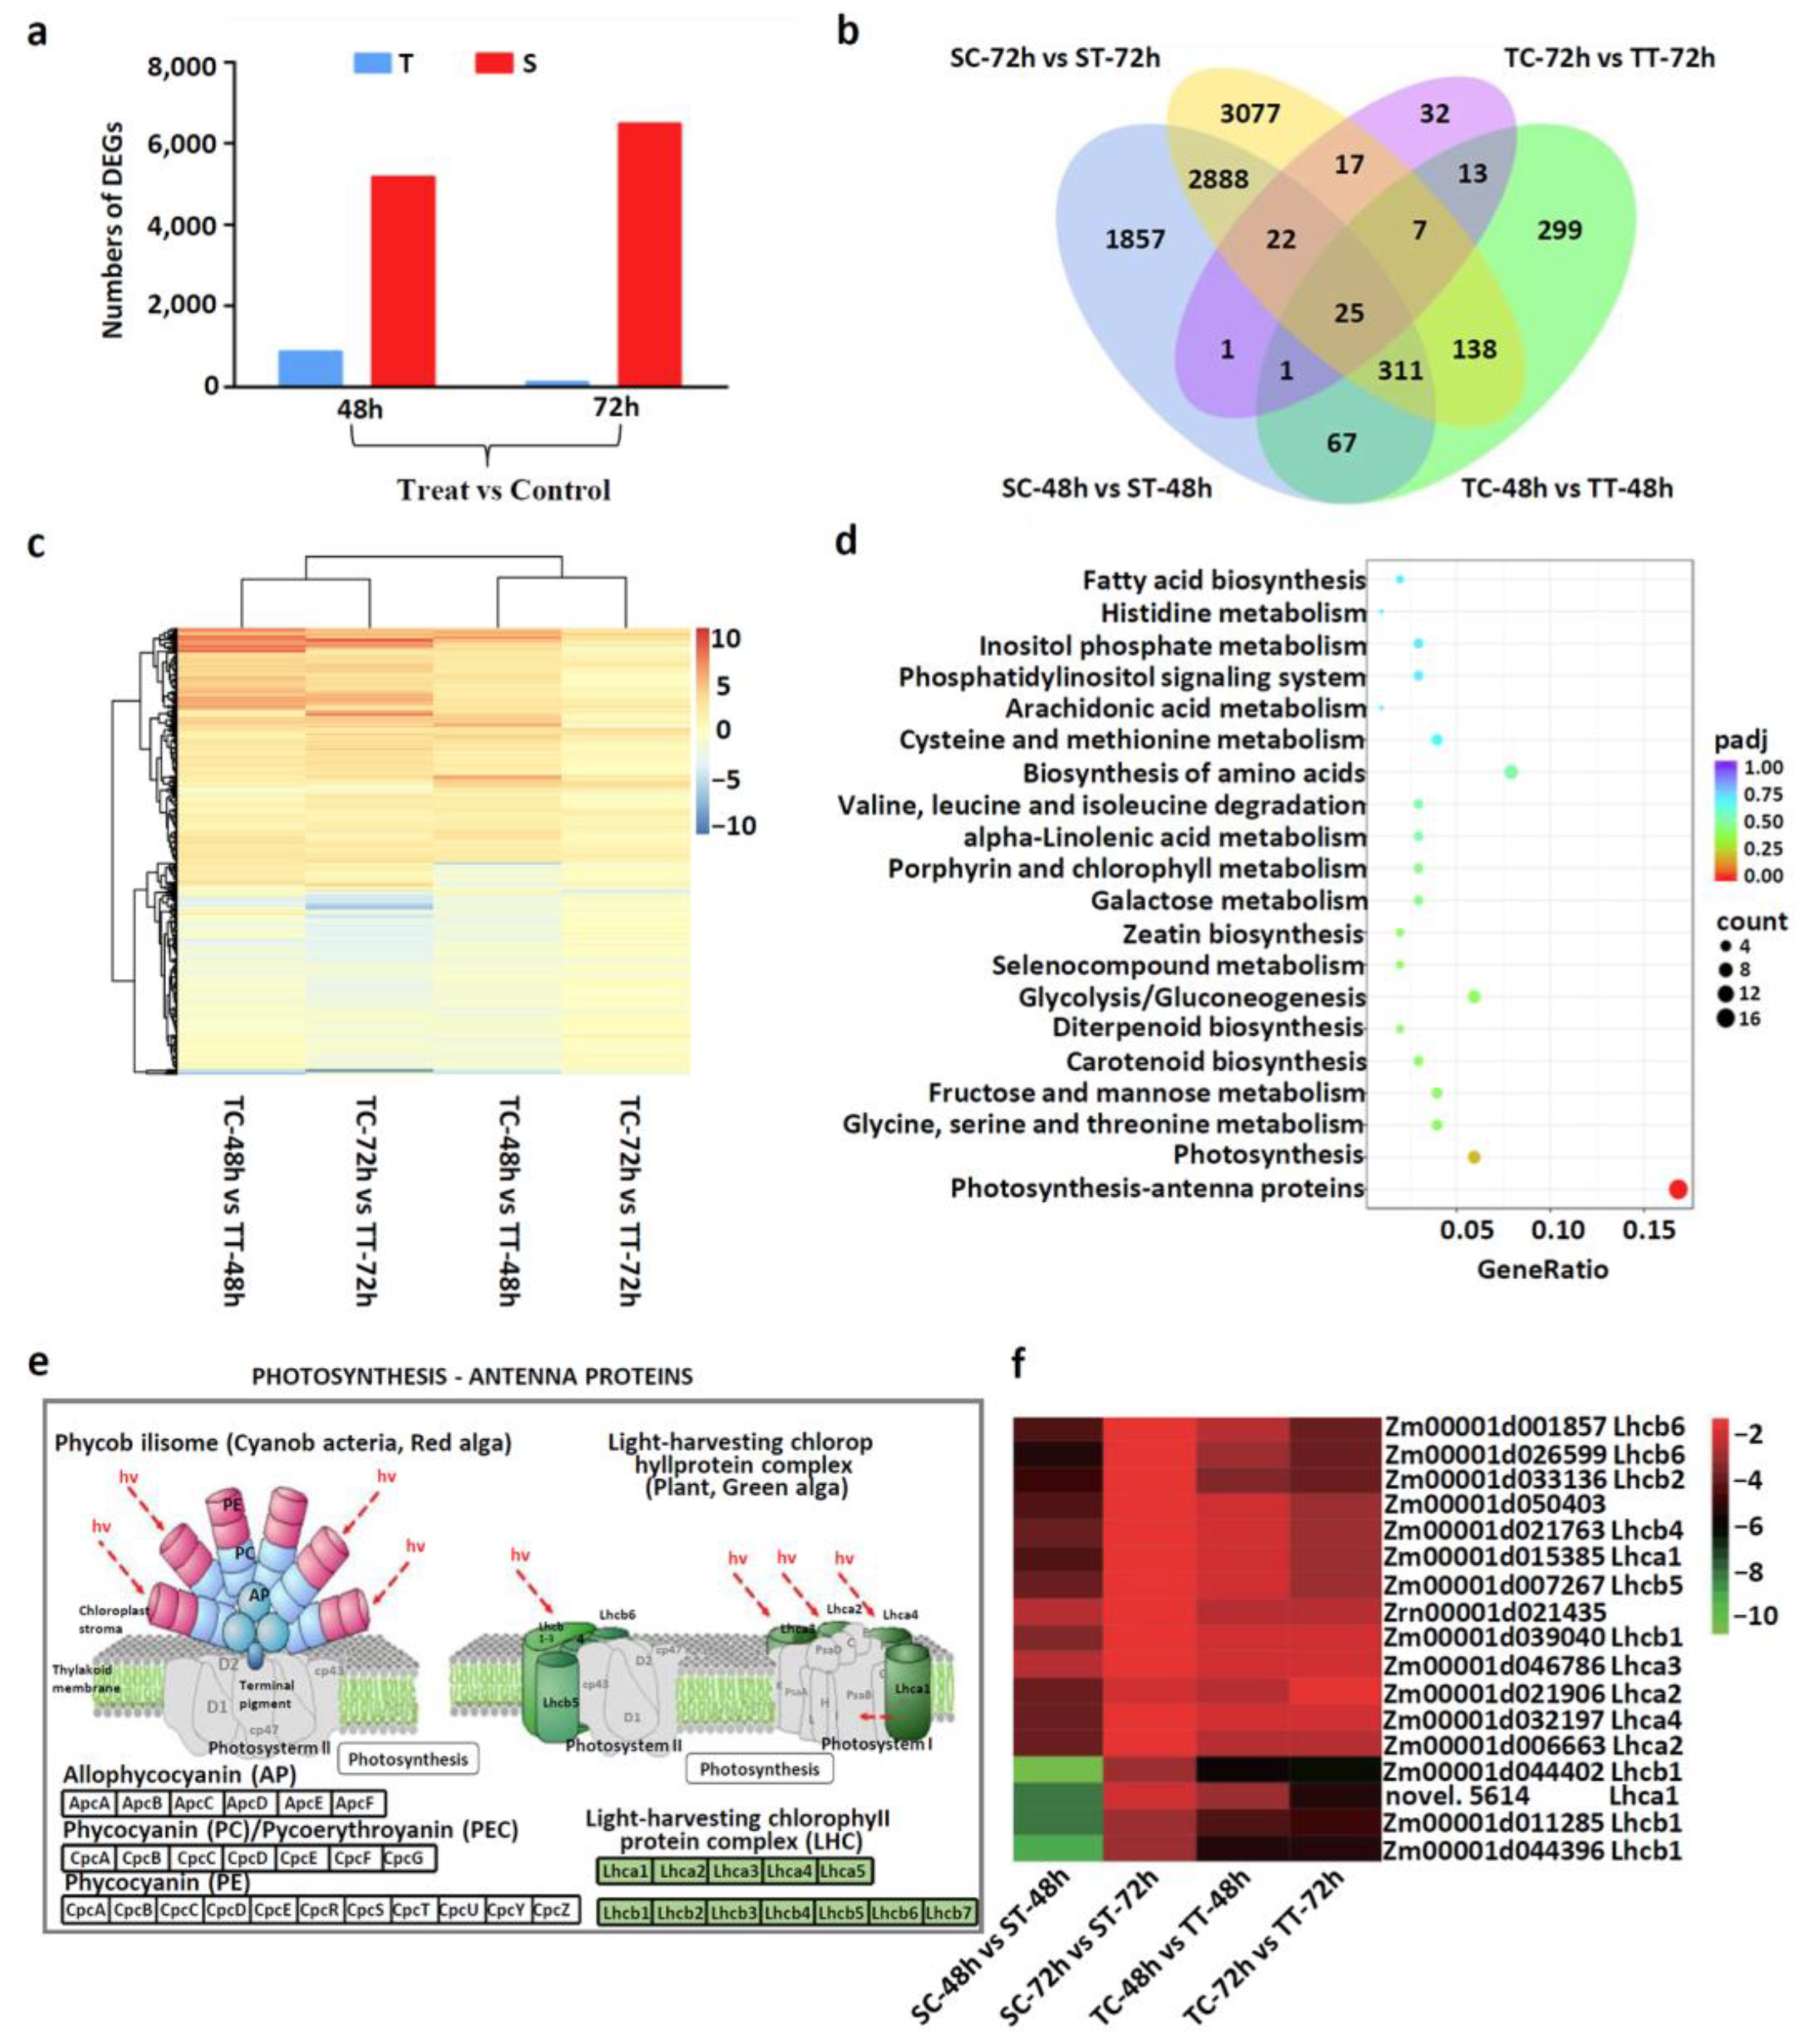
3.2. Transcriptome Profiles of the Two Sweet Corn Inbred Lines under Mesotrione Stress

To characterize the mechanism of sweet corn response to mesotrione stress, we performed comparative transcriptome analysis of mesotrione-tolerant line 301 (T) and mesotrione-sensitive line 276 (S) 48 h and 72 h after mesotrione (T) and H2O (C) treatment. A total of 979 and 11,657 differentially expressed genes (DEGs) (861 for TC48h vs. TT48h, 118 for TC72h vs. TT72h, 5172 for SC48h vs. ST48h, and 6485 for SC72h vs. ST72h) were identified from the T and S line transcriptomes, respectively (Table S1; Figure 2a–c). The number of DEGs in the S line was much higher than that in the T line, implying that the T line showed fewer changes in gene expression to cope with mesotrione stress. To determine the functional significance of the transcriptional changes in each genotype, GO and KEGG classifications were implemented for DEGs. KEGG pathway enrichment analysis revealed that photosynthesis and antenna proteins were overrepresented in the T line (Figure 2d). A total of 15 antenna protein genes were overexpressed in the T line and conversely downregulated in the S line (Figure 2e,f). Furthermore, we analyzed the DEGs with up- and down-regulated expression in both T and S lines and found that genes involved in loosening the cell wall were up-regulated in the S line (Figure S1a–d). Therefore, the mesotrione-induced transcriptional changes in genes or pathways that participate in photosynthesis and cell wall integrity should be important molecular processes leading to the genotype difference in mesotrione tolerance in sweet corn.

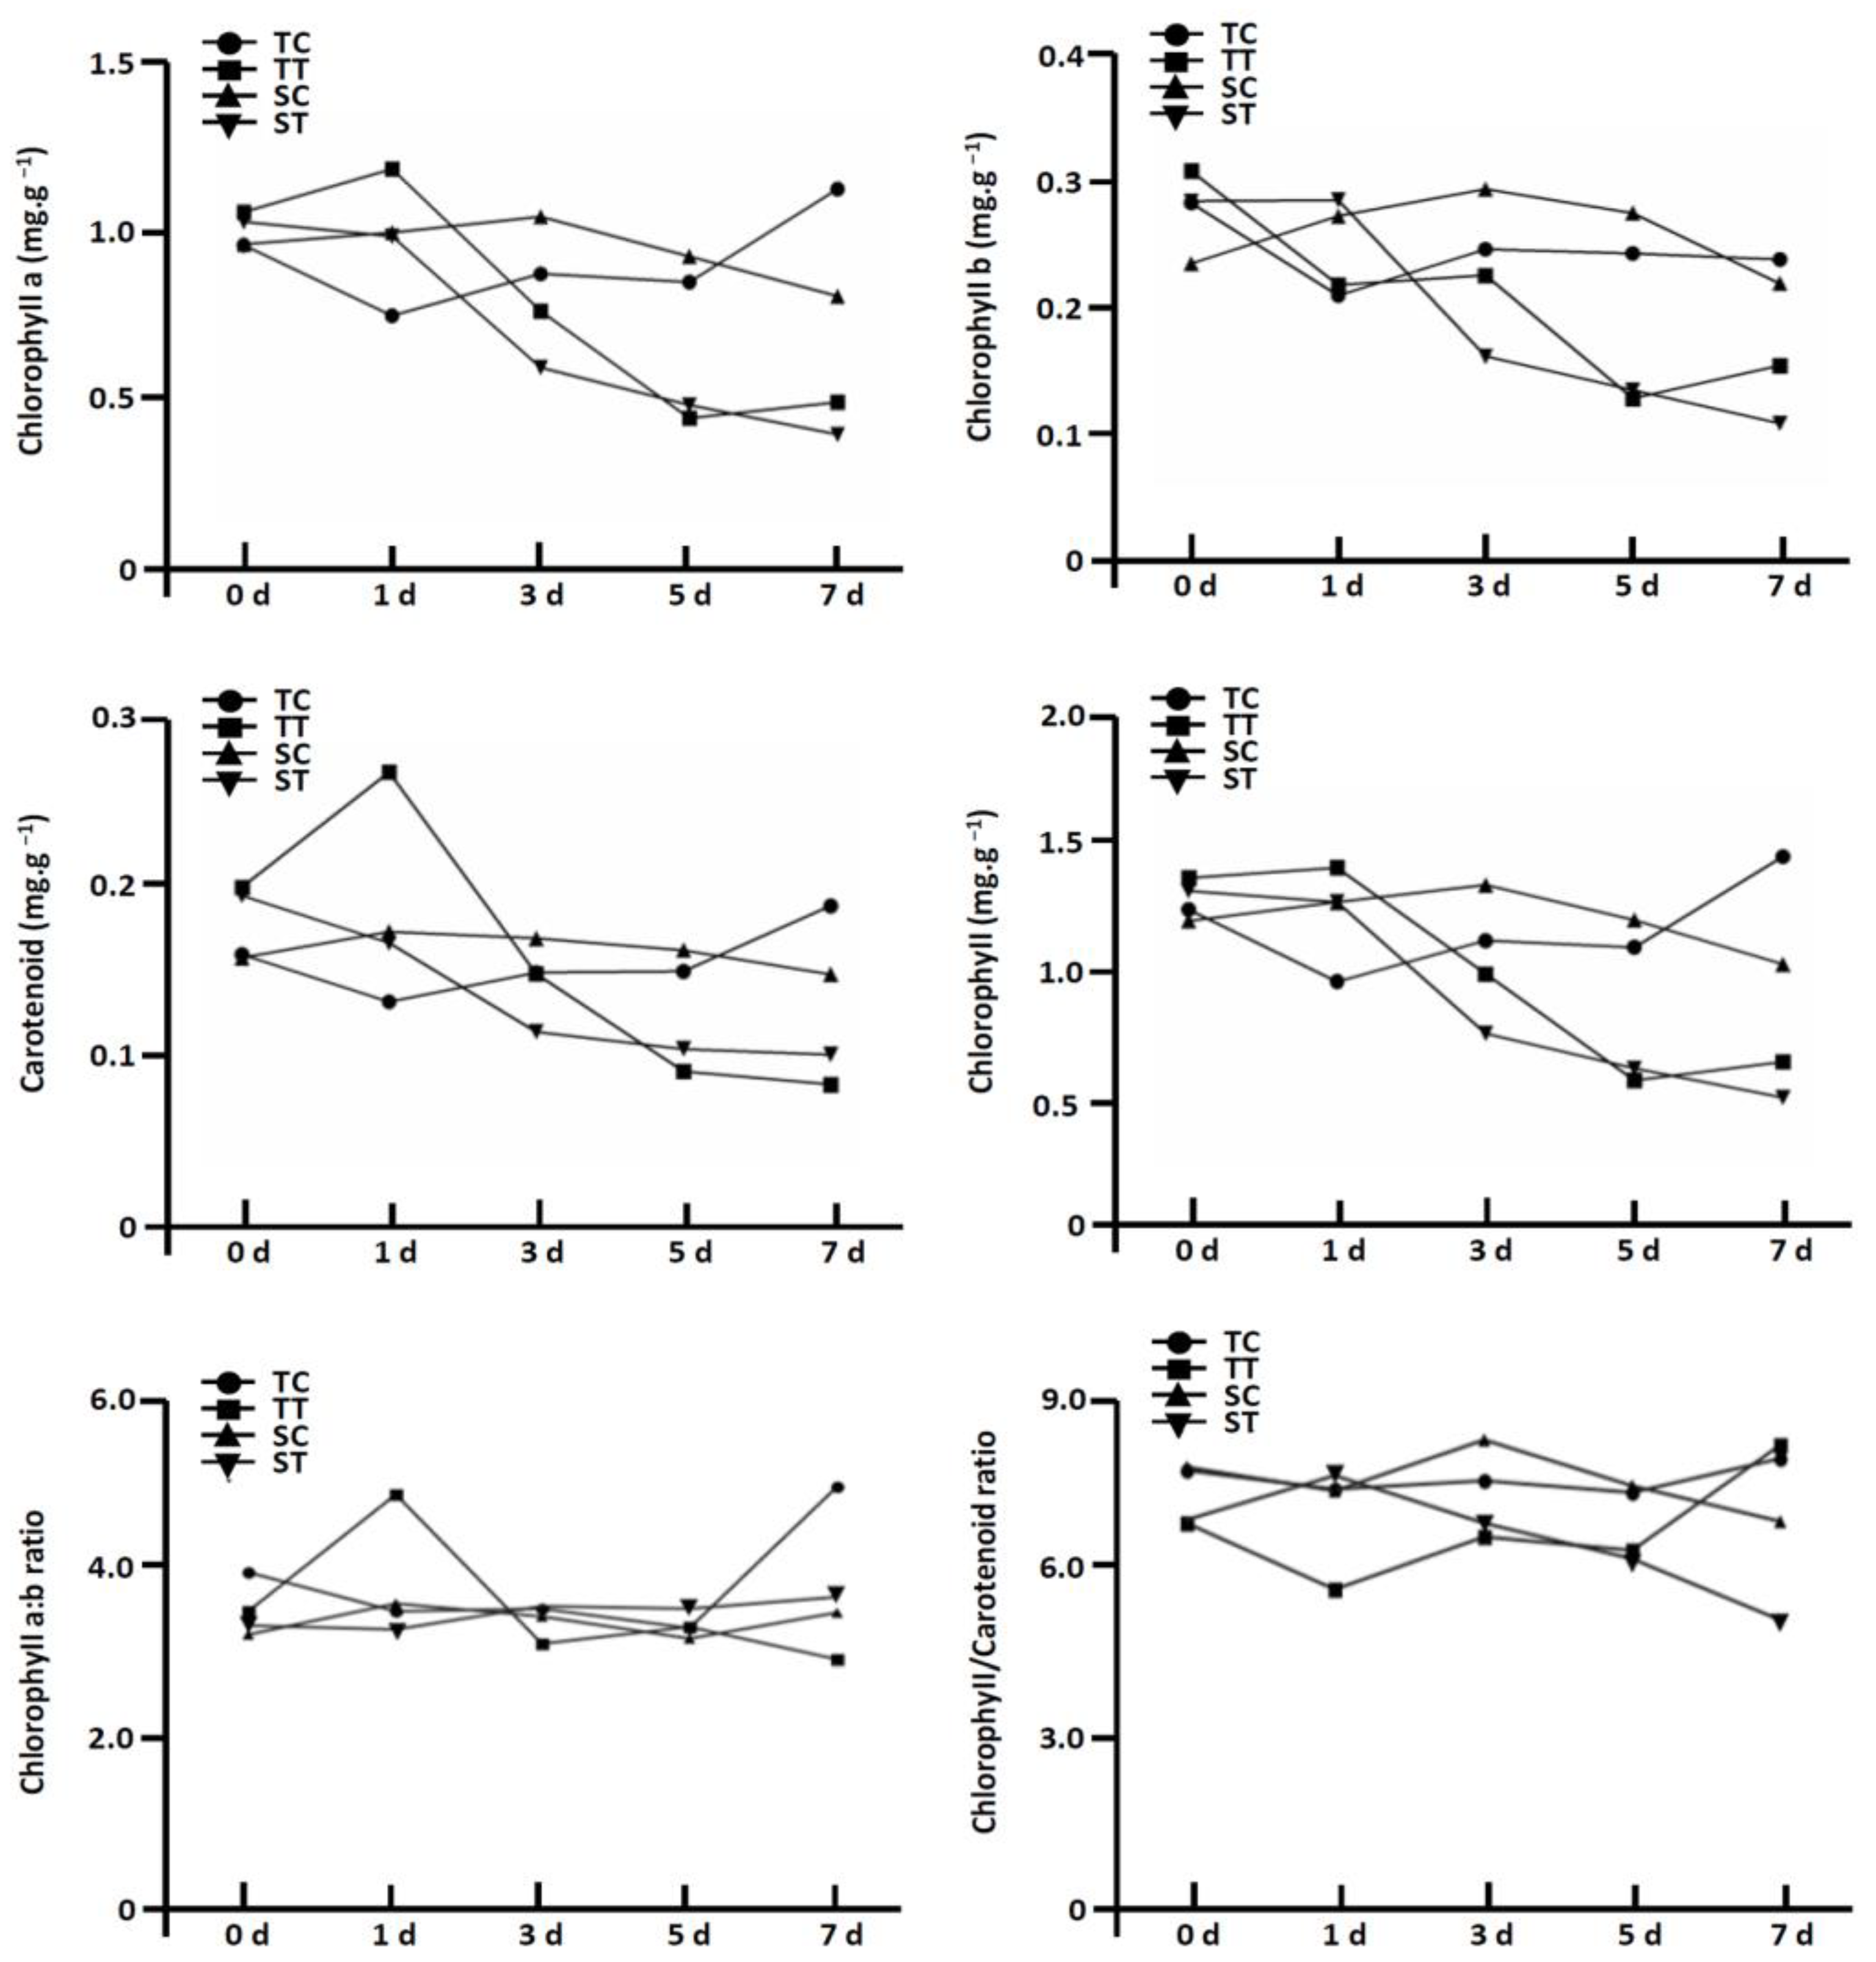
3.3. Effect of Mesotrione on the Photosynthetic Efficiency

HPPD herbicides are photosynthesis-inhibiting herbicides that cause plant death by interfering with normal photosynthesis [16]. Thus, we analyzed the effects of mesotrione on photosynthetic parameters. After the application of mesotrione, there was a slight decline in the photosynthetic parameters for the T line, including Fv/Fm, ΦPSII, ETR, and qP (Figure 3). Compared to the control, the NPQ values in the T line exhibited a significant increase of 134.6% on the third day after treatment, followed by a 23.8% drop on the fifth day after treatment. However, on the fifth and seventh days after treatment, the NPQ values in the T line were restored to levels comparable to the control. Conversely, the S line demonstrated an opposing trend under mesotrione treatment. These results further confirmed that mesotrione inhibits the growth of sweet corn by affecting photosynthesis.
Furthermore, we analyzed the effect of mesotrione on the activities of key enzymes of photosynthesis (Figure 4). PEPC, PPDK, NADP-MDH, and NADP-ME are the enzymes that play a key role in the photosynthetic cycle of C4 plants [17]. In the T line treated with mesotrione, the enzyme activity of NADP-MDH showed a trend of first decreasing and then increasing. On the third day after mesotrione treatment, the enzyme activity of NADP-MDH dropped to the minimum in the T line. Except for NADP-MDH, mesotrione treatment had less effect on the enzyme activities of the other three key enzymes in the T line. For the S line, mesotrione treatment resulted in larger fluctuations in the enzyme activities of the other three key enzymes, except for NADP-MDH. The activities of PEPC, PPDK, and NADP-ME decreased in the S line compared with the control. These results implied that mesotrione had different effects on different sweet corn lines, and the stabilization of photosynthesis enzymes may be a key to tolerance of mesotrione.

3.4. Effect of Mesotrione on Chloroplastic Development

HPPD herbicides can cause the bleaching of plant leaves, so we hypothesized that HPPD herbicides may affect the development and structural stability of chloroplasts [18]. After mesotrione treatment, the content of chlorophyll and chlorophyll b in the T line decreased first, and then increased, reaching the lowest level on the fifth day (Figure 5). The levels of chlorophyll a exhibited a pattern of increasing–decreasing–increasing, with the highest concentration observed on the first day after mesotrione treatment and the lowest on the fifth day after mesotrione treatment in the T line. The content of carotenoids in the T line showed a similar trend, peaking on the first day after mesotrione treatment and subsequently declining. However, with increasing treatment time of mesotrione, the levels of chlorophyll a, chlorophyll b, carotenoids, and total chlorophyll decreased continuously in the S line. It was noteworthy that there were no signs of senescence/severe leaf damage (ratio of total chlorophyll to carotenoids greater than 5) in any of the treatmen.
Furthermore, we analyzed the effect of mesotrione treatment on chloroplast structure using a transmission electron micrograph (TEM). Before mesotrione treatment, the mesophyll cell walls and protoplasts of the T and S lines were intact, and chloroplasts were fixed around vacuoles (Figure 6). There were a large number of starch granules in the chloroplasts, and the grana were arranged regularly. On the third day after mesotrione treatment, the starch granules of the chloroplast were reduced, though the grana were arranged regularly. In contrast, the chloroplast was collapsed in the S line. The starch granules in chloroplasts decreased significantly.

3.5. Mesotrione Induces Oxidative Stress in Sweet Corn

When plants are subjected to adversity stress, they tend to accumulate large amounts of reactive oxygen species in the body, which directly or indirectly oxidize biomolecules such as cell membranes, nucleic acids, and proteins, ultimately leading to cell disintegration and abnormal tissue metabolism [19]. Therefore, we analyzed the effect of mesotrione on oxidative stress in sweet corn. Compared with the control, the superoxide anion content of the T line first increased and then decreased by 228.7% and 86.5% on the fifth and seventh days after mesotrione treatment (Figure 7). The superoxide anion content of the S line continued to increase from the first day to the seventh day after mesotrione treatment. The average superoxide anion content of the T line was 0.08 μmol/g after mesotrione treatment, while the average superoxide anion content of the S line was 0.40 μmol/g. The results showed that the redox balance of the S line was broken, and more reactive oxygen species had accumulated after the treatment of mesotrione.
Hydrogen peroxide (H2O2) is one reactive oxygen species in the metabolism of plant cells [19,20,21,22]. There was a similar trend observed in the T line and S line under mesotrione treatment (Figure 7). Compared with the control, the H2O2 of the T line declined by 22.5%, 12.9%, 21.4%, and 9.66% on the first, third, fifth, and seventh days after mesotrione treatment, respectively. The H2O2 content of the S line declined by an average of 10.4% from the first day to the seventh day after mesotrione treatment. The average hydrogen peroxide content of the T line was 0.24 mmol/g, while that of the S line was 0.34 mmol/g. The results indicated that the S line was able to respond to the mesotrione stress earlier and accumulated more hydrogen peroxide after mesotrione treatment.

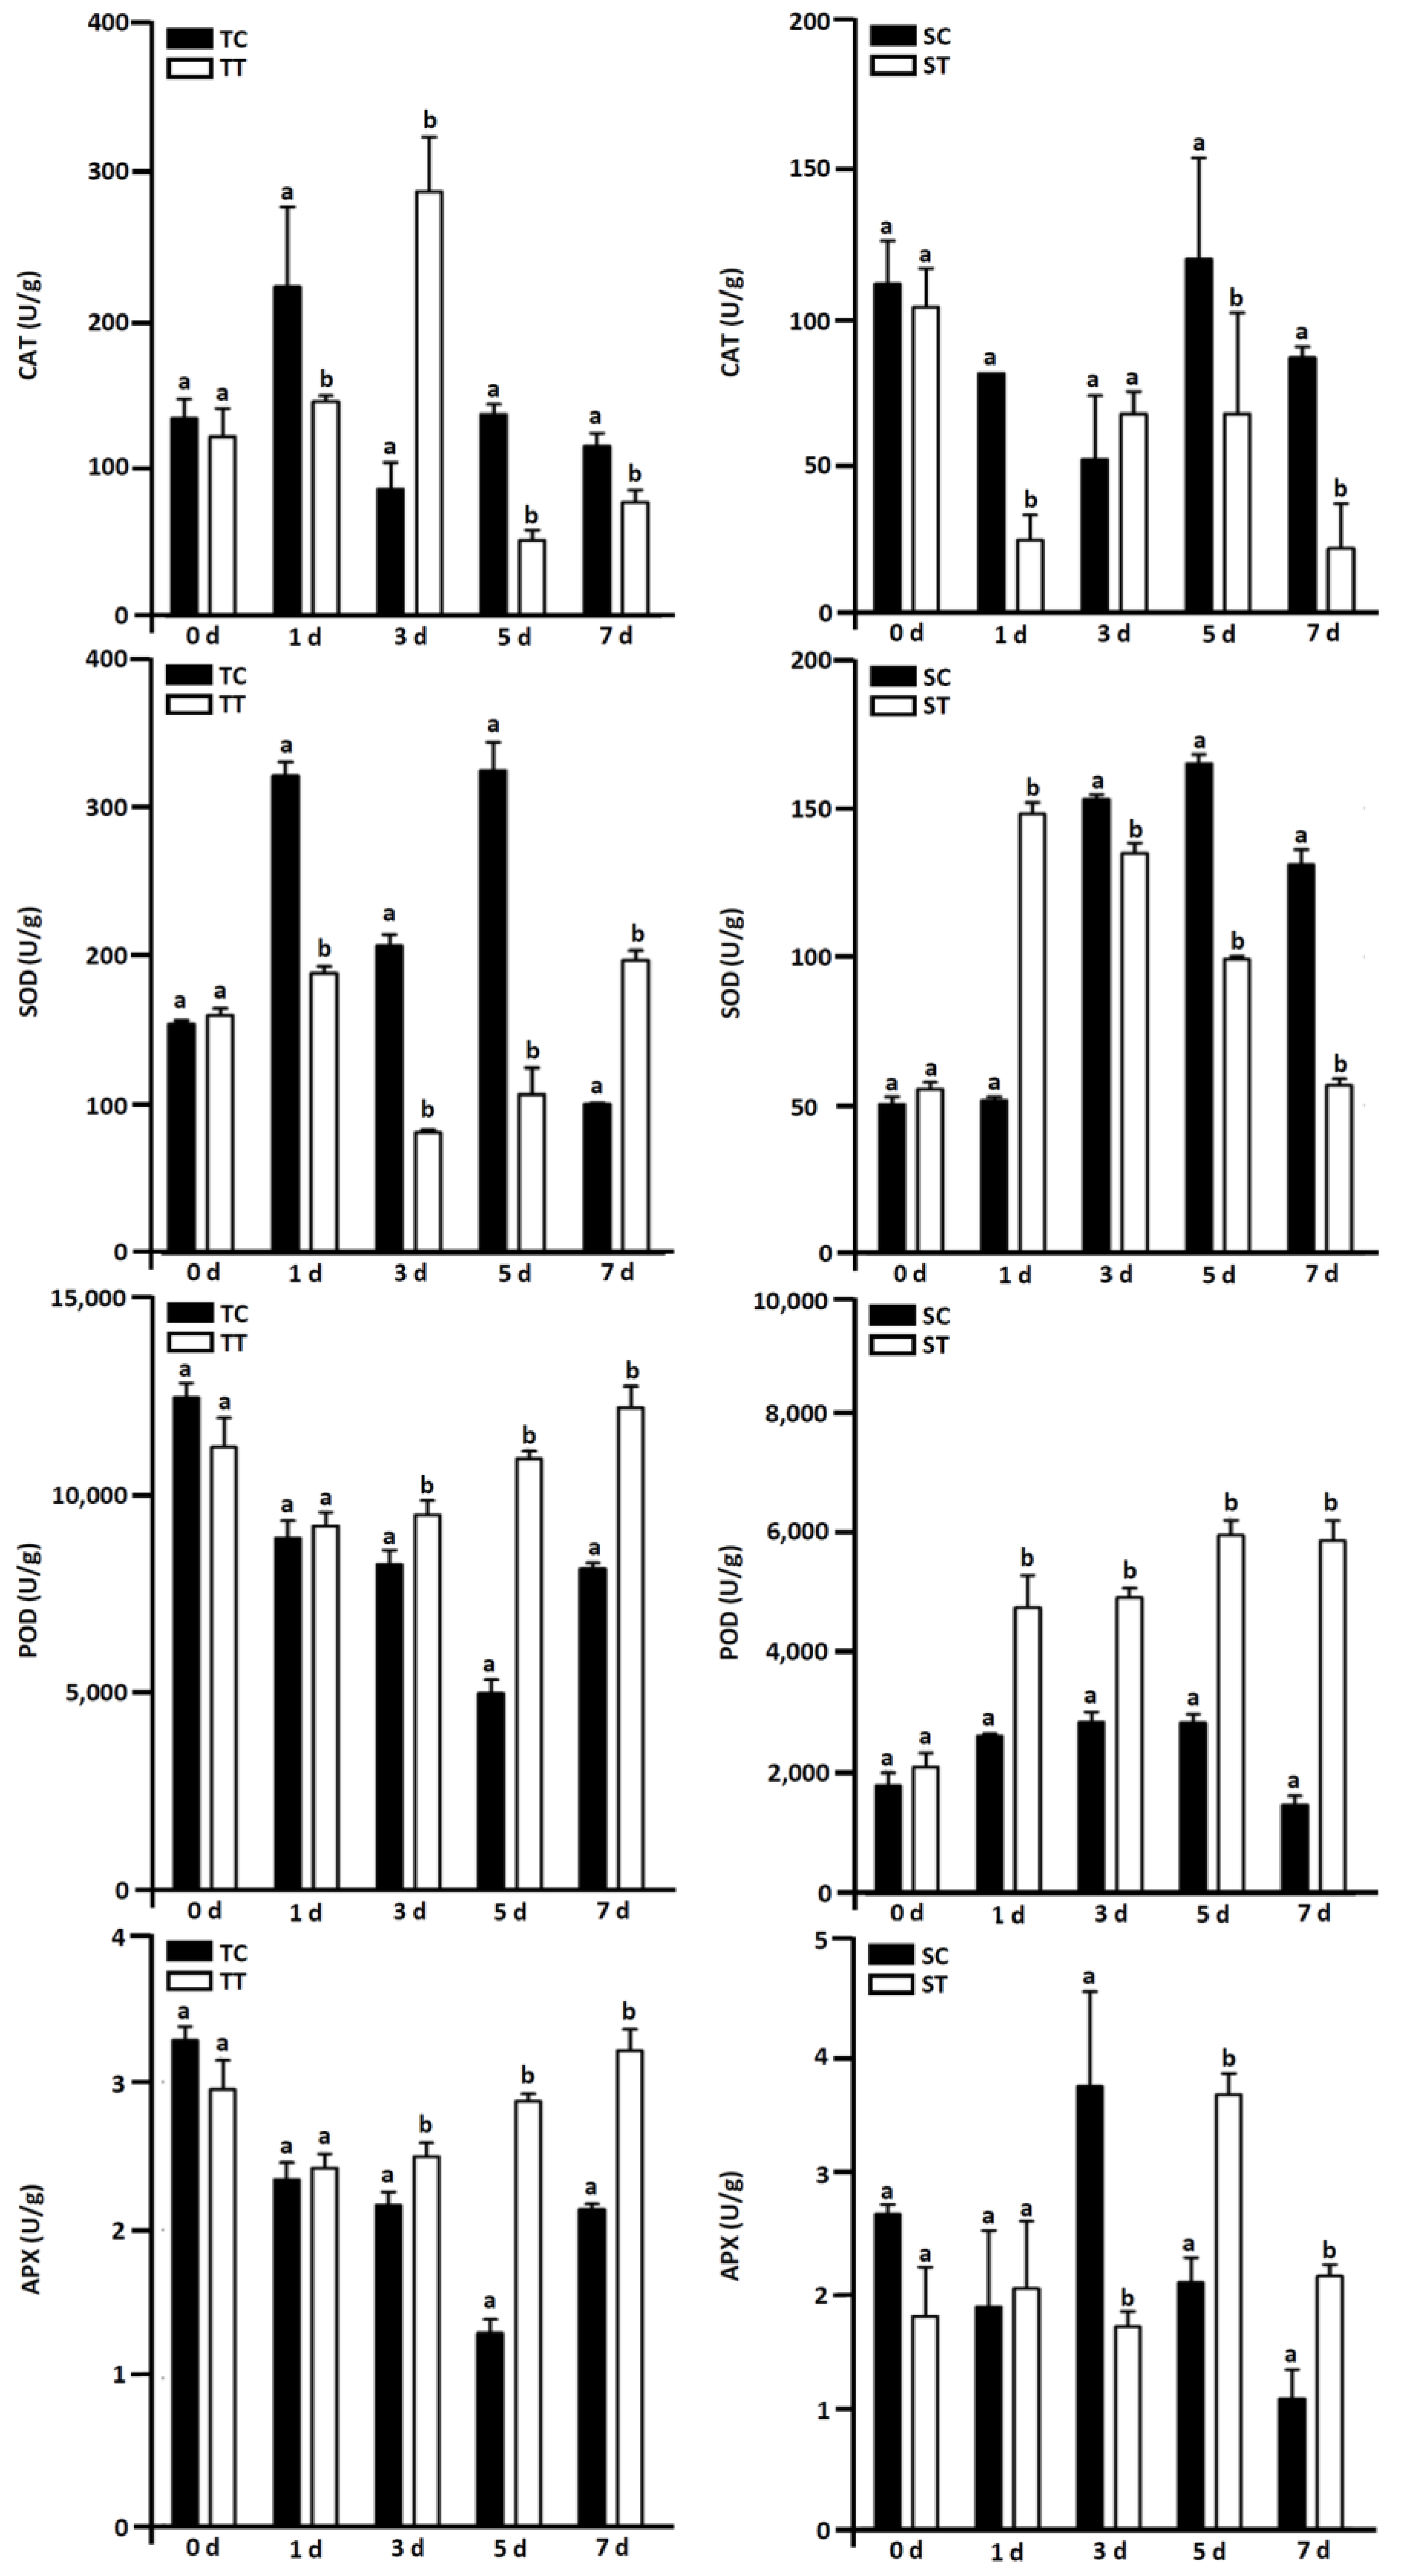
3.6. Effect of Mesotrione on Antioxidant Enzyme Activity

POD enzyme activity was elevated in both T and S lines after spraying with mesotrione (Figure 8). There was no significant change in POD enzyme activity in the T line except on the first day after mesotrione treatment. Compared with the control, the POD activity of the T line increased by 3.29%, 15.03%, 118.01%, and 49.72% on the third, fifth, and seventh days after mesotrione treatment, respectively. On the first, third, fifth, and seventh days after mesotrione treatment, the POD enzyme activity of the S line was 81.51%, 72.78%, 109.59%, and 296.52% higher than that of the control. The POD enzyme activities of the T line were 45.29% higher than those of the S line. It indicated that the oxidative damage caused by mesotrione treatment promoted the activation of the redox system in maize, and the T line had a stronger antioxidant capacity to scavenge the excess ROS in the plants.
The SOD activity of both T and S lines showed different change trends after mesotrione treatment (Figure 8). Compared with control, the SOD of the T line decreased significantly by 44.24%, 59.92%, and 64.80% on the first, third, and fifth days after mesotrione treatment, respectively, and increased significantly by 89.01% on the seventh day after mesotrione treatment. The SOD activity of the S line exhibited a noticeable surge of 201.49% on the initial day of treatment and subsequently showed a gradual decline. On the seventh day after mesotrione treatment, the SOD level in S line was only 41.28% of that in the T line. These results indicated that the sensitive maize inbred lines were able to activate the redox system earlier under mesotrione treatment, while the tolerant inbred lines had a higher redox capacity at the later stage of mesotrione treatment.
CAT in both T and S lines showed similar trends after mesotrione treatment (Figure 8). Compared with the control, the CAT activity in T lines was reduced by 32.99%, 62.50%, and 33.33% on the first, fifth, and seventh days after mesotrione treatment, but increased by 233.49% on the third day after mesotrione treatment. In the S line, the CAT activity showed significant decreases of 68.75%, 43.39%, and 73.91% on the first, fifth, and seventh days after mesotrione treatment, and a significant increase of 29.41% on the third day after mesotrione treatment. Under mesotrione stress, the average CAT level of T lines was 2.37 times higher than that of S lines. These results indicated that CAT enzymes were involved in the response of maize to mesotrione, and higher CAT levels in the T line might give it a stronger redox capacity.
On the first, fifth, and seventh days after mesotrione treatment, the activity of the APX enzyme in the T line was elevated by 340.50%, 22.39%, and 230.29%, respectively (Figure 8). However, on the third day after mesotrione treatment, it decreased by 89.94% with a significant difference from the control. In the S line, the APX enzyme activity was significantly reduced by 54.28% on the third day after mesotrione treatment but increased by 76.47% and 94.04% on the fifth and seventh days after mesotrione treatment compared to the control. These results suggested that the APX enzyme was involved in the maize response to mesotrione, and the T line exhibited a response of the APX enzyme to mesotrione more strongly.

4. Discussion

4.1. Mesotrione Destroyed Chloroplast Structure and Affected the Rate of Photosynthesis in Sweet Corn

Mesotrione has been reported to have toxic effects on corn, especially sweet corn [11]. Our research indicated that spraying mesotrione on sweet corn plants led to certain phenotypic changes. Compared to the mesotrione-tolerant line 301, the mesotrione-sensitive line 276 exhibited reduced plant height and dry weight (Figure 1a–c). Herbicides can affect plant cell metabolism, chloroplast disintegration, and leaf color changes, ultimately impacting the plant’s photosynthetic mechanism [23]. Our study suggested that mesotrione disrupted the chloroplast structure in the leaves of young sweet corn plants, leading to a decrease in their photosynthetic carbon assimilation capacity, an increase in the risk of photo-oxidative damage, and a reduction in light absorption, transmission, and distribution between PS II and PSI [24], thereby affecting the synthesis of ATP and NADPH.
Chlorophyll molecules emit light as chlorophyll fluorescence when transitioning from an excited state to a non-excited state [25,26]. Chlorophyll fluorescence is commonly used as an indicator for calculating the photosynthetic energy conversion in higher plants, algae, and bacteria [27]. After mesotrione treatment, the mesotrione-sensitive line 276 exhibited a significant decrease in Fv/Fm compared to the control group. In addition, qP and ΦPSII of 276 were significantly reduced (Figure 3). It has been widely reported that approximately 50% of commercial herbicides inhibit the chloroplast electron transport chain [28]. Due to their function involving the disruption of the photosynthetic electron flow, they can impact plant photosynthesis, inhibiting normal plant growth and development. In our study, the reduction in qP may lead to a decrease in the openness of the PSII system, ultimately resulting in a decrease in the efficiency of utilization of excitation energy in the photochemical reactions.

4.2. Mesotrione Disrupted the Balance of Redox Homeostasis in Sweet Corn

Residual herbicides in plants increase the production of ROS, which may ultimately damage plant growth [29]. Mesotrione-induced damaging effects on the photosynthetic system and the photosynthetic electron transport chain resulted in excess electron transfer from O2 and H2O2. In our study, mesotrione caused a significant increase in O2 and H2O2 accumulation in mesotrione-sensitive line 276, suggesting that residual mesotrione in plants induced the production of ROS (Figure 7). This result was consistent with the findings of Alla and Hassan (2007) who documented that isoproturon significantly accelerated the production of O2 and H2O2 in maize seedlings [30]. The accumulation of excess H2O2 will directly or indirectly oxidize biomolecules such as cell membranes, nucleic acids, and proteins, ultimately leading to cell disintegration and abnormal tissue metabolism.
Previous studies have shown that POD, SOD, CAT, and APX enzymes are the first barriers in the intracellular antioxidant system to mitigate oxidative stress in plants [31]. The activities of these enzymes were strongly correlated with O2 and H2O2 accumulation. In this study, we found that oxidative damage from mesotrione treatment resulted in the initiation of the redox system in maize, and mesotrione-tolerant line 301 had a greater antioxidant capacity to scavenge excess ROS (Figure 8). Thus, the tolerance of oxidative stress caused by mesotrione in sweet corn was partly related to the involvement of these enzymes. Our results also confirmed the changes in antioxidant status and antioxidant accumulation caused by mesotrione application.

4.3. Mesotrione Affected the Structure of the Cell Walls in Sweet Corn

The biological activity of herbicides depends on the uptake, translocation, metabolism, and sensitivity of the plant to the herbicide and/or its metabolites [32]. Herbicides need to penetrate the plant cell wall, reach the cytoplasm of the cell, and then exert their action (contact herbicides) or be translocated to the target site (systemic herbicides) [33]. Thus, the cell wall plays an important role in plant response to herbicide stress. However, whether herbicides affect cell wall layer development remains unknown. In our experiments, we found that mesotrione treatment resulted in a significant increase in the expression of cell wall relaxation genes in the S line (Figures S1–S4), suggesting that mesotrione residues in plants induced cell wall relaxation and promoted the uptake of mesotrione in plants.

5. Conclusions

In conclusion, there are two major new findings: (i) Mesotrione affected the rate of photosynthesis and reactive oxygen homeostasis in sweet corn, and (ii) the disruption of cell wall integrity seemed to affect herbicide tolerance of the mesotrione-sensitive sweet corn genotype. These novel findings greatly enriched our knowledge of the genetic basis of the mesotrione-tolerant sweet corn genotype. These results provided important clues for the molecular-assisted screening and breeding of mesotrione-tolerant cultivars for sweet corn.

Supplementary Materials

The following supporting information can be downloaded at: https://www.mdpi.com/article/10.3390/agronomy14030555/s1, Figure S1: List of DEGs belonging to the GO terms significantly overrepresented in mesotrione-tolerant line 301 (T) at 48 h after mesotrione treatment; Figure S2: List of DEGs belonging to the GO terms significantly overrepresented in mesotrione-tolerant line 301 (T) at 72 h after mesotrione treatment; Figure S3: List of DEGs belonging to the GO terms significantly overrepresented in mesotrione-sensitive line 276 (S) at 48 h after mesotrione treatment; Figure S4: List of DEGs belonging to the GO terms significantly overrepresented in mesotrione-sensitive line 276 (S) at 72 h after mesotrione treatment; Table S1: Expression patterns of the DEGs in mesotrione-tolerant line 301 and mesotrione-sensitive line 276 after mesotrione treatment.

Author Contributions

T.W.: visualization, project administration. Z.W.: investigation, material collection and experiments. G.L. and X.L.: conceptualization, project administration, writing—original draft., R.F. and J.C.: funding acquisition, supervision, writing—review and editing. All authors have read and agreed to the published version of the manuscript.

Funding

This work was supported by the Zhejiang Province Science and Technology Project of Zhejiang Province of China (2022C04024 and 2021CO2057) and the ZAAS Program of Transdisciplinary Research, Zhejiang Provincial Natural Science Foundation of China under (LGN22C130014).

Data Availability Statement

The original contributions presented in the study are included in the article/Supplementary Materials, and further inquiries can be directed to the corresponding authors.

Acknowledgments

We thank Bin Wang from the Zhejiang Academy of Agricultural Sciences for the valuable comments on the study.

Conflicts of Interest

The authors declare that they have no known competing financial interests or personal relationships that could have appeared to influence the work reported in this paper.

References

  1. Mitchell, G.; Bartlett, D.W.; Fraser, T.E.M.; Hawkes, T.R.; Holt, D.C.; Townson, J.K.; Wichert, R.A. Mesotrione: A new selective herbicide for use in maize. Pest Manag. Sci. 2001, 57, 120–128. [Google Scholar] [CrossRef]
  2. Woodyard, A.J.; Bollero, G.A.; Riechers, D.E. Broadleaf weed management in corn utilizing synergistic postemergence herbicide combinations. Weed Technol. 2009, 23, 513–518. [Google Scholar] [CrossRef]
  3. Lee, D.L.; Prisbylla, M.P.; Cromartie, T.H.; Dagarin, D.P.; Howard, S.W.; Provan, W.M.; Ellis, M.K.; Fraser, T.; Mutter, L.C. The discovery and structural requirements of inhibitors of p-hydroxyphenylpyruvate dioxygenase. Weed Sci. 1997, 45, 601–609. [Google Scholar] [CrossRef]
  4. Tsegaye, Y.; Shintani, D.K.; DellaPenna, D. Overexpression of the enzyme p-hydroxyphenolpyruvate dioxygenase in Arabidopsis and its relation to tocopherol biosynthesis. Plant Physiol. Biochem. 2002, 40, 913–920. [Google Scholar] [CrossRef]
  5. Carol, P.; Kuntz, M. A plastid terminal oxidase comes to light: Implications for carotenoid biosynthesis and chlororespiration. Trends Plant Sci. 2001, 6, 31–36. [Google Scholar] [CrossRef]
  6. Pandian, B.A.; Sathishraj, R.; Djanaguiraman, M.; Prasad, P.V.V.; Jugulam, M. Role of cytochrome P450 enzymes in plant stress response. Antioxidants 2020, 9, 454. [Google Scholar] [CrossRef]
  7. Nakka, S.; Thompson, C.R.; Peterson, D.E.; Jugulam, M. Target site–based and non–target site based resistance to ALS inhibitors in palmer amaranth (Amaranthus palmeri). Weed Sci. 2017, 65, 681–689. [Google Scholar] [CrossRef]
  8. Norsworthy, J.K.; Varanasi, V.K.; Bagavathiannan, M.; Brabham, C. Recurrent selection with sub-lethal doses of mesotrione reduces sensitivity in Amaranthus palmeri. Plants 2021, 10, 1293. [Google Scholar] [CrossRef]
  9. Revilla, P.; Anibas, C.M.; Tracy, W.F. Sweet corn research around the world 2015–2020. Agronomy 2021, 11, 534. [Google Scholar] [CrossRef]
  10. Pannacci, E.; Covarelli, G. Efficacy of mesotrione used at reduced doses for post-emergence weed control in maize (Zea mays L.). Crop Prot. 2009, 28, 57–61. [Google Scholar] [CrossRef]
  11. O’Sullivan, J.; Zandstra, J.; Sikkema, P. Sweet corn (Zea mays) cultivar sensitivity to mesotrione. Weed Technol. 2002, 16, 421–425. [Google Scholar] [CrossRef]
  12. Pataky, J.K.; Williams, M.M.; Riechers, D.E.; Meyer, M.D. A common genetic basis for cross-sensitivity to mesotrione and nicosulfuron in sweet corn hybrid cultivars and inbreds grown throughout North America. J. Am. Soc. Hortic. Sci. 2009, 134, 252–260. [Google Scholar] [CrossRef]
  13. Maxwell, K. Resistance is useful: Diurnal patterns of photosynthesis in C3 and crassulacean acid metabolism epiphytic bromeliads. Funct. Plant Biol. 2002, 29, 679–687. [Google Scholar] [CrossRef] [PubMed]
  14. Wu, Z.X.; Xu, N.W.; Yang, M.; Li, X.L.; Han, J.L.; Lin, X.H.; Yang, Q.; Lv, G.H.; Wang, J. Responses of photosynthesis, antioxidant enzymes, and related gene expression to nicosulfuron stress in sweet maize (Zea mays L.). Environ. Sci. Pollut. Res. 2022, 29, 37248–37265. [Google Scholar] [CrossRef] [PubMed]
  15. Wang, J.; Gao, H.; Guo, Z.; Meng, Y.; Yang, M.; Li, X.; Yang, Q. Adaptation responses in C4 photosynthesis of sweet maize (Zea mays L.) exposed to nicosulfuron. Ecotoxicol. Environ. Saf. 2021, 214, 112096. [Google Scholar] [CrossRef] [PubMed]
  16. Dayan, F.E.; Zaccaro, M.L.d.M. Chlorophyll fluorescence as a marker for herbicide mechanisms of action. Pestic. Biochem. Physiol. 2012, 102, 189–197. [Google Scholar] [CrossRef]
  17. Singh, J.; Garai, S.; Das, S.; Thakur, J.K.; Tripathy, B.C. Role of C4 photosynthetic enzyme isoforms in C3 plants and their potential applications in improving agronomic traits in crops. Photosynth. Res. 2022, 154, 233–258. [Google Scholar] [CrossRef]
  18. Breeden, G.K.; Brosnan, J.T.; Elmore, M.T.; Kopsell, D.A.; Mueller, T.C. Response of hybrid bermudagrass (Cynodon dactylon × C. transvaalensis) to three HPPD-inhibitors. Weed Sci. 2011, 59, 458–463. [Google Scholar]
  19. Quan, L.-J.; Zhang, B.; Shi, W.-W.; Li, H.-Y. Hydrogen peroxide in plants: A versatile molecule of the reactive oxygen species network. J. Integr. Plant Biol. 2008, 50, 2–18. [Google Scholar] [CrossRef]
  20. Smirnoff, N.; Arnaud, D. Hydrogen peroxide metabolism and functions in plants. New Phytol. 2019, 221, 1197–1214. [Google Scholar] [CrossRef]
  21. Ślesak, I.; Libik, M.; Karpinska, B.; Karpinski, S.; Miszalski, Z. The role of hydrogen peroxide in regulation of plant metabolism and cellular signalling in response to environmental stresses. Acta Biochim. Pol. 2007, 54, 39–50. [Google Scholar] [CrossRef] [PubMed]
  22. Kuźniak, E.; Urbanek, H. The involvement of hydrogen peroxide in plant responses to stresses. Acta Physiol. Plant. 2000, 22, 195–203. [Google Scholar] [CrossRef]
  23. Dan Hess, F. Light-dependent herbicides: An overview. Weed Sci. 2000, 48, 160–170. [Google Scholar] [CrossRef]
  24. Murata, N.; Takahashi, S.; Nishiyama, Y.; Allakhverdiev, S.I. Photoinhibition of photosystem II under environmental stress. Biochim. Biophys. Acta-Bioenerg. 2007, 1767, 414–421. [Google Scholar] [CrossRef]
  25. Rosenqvist, E.; van Kooten, O. Chlorophyll fluorescence: A general description and nomenclature. In Practical Applications of Chlorophyll Fluorescence in Plant Biology; Springer: Berlin/Heidelberg, Germany, 2003; pp. 31–77. [Google Scholar]
  26. Ostroumov, E.E.; Khan, Y.R.; Scholes, G.D.; Govindjee. Photophysics of photosynthetic pigment-protein complexes. In Non-Photochemical Quenching and Energy Dissipation in Plants, Algae and Cyanobacteria; Springer: Berlin/Heidelberg, Germany, 2014; pp. 97–128. [Google Scholar]
  27. Murchie, E.H.; Lawson, T. Chlorophyll fluorescence analysis: A guide to good practice and understanding some new applications. J. Exp. Bot. 2013, 64, 3983–3998. [Google Scholar] [CrossRef] [PubMed]
  28. Flores, F.; Collier, C.J.; Mercurio, P.; Negri, A.P. Phytotoxicity of four photosystem II herbicides to tropical seagrasses. PLoS ONE 2013, 8, e75798. [Google Scholar] [CrossRef] [PubMed]
  29. Wang, H.; Liu, W.; Zhao, K.; Yu, H.; Zhang, J.; Wang, J. Evaluation of weed control efficacy and crop safety of the new HPPD-inhibiting herbicide-QYR301. Sci. Rep. 2018, 8, 7910. [Google Scholar] [CrossRef]
  30. Nemat Alla, M.M.; Hassan, N.M. Changes of antioxidants and GSH-associated enzymes in isoproturon-treated maize. Acta Physiol. Plant. 2007, 29, 247–258. [Google Scholar] [CrossRef]
  31. Foyer, C.H. Reactive oxygen species, oxidative signaling and the regulation of photosynthesis. Environ. Exp. Bot. 2018, 154, 134–142. [Google Scholar] [CrossRef]
  32. Mersey, B.G.; Hall, J.C.; Anderson, D.M.; Swanton, C.J. Factors affecting the herbicidal activity of glufosinate-ammonium: Absorption, translocation, and metabolism in barley and green foxtail. Pestic. Biochem. Physiol. 1990, 37, 90–98. [Google Scholar] [CrossRef]
  33. Sterling, T.M. Mechanisms of herbicide absorption across plant membranes and accumulation in plant cells. Weed Sci. 1994, 42, 263–276. [Google Scholar] [CrossRef]
Figure 1. Phenotypic responses of mesotrione-tolerant line 301 (T) and mesotrione-sensitive line 276 (S) under mesotrione stress. (a) The seedling phenotype of both T and S lines on 14th day after mesotrione (T) and H2O (C) treatment. (b) Change in plant fresh weight of both T and S lines under mesotrione and control treatment. (c) Change in plant height of T and S under mesotrione and control treatment. TC represents mesotrione-tolerant line under H2O treatment. TT represents mesotrione-tolerant line under mesotrione treatment. SC represents mesotrione-sensitive line under H2O treatment. ST represents mesotrione-sensitive line under mesotrione treatment. Vertical bars represent the SE (n = 3). Bar = 10 cm.
Agronomy 14 00555 g001
Figure 2. The differentially expressed genes (DEGs) analysis in mesotrione-tolerant line 301 (T) and mesotrione-sensitive line 276 (S) under mesotrione stress. (a) The number of DEGs in both T and S lines after mesotrione treatment. (b) Venn diagram of DEGs in both T and S lines after mesotrione treatment. (c) DEGs heatmap analysis. (d) KEGG analysis of DEGs. (e) Schematic diagram of light-harvesting chlorophyll protein complex. (f) Heatmap of expression of Lhcb genes in both T and S lines after mesotrione treatment.
Agronomy 14 00555 g002
Figure 3. Effects of mesotrione on the PSII photochemistry (Fv/Fm), PSII photochemistry (ΦPSII), photochemical quenching coefficient (qP), and nonphotochemical quenching (NPQ) in leaves of mesotrione-tolerant line 301 (T) and mesotrione-sensitive line 276 (S). TC represents mesotrione-tolerant line under H2O treatment. TT represents mesotrione-tolerant line under mesotrione treatment. SC represents mesotrione-sensitive line under H2O treatment. ST represents mesotrione-sensitive line under mesotrione treatment. Vertical bars represent the SE (n = 3). Small letters (a, b) indicate differences between values obtained on different days after nicosulfuron treatment (p < 0.05) according to a least significant difference (LSD) test.
Agronomy 14 00555 g003
Figure 4. Effects of mesotrione on the activity of phosphoenolpyruvate carboxylase (PEPC), NADP-malic dehydrogenase (NADP-MDH), NADP-malic enzyme (NADP-ME), and pyruvate orthophosphate dikinase (PPDK) in leaves of mesotrione-tolerant line 301 (T) and mesotrione-sensitive line 276 (S). TC represents mesotrione-tolerant line under H2O treatment. TT represents mesotrione-tolerant line under mesotrione treatment. SC represents mesotrione-sensitive line under H2O treatment. ST represents mesotrione-sensitive line under mesotrione treatment. Vertical bars represent the SE (n = 3). Small letters (a, b) indicate differences between values obtained on different days after nicosulfuron treatment (p < 0.05) according to a least significant difference (LSD) test.
Agronomy 14 00555 g004
Figure 5. Effects of mesotrione on the content of chlorophyll a, chlorophyll b, carotenoids, total chlorophyll, chlorophyll-a-to-chlorophyll-b ratio, and chlorophylls-to-carotenoids ratio in leaves of mesotrione-tolerant line 301 (T) and mesotrione-sensitive line 276 (S). TC represents mesotrione-tolerant line under H2O treatment. TT represents mesotrione-tolerant line under mesotrione treatment. SC represents mesotrione-sensitive line under H2O treatment. ST represents mesotrione-sensitive line under mesotrione treatment.
Agronomy 14 00555 g005
Figure 6. Transmission electron micrograph of chloroplasts in mesophyll cells of mesotrione-tolerant line 301 (T) and mesotrione-sensitive line 276 (S) under mesotrione stress. TT represents mesotrione-tolerant line under mesotrione treatment. ST represents mesotrione-sensitive line under mesotrione treatment. The letter S stands for starch granules, V for vacuoles, Ch for chloroplasts, and G and red arrows point to grana lamellae. Bar = 1 µm.
Agronomy 14 00555 g006
Figure 7. Effects of mesotrione on the O2 and H2O2 content in leaves of mesotrione-tolerant line 301 (T) and mesotrione-sensitive line 276 (S). TC represents mesotrione-tolerant line under H2O treatment. TT represents mesotrione-tolerant line under mesotrione treatment. SC represents mesotrione-sensitive line under H2O treatment. ST represents mesotrione-sensitive line under mesotrione treatment. Vertical bars represent the SE (n = 3). Small letters (a, b) indicate differences between values obtained on different days after nicosulfuron treatment (p < 0.05) according to a least significant difference (LSD) test.
Agronomy 14 00555 g007
Figure 8. Effects of mesotrione on the activity of CAT, SOD, POD, and APX in leaves of mesotrione-tolerant line 301 (T) and mesotrione-sensitive line 276 (S). TC represents mesotrione-tolerant line under H2O treatment. TT represents mesotrione-tolerant line under mesotrione treatment. SC represents mesotrione-sensitive line under H2O treatment. ST represents mesotrione-sensitive line under mesotrione treatment. Vertical bars represent the SE (n = 3). Small letters (a, b) indicate differences between values obtained on different days after nicosulfuron treatment (p < 0.05) according to a least significant difference (LSD) test.
Agronomy 14 00555 g008
Disclaimer/Publisher’s Note: The statements, opinions and data contained in all publications are solely those of the individual author(s) and contributor(s) and not of MDPI and/or the editor(s). MDPI and/or the editor(s) disclaim responsibility for any injury to people or property resulting from any ideas, methods, instructions or products referred to in the content.

