Article

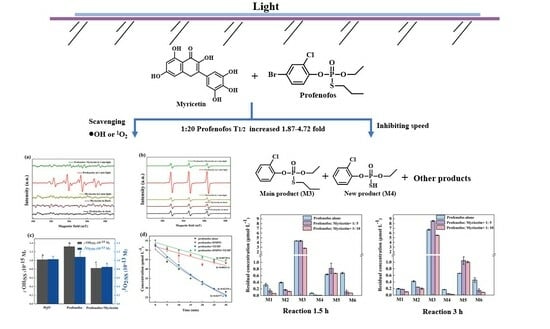
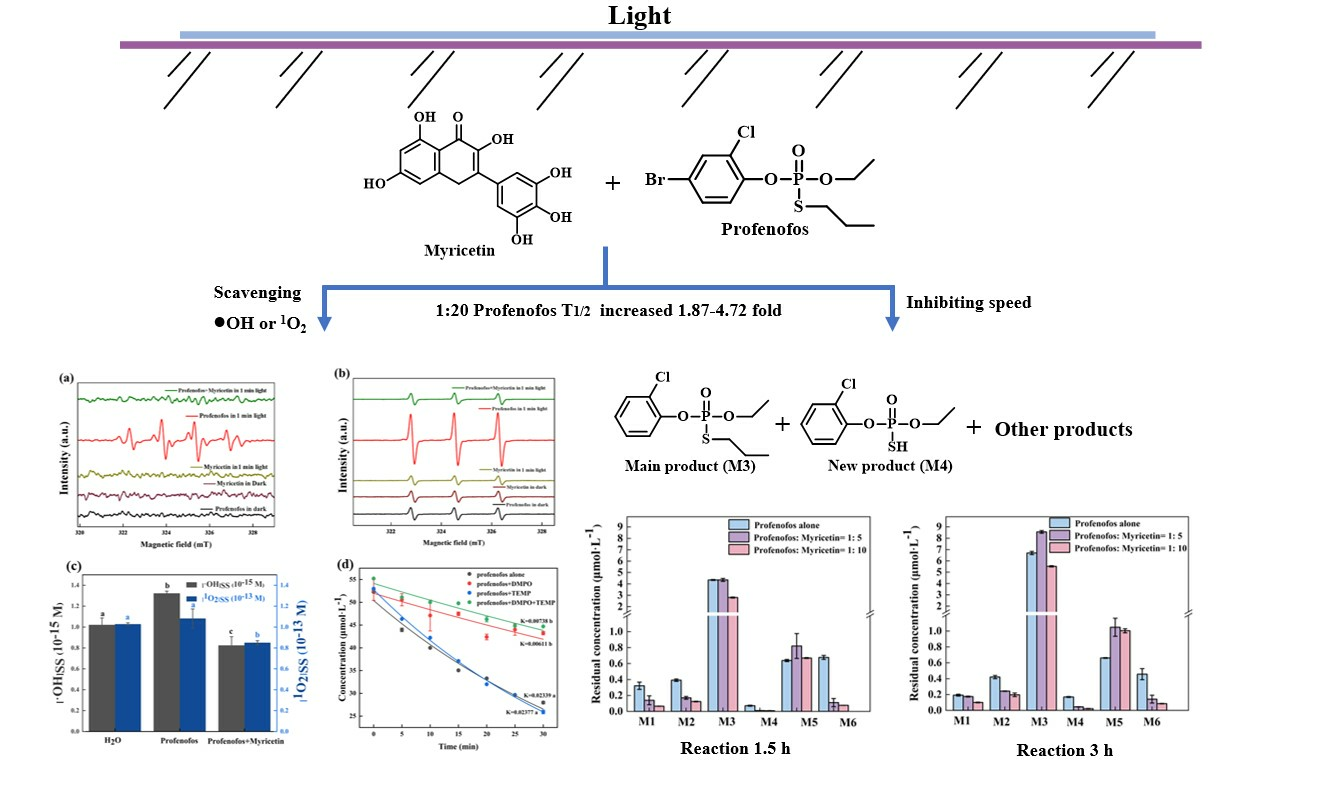
Myricetin Inhibits Photodegradation of Profenofos in Water: Pathways and Mechanisms

1
Key Laboratory of Agri-Food Safety of Anhui Province, School of Resource & Environment, Anhui Agricultural University, Hefei 230036, China
2
Department of Molecular Biosciences and Bioengineering, University of Hawaii at Manoa, Honolulu, HI 96822, USA
*
Author to whom correspondence should be addressed.
Agronomy 2024, 14(2), 399; https://doi.org/10.3390/agronomy14020399
Submission received: 18 January 2024 / Revised: 15 February 2024 / Accepted: 16 February 2024 / Published: 19 February 2024

Abstract

:
Profenofos is a detectable insecticide in the environment with strong toxicity to non-targeted organisms. Photodegradation is a main transformation of profenofos in the environment. Myricetin is a flavonoid that strongly scavenges free radicals. The effect of myricetin on the photodegradation of profenofos was studied. The half-lives (T1/2) of profenofos were 1.7–7.0 and 90 h under artificial light and sunlight. The photolysis rate of profenofos decreased by 1.87–4.72 and 7.62 times with the addition of 20 ratios of myricetin. Free radicals reacting with profenofos were •OH and 1O2, and the key free radical was •OH. Myricetin strongly scavenged •OH and 1O2 which rapidly reacted with profenofos. O-(2-Chlorophenyl)-O-ethyl-S-propyl phosphorothioate (M3) and O-(2-chlorophenyl)-O-ethyl phosphorothioate (M4) were major and new photoproducts of profenofos. According to the Ecological Structure Activity Relationships, photodegradation of profenofos was a detoxification process, but myricetin inhibited the photodegradation of profenofos and its photoproducts. These results highlight the implication of myricetin on the fate and potential risk of profenofos in the environment.

Graphical Abstract

1. Introduction

Profenofos is an organophosphorus insecticide and is used to control pests on vegetables, fruits, and grain crops [1,2,3,4]. However, only a small fraction of profenofos can be absorbed by pests, while most of the rest drifts to the environment and is often detected in agricultural water. For example, profenofos contaminations of up to 2.3 mg·L−1 were found in the Bubula River [5], and 0.074 ± 0.04 μg·L−1 and 0.303 ± 0.07 μg·L−1 in water of the Tano River during the rainy and drought seasons [6]. Profenofos has strong toxicity towards non-targeted organisms, including humans. Profenofos can form adduct with tubulin in vitro [7]. Rajesh and David [8] documented that profenofos had hepatotoxic effects on rats. Profenofos also exhibited acute toxicity to zebrafish [9] and tadpoles [10]. Profenofos pollution is of concern.
The degradation of profenofos encompasses biological and chemical processes in the environment [11]. Photodegradation is the main transformation pathway of profenofos [12], particularly on the surface of water, where solar irradiation is abundant during the daytime [13]. Photodegradation reactions may include isomerization, oxidation, or substitution [14,15]. Profenofos can undergo direct photodegradation upon photon absorption or react with reactive oxygen species (ROS), such as singlet oxygen (1O2) and hydroxyl radical (•OH) in the environment. Lv et al. [16] found that •OH and 1O2 were two important radicals in the photolysis of profenofos. Samara et al. [17] reported profenofos photodegraded 73% in 60 min in the presence of Ag-Pt-Zeolite. Ratpukdi et al. [18] found that the degradation rate of profenofos was three times faster under vacuum ultraviolet than ultraviolet (UV) because of •OH. Therefore, it is of great significance to reveal the environmental fate and implication through the study of the photolysis behavior of profenofos.
Although there is much research on the photodegradation of profenofos in water, most of it focuses on the advanced oxidation of profenofos and does not consider the photodegradation of profenofos in the actual environment. Various influencing factors are complex in the actual environment, such as flavonoids, which are from leaves, barks, and fruit residues [19,20,21,22,23,24,25]. Flavonoids can remove free radicals from water, thus inhibiting the photodegradation of profenofos [16], increasing the environmental risk of profenofos. It is necessary to study the effect of these flavonoids on the photodegradation of profenofos.
In this study, myricetin is used as a representative of flavonoids because it has the strongest ability to remove free radicals among flavonoids [26,27]. First, we found that myricetin inhibited the photodegradation of profenofos under artificial light and nature light. Then, we studied the mechanism that myricetin scavenged •OH and 1O2 and discovered that the key free radical was •OH. In addition, we predicted the degradation pathway of profenofos. It fills the gap in the study of the photoproducts of profenofos in the environment and predicts the toxicity of photoproducts. Through our work, we can further understand the aquatic photodegradation of profenofos.

2. Materials and Methods

2.1. Chemicals and Reagents

Myricetin and 4-bromo-2-chlorophenol (M6) were procured from Shanghai Macklin Biochemical Technology Co., Ltd. (Shanghai, China). Profenofos (95.8%) was sourced from Dr. Ehrenstorfer (Augsburg, Germany). 5,5-Dimethyl-1-pyrroline-N-oxide (DMPO) and 4-hydroyl-2,2,6,6-tetramethylpiperidine (TEMP) were obtained from Sigma-Aldrich (Shanghai, China). Furfuryl alcohol (FFA) and p-chlorobenzene acid (pCBA) were purchased from Shanghai Aladdin Biochemical Technology Co., Ltd. (Shanghai, China).and Titan Scientific Co., Ltd. (Shanghai, China). Acetonitrile and methanol in high-performance liquid chromatography (HPLC) grade were acquired from Tedia Co., Ltd. (Fairfield, OH, USA). O-(4-Bromo-2-chlorophenyl)-O-ethyl phosphate (M1), O-(4-bromo-2-chlorophenyl)-O-ethyl-S-hydroxy phosphorothioate (M2), O-(2-chlorophenyl)-O-ethyl-S-propyl phosphorothioate (M3), O-(2-chlorophenyl)-O-ethyl-S-hydrogen phosphorothioate (M4), and O-(2-chloro-4-hydroxyphenyl)-O-ethyl-S-propyl phosphorothioate (M5) were purchased from Shanghai Yanying Trading Co., Ltd. (Shanghai, China).

2.2. Photolysis Experiments

According to previously reported studies [28,29,30], profenofos photodegradation was at a vertical angle light under sunlight (N31°52′, E117°17′, 22 to 23 August 2022, continuous light for 8 h every day, 36,000–130,000 lx) and four artificial light sources, high-pressure mercury lamp (HPML, 500 W, 700,000–9,300,000 lx) with a 250–400 nm emission spectrum, UV lamp (1000 W, 60–100 lx) with a 254 nm emission spectrum, and xenon lamp (500 W, 3600–11,000 lx) with a 365–800 nm emission spectrum. A photometer from Delixi (Shenzhen, China) was used to measure light intensity. The spectra are shown in Figure S1 (Supporting Information). The temperature recorded under direct sunlight fluctuated within the range of 30 to 52 °C. The temperature of the HPML and UV lamps was controlled at 25 ± 1 °C, and the temperature of the xenon lamp was controlled at 46 ± 1 °C. The dissolved oxygen (Taiwan Hengxin Co., Ltd., Taiwan, China) concentration was 8.0 mg·L−1 in purified water. The experimental procedures were conducted within quartz glass tubes, each at the same distance from the light sources. The standard stock solution of profenofos was 5 mmol·L−1 and myricetin was 1.25, 6.25, 12.5, and 25 mmol·L−1 with methanolic solutions. We added profenofos 0.25 mL and myricetin 1 mL to a 250 mL volumetric flask at ratios of 1:1, 1:5, 1:10, and 1:20, respectively. The ultimate concentration of profenofos reached 5 μmol·L−1, while the final concentrations of myricetin reached 5, 25, 50, and 100 μmol·L−1. Profenofos, myricetin, and pure water were thoroughly mixed with 0.5 min of shaking and 1 min of sonication. Each quartz glass tube with a diameter of 5 cm was filled with 5 mL of the resulting mixture, with three tubes per parallel group. The control in a quartz glass tube was wrapped in tin foil and placed under light with the treatment samples. Sampling was performed at a specific time.

2.3. Sample Analysis of Profenofos Photodegradation Kinetics

Profenofos was eluted with a mobile water–acetonitrile phase (15:85) at a flow rate of 1 mL·min−1 from a C18 column (Agilent XDB C18, 4.6 mm × 250 mm) (Agilent Technologies Co., Ltd., Sunnyvale, CA, USA) and detected with a Waters 2695 (Waters Corp., Milford, MA, USA) at 210 nm. The column temperature was meticulously regulated at 30 °C. The limit of detection was 0.05 μg·L−1 of profenofos.
The photolysis rate was calculated as follows:
P h o t o l y s i s   r a t e   ( % ) = [ ( a b ) / a ] × 100
Here, “ a ” and “ b ” denote the residual concentration of profenofos under the dark control and light treatment conditions, respectively.
The inhibition rate of profenofos degradation was expressed as
I n h i b i t i o n   r a t e   ( % ) = [ ( k 0 k ) / k 0 ] × 100
Here, “ k 0 ” and “ k ” represent the photolysis rate of profenofos without and with myricetin, respectively.
The photodegradation half-life ( T 1 / 2 ) was defined as the time taken for the residue concentration to decrease, expressed as
T 1 / 2 = l n 2 / k
Here, “ k ” represents the photolysis rate constant, and its calculation involves the use of
C t = C 0 e k t
Here, “ C 0 ” and “ C t ” represent the residual concentrations under the light treatment at times 0 and t, respectively.

2.4. Identification and Quantification of Photoproducts

A ThermoFisher QE focus mass spectrometer was used to preliminarily identify the photoproducts of profenofos. Positive and negative ionization modes were used. An Acquity UPLC BEN C18 column (1.7 um, 2.1 mm × 100 mm, Waters Corp., Wexford, Ireland) was employed for analyte separation. The mobile phase composition is detailed in Table S1a. Positive and negative ion spray voltages were set at +3800 and −3200 V, respectively. The ion source gas pressure was maintained at 50 psi, with a gas flow rate of 35 L·min−1. Parameters such as unfolding potential, collision energy, and collision energy spread were configured at 80 V, 35 eV, and ±15 eV, respectively. The mass spectrometer was operated in full scan mode; m/z50–750 was set in full mass-ddMS2 mode.
Photoproducts (M1–M6) were quantified with Waters UPLC-Xevo TQ-S MS (Waters Corp., Milford, MA, USA). The mobile phase is shown in Table S1b. The ion spray voltage was maintained at 5500 V. The ion source temperature was set to 500 °C. The ion source gas pressure was sustained at 50 psi, and the gas flow rate was maintained at 35 L·min−1. Additional parameters such as unfolding potential, collision energy, and collision energy spread were configured at 80 V, 35 eV, and ±15 eV, respectively. The parameters related to parent and daughter ions are shown in Table S2.

2.5. Detection of Free Radical Species and Steady-State Concentrations

Reactive oxygen species (ROS) were assessed via electron spin resonance (ESR) using standard treatments of DMPO and TEMP [31]. Steady-state concentrations of ROS were determined with FFA and pCBA. The degradation of FFA was quantified utilizing a Waters 2695 (Waters Corp., Milford, MA, USA) with a C18 column (Agilent XDB, C18, 4.6 mm × 250 mm, Agilent Technologies Co., Ltd., Sunnyvale, USA) at 219 nm. The mobile phase consisted of a water–acetonitrile (60:40) solution, delivered at a flow rate of 1 mL·min−1, while the column temperature was maintained at 30 °C. Simultaneously, the degradation of pCBA was assessed employing an Agilent 1200 (Agilent Technologies Co., Ltd., Sunnyvale, USA) equipped with an Agilent XDB C18 column (4.6 mm × 250 mm) and detection at 234 nm. The mobile phase comprised 0.2% H3PO4 in a water–acetonitrile mixture (30:70) at a flow rate of 1 mL·min−1, with the column temperature consistently held at 30 °C [32,33]. The free radical species were measured using
d [ F F A ] d t = k F F A O 2   1 S S [ F F A ]
d [ F F A ] d t = k e x [ F F A ]
O 2   1 S S = k e x / k F F A
d p C B A d t = k p C B A O H S S p C B A
d p C B A d t = k e x p C B A
O H S S = k e x / k p C B A
Here, k F F A was 1.2 × 10⁸ M−1·S−1, k p C B A was 5.2 × 10⁹ M−1·S−1, and k e x was the pseudo-first-order rate constant derived from experiments.

2.6. Statistical Analysis and Comparison

Statistical analyses were conducted with IBM SPSS 22.0 software. The data represent the mean ± standard deviation of three independent experiments. An ANOVA, followed by Duncan’s multiple range tests, was employed to assess differences between treatments, with a confidence level set at 0.05. The accuracy and precision of sample pretreatment methods for profenofos, six photoproducts, and myricetin were assessed by spike recovery experiments, as shown in Table S4.

3. Results and Discussion

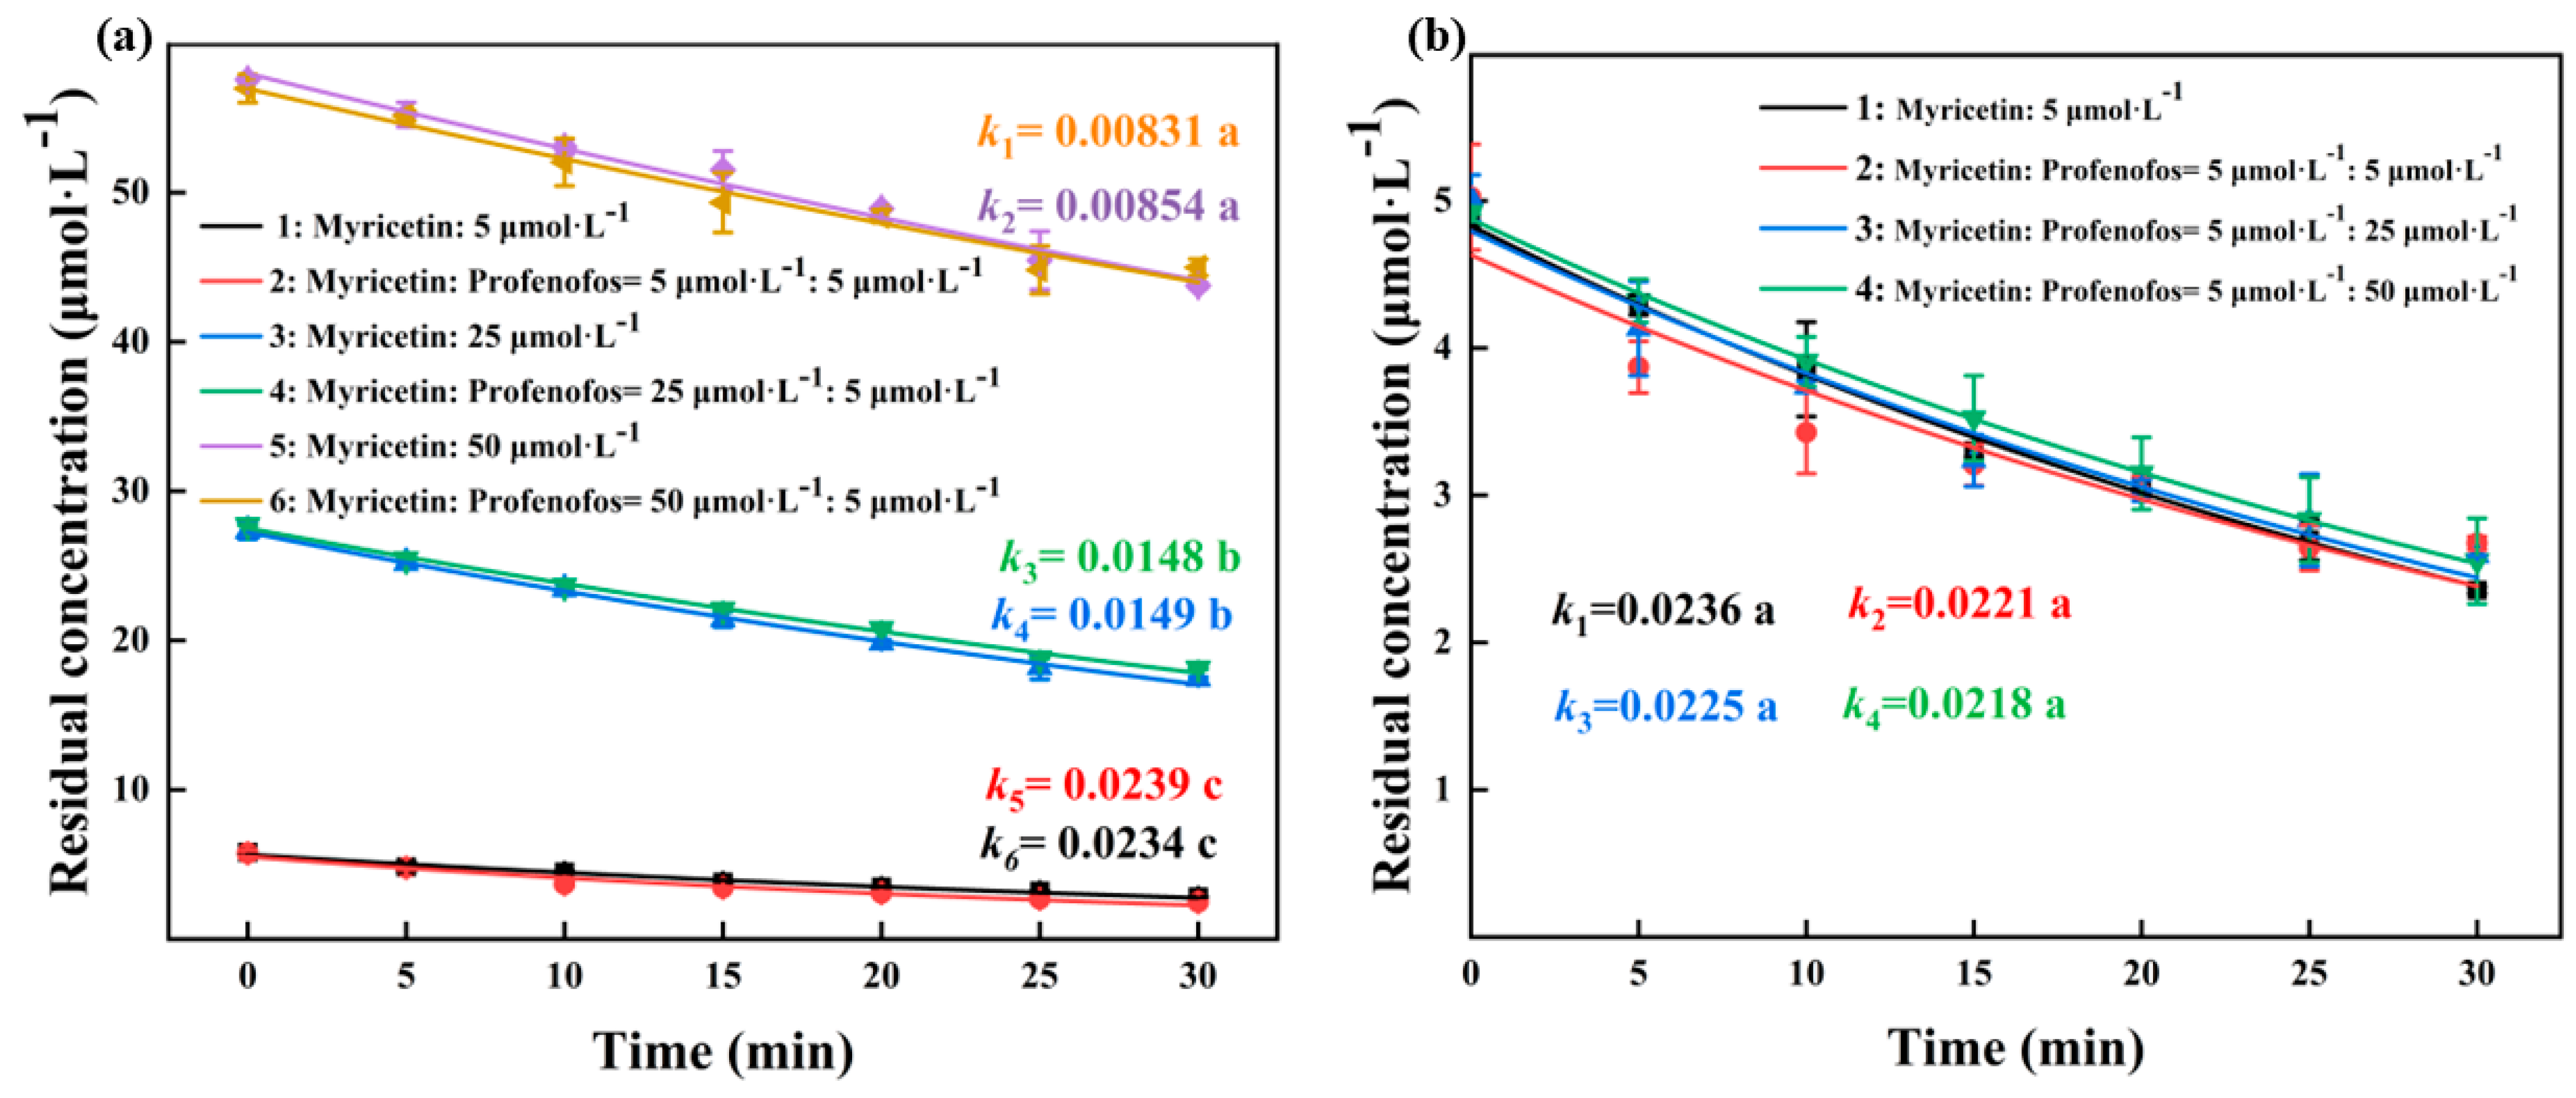
3.1. Myricetin Inhibited Profenofos Photolysis in Water under Artificial Light and Sunlight Irradiation

Light irradiation exerted an influence on the photolysis of profenofos across distinct wavelengths, light intensities, and temperatures. The T1/2 of profenofos were 1.73, 4.92, 7.00, and 90.0 h under HPML, UV lamp, xenon lamp, and sunlight, respectively (Table 1). They are significant different (p < 0.05). It was reported that the maximum absorption wavelength of profenofos was 200 nm [34], which was close to the emission wavelength of HPML, followed by UV lamp, xenon lamp, and sunlight. The xenon lamp has a more stable irradiation intensity and higher temperature (temperature is based on the actual measurement in the experiment) than sunlight. Therefore, the T1/2 of profenofos under sunlight were longer than that under HPML, UV lamp, or xenon lamp. The T1/2 of profenofos decreased by 1.08, 1.39, 2.44, and 3.61 times in the presence of 1, 5, 10, and 20 equivalents of myricetin. The inhibition became more significant as the concentration of myricetin increased. The inhibition rates of 20 equivalents of myricetin on profenofos were 72.39%, 46.38%, 78.79%, and 86.88% in HPML, UV lamp, xenon lamp, and sunlight. They have significant differences (p < 0.05). One effect of myricetin on profenofos photolysis involves the competition for light absorption, given that the absorption spectra of myricetin peak at wavelengths of 210, 252, and 370 nm (Figure S2). This suggests a potential competition for light absorption between myricetin and profenofos. The other effect could involve the scavenging of reactive species. The variations in the photodegradation rate of profenofos observed with different concentrations of myricetin under various light sources, including HPML, UV, xenon, and sunlight irradiation, may be associated with the reactivity of myricetin in scavenging reactive species under distinct light conditions, thereby influencing the competition for light absorption with profenofos.

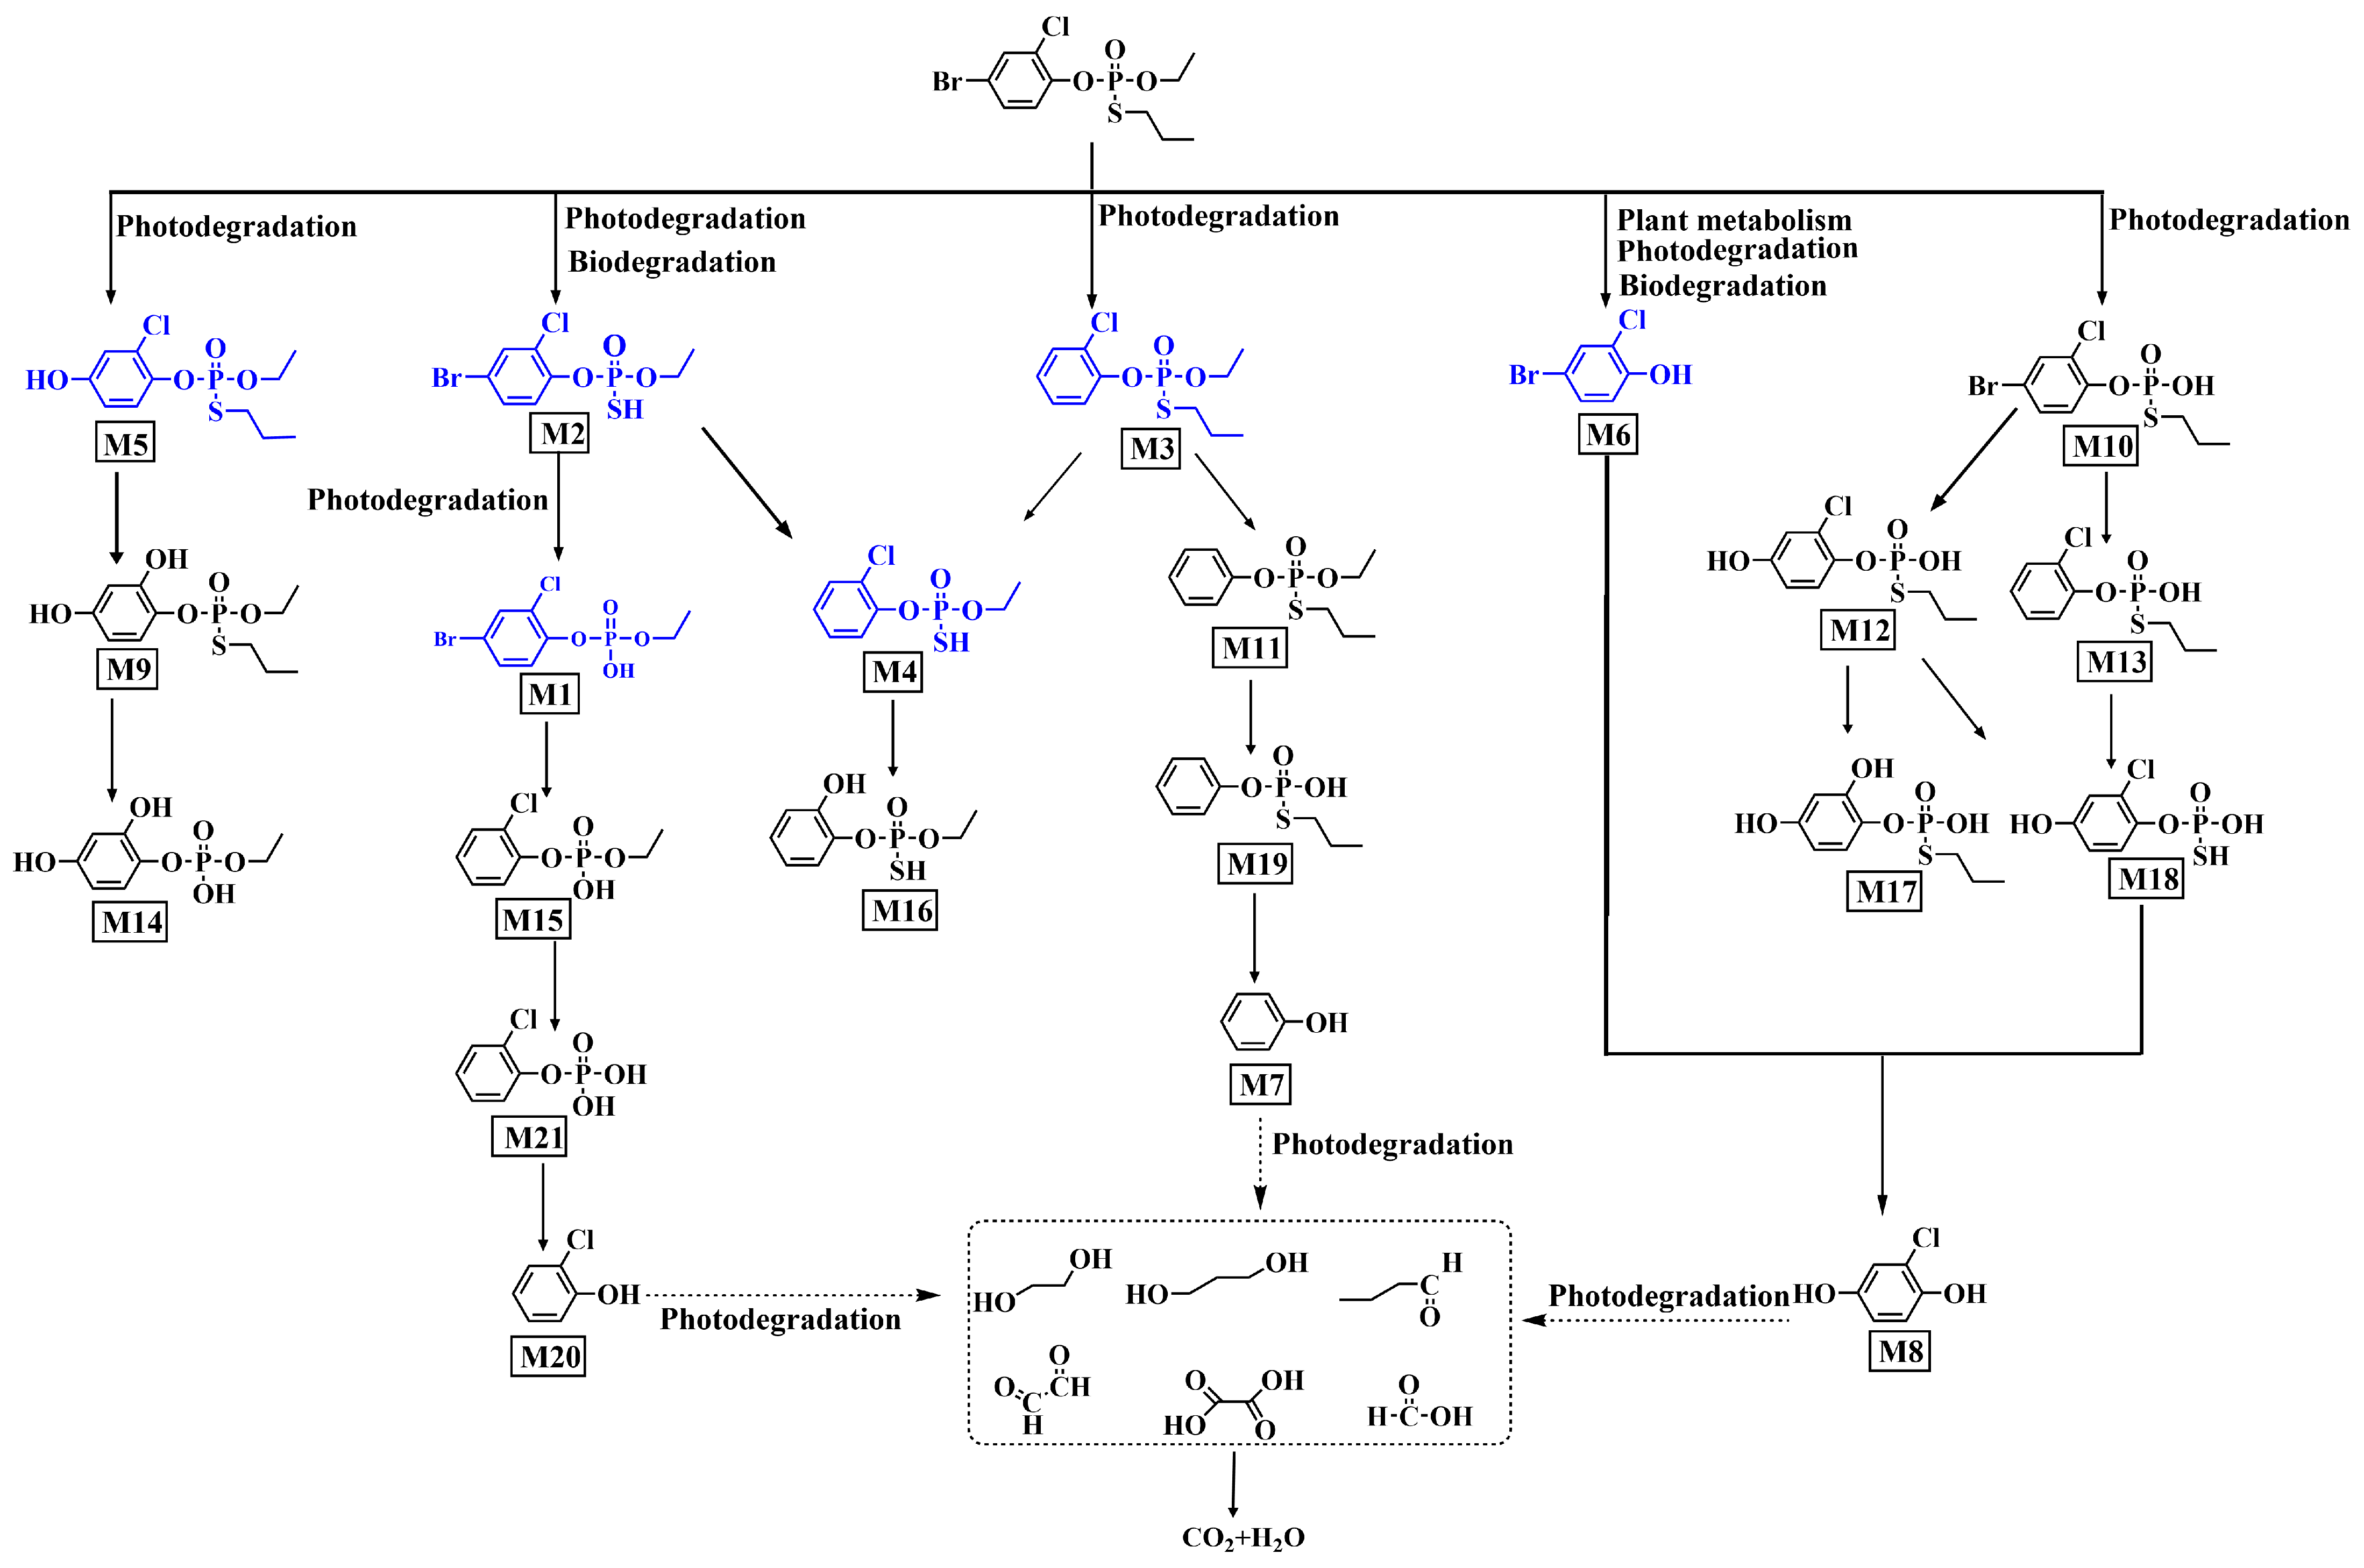
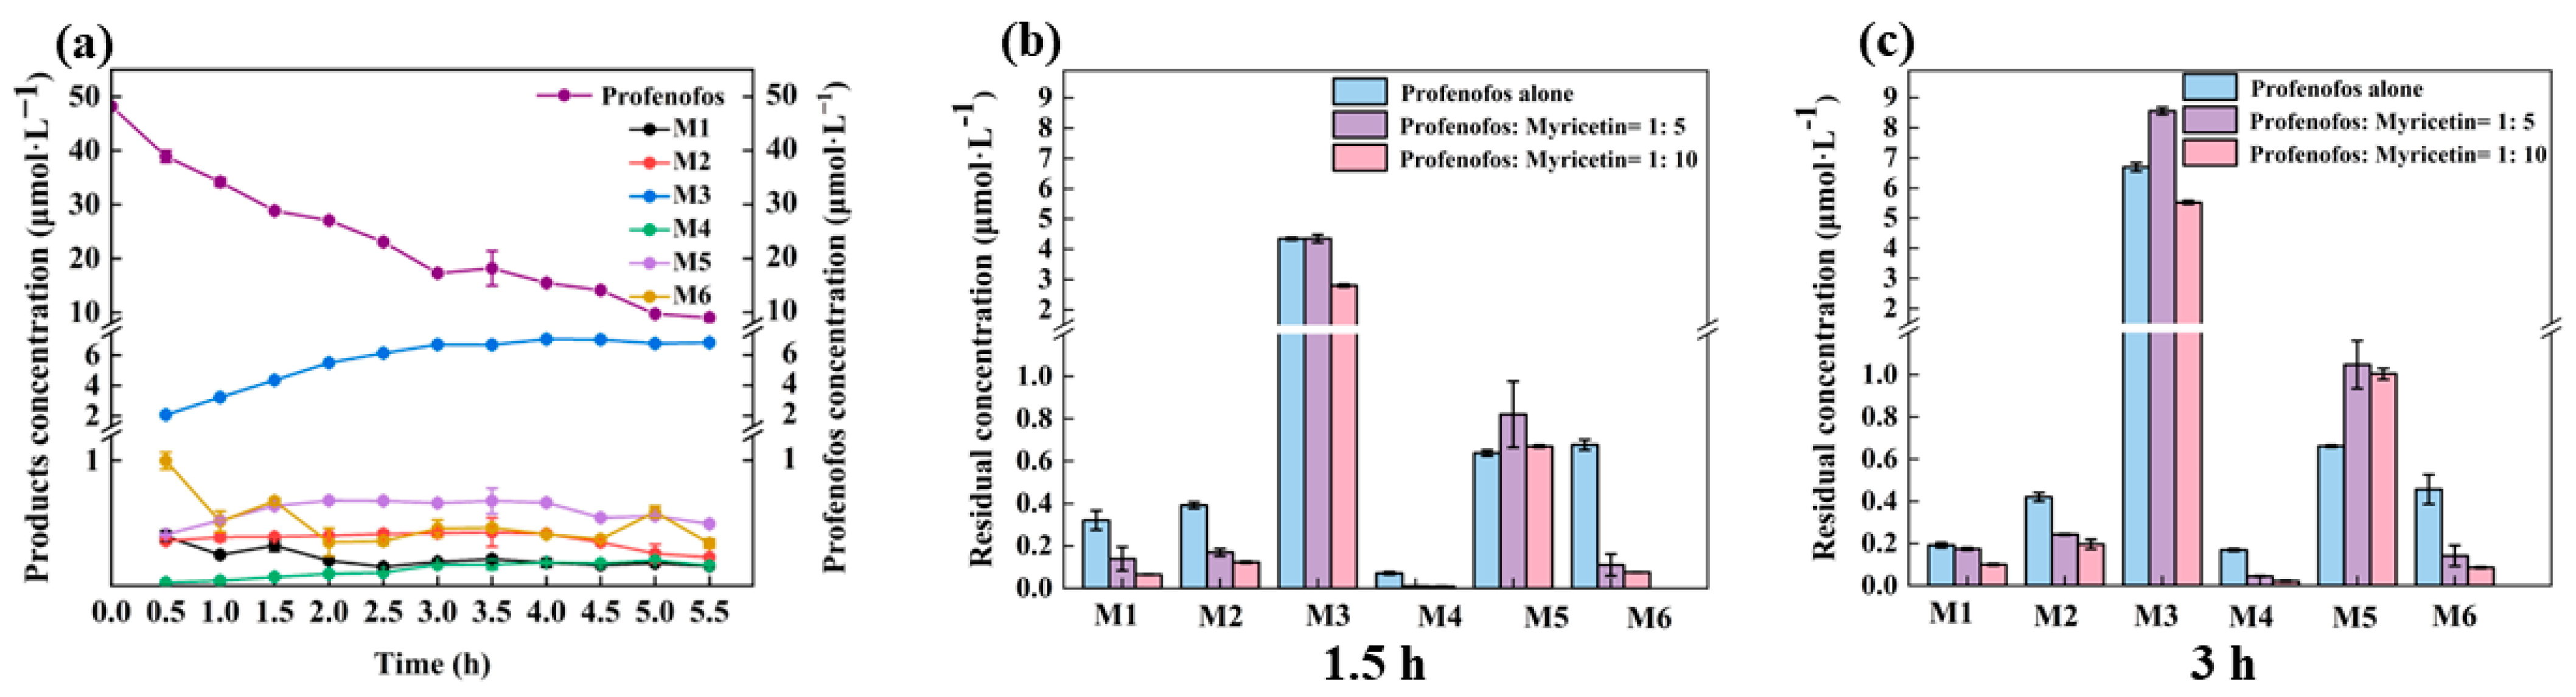
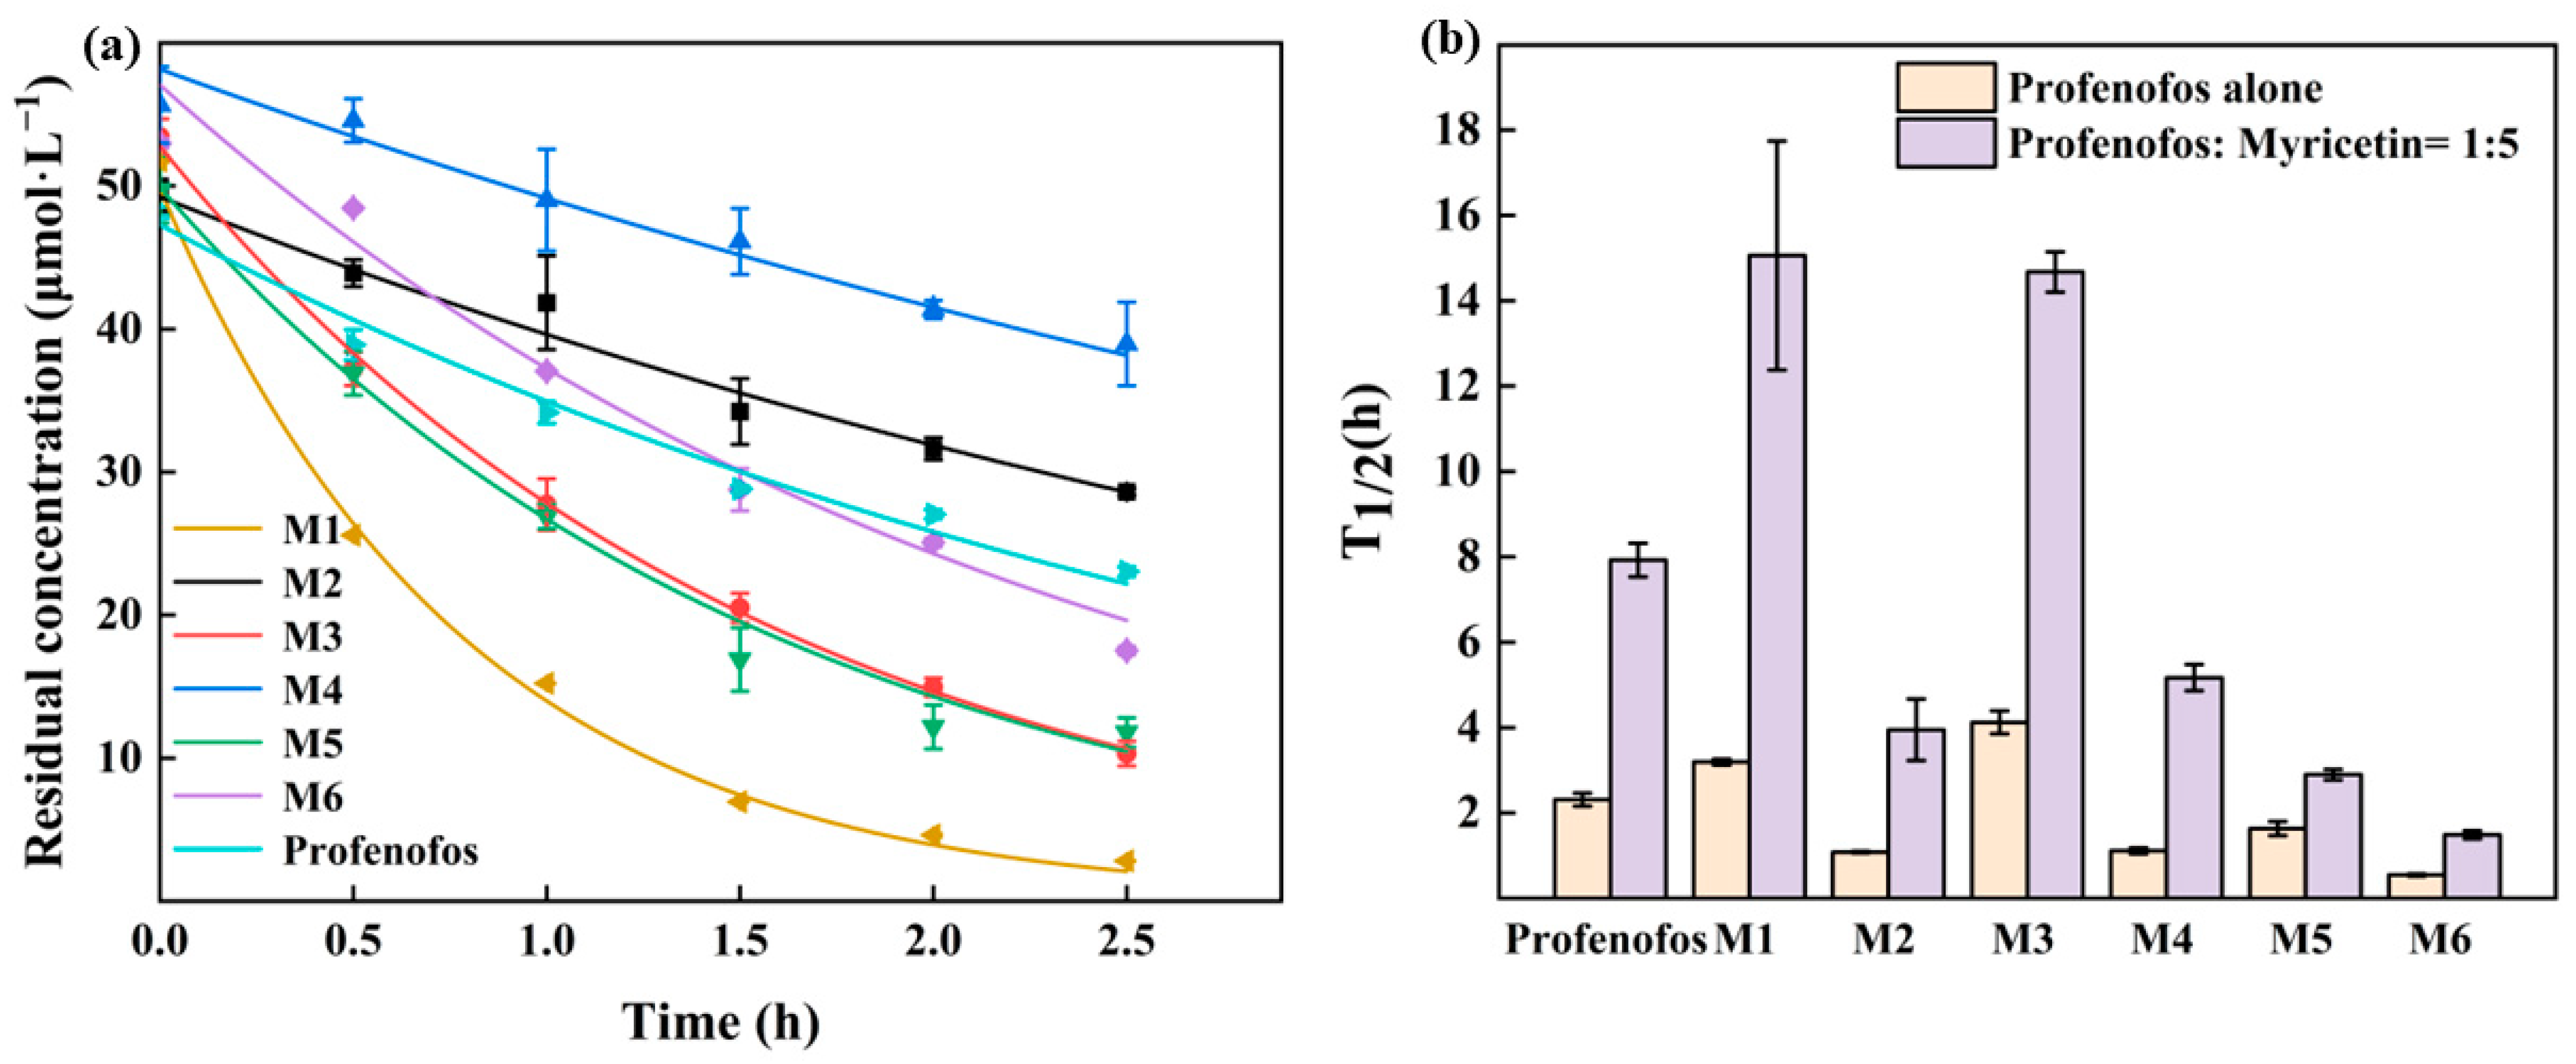
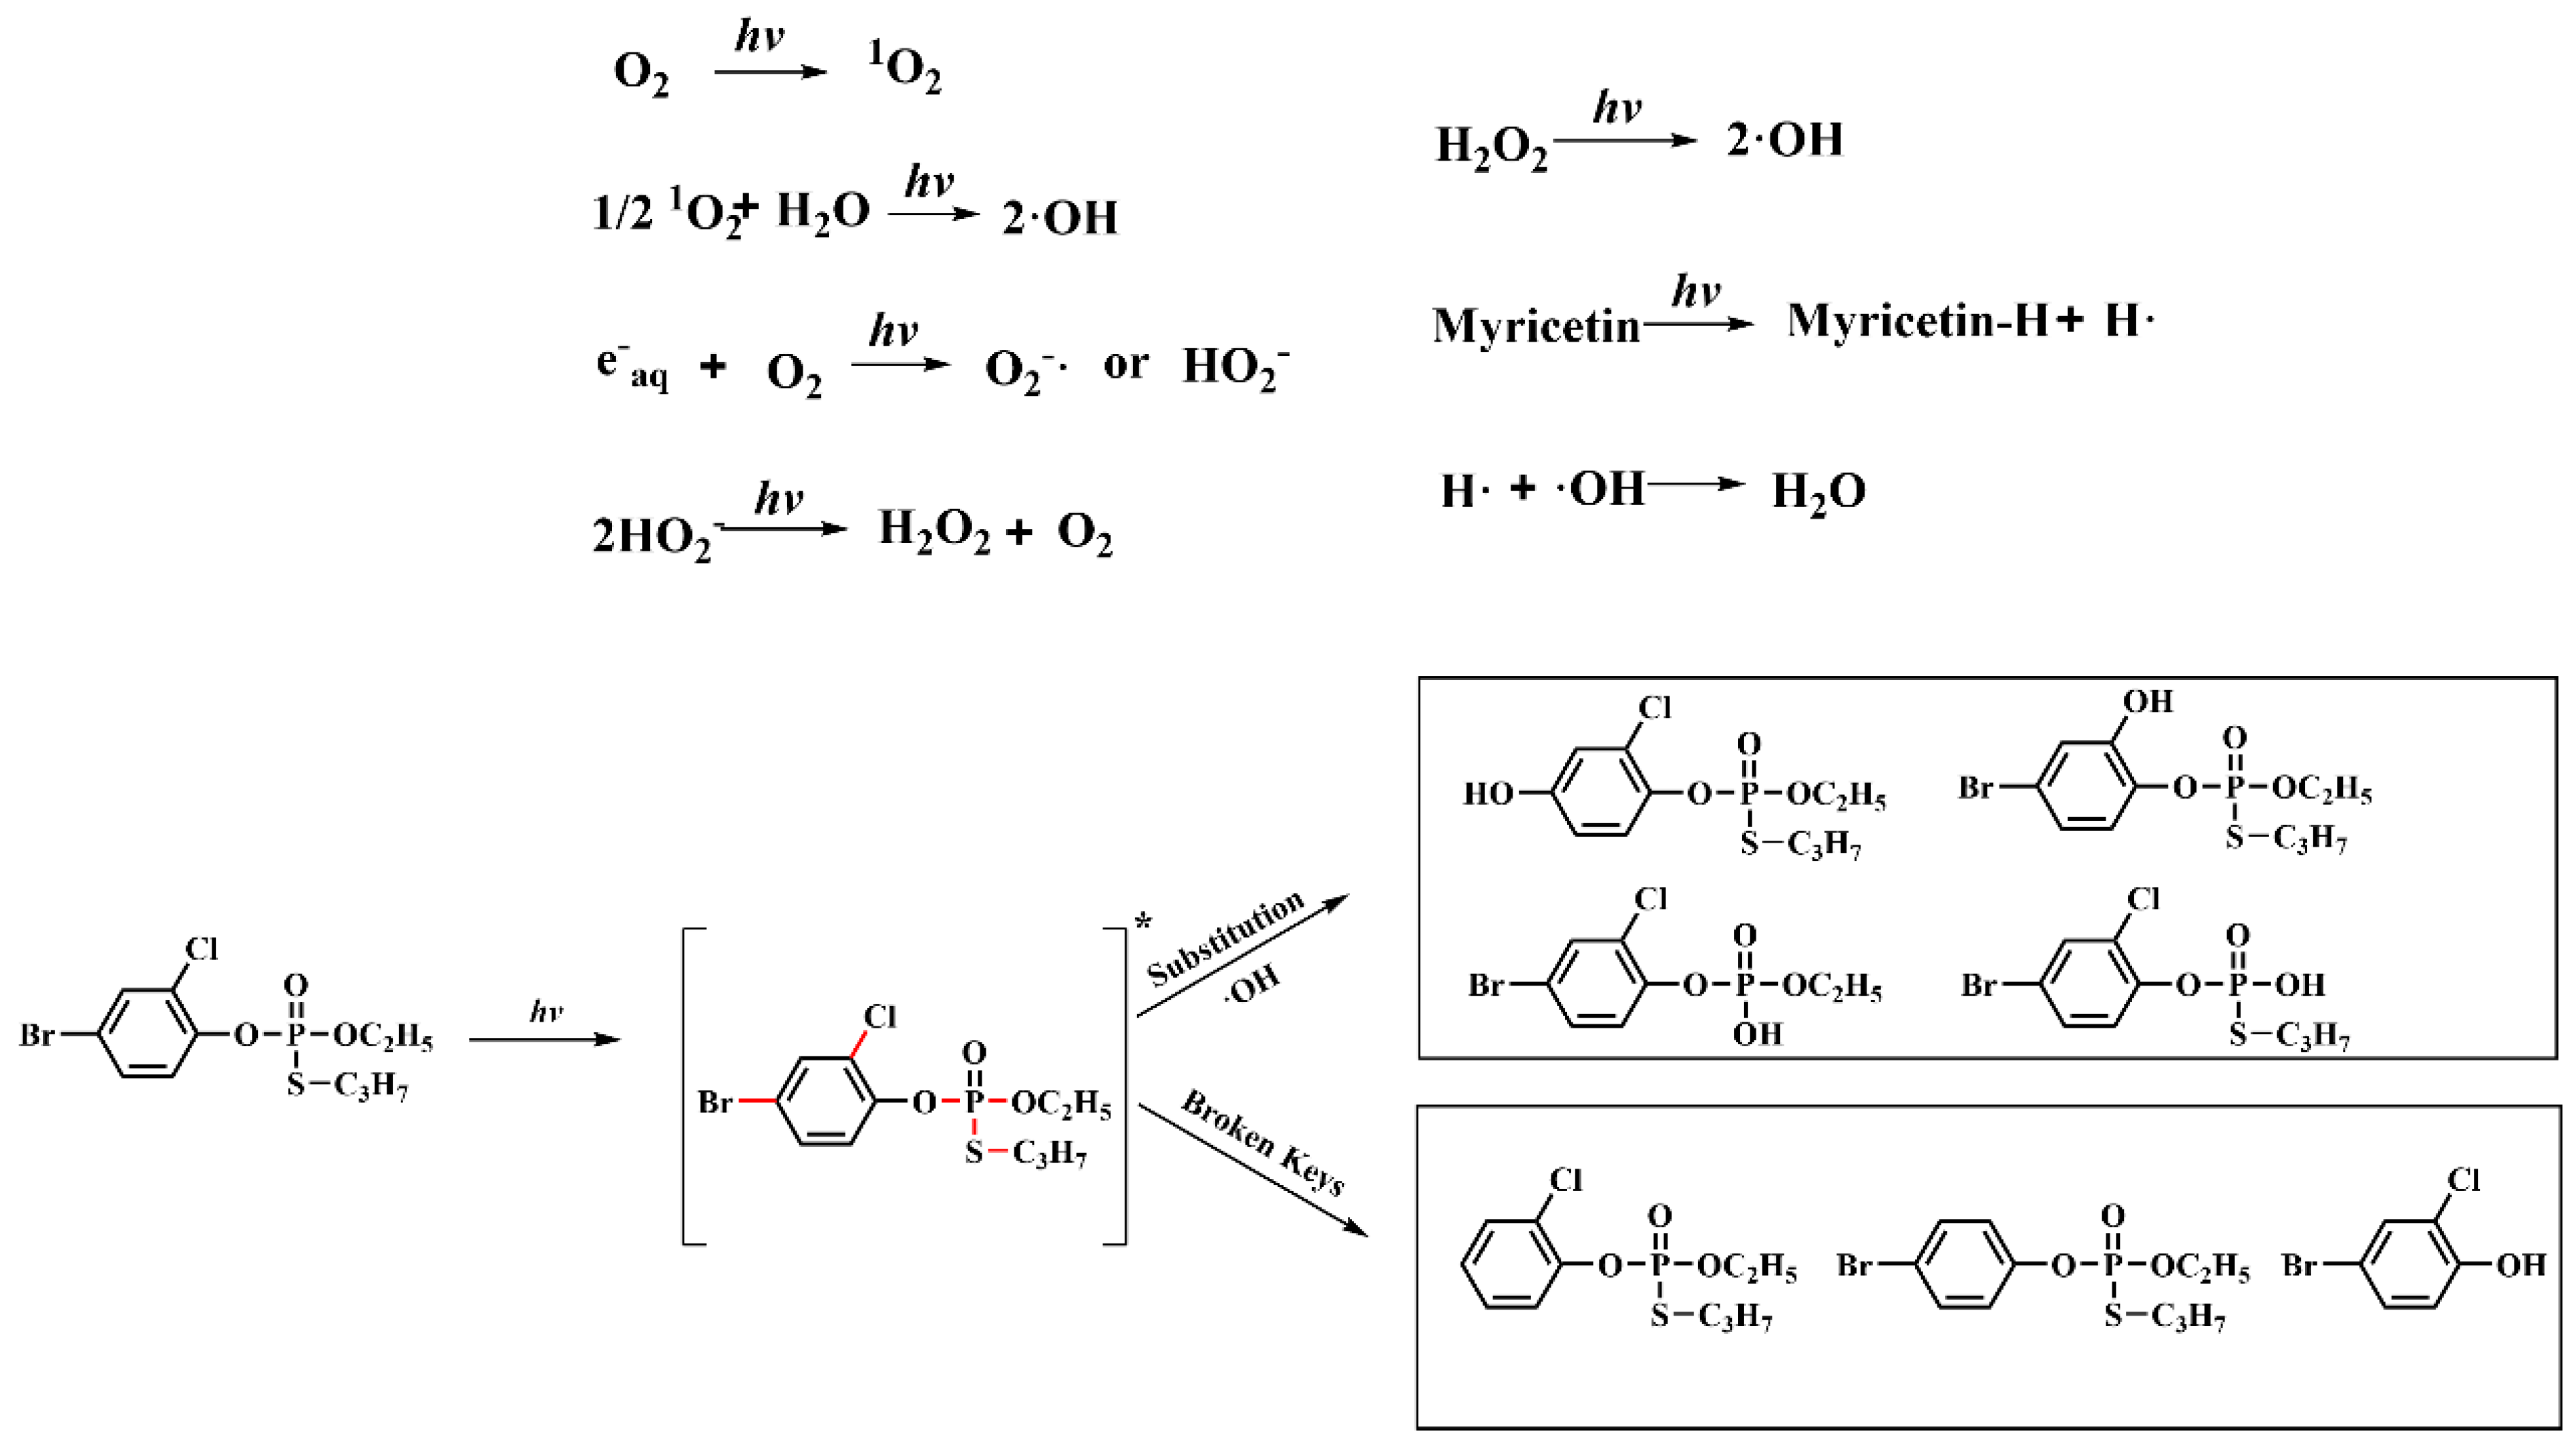
3.2. Photodegradation Pathway of Profenofos with and without Myricetin

Using a ThermoFisher QE focus mass spectrometer, we identified and analyzed six photoproducts (M1–M6). O-(4-Bromo-2-chlorophenyl)-O-ethyl phosphate (M1), O-(4-bromo-2-chlorophenyl)-O-ethyl-S-hydroxy phosphorothioate (M2), O-(2-chlorophenyl)-O-ethyl-S-propyl phosphorothioate (M3), O-(2-chloro-4-hydroxyphenyl)-O-ethyl-S-propyl phosphorothioate (M5), 4-bromo-2-chlorophenol (M6), and O-(4-bromo-2-chlorophenyl)-S-propyl-O-hydroxy phosphorothioate (M10) were reported by previous studies [20,35,36,37,38,39]. Surprisingly, O-(2-chlorophenyl)-O-ethyl-S-hydrogen phosphorothioate (M4) was a new photoproduct in the present study, and M3 was a main photoproduct. Therefore, we identified a new photolysis pathway for profenofos (Figure 1). Mass spectra of photoproducts are shown in Figures S3–S24 and Table S3. Figure 2a shows the concentrations curves of M1–M6 during profenofos photolysis under HPML. After 5.5 h of HPML irradiation, M3 was the main photoproduct among the six photoproducts probably because the C-Br bond was easy to break and more resistant to photodegradation [18]. Debromination may be an important pathway of profenofos photodegradation. The concentrations of M1, M2, M3, M4, M5, and M6 were 0.16, 0.23, 6.82, 0.16, 0.5, and 0.34 μmol·L−1, while profenofos photolyzed 39.2 μmol·L−1 (Figure 2a). The total concentrations of the six photoproducts were less than those of degraded profenofos because M1 to M6 were further degraded.
M1–M6 and profenofos concentrations are shown with and without myricetin under 1.5 and 3 h HPML irradiation (Figure 2b,c). After 1.5 h and 3 h irradiation, M3 concentration did not show an obvious difference with and without 5 molar ratios of myricetin. In the photolysis mixture of profenofos with 5 molar ratios of myricetin, M3 and M5 generated more than that without myricetin after 3 h irradiation. In the photolysis mixture of profenofos solution with 10 molar ratios of myricetin, the generation of M3 was decreased, while that of M5 was slightly changed. It indicated that a higher concentration of myricetin decreased the generation of M3. The degradation kinetics of M1–M6 are shown in Figure 3a. The k values of M1–M6 were 0.22, 0.64, 0.17, 0.62, 0.43, and 1.27 h−1, while the k values of profenofos was 0.30 h−1. M2, M4, M5, and M6 degraded faster than profenofos, while M1 and M3 degraded slower than profenofos. Figure 3b shows the T1/2 of M1–M6 with 5 molar ratios of myricetin and without myricetin under HPML irradiation. In the presence of myricetin, the T1/2 of M1–M6 were 3.19, 1.08, 4.12, 1.11, 1.63, and 0.55 h. The photodegradation rates of M1 and M3 decreased by about 5 times, and M2 and M4 decreased by 2.5 times, while M5 and M6 decreased 1 time in the presence of 5 molar myricetin. Myricetin also had a different ability to inhibit the photoproducts of profenofos.
The Ecological Structure Activity Relationships (ECOSAR) prediction of profenofos and its photoproducts and the Globally Harmonized System (GHS) toxicity rating showed that profenofos was highly toxic to fish and Daphnia and moderately toxic to green algae. Photoproducts were generally less toxic than the parent, except for M6, M7, M8, M12, M20, and M21, which were more acutely toxic to green algae than the parent. All the photoproducts showed a more susceptible substance to green algae, especially chronic toxicity (Table S5). Thus, the profenofos photolysis belonged to detoxification. Myricetin not only inhibited the photolysis of profenofos but also inhibited the photodegradation of the photoproduct. Myricetin is a hazardous substance for profenofos. However, myricetin is ubiquitous in the environment, so the interaction between myricetin and profenofos should be paid special attention.

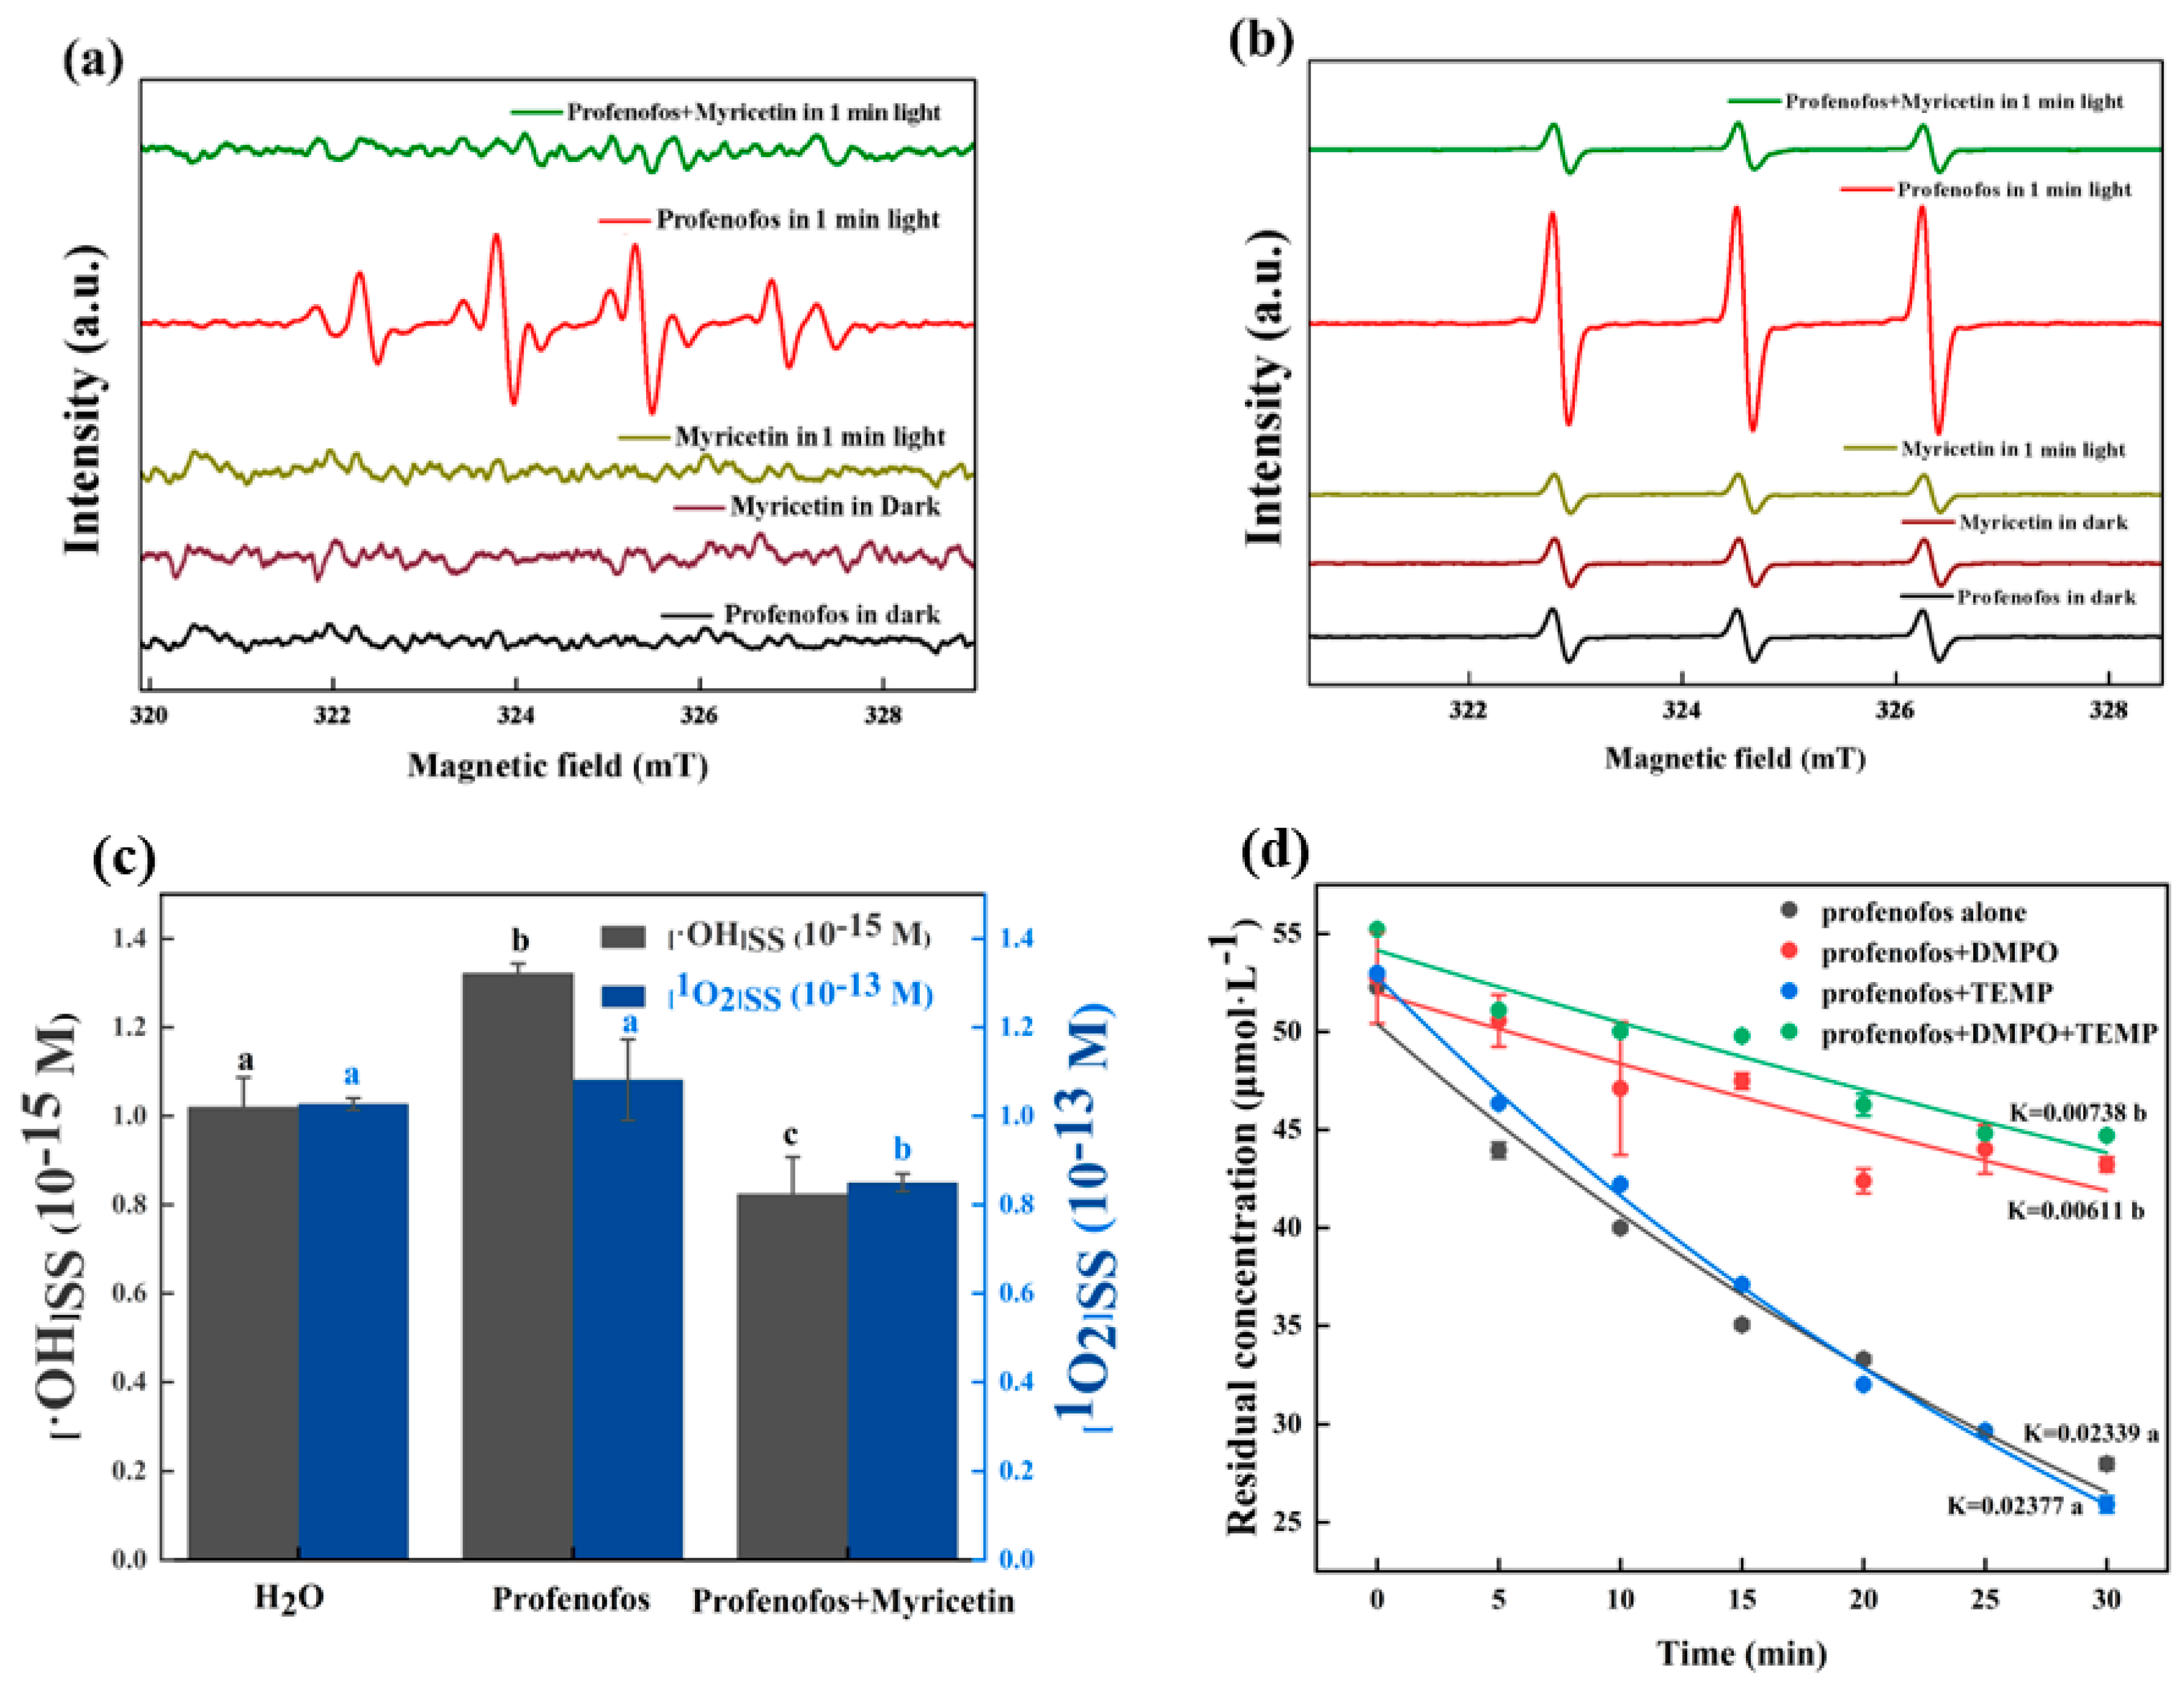
3.3. Scavenging Reactive Species of Myricetin on Profenofos Photodegradation

3.3.1. Generation of •OH and 1O2 during Profenofos Photolysis

Electron spin resonance (ESR) is a spectroscopic technique which can detect free radicals. The spin trap can form stable adducts with ROS and then produce specific ESR signals. This ability was used to determine the type of radicals produced in photochemical reactions. Figure 4a shows that no ESR signals occurred after the addition of DMPO to profenofos and myricetin solutions in the dark. After 1 min of illumination, myricetin did not show ESR signals, while profenofos had a 1:2:2:1 DMPO-OH specific signal. This indicated that the profenofos solution produced •OH under light. Similarly, a TEMP-1O2 (1:1:1) signal was found after 1 min of illumination (Figure 4b), indicating that •OH and 1O2 were generated during profenofos photodegradation. These two specific signals disappeared after the addition of myricetin, suggesting that myricetin could scavenge the production of •OH and 1O2, thus reducing the photodegradation rate of profenofos [40].
The steady-state concentration of free radicals can reflect the rate of their degradation in reaction with organics. FFA acts as a probe for 1O2 and does not react with other ROS at concentrations below 10 mM [41]. The steady-state concentration of singlet oxygen in water was quantified as 4.14 × 10⁻¹³ M by Zhang [42]. According to KFFA = 1.2 × 10⁸ M−1·S−1 [43], the steady-state concentration of singlet oxygen in water was calculated as 1.03 × 10⁻¹³ M. The steady-state concentration of 1O2 in the profenofos solution was 1.08 × 10⁻¹³ M, clos to the 1O2 in water. In contrast, the steady-state concentration of 1O2 in the profenofos–myricetin solution was 8.49 × 10⁻¹⁴ M. 1O2 concentrations decreased after the addition of myricetin to the solution (Figure 4c). The steady-state concentrations of •OH in water exhibited a range from 1.5 × 10⁻¹⁸ to 5 × 10⁻¹⁶ M. The production of •OH in the solution was detected by adding pCBA. According to KpCBA = 5.2 × 10⁹ M−1·S−1 [44], the steady-state concentrations of •OH in a blank aqueous solution and an aqueous profenofos solution were determined as 1.02 × 10⁻¹⁵ and 1.32 × 10⁻¹⁵ M, respectively. It was found that the concentration of •OH in the profenofos solution increased due to light exposure. After the addition of myricetin, the steady-state concentration of •OH in the profenofos aqueous solution was 8.23 × 10⁻¹⁶ M. In contrast, the concentration of •OH decreased after the addition of myricetin (Figure 4c). Steady-state concentrations of 1O2 and •OH indicated that myricetin reduced the steady-state concentrations of 1O2 and •OH in water during the photodegradation of profenofos. Thus, the photodegradation rate of profenofos was inhibited.
Figure 4d shows that the degradation rate of profenofos was 0.02339 min−1 and 0.02377 min−1 without and with 2 mM TEMP, respectively. TEMP exhibited a mild reduction in the degradation rate of profenofos. The degradation rate of profenofos was 0.00611 min−1 with 5 mM of DMPO. DMPO significantly decreased the degradation rate of profenofos. This indicated that •OH was the key radical for the profenofos photodegradation.
To further demonstrate the role of myricetin in the profenofos photodegradation, the concentration of myricetin in the profenofos–myricetin solutions under HPML was analyzed (Figure 5). The degradation rates of myricetin were 0.0234 and 0.0239 min−1 for 5 μmol·L−1 myricetin with and without 5 μmol·L−1 profenofos. The degradation rates of myricetin were 0.0149 and 0.0148 min−1 for 25 μmol·L−1 myricetin with and without 5 μmol·L−1 profenofos, and the degradation rates of myricetin were 0.00854 and 0.00831 min−1 for 50 μmol·L−1 myricetin with and without 5 μmol·L−1 profenofos, respectively (Figure 5a). Figure 5b shows that the degradation rate of 5 μmol·L−1 myricetin was 0.0236, 0.0221, 0.0225, and 0.0218 min−1 without profenofos or with 5, 25, and 50 μmol·L−1 profenofos, respectively. There is no obvious difference between the degradation of myricetin alone and myricetin with different concentrations of profenofos. Profenofos had no effect on myricetin degradation. The photodegradation of profenofos was the photooxidation reaction between the excited state of profenofos and the free radicals in water under the action of photons, and with myricetin as a free radical scavenger, it could scavenge the free radicals in water. It suggested that myricetin was indirectly slowing down the photolysis rate of profenofos by scavenged reactive species. Regarding other pesticides (such as methyl parathion, malathion, cyhalofop-butyl, and imidacloprid), myricetin also had an inhibitory effect on their photodegradation (Table S6).

3.3.2. Inhibition Mechanism of Myricetin on Profenofos Photodegradation

Based on the profenofos photolysis pathway, the inhibition mechanism of myricetin on the profenofos photodegradation could be concluded as follows. (1) Dissolved oxygen produced •OH and 1O2 under the light irradiation, because in the presence of dissolved oxygen, •OH and 1O2 could be produced by water molecules [45,46]. (2) Both 1O2 and •OH were reactive oxygen species required for profenofos photodegradation, and •OH had the more significant effects. (3) As a free radical scavenger, myricetin provided protons and electrons to react with reactive oxygen species in water. Thus, myricetin inhibited the photolysis of profenofos. However, myricetin was not directly involved in the photolytic reaction of profenofos, as shown in Figure 6.

3.4. The Impact of Myricetin on the Photodegradation of Profenofos in Natural Water under Solar Irradiation

Table 2 shows the effect of myricetin on profenofos photolysis in three natural waters. During 16 h of sunlight exposure, the degradation rate of profenofos was 0.0211 h−1 with a T1/2 of 32.8 h. The degradation rates were 0.44, 0.095, and 0.074 h−1 in the pond water, field ditch, and paddy water, respectively; they were higher than that in purified water. The properties of paddy, farm ditch, and pond waters are shown in Table S7. Turbidity NTU, Cl, and SO42− were high in the pond. Suspended particles in pond water would adsorb profenofos, and humic acid and fulvic acid generated free radicals would cause an increase in the photodegradation of profenofos. Cl and SO42− could promote the photolysis of organic matter [12,47]. Dissolved organic matter (DOM), ions, and constant high temperatures in the water also lead to the fast degradation of profenofos. The degradation rates of profenofos in the purified water, pond water, farm ditch, and paddy water with 5 molar ratios of myricetin were 0.02, 0.19, 0.079, and 0.045 h−1, respectively. They are significantly different (p < 0.05). Myricetin inhibited the profenofos degradation in three natural waters.

4. Conclusions

ROS play an important role in photodegradation. •OH and 1O2 are primarily attributed to profenofos photodegradation, particularly •OH. Myricetin exhibited inhibitory effects on the photodegradation of profenofos under artificial light, natural light, and natural water. This is a competitive relationship between myricetin and profenofos. This study also provided a comprehensive description of the photodegradation pathway of profenofos in water. The inhibitory effects on profenofos photodegradation may increase its environmental risk, which warrants further studies to understand the effects of flavonoids on photodegradation of pesticides in water.

Supplementary Materials

The following supporting information can be downloaded at https://www.mdpi.com/article/10.3390/agronomy14020399/s1, Figure S1. Spectral maps of the three artificial light sources; Figure S2. Absorption spectra of profenofos, myricetin and profenofos with myricetin (1:1 mol ratio) in water at 5 μmol (with a 1 cm optical path) Figure S3. Extract ion chromatogram and secondary fragment ion of profenofos. Figure S4. Extract ion chromatogram and secondary fragment ion of M1. Figure S5. Extract ion chromatogram and secondary fragment ion of M2. Figure S6. Extract ion chromatogram and secondary fragment ion of M3. Figure S7. Extract ion chromatogram and secondary fragment ion of M4. Figure S8. Extract ion chromatogram and secondary fragment ion of M5. Figure S9. Extract ion chromatogram and secondary fragment ion of M6. Figure S10. Extract ion chromatogram and secondary fragment ion of M7. Figure S11. Extract ion chromatogram and secondary fragment ion of M8. Figure S12. Extract ion chromatogram and secondary fragment ion of M9. Figure S13. Extract ion chromatogram and secondary fragment ion of M10. Figure S14. Extract ion chromatogram and secondary fragment ion of M11. Figure S15. Extract ion chromatogram and secondary fragment ion of M12. Figure S16. Extract ion chromatogram and secondary fragment ion of M13. Figure S17. Extract ion chromatogram and secondary fragment ion of M14. Figure S18. Extract ion chromatogram and secondary fragment ion of M15. Figure S19. Extract ion chromatogram and secondary fragment ion of M16. Figure S20. Extract ion chromatogram and secondary fragment ion of M17. Figure S21. Extract ion chromatogram and secondary fragment ion of M18. Figure S22. Extract ion chromatogram and secondary fragment ion of M19. Figure S23. Extract ion chromatogram and secondary fragment ion of M20. Figure S24. Extract ion chromatogram and secondary fragment ion of M21. Table S1. Mobile phase of Thermofisher QE focus mass spectrometer (a) and Waters UPLC-Xevo TQ-S MS (b). Table S2. The parent ions, daughter ion fragments and ion scanning mass spectrometry conditions of profenofos and photoproducts. Table S3. Scanning mass spectrometry conditions for profenofos and its photoproducts. Table S4. Precision and accuracy of the analytical method. Table S5. Photoproducts toxicity prediction by ECOSAR. Table S6. Effect of myricetin on the decrease in photodegradation of four pesticides. Table S7. Properties of paddy, farm ditch, and pond water.

Author Contributions

N.Z.: methodology, validation, formal analysis, investigation, writing—review and editing, writing—original draft; Y.Y.: investigation, formal analysis; X.W.: validation, formal analysis; T.S.: investigation, formal analysis; P.L.: supervision, funding acquisition; Q.X.L.: writing—review and editing; R.H.: project administration, supervision, resources. All authors have read and agreed to the published version of the manuscript.

Funding

This study was funded in part by the National Natural Science Foundation of China (Grant no. 31972314), the Foundation for Excellent Young Talents in the University of Anhui Province of China (Grant no. gxyq2020004), and the USDA (HAW05044R).

Data Availability Statement

The data that support the findings of this study are available from the corresponding author, [R.H.], upon reasonable request.

Conflicts of Interest

The authors declare that they have no known competing financial interests or personal relationships that could have appeared to influence the work reported in this paper.

Abbreviations

T1/2: half-lives; •OH: hydroxyl radical; 1O2: singlet oxygen; ECOSAR: Ecological Structure Activity Relationships; ROS: reaction oxygen species; UV: ultraviolet; DMPO: 5,5-Dimethyl-1-pyrroline-N-oxide; TEMP: 4-hydroyl-2,2,6,6-tetramethylpiperidine; FFA: Furfuryl alcohol; pCBA: p-chlorobenzene acid; HPML: high-pressure mercury lamp; HPLC: high-performance liquid chromatography; GHS: Globally Harmonized System; ESR: electron spin resonance; DOM: dissolved organic matter.

References

  1. Dawson, A.H.; Eddleston, M.; Senarathna, L.; Mohamed, F.; Gawarammana, I.; Bowe, S.J.; Manuweera, G.; Buckley, N.A. Acute Human Lethal Toxicity of Agricultural Pesticides: A Prospective Cohort Study. PLoS Med. 2010, 7, 1000357. [Google Scholar] [CrossRef]
  2. Mostafalou, S.; Abdollahi, M. Pesticides: An update of human exposure and toxicity. Arch. Toxicol. 2017, 91, 549–599. [Google Scholar] [CrossRef]
  3. Kushwaha, M.; Verma, S.; Chatterjee, S. Profenofos, an Acetylcholinesterase-Inhibiting Organophosphorus Pesticide: A Short Review of Its Usage, Toxicity, and Biodegradation. J. Environ. Qual. 2016, 45, 1478–1489. [Google Scholar] [CrossRef]
  4. Clair, C.R.S.; Norris, E.J.; Masloski, K.E.; Coatsa, J.R.; Gassmann, A.J. Evaluation of pyrethroids and organophosphates in insecticide mixtures for management of western corn rootworm larvae. Pest Manag. Sci. 2020, 76, 3871–3878. [Google Scholar] [CrossRef]
  5. Loha, K.; Lamoree, M.; Boer, J. Pesticide residue levels in vegetables and surface waters at the Central Rift Valley (CRV) of Ethiopia. Environ. Monit. Assess. 2020, 192, 546. [Google Scholar] [CrossRef]
  6. Nyantakyi, J.A.; Wiafe, S.; Akoto, O. Seasonal Changes in Pesticide Residues in Water and Sediments from River Tano, Ghana. J. Environ. Public Health 2022, 2022, 8997449. [Google Scholar] [CrossRef]
  7. Chu, S.; Baker, M.R.; Leong, G.; Letcher, R.J.; Li, Q.X. Covalent binding of the organophosphate insecticide profenofos to tyrosine on α- and β-tubulin proteins. Chemosphere 2018, 199, 154–159. [Google Scholar] [CrossRef]
  8. Rajesh, L.; David, M. Hepatotoxic Potentials of Profenofos on Wistar Albino Rats: A Histopathological Study. Int. J. Pharm. Biol. Arch. 2014, 5, 70–75. Available online: http://www.ijpba.info/index.php/ijpba/article/download/1224/875/1996 (accessed on 26 September 2022).
  9. Pamanji, R.; Yashwanth, B.; Bethu, M.; Leelavathi, S.; Ravinder, K.; Rao, J.V. Toxicity effects of profenofos on embryonic and larval development of Zebrafish (Danio rerio). Environ. Toxicol. Pharmacol. 2015, 39, 887–897. [Google Scholar] [CrossRef]
  10. Li, X.; Li, S.; Liu, S.; Zhu, G. Lethal Effect and In Vivo Genotoxicity of Profenofos to Chinese Native Amphibian (Rana spinosa) Tadpoles. Arch. Environ. Contam. Toxicol. 2010, 59, 478–483. [Google Scholar] [CrossRef]
  11. Paidi, M.K.; Satapute, P.; Haider, M.S.; Udikeri, S.S.; Ramachandra, Y.L.; Vo, D.-V.N.; Govarthanan, M.; Jogaiah, S. Mitigation of organophosphorus insecticides from environment: Residual detoxification by bioweapon catalytic scavengers. Environ. Res. 2021, 200, 111368. [Google Scholar] [CrossRef] [PubMed]
  12. Zamy, C.; Mazellier, P.; Legube, B. Phototransformation of selected organophosphorus pesticides in dilute aqueous solutions. Water Res. 2004, 38, 2305–2314. [Google Scholar] [CrossRef] [PubMed]
  13. Guo, Z.; Kodikara, D.; Albi, L.S.; Hatano, Y.; Chen, G.; Yoshimura, C.; Wang, J. Photodegradation of organic micropollutants in aquatic environment: Importance, factors and processes. Water Res. 2023, 231, 118236. [Google Scholar] [CrossRef] [PubMed]
  14. Meng, X.G.; Guo, Y.J.; Wang, Y.H.; Fan, S.J.; Wang, K.Q.; Han, W.H. A Systematic Review of Photolysis and Hydrolysis Degradation Modes, Degradation Mechanisms, and Identification Methods of Pesticides. J. Chem. 2022, 2022, 9552466. [Google Scholar] [CrossRef]
  15. Sarker, A.; Islam, T.; Kim, J.E. A pilot lab trial for enhanced oxidative transformation of procymidone fungicide and its aniline metabolite using heterogeneous MnO2 catalysts. Environ. Sci. Pollut. Res. 2023, 30, 3783–3794. [Google Scholar] [CrossRef]
  16. Lv, P.; Tao, Y.M.; Zhang, N.; Yang, Y.W.; Wu, X.W.; Li, Q.X.; Hua, R.M. Cyanidin-3-O-glucoside mediated photodegradation of profenofos in water. Chemosphere 2022, 308, 136170. [Google Scholar] [CrossRef] [PubMed]
  17. Samara, F.; Feghaly, F.; Kanan, S. Photocatalytic degradation of profenofos using silver-platinum doped zeolite. Catal. Today 2023, 424, 112602. [Google Scholar] [CrossRef]
  18. Ratpukdi, T.; Siripattanakul-Ratpukdi, S.; Thongprowh, P.; Soontharo, S.; Jenjaiwit, S.; Prasertwongchai, A.; Anotai, J.; Nongsung, P.; Khan, E. Photodegradation of profenofos in aqueous solution by vacuum ultraviolet. J. Photochem. Photobiol. A Chem. 2022, 433, 114179. [Google Scholar] [CrossRef]
  19. Cardoso, F.; Leal, I.; Nery, T. Characterization of Bioactive Compounds in Fruit and Vegetable Bagasse. J. Bioeng. 2021, 4, 58–62. [Google Scholar] [CrossRef]
  20. Kuppusamya, S.; Thavamani, P.; Megharaj, M.; Nirola, R.; Lee, Y.B.; Naidu, R. Assessment of antioxidant activity, minerals, phenols and flavonoid contents of common plant/tree waste extracts. Ind. Crops Prod. 2016, 83, 630–634. [Google Scholar] [CrossRef]
  21. Sharma, A.; Gupta, V.; Khan, M.; Balda, S.; Gupta, N.; Capalash, N.; Sharma, P. Flavonoid-rich agro-industrial residues for enhanced bacterial laccase production by submerged and solid-state fermentation. 3 Biotech 2017, 7, 200. [Google Scholar] [CrossRef]
  22. Corell, L.; Armenta, S.; Turrillas, F.; Guardia, M. Flavonoid determination in onion, chili and leek by hard cap espresso extraction and liquid chromatography with diode array detection. Microchem. J. 2018, 140, 74–79. [Google Scholar] [CrossRef]
  23. Jiang, H.; Engelhardt, U.; Thräne, C.; Maiwald, B.; Stark, J. Determination of flavonol glycosides in green tea, oolong tea and black tea by UHPLC compared to HPLC. Food Chem. 2015, 183, 30–35. [Google Scholar] [CrossRef]
  24. Zhu, T.; Yuri, L.; Kyungho, R. Preparation of a hybrid organic-inorganic monolith for extraction and purification of quercetin and myricetin from Chamaecyparis obtusa. Chem. Res. Chin. Univ. 2014, 30, 216–221. [Google Scholar] [CrossRef]
  25. He, J.; Giusti, M. Anthocyanins: Natural colorants with health-promoting properties. Annu. Rev. Food Sci. Technol. 2010, 1, 163–187. [Google Scholar] [CrossRef] [PubMed]
  26. Semwal, D.K.; Semwal, R.B.; Combrinck, S.; Viljoen, A. Myricetin: A Dietary Molecule with Diverse Biological Activities. Nutrients 2016, 8, 90. [Google Scholar] [CrossRef] [PubMed]
  27. Mendes, R.A.; Almeida, S.K.C.; Soares, I.N.; Barboza, C.A.; Freitas, R.G.; Brown, A.; de Souza, G.L.C. A computational investigation on the antioxidant potential of myricetin 3,4′-di-O-α-L-rhamnopyranoside. J. Mol. Model. 2018, 24, 133. [Google Scholar] [CrossRef]
  28. Lv, P.; Zhang, J.; Shi, T.; Dai, L.; Li, X.; Wu, X.; Li, X.; Tang, J.; Wang, Y.; Li, Q.X.; et al. Procyanidolic oligomers enhance photodegradation of chlorothalonil in water via reductive dechlorination. Appl. Catal. B 2017, 217, 137–143. [Google Scholar] [CrossRef]
  29. Lv, P.; Min, S.Y.; Wang, Y.; Zheng, X.Y.; Wu, X.W.; Li, Q.X.; Hua, R.M. Flavonoid-sensitized photolysis of chlorothalonil in water. Pest Manag. Sci. 2020, 76, 2972–2977. [Google Scholar] [CrossRef]
  30. Lv, P.; Wang, Y.; Zheng, X.Y.; Wu, X.W.; Li, Q.X.; Hua, R.M. Selective, stepwise photodegradation of chlorothalonil, dichlobenil and dichloro- and trichloro-isophthalonitriles enhanced by cyanidin in water. Sci. Total Environ. 2022, 805, 150157. [Google Scholar] [CrossRef]
  31. Pranczk, J.; Jacewicz, D.; Wyrzykowski, D.; Chmurzynski, L. Analytical Methods for Determination of Reactive Oxygen Species. Curr. Pharm. Anal. 2014, 10, 293–304. [Google Scholar] [CrossRef]
  32. Liu, K.; Gao, Y.; Liu, J.; Wen, Y.; Zhao, Y.; Zhang, K.; Yu, G. Photoreactivity of Metal–Organic Frameworks in Aqueous Solutions: Metal Dependence of Reactive Oxygen Species Production. Environ. Sci. Technol. 2016, 50, 3634–3640. [Google Scholar] [CrossRef]
  33. Zhao, Y.; Jafvert, C. Environmental photochemistry of single layered graphene oxide in water. Environ. Sci. Nano 2015, 2, 136–142. [Google Scholar] [CrossRef]
  34. Barzegar, A. The role of intramolecular H-bonds predominant effects in myricetin higher antioxidant activity. Comput. Theor. Chem. 2017, 1115, 239–247. [Google Scholar] [CrossRef]
  35. Abass, K.; Reponen, P.; Jalonen, J.; Pelkonen, O. In vitro metabolism and interaction of profenofos by human, mouse and rat liver preparations. Pestic. Biochem. Physiol. 2007, 87, 238–247. [Google Scholar] [CrossRef]
  36. Angthararuk, D.; Harir, M.; Schmitt-Kopplin, P.; Sutthivaiyakit, S.; Kettrup, A.; Sutthivaiyakit, P. Degradation products of profenofos as identified by high-field FTICR mass spectrometry: Isotopic fine structure approach. J. Environ. Sci. Health B 2016, 52, 10–22. [Google Scholar] [CrossRef]
  37. Fang, L.C.; Shi, Q.Y.; Xu, L.Y.; Shi, T.Z.; Wu, X.W.; Li, Q.X.; Hua, R.M. Enantioselective Uptake Determines Degradation Selectivity of Chiral Profenofos in Cupriavidus nantongensis X1T. J. Agric. Food Chem. 2020, 68, 6493–6501. [Google Scholar] [CrossRef]
  38. Liu, X.; Zhan, Y.; Zhang, Z.; Pan, L.; Hu, L.; Liu, K.; Zhou, X.; Bai, L. Photocatalytic Degradation of Profenofos and Triazophos Residues in the Chinese Cabbage, Brassica chinensis, Using Ce-Doped TiO2. Catalysts 2019, 9, 294. [Google Scholar] [CrossRef]
  39. Jabeen, H.; Lqbal, S.; Anwar, S.; Parales, R. Optimization of profenofos degradation by a novel bacterial consortium PBAC using response surface me ethodology. Int. Biodeterior. Biodegrad. 2015, 100, 89–97. [Google Scholar] [CrossRef]
  40. Li, X.; Ouyang, X.; Liang, M.; Chen, D. Comparative Analysis of Radical Adduct Formation (RAF) Products and Antioxidant Pathways between Myricetin-3-O-Galactoside and Myricetin Aglycone. Molecules 2019, 24, 2769. [Google Scholar] [CrossRef]
  41. Mostafa, S.; Rosario-Ortiz, F. Photochemical formation of singlet oxygen from wastewater derived organic matter. In Proceedings of the 245th National Spring Meeting of the American-Chemical-Society (ACS), New Orleans, LA, USA, 7–11 April 2013; Volume 245, pp. 187–192. Available online: https://www.researchgate.net/publication/293632940 (accessed on 18 June 2022).
  42. Zhang, D.; Yan, S.; Song, W. Photochemically Induced Formation of Reactive Oxygen Species (ROS) from Effluent Organic Matter. Environ. Sci. Technol. 2014, 48, 12645–12653. [Google Scholar] [CrossRef]
  43. Mostafa, S.; Rosario-Ortiz, F.L. Singlet Oxygen Formation from Wastewater Organic Matter. Environ. Sci. Technol. 2013, 47, 8179–8186. [Google Scholar] [CrossRef]
  44. Haag, W.; Hoigne, J. Singlet oxygen in surface waters. 3. Photochemical formation and steady-state concentrations in various types of waters. Environ. Sci. Technol. 1986, 20, 341–348. [Google Scholar] [CrossRef]
  45. Huang, F.; Gao, F.; Li, C.; Campos, L.C. Photodegradation of free estrogens driven by UV light: Effects of operation mode and water matrix. Sci. Total Environ. 2022, 835, 155515. [Google Scholar] [CrossRef] [PubMed]
  46. Xue, W.F.; Chen, J.W.; Xie, Q. Direct and dissolved oxygen involved photodegradation of MeO-PBDEs in water. J. Hazard. Mater. 2016, 307, 344–349. [Google Scholar] [CrossRef] [PubMed]
  47. Nguyen, T.; Huang, C.P.; Doong, R. Photocatalytic degradation of bisphenol A over a ZnFe2O4/TiO2 nanocomposite under visible light. Sci. Total Environ. 2018, 646, 745–746. [Google Scholar] [CrossRef] [PubMed]
Figure 1. Proposed photodegradation pathway of profenofos in water. Note: Blues are identified compounds. Blacks are conjectured compounds.
Agronomy 14 00399 g001
Figure 2. Concentrations of M1–M6 during profenofos photolysis (a). Concentrations of M1–M6 with 5 ratio molar of myricetin under 1.5 h HPML irradiation (b) and under 3 h HPML irradiation (c). Note: (1) Light intensity: high-performance liquid chromatography (HPML), 8.1 × 10⁵−9.9 × 10⁵ lx, 25 ± 1 °C. (2) The profenofos concentration was 50 μmol·L−1. (3) The error bars represent standard deviations (variables = 3). (4) M1 is O-(4-Bromo-2-chlorophenyl)-O-ethyl phosphate, M2 is O-(4-bromo-2-chlorophenyl)-O-ethyl-S-hydroxy phosphorothioate, M3 is O-(2-chlorophenyl)-O-ethyl-S-propyl phosphorothioate, M4 is O-(2-chlorophenyl)-O-ethyl-S-hydrogen phosphorothioate, M5 is O-(2-chloro-4-hydroxyphenyl)-O-ethyl-S-propyl phosphorothioate, and M6 is 4-bromo-2-chlorophenol.
Agronomy 14 00399 g002
Figure 3. Degradation kinetics of M1–M6 (a). T1/2 of M1–M6 with and without myricetin (b). T1/2 of M1–M6 with and without myricetin. Note: (1) Light intensity: high-performance liquid chromatography (HPML), 7.3 × 10⁵–9.5 × 10⁵ lx, 25 ± 1 °C. (2) M1–M6 did not hydrolyze in 2.5 h of darkness. (3) The initial concentrations of M1–M6 were 50 μmol·L−1. (4) The error bars represent standard deviations (n = 3). (5) M1 is O-(4-bromo-2-chlorophenyl)-O-ethyl phosphate, M2 is O-(4-bromo-2-chlorophenyl)-O-ethyl-S-hydroxy phosphorothioate, M3 is O-(2-chlorophenyl)-O-ethyl-S-propyl phosphorothioate, M4 is O-(2-chlorophenyl)-O-ethyl-S-hydrogen phosphorothioate, M5 is O-(2-chloro-4-hydroxyphenyl)-O-ethyl-S-propyl phosphorothioate, and M6 is 4-bromo-2-chlorophenol.
Agronomy 14 00399 g003
Figure 4. Electron spin resonance (ESR) spectra of the reaction mixture (a,b) and steady-state concentration of 1O2 ([1O2]SS) and •OH ([•OH]SS) (c). Photodegradation of profenofos with 5,5-Dimethyl-1-pyrroline-N-oxide (DMPO) and 4-hydroyl-2,2,6,6-tetramethylpiperidine (TEMP) (d). Note: (1) (a): DMPO−OH; (b): TEMP-1O2. (2) (c): p−chlorobenzene acid (pCBA) (5 μmol·L−1) and profenofos: myricetin = 1:5, furfuryl alcohol (FFA) (200 μmol·L−1) and profenofos: myricetin = 1:5; the profenofos concentration was 5 μmol·L−1. (3) (d): DMPO and TEMP concentrations were 0.5 mL·L−1 and 5 mL·L−1; the profenofos concentration was 50 μmol·L−1; high-performance liquid chromatography (HPML): 7.1 × 10⁶–9.2 × 10⁶ lx, temperature: 25 ± 1 °C. (4) The error bars represent standard deviations (n = 3).
Agronomy 14 00399 g004
Figure 5. Kinetics of myricetin. Note: (1) (a): Degradation rate of 5, 25, and 50 μmol·L−1 of myricetin with and without 5 μmol·L−1 of profenofos. (2) (b): Degradation rate of 5 μmol·L−1 myricetin with and without 5, 25, and 50 μmol·L−1 of profenofos. (3) Light intensity: high-performance liquid chromatography (HPML), 7.5 × 10⁶–9.3 × 10⁶ lx, 25 ± 1 °C. (4) Three parallel samples per group.
Agronomy 14 00399 g005
Figure 6. Proposed mechanism of the inhibition of profenofos photolysis by myricetin in water. Note: The red line shows the bonds can break when profenofos photodegradation. “*” indicates that the compound is in an excited state. After light irradiation, the compound absorbs light energy and becomes excited.
Agronomy 14 00399 g006
Table 1. Myricetin inhibited profenofos photolysis in water under artificial light and sunlight irradiation.
Light SourceRatio
(Profenofos: Myricetin)
Kinetic ParametersT1/2 (h)Inhibition Rate (%)
C0 (μmol·L−1)K/h−1R2
HPML 1:04.700.4020.991.73 (±0.07) a/
1:14.890.3730.991.86 (±0.06) a7.21
1:55.000.2890.992.40 (±0.1) b28.11
1:104.940.1640.994.22 (±0.35) c59.20
1:204.620.1110.976.24 (±0.44) d72.39 a
UV lamp1:05.060.1410.984.92 (±0.31) a/
1:14.970.1230.985.63 (±0.31) b12.77
1:54.870.1000.996.91 (±0.21) c29.08
1:105.000.09880.997.02 (±0.34) c29.93
1:205.280.07560.999.18 (±0.33) d46.38 b
Xenon lamp1:04.750.09900.997.00 (±0.099) a/
1:14.900.08400.998.25 (±0.084) a15. 15
1:55.130.04700.9814.75 (±0.047) b52.53
1:105.180.03100.9722.36 (±0.031) c68.69
1:204.910.02100.9933.01 (±0.231) d78.79 c
Sunlight1:05.020.007700.9990.02 (±4.5) a/
1:14.990.002820.96245.80 (±12.38) b63.38
1:54.700.002710.98255.80 (±11.95) b64.81
1:104.670.001590.99435.94 (±21.80) c79.35
1:204.650.001010.99686.28 (±34.31) d86.88 d
Note: (1) Light intensity: HPML, 8.0 × 10⁵–9.3 × 10⁵ lx, 25 ± 1 °C; UV lamp, 60–100 lx, 25 ± 1 °C; xenon lamp: 3.6 × 10³–11 × 103 lx, 46 ± 1 °C; sunlight, 3.6 × 10⁴–11 × 104 lx, 30–49 °C. (2) The profenofos concentration was 5 μmol·L−1. (3) “/” Indicates that it cannot be calculated. (4) Each group of experiments included three parallel experiments.
Table 2. Myricetin inhibited profenofos photolysis in natural water under sunlight irradiation.
WaterRatio
(Profenofos: Myricetin)
Kinetic ParametersT1/2 (h)Inhibition Rate (%)
C0 (μmol·L−1)K/h−1R2
Purified Water1:04.890.02110.9932.8 (±0.90) a/
1:54.930.01950.9635.6 (±1.07) b7.95
Pond Water1:04.790.4420.991.57 (±0.10) a/
1:54.750.1890.993.68 (±0.27) b57.24
Field Ditch Water1:04.950.0950.957.38 (±0.88) a/
1:55.010.0790.948.84 (±0.80) b16.84
Paddy Water1:04.890.0740.949.45 (±1.11) a/
1:54.870.0450.9915.45 (±2.10) b39.19
Note: (1) Light intensity: Sunlight, 5.6 × 10⁴–13 × 104 lx. (2) Temperature: 33–52 °C. (3) The profenofos concentration was 5 μmol·L−1. (4) “/” Indicates that it cannot be calculated.
Disclaimer/Publisher’s Note: The statements, opinions and data contained in all publications are solely those of the individual author(s) and contributor(s) and not of MDPI and/or the editor(s). MDPI and/or the editor(s) disclaim responsibility for any injury to people or property resulting from any ideas, methods, instructions or products referred to in the content.

