
Enhancement of Soil Organic Carbon, Water Use Efficiency and Maize Yield (Zea mays L.) in Sandy Soil through Organic Amendment (Grass Peat) Incorporation


Abstract
1. Introduction
2. Materials and Methods
2.1. Experimental Site
2.2. Experiment Design
2.3. Management Measure
2.4. Survey of Soil and Plant Growth Characteristics
2.5. Calculation
2.6. Statistical Analysis
3. Results
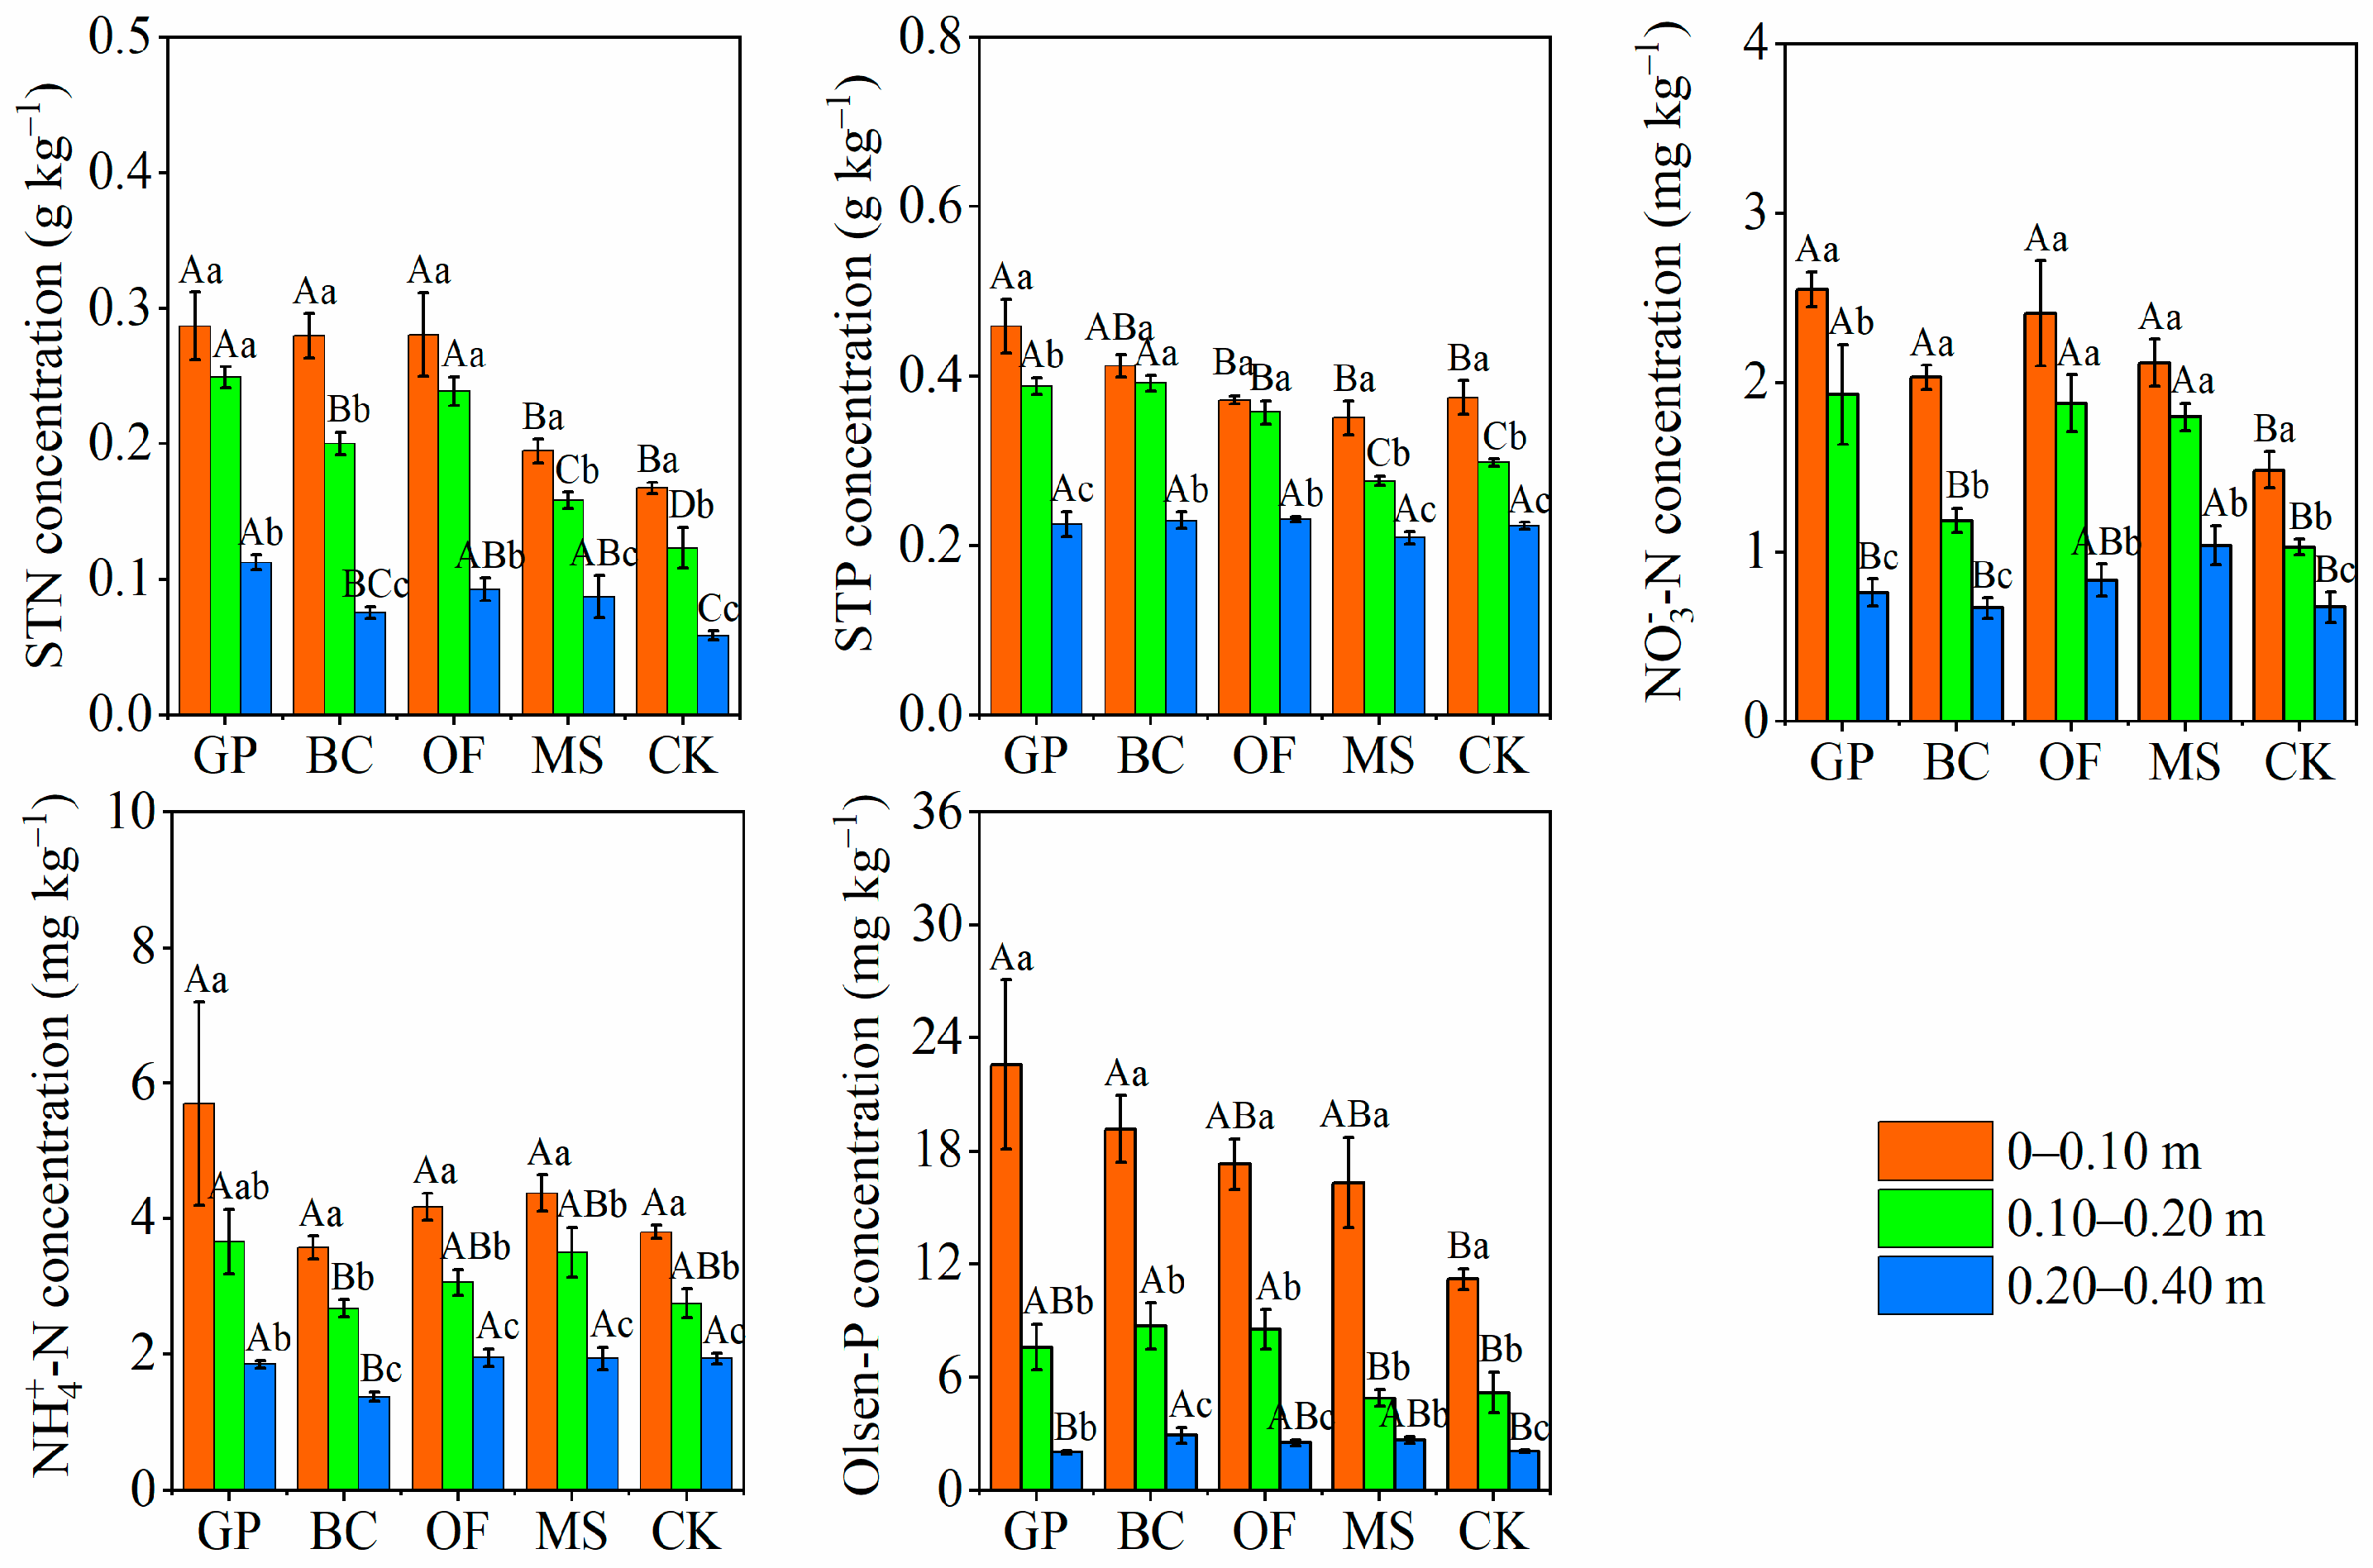
3.1. Soil Nutrients
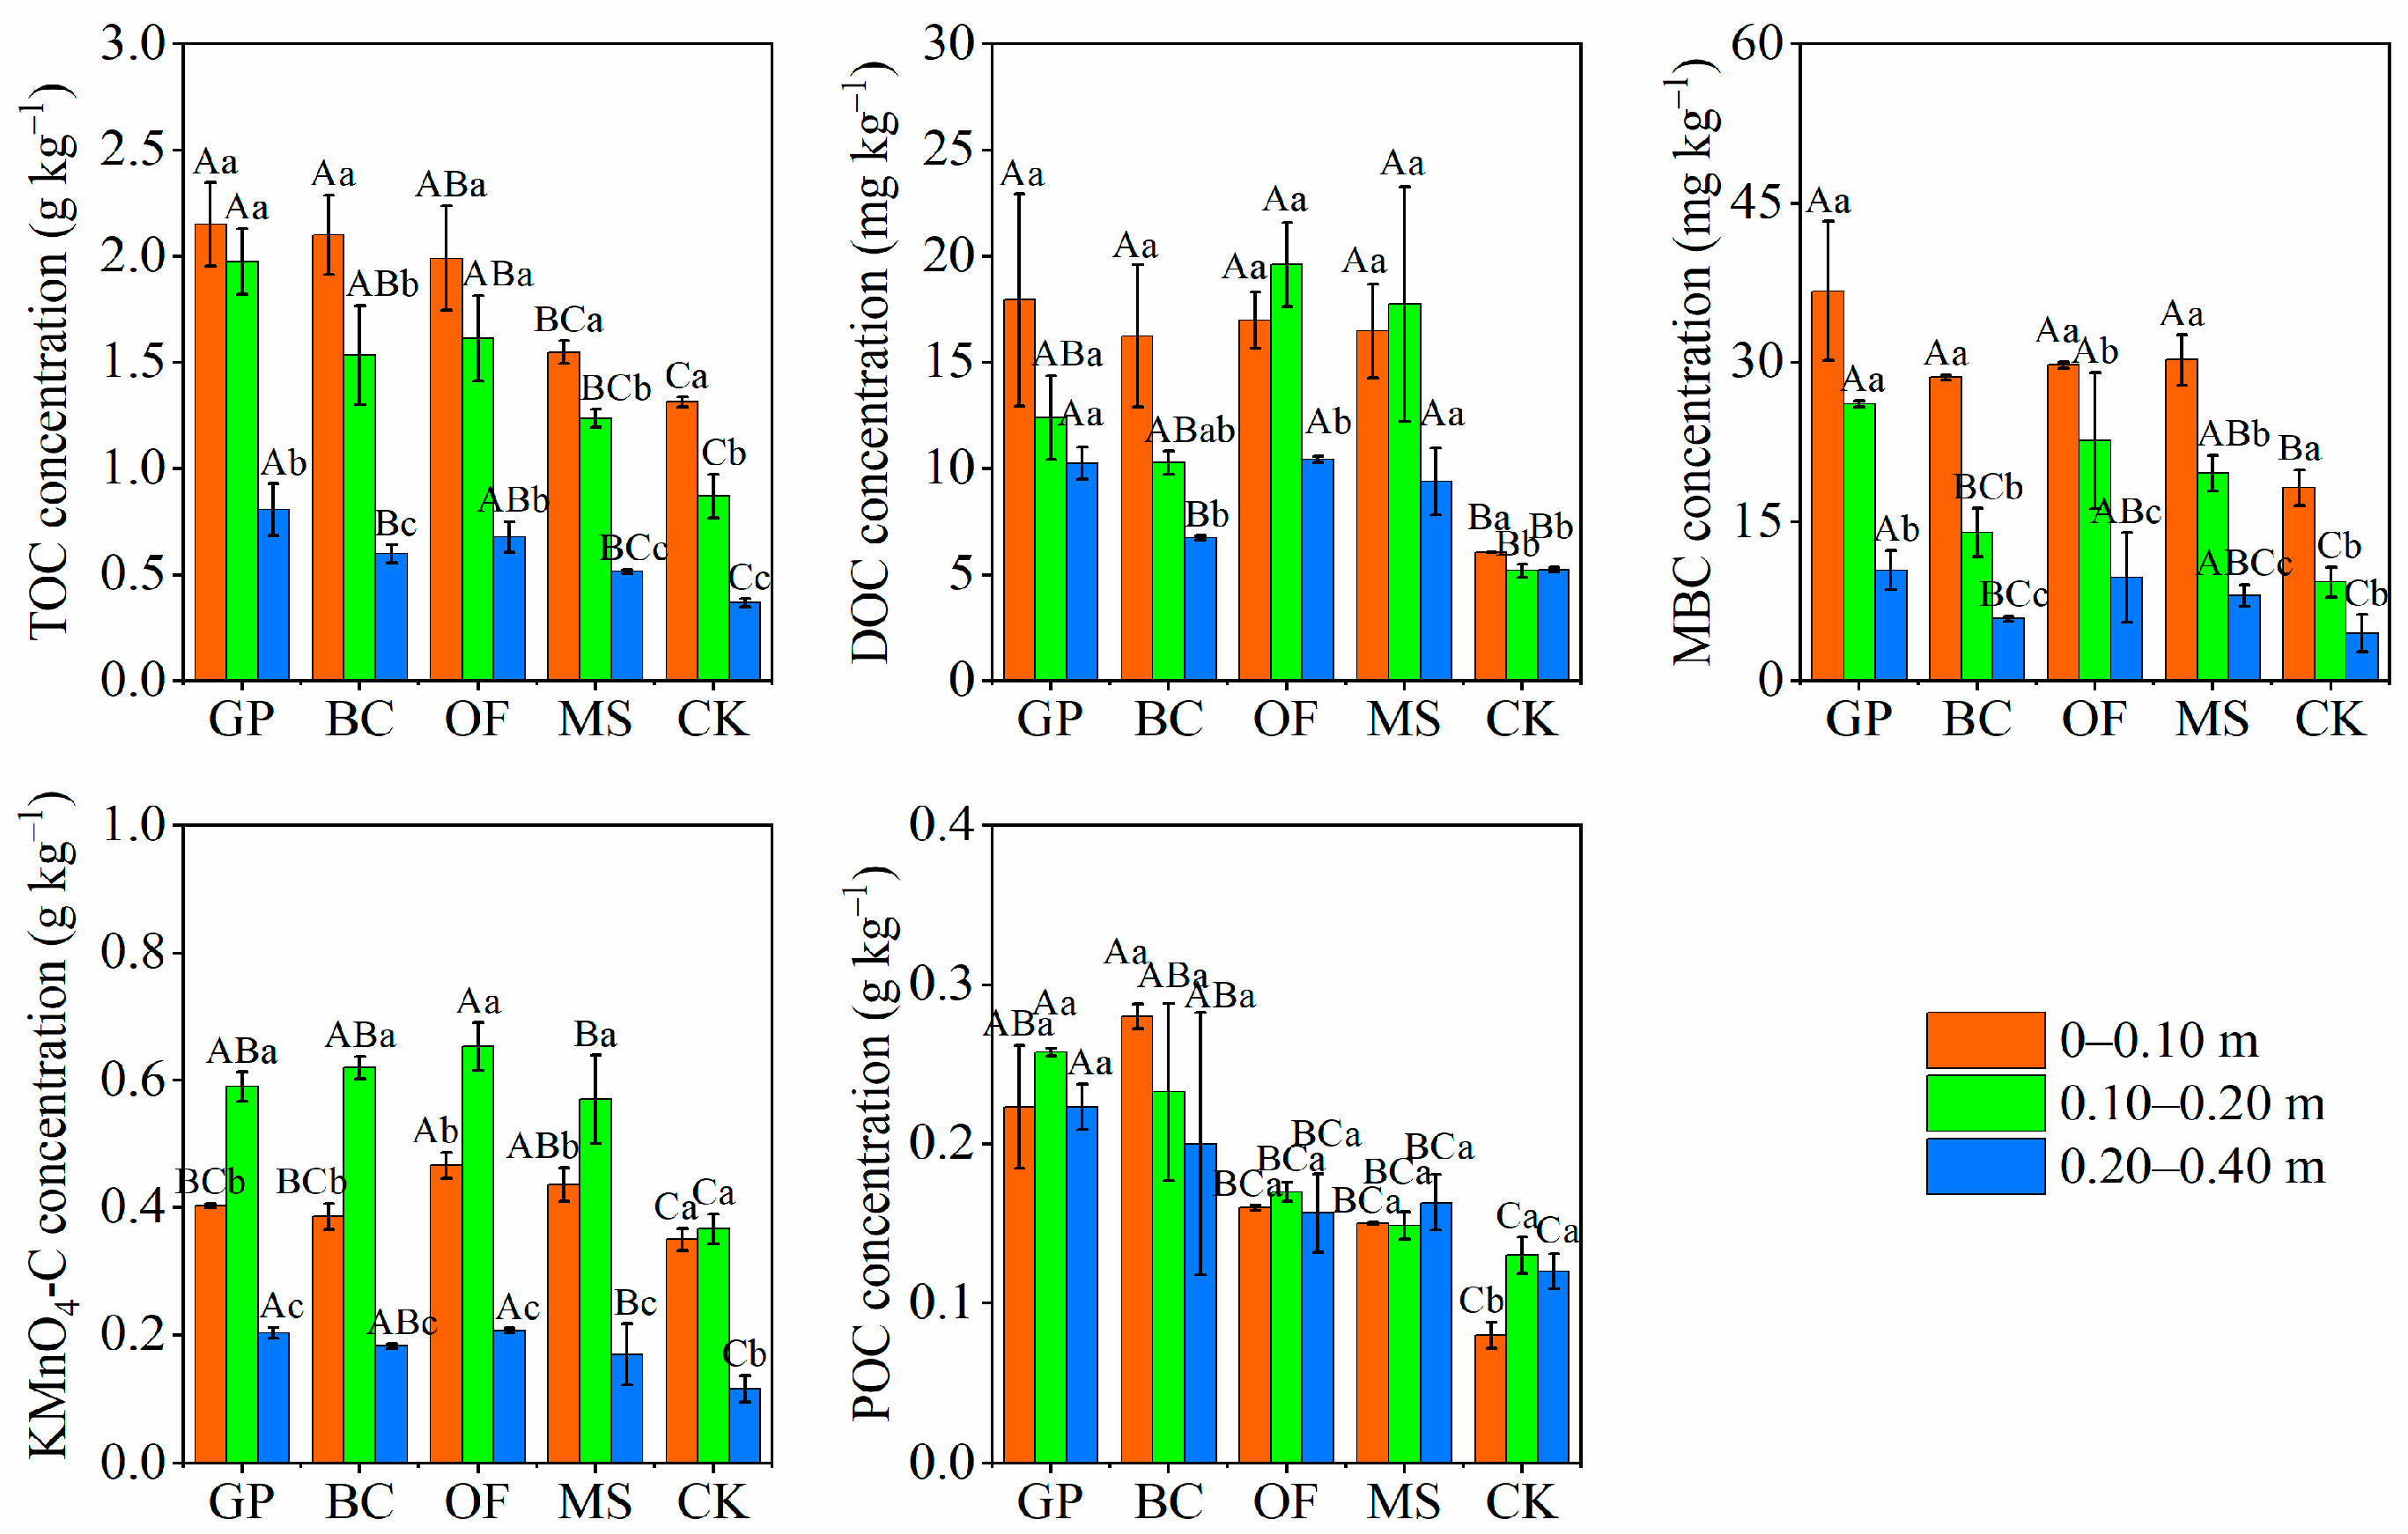
3.2. Soil Labile Organic C Fractions
3.3. C Pool Index and C Management Index
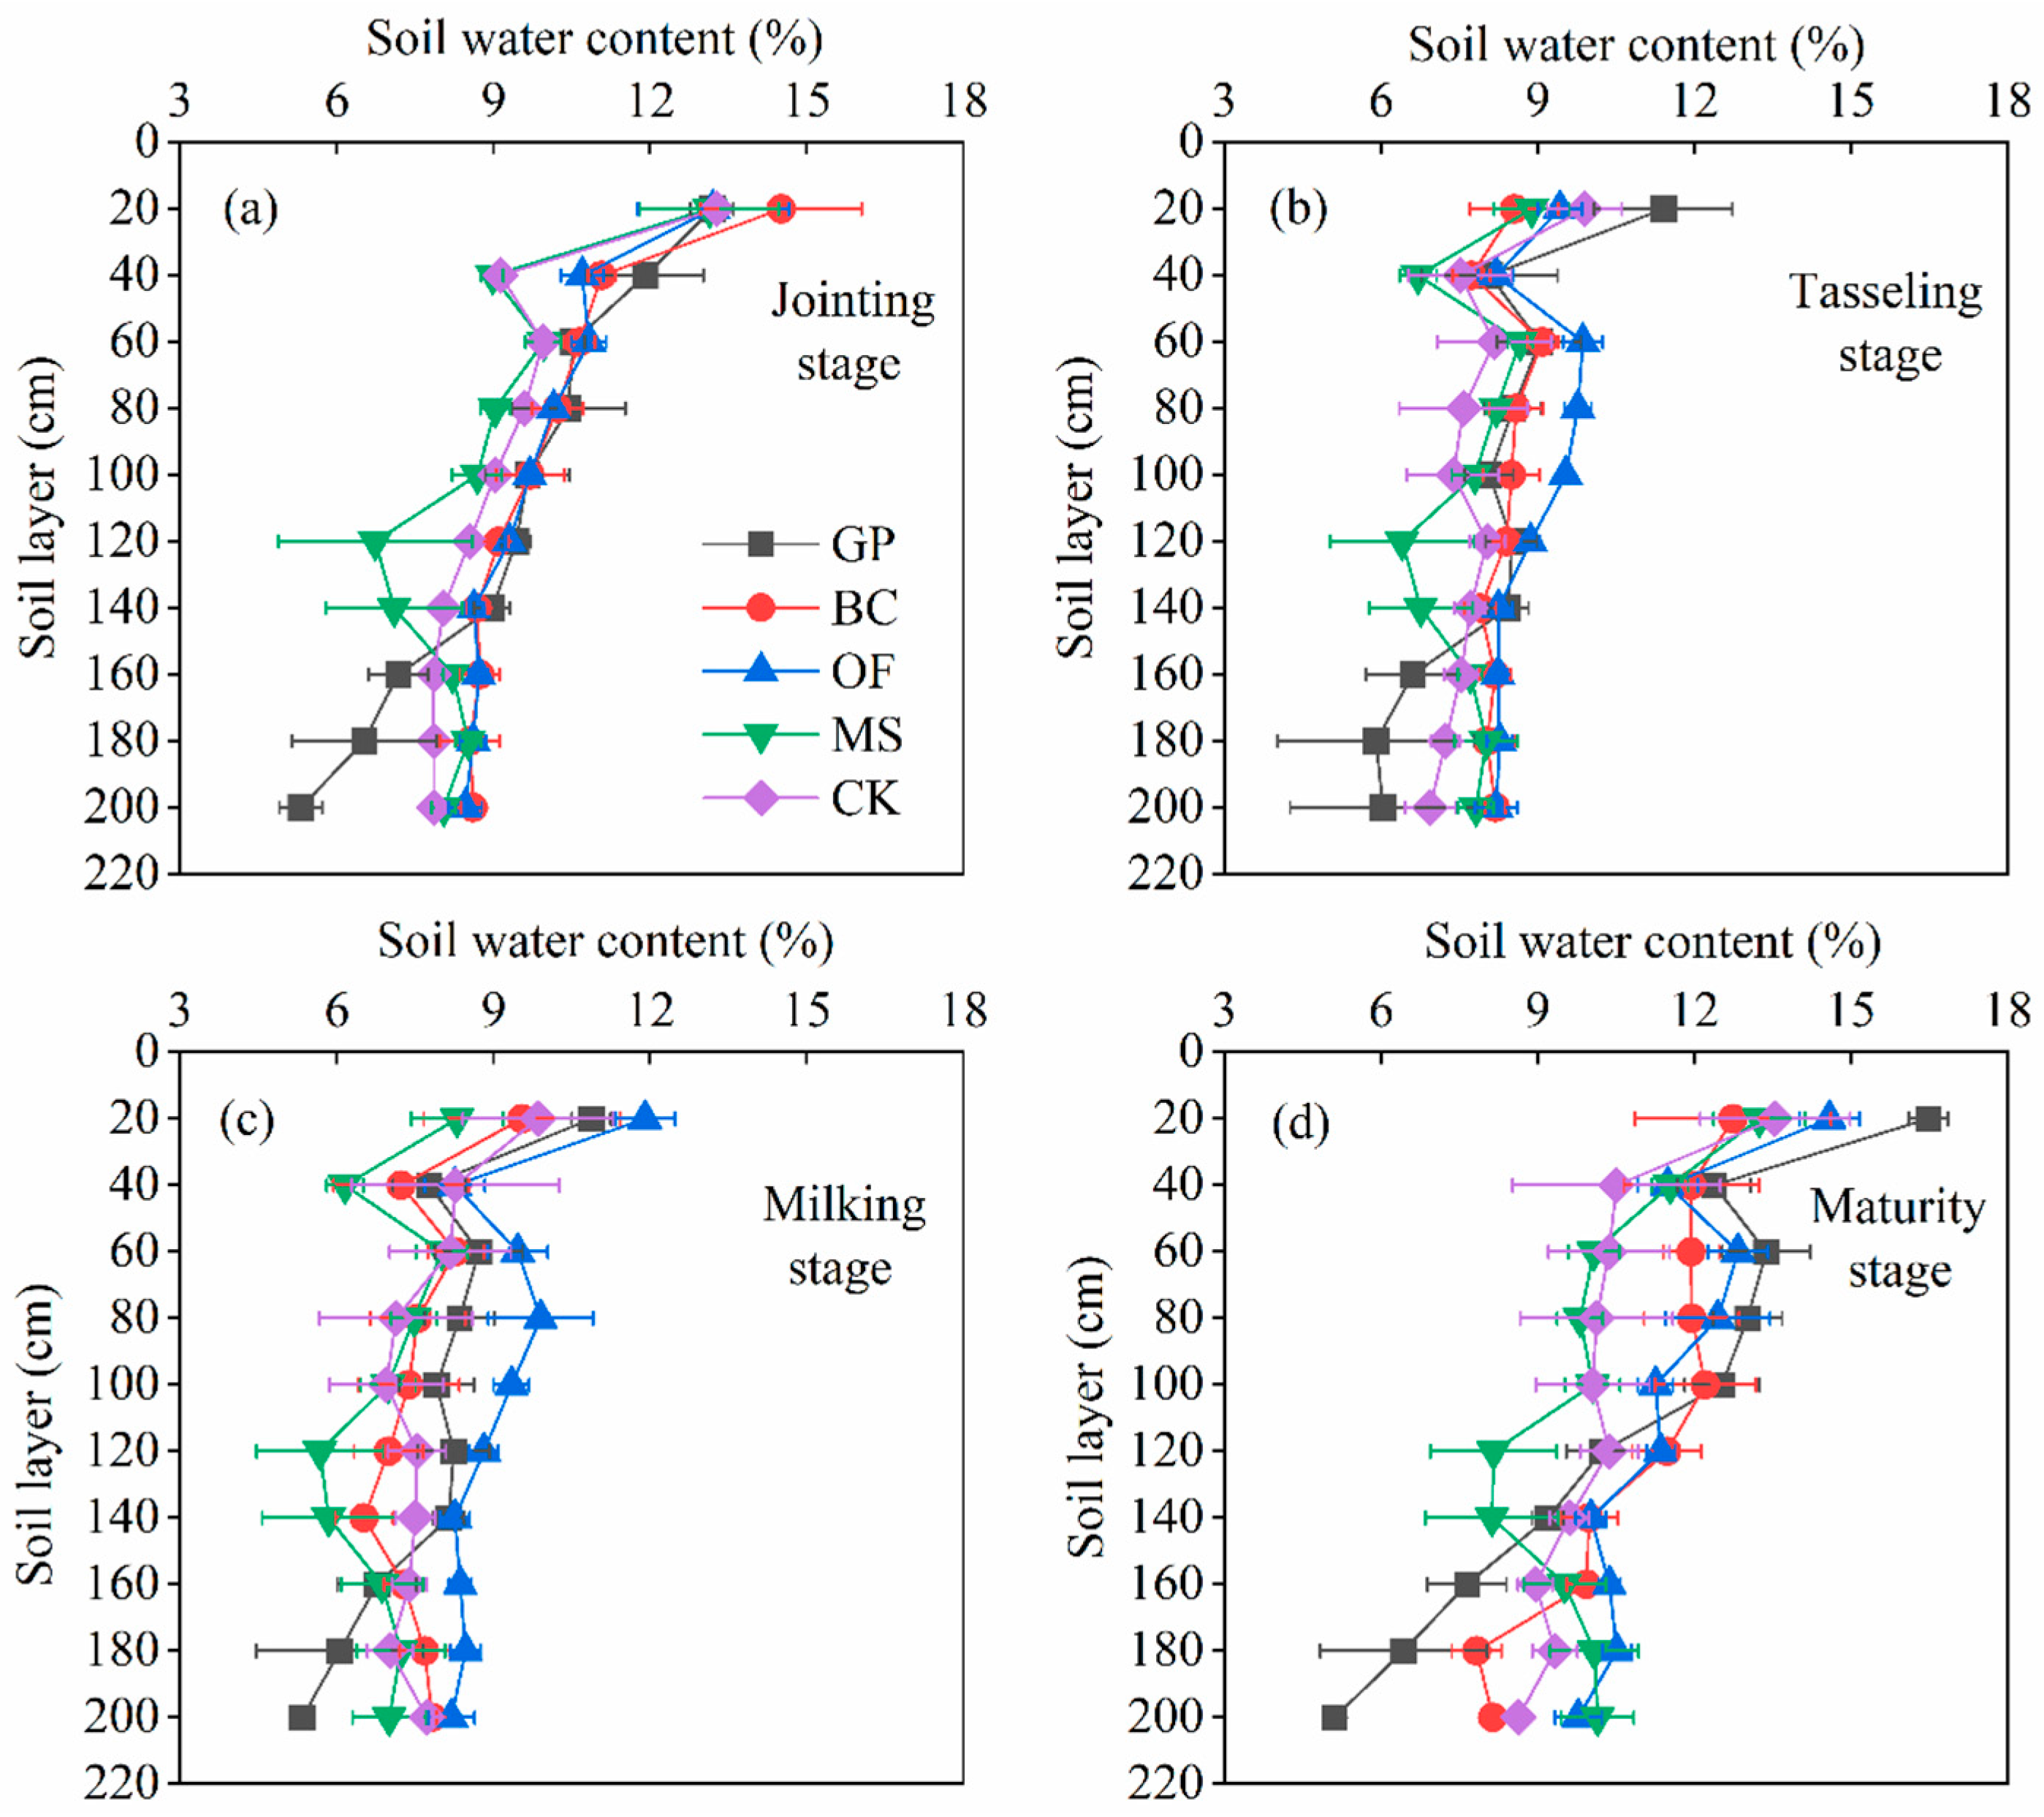
3.4. Soil Water Content
3.5. Grain Yield, 1000-Kernel Weight, Plant Height, ETa and WUE
4. Discussion
4.1. Effect of Amendments on Soil Nutrient Content
4.2. Effect of Amendments on Soil Labile Organic C Fractions
4.3. Effect of Amendments on Yield and WUE
5. Conclusions
Author Contributions
Funding
Data Availability Statement
Conflicts of Interest
References
- Wang, Q.X.; Fan, X.H.; Qin, Z.D.; Wang, M.B. Change trends of temperature and precipitation in the Loess Plateau Region of China, 1961–2010. Global Planet. Chang. 2012, 92–93, 138–147. [Google Scholar] [CrossRef]
- Huang, J.P.; Yu, H.P.; Guan, X.D.; Wang, G.Y.; Guo, R.X. Accelerated dryland expansion under climate change. Nat. Clim. Chang. 2015, 6, 166–171. [Google Scholar] [CrossRef]
- Hassani, A.; Azapagic, A.; Shokri, N. Predicting long-term dynamics of soil salinity and sodicity on a global scale. Proc. Natl. Acad. Sci. USA 2020, 117, 33017–33027. [Google Scholar] [CrossRef] [PubMed]
- Sahab, S.; Suhani, I.; Srivastava, V.; Chauhan, P.S.; Singh, R.P.; Prasad, V. Potential risk assessment of soil salinity to agroecosystem sustainability: Current status and management strategies. Sci. Total Environ. 2021, 764, 144164. [Google Scholar] [CrossRef] [PubMed]
- Turner, K.G.; Anderson, S.; Gonzales-Chang, M.; Costanza, R.; Courville, S.; Dalgaard, T.; Dominati, E.; Kubiszewski, I.; Ogilvy, S.; Porfirio, L.; et al. A review of methods, data, and models to assess changes in the value of ecosystem services from land degradation and restoration. Ecol. Model. 2016, 319, 190–207. [Google Scholar] [CrossRef]
- Xu, X.; Pei, J.; Xu, Y.; Wang, J. Soil organic carbon depletion in global Mollisols regions and restoration by management practices: A review. J. Soils Sediments 2020, 20, 1173–1181. [Google Scholar] [CrossRef]
- Lu, T.P.; Wang, X.J.; Du, Z.L.; Wu, L.P. Impacts of continuous biochar application on major carbon fractions in soil profile of North China Plain’s cropland: In comparison with straw incorporation. Agric. Ecosyst. Environ. 2021, 315, 107445. [Google Scholar] [CrossRef]
- Ullah, S.; Liang, H.; Ali, I.; Zhao, Q.; Iqbal, A.; Wei, S.; Jiang, L. Biochar coupled with contrasting nitrogen sources mediated changes in carbon and nitrogen pools, microbial and enzymatic activity in paddy soil. J. Saudi Chem. Soc. 2020, 24, 835–849. [Google Scholar] [CrossRef]
- Tian, Y.; Wang, Q.; Gao, W.; Luo, Y.; Wu, L.; Rui, Y.; Huang, Y.; Xiao, Q.; Lin, X.; Zhang, W. Organic amendments facilitate soil carbon sequestration via organic carbon accumulation and mitigation of inorganic carbon loss. Land Degrad. Dev. 2022, 33, 1423–1433. [Google Scholar] [CrossRef]
- Cooper, J.; Greenberg, I.; Ludwig, B.; Hippich, L.; Fischer, D.; Glaser, B.; Kaiser, M. Effect of biochar and compost on soil properties and organic matter in aggregate size fractions under field conditions. Agric. Ecosyst. Environ. 2020, 295, 106882. [Google Scholar] [CrossRef]
- Ryals, R.; Kaiser, M.; Torn, M.S.; Berhe, A.A.; Silver, W.L. Impacts of organic matter amendments on carbon and nitrogen dynamics in grassland soils. Soil Biol. Biochem. 2014, 68, 52–61. [Google Scholar] [CrossRef]
- Blair, G.J.; Lefroy, R.D.B.; Lisle, L. Soil carbon fractions based on their degree of oxidation and development of a carbon management index for agricultural systems. Aust. J. Agric. Res. 1995, 46, 1459–1466. [Google Scholar] [CrossRef]
- Kato, G.; Sakai, T.; Suzuki, K.; Sano, N.; Takano, T.; Matsuyama, T.; Nakayasu, C. Carbon associated with clay and fine silt as an indicator for SOC evolution under different residue management regimes. Agric. Ecosyst. Environ. 2014, 196, 1–9. [Google Scholar]
- Veum, K.S.; Goyne, K.W.; Kremer, R.; Motavalli, P.P. Relationship among water-stable aggregates and organic matter fractions under conservation management. Soil Sci. Soc. Am. J. 2012, 76, 2143–2153. [Google Scholar] [CrossRef]
- Sainju, U.M.; Liptzin, D.; Stevens, W.B. How soil carbon fractions relate to soil properties and crop yields in dryland cropping systems? Soil Sci. Soc. Am. J. 2022, 86, 795–809. [Google Scholar] [CrossRef]
- Sherrod, L.A.; Peterson, G.A.; Westfall, D.G.; Ahuja, L.R. Cropping intensity enhances soil organic carbon and nitrogen in a no-till agroecosystem. Soil Sci. Soc. Am. J. 2003, 67, 1533–1543. [Google Scholar] [CrossRef]
- Ghosh, B.N.; Meena, V.S.; Singh, R.J.; Alam, N.M.; Patra, S.; Bhattacharyya, R.; Sharma, N.K.; Dadhwal, K.S.; Mishra, P.K. Effects of fertilization on soil aggregation, carbon distribution and carbon management index of maize-wheat rotation in the north-western Indian Himalayas. Ecol. Indic. 2019, 105, 415–424. [Google Scholar] [CrossRef]
- Blair, N.; Faulkner, R.D.; Till, A.R.; Korschens, M.; Schulz, E. Long-term management impacts on soil C, N and physical fertility: Part I: Broadbalk experiment. Soil Tillage Res. 2006, 91, 30–38. [Google Scholar] [CrossRef]
- Xue, J.F.; Pu, C.; Zhao, X.; Wei, Y.H.; Zhai, Y.L.; Zhang, X.Q.; Lal, R.; Zhang, H.L. Changes in soil organic carbon fractions in response to different tillage practices under a wheat-maize double cropping system. Land Degrad. Dev. 2018, 29, 1555–1564. [Google Scholar] [CrossRef]
- Medrano, H.; Tomás, M.; Martorell, S.; Flexas, J.; Hernández, E.; Rosselló, J.; Pou, A.; Escalona, J.; Bota, J. From leaf to whole-plant water use efficiency (WUE) in complex canopies: Limitations of leaf WUE as a selection target. Crop J. 2015, 3, 220–228. [Google Scholar] [CrossRef]
- Ullah, N.; Ditta, A.; Imtiaz, M.; Li, X.M.; Jan, A.U.; Mehmood, S.; Rizwan, M.S.; Rizwan, M. Appraisal for organic amendments and plant growth-promoting rhizobacteria to enhance crop productivity under drought stress: A review. J. Agron. Crop Sci. 2021, 207, 783–802. [Google Scholar] [CrossRef]
- Lamptey, S.; Xie, J.H.; Li, L.L.; Coulter, J.A.; Jagadabhi, P.S. Influence of organic amendment on soil respiration and maize productivity in a semi-arid environment. Agron. J. 2019, 9, 611. [Google Scholar] [CrossRef]
- Urra, J.; Alkorta, I.; Mijangos, I.; Garbisu, C. Commercial and farm fermented liquid organic amendments to improve soil quality and lettuce yield. J. Environ. Manag. 2020, 264, 110422. [Google Scholar] [CrossRef] [PubMed]
- Zhang, X.Y.; Wang, K.; Sun, C.C.; Yang, K.Q.; Zheng, J.Y. Differences in soil physical properties caused by applying three organic amendments to loamy clay soil under field conditions. J. Soil. Sediment. 2022, 22, 43–55. [Google Scholar] [CrossRef]
- Liang, Y.; Al-Kaisi, M.; Yuan, J.C.; Liu, J.Z.; Zhang, H.X.; Wang, L.C.; Cai, H.G.; Ren, J. Effect of chemical fertilizer and straw-derived organic amendments on continuous maize yield, soil carbon sequestration and soil quality in a Chinese Mollisol. Agric. Ecosyst. Environ. 2021, 314, 107403. [Google Scholar] [CrossRef]
- Qiao, Y.F.; Miao, S.J.; Zhong, X.; Zhao, H.F.; Pan, S.Q. The greatest potential benefit of biochar return on bacterial community structure among three maize-straw products after eight-year field experiment in Mollisols. Appl. Soil Ecol. 2020, 147, 103432. [Google Scholar] [CrossRef]
- Zhang, S.L.; Wang, Y.; Shen, Q.S. Influence of straw amendment on soil physicochemical properties and crop yield on a consecutive mollisol slope in northeastern China. Water 2018, 10, 559. [Google Scholar] [CrossRef]
- Al-Kaisi, M.M.; Kwaw-Mensah, D.; Ci, E. Effect of nitrogen fertilizer application on corn residue decomposition in Iowa. Agron. J. 2017, 109, 2415–2427. [Google Scholar] [CrossRef]
- Wang, X.; Ren, Y.; Zhang, S.; Chen, Y.; Wang, N. Applications of organic manure increased maize (Zea mays L.) yield and water productivity in a semi-arid region. Agric. Water Manag. 2017, 187, 88–98. [Google Scholar] [CrossRef]
- Dangi, S.; Gao, S.D.; Duan, Y.H.; Wang, D. Soil microbial community structure affected by biochar and fertilizer sources. Appl. Soil Ecol. 2020, 150, 103452. [Google Scholar] [CrossRef]
- Li, J.; Wen, Y.C.; Li, X.H.; Li, Y.T.; Yang, X.D.; Lin, Z.A.; Song, Z.Z.; Cooper, J.M.; Zhao, B.Q. Soil labile organic carbon fractions and soil organic carbon stocks as affected by long-term organic and mineral fertilization regimes in the North China Plain. Soil Tillage Res. 2018, 175, 281–290. [Google Scholar] [CrossRef]
- Klavins, M.; Purmalis, O. Properties and structure of raised bog peat humic acids. J. Mol. Struct. 2013, 1050, 103–113. [Google Scholar] [CrossRef]
- Uddin, M.J.; Mohiuddin, A.S.M.; Hassan, M. Organic carbon storage in the tropical peat soils and its impact on climate change. Am. J. Clim. Chang. 2019, 8, 94–109. [Google Scholar] [CrossRef]
- Zhang, W.; Xiong, Y.; Li, Y.; Qiu, Y.; Huang, G. Effects of organic amendment incorporation on maize (Zea mays L.) growth, yield and water-fertilizer productivity under arid conditions. Agric. Water Manag. 2022, 269, 107663. [Google Scholar] [CrossRef]
- Bilgili, A.V.; Aydemir, S.; Altun, O.; Sayğan, E.P.; Yalçın, H.; Schindelbeck, R. The effects of biochars produced from the residues of locally grown crops on soil quality variables and indexes. Geoderma 2019, 345, 123–133. [Google Scholar] [CrossRef]
- Bednik, M.; Medy’nska-Juraszek, A.; Dudek, M.; Kloc, S.; Kręt, A.; Łabaz, B.; Waroszewski, J. Wheat straw biochar and NPK fertilization efficiency in sandy soil reclamation. Agron. J. 2020, 10, 496. [Google Scholar] [CrossRef]
- Nan, Q.; Wang, C.; Wang, H.; Yi, Q.Q.; Liang, B.Q.; Xu, J.; Wu, W.X. Biochar drives microbially-mediated rice production by increasing soil carbon. J. Hazard. Mater. 2020, 387, 121680. [Google Scholar] [CrossRef] [PubMed]
- Sanchez-Hernandez, J.C.; Ríos, J.M.; Attademo, A.M.; Malcevschi, A.; Andrade, C.X. Assessing biochar impact on earthworms: Implications for soil quality promotion. J. Hazard. Mater. 2019, 366, 582–591. [Google Scholar] [CrossRef]
- Meng, Q.F.; Zhao, S.; Geng, R.H.; Zhao, Y.; Wang, Y.; Yu, F.; Zhang, J.; Ma, X.F. Does biochar application enhance soil salinization risk in a black soil of northeast China (a laboratory incubation experiment)? Arch. Agron. Soil Sci. 2020, 67, 1800642. [Google Scholar] [CrossRef]
- Kiboi, M.N.; Ngetich, K.F.; Fliessbach, A.; Muriuki, A.; Mugendi, D.N. Soil fertility inputs and tillage influence on maize crop performance and soil water content in the Central Highlands of Kenya. Agric. Water Manag. 2019, 217, 316–331. [Google Scholar] [CrossRef]
- Brookes, P.; Powlson, D.; Jenkinson, D. Measurement of microbial biomass phosphorus in soil. Soil Biol. Biochem. 1982, 14, 319–329. [Google Scholar] [CrossRef]
- Jones, D.L.; Willett, V.B. Experimental evaluation of methods to quantify dissolved organic nitrogen (DON) and dissolved organic carbon (DOC) in soil. Soil Biol. Biochem. 2006, 38, 991–999. [Google Scholar] [CrossRef]
- Cao, X.Y.; Olk, D.C.; Chappell, M.; Cambardella, C.A.; Miller, L.F.; Mao, J.D. Solid-state NMR analysis of soil organic matter fractions from integrated physical-chemical extraction. Soil Sci. Soc. Am. J. 2011, 75, 1374–1384. [Google Scholar] [CrossRef]
- Chen, Z.M.; Wang, Q.; Wang, H.Y.; Bao, L.; Zhou, J.M. Crop yields and soil organic carbon fractions as influenced by straw incorporation in a rice-wheat cropping system in southeastern China. Nutr. Cycl. Agroecosys. 2018, 112, 61–73. [Google Scholar] [CrossRef]
- Vieira, F.C.B.; Bayer, C.; Zanatta, J.A.; Dieckow, J.; Mielniczuk, J.; He, Z.L. Carbon management index based on physical fractionation of soil organic matter in an Acrisol under long-term no-till cropping systems. Soil Tillage Res. 2007, 96, 195–204. [Google Scholar] [CrossRef]
- Zhai, L.C.; Wang, Z.B.; Zhai, Y.C.; Zhang, L.H.; Zheng, M.J.; Yao, H.P.; Lv, L.H.; Shen, H.P.; Zhang, J.T.; Yao, Y.R.; et al. Partial substitution of chemical fertilizer by organic fertilizer benefits grain yield, water use efficiency, and economic return of summer maize. Soil Tillage Res. 2022, 217, 105287. [Google Scholar] [CrossRef]
- Jin, Z.W.; Chen, C.; Chen, X.M.; Hopkins, I.; Zhang, X.L.; Han, Z.Q.; Jiang, F.; Billy, G. The crucial factors of soil fertility and rapeseed yield-A five year field trial with biochar addition in upland red soil, China. Sci. Total. Environ. 2019, 649, 1467–1480. [Google Scholar] [CrossRef] [PubMed]
- Zhang, P.; Chen, X.; Wei, T.; Yang, Z.; Jia, Z.; Yang, B.; Han, Q.; Ren, X. Effects of straw incorporation on the soil nutrient contents, enzyme activities, and crop yield in a semiarid region of China. Soil Tillage Res. 2016, 160, 65–72. [Google Scholar] [CrossRef]
- Ouyang, L.; Yu, L.Q.; Zhang, R.D. Effects of amendment of different biochars on soil carbon mineralisation and sequestration. Soil Res. 2014, 52, 46–54. [Google Scholar] [CrossRef]
- Ventura, M.; Alberti, G.; Viger, M.; Jenkins, J.R.; Girardin, C.; Baronti, S.; Zaldei, A.; Taylor, G.; Rumpel, C.; Miglietta, F.; et al. Biochar mineralization and priming effect on SOM decomposition in two European short rotation coppices. GCB Bioenergy 2015, 7, 1150–1160. [Google Scholar] [CrossRef]
- Bolan, N.; Hoang, S.A.; Beiyuan, J.; Gupta, S.; Hou, D.; Karakoti, A.; Joseph, S.; Jung, S.; Kim, K.-H.; Kirkham, M.B.; et al. Multifunctional applications of biochar beyond carbon storage. Int. Mater. Rev. 2021, 67, 1922047. [Google Scholar] [CrossRef]
- Mandal, M.; Kamp, P.; Singh, M. Effect of long term manuring on carbon sequestration potential and dynamics of soil organic carbon labile pool under tropical rice-rice agro-ecosystem. Commun. Soil Sci. Plan. 2020, 51, 468–480. [Google Scholar] [CrossRef]
- Li, X.N.; Wang, T.; Chang, S.X.; Jiang, X.; Song, Y. Biochar increases soil microbial biomass but has variable effects on microbial diversity: A meta-analysis. Sci. Total Environ. 2020, 749, 141593. [Google Scholar] [CrossRef] [PubMed]
- Christensen, B.T. Physical fractionation of soil and structural and functional complexity in organic matter turnover. Eur. J. Soil Sci. 2001, 52, 345–353. [Google Scholar] [CrossRef]
- Diekow, J.; Mielniczuk, J.; Knicker, H.; Bayer, C.; Dick, D.P.; Kogel-Knaber, I. Carbon and nitrogen stocks in physical fractions of a subtropical Acrisol as influenced by long-term no-till cropping systems and N fertilization. Plant Soil 2005, 268, 319–328. [Google Scholar] [CrossRef]
- Sun, H.Y.; Zhang, X.Y.; Wang, E.L.; Chen, S.Y.; Shao, L.W.; Qin, W.L. Assessing the contribution of weather and management to the annual yield variation of summer maize using APSIM in the north China plain. Field Crops Res. 2016, 194, 94–102. [Google Scholar] [CrossRef]
- Liao, X.; Niu, Y.H.; Liu, D.Y.; Chen, Z.M.; He, T.H.; Luo, J.F.; Lindsey, S.; Ding, W.X. Four-year continuous residual effects of biochar application to a sandy loam soil on crop yield and N2O and NO emissions under maize-wheat rotation. Agric. Ecosyst. Environ. 2020, 302, 107109. [Google Scholar] [CrossRef]
- Gao, J.; Liu, Z.; Zhao, B.; Dong, S.T.; Zhang, J.W. Shade stress decreased maize grain yield, dry matter, and nitrogen accumulation. Agron. J. 2020, 112, 2768–2776. [Google Scholar] [CrossRef]

| Amendment | Total Carbon (g kg−1) | Total Nitrogen (g kg−1) | C/N | Addition Amount (kg ha−1) |
|---|---|---|---|---|
| Grass peat | 151.7 | 9.0 | 16.9 | 24,300 |
| Biochar | 681.4 | 7.4 | 92.0 | 5400 |
| Organic fertilizer | 113.7 | 12.0 | 9.5 | 32,430 |
| Maize straw | 409.7 | 12.8 | 32.1 | 9000 |
| Soil Depth (m) | Treatment | DOC/TOC (%) | MBC/TOC (%) | KMnO4-C/TOC (%) | POC/TOC (%) |
|---|---|---|---|---|---|
| 0–0.10 m | Grass peat | 0.8 ± 0.2 ABab | 1.7 ± 0.3 ABa | 18.8 ± 0.6 Cc | 10.4 ± 1.8 Bb |
| Biochar | 0.8 ± 0.2 ABb | 1.4 ± 0.1 Ba | 18.4 ± 0.9 Cc | 13.3 ± 0.3 Ab | |
| Organic fertilizer | 0.9± 0.1 ABc | 1.5 ± 0.1 ABa | 23.4 ± 1.1 Bc | 8.1 ± 0.1 BCb | |
| Maize straw | 1.1 ± 0.1 Aa | 1.9 ± 0.2 Aa | 28.2 ± 1.7 Ab | 9.9 ± 0.1 Bb | |
| Control | 0.5 ± 0.1 Bc | 1.4 ± 0.1 Ba | 26.6 ± 1.3 ABb | 6.1 ± 0.4 Cc | |
| 0.10–0.20 m | Grass peat | 0.6 ± 0.1 Bb | 1.3 ± 0.1 Aa | 29.9 ± 1.2 Ba | 12.9 ± 2.8 ABb |
| Biochar | 0.7 ± 0.1 Bb | 0.9 ± 0.2 Ab | 40.4 ± 1.1 Aa | 15.2 ± 3.6 Ab | |
| Organic fertilizer | 1.2 ± 0.1 ABb | 1.4 ± 0.3 Aa | 40.5 ± 2.3 Aa | 10.3 ± 0.3 Bb | |
| Maize straw | 1.4 ± 0.5 Aa | 1.6 ± 0.1 Aa | 46.1 ± 0.9 Aa | 11.1 ± 0.2 ABb | |
| Control | 0.6 ± 0.1 Bc | 1.1 ± 0.1 Aa | 42.1 ± 2.7 Aa | 14.9 ± 1.3 ABb | |
| 0.20–0.40 m | Grass peat | 1.3 ± 0.1 Ba | 1.3 ± 0.2 Aa | 25.2 ± 1.1 Bb | 27.7 ± 1.8 ABa |
| Biochar | 1.1 ± 0.1 Ba | 0.9 ± 0.1 Ab | 30.6 ± 0.6 ABb | 33.7 ± 2.2 Aa | |
| Organic fertilizer | 1.5 ± 0.1 ABa | 1.4 ± 0.6 Aa | 30.5 ± 1.3 ABb | 23.2 ± 3.6 Ba | |
| Maize straw | 1.8 ± 0.3 Aa | 1.6 ± 0.2 Aa | 32.9 ± 2.9 Ab | 31.9 ± 0.6 Aa | |
| Control | 1.4 ± 0.1 ABa | 1.2 ± 0.5 Aa | 31.7 ± 2.4 Ab | 32.6 ± 3.1 Aa |
| Soil Depth (m) | Treatment | L | LI | CPI | CMI |
|---|---|---|---|---|---|
| 0–0.10 m | Grass peat | 0.23 ± 0.01 Cc | 0.64 ± 0.04 Ca | 1.63 ± 0.14 Aa | 104.51 ± 6.22 ABb |
| Biochar | 0.23 ± 0.01 Cc | 0.63 ± 0.07 Ca | 1.60 ± 0.15 Aa | 100.95 ± 11.10 Bb | |
| Organic fertilizer | 0.31 ± 0.02 Bb | 0.85 ± 0.09 Ba | 1.50 ± 0.17 ABa | 128.38 ± 11.18 Aa | |
| Maize straw | 0.39 ± 0.03 Ab | 1.09 ± 0.09 Aa | 1.18 ± 0.03 BCa | 128.17 ± 4.72 Ab | |
| Control | 0.36 ± 0.02 ABb | 1.00 ± 0.00 ABa | 1.00 ± 0.00 Ca | 100.00 ± 0.00 Ba | |
| 0.10–0.20 m | Grass peat | 0.43 ± 0.02 Ca | 0.59 ± 0.03 Ba | 2.51 ± 0.46 Aa | 147.44 ± 10.17 ABa |
| Biochar | 0.68 ± 0.03 Ba | 0.95 ± 0.01 ABa | 1.77 ± 0.15 ABCa | 166.92 ± 20.52 Aa | |
| Organic fertilizer | 0.69 ± 0.07 Ba | 0.98 ± 0.01 Aa | 1.90 ± 0.22 ABa | 185.19 ± 39.50 Aa | |
| Maize straw | 0.86 ± 0.03 Aa | 1.18 ± 0.04 Aa | 1.54 ± 0.22 BCa | 182.10 ± 15.14 Aa | |
| Control | 0.74 ± 0.08 ABa | 1.00 ± 0.00 Aa | 1.00 ± 0.00 Ca | 100.00 ± 0.00 Ba | |
| 0.20–0.40 m | Grass peat | 0.34 ± 0.02 Bb | 0.74 ± 0.08 Ba | 2.24 ± 0.36 Aa | 164.54 ± 16.84 Aa |
| Biochar | 0.44 ± 0.01 ABb | 0.96 ± 0.09 Aa | 1.46 ± 0.25 ABa | 141.06 ± 13.86 ABab | |
| Organic fertilizer | 0.44 ± 0.03 ABb | 0.95 ± 0.11 Aa | 1.81 ± 0.45 ABa | 173.04 ± 12.19 Aa | |
| Maize straw | 0.50 ± 0.06 Ab | 1.06 ± 0.03 Aa | 1.42 ± 0.07 ABa | 150.20 ± 4.55 Aab | |
| Control | 0.47 ± 0.05 ABb | 1.00 ± 0.00 Aa | 1.00 ± 0.00 Aa | 100.00 ± 0.00 Ba |
| Treatment | Grain Yield (t ha−1) | 1000-Kernel Weight (g) | Plant Height (m) | ETa (mm) | WUE (kg ha−1 mm−1) |
|---|---|---|---|---|---|
| Grass peat | 4.4 ± 0.7 A | 177.4 ± 13.3 | 1.49 ± 0.04 A | 510.5 ± 1.7 | 8.7 ± 1.5 A |
| Biochar | 3.4 ± 0.6 AB | 166.4 ± 12.8 | 1.60 ± 0.07 A | 517.5 ± 17.8 | 6.6 ± 1.1 AB |
| Organic fertilizer | 3.8 ± 0.4 A | 176.7 ± 6.4 | 1.56 ± 0.04 A | 517.0 ± 11.0 | 7.4 ± 0.7 A |
| Maize straw | 2.1 ± 0.3 AB | 163.9 ± 2.7 | 1.29 ± 0.05 B | 521.6 ± 12.7 | 4.0 ± 0.5 BC |
| Control | 1.5 ± 0.4 C | 155.0 ± 5.8 | 1.19 ± 0.03 B | 533.1 ± 12.7 | 2.8 ± 0.8 C |
| STN | STP | -N | -N | Olsen-P | TOC | DOC | MBC | KMnO4-C | POC | Yield | |
|---|---|---|---|---|---|---|---|---|---|---|---|
| STN | 1 | 0.923 ** | 0.918 ** | 0.824 ** | 0.859 ** | 0.991 ** | 0.752 ** | 0.927 ** | 0.727 ** | 0.464 | 0.643 ** |
| STP | 0.923 ** | 1 | 0.821 ** | 0.846 ** | 0.868 ** | 0.939 ** | 0.532 * | 0.851 ** | 0.692 ** | 0.360 | 0.466 |
| -N | 0.918 ** | 0.821 ** | 1 | 0.930 ** | 0.874 ** | 0.913 ** | 0.823 ** | 0.977 ** | 0.651 ** | 0.230 | 0.490 |
| -N | 0.824 ** | 0.846 ** | 0.930 ** | 1 | 0.885 ** | 0.842 ** | 0.640 * | 0.932 ** | 0.548 * | 0.092 | 0.304 |
| Olsen-P | 0.859 ** | 0.868 ** | 0.874 ** | 0.885 ** | 1 | 0.862 ** | 0.617 * | 0.907 ** | 0.406 | 0.273 | 0.381 |
| TOC | 0.991 ** | 0.939 ** | 0.913 ** | 0.842 ** | 0.862 ** | 1 | 0.724 ** | 0.935 ** | 0.734 ** | 0.480 | 0.642 ** |
| DOC | 0.752 ** | 0.532 * | 0.823 ** | 0.640 * | 0.617 * | 0.724 ** | 1 | 0.806 ** | 0.630 * | 0.352 | 0.501 |
| MBC | 0.927 ** | 0.851 ** | 0.977 ** | 0.932 ** | 0.907 ** | 0.935 ** | 0.806 ** | 1 | 0.605 * | 0.329 | 0.556 * |
| KMnO4-C | 0.727 ** | 0.692 ** | 0.651 ** | 0.548 * | 0.406 | 0.734 ** | 0.630 * | 0.605 * | 1 | 0.250 | 0.391 |
| POC | 0.464 | 0.360 | 0.230 | 0.092 | 0.273 | 0.480 | 0.352 | 0.329 | 0.250 | 1 | 0.710 ** |
Disclaimer/Publisher’s Note: The statements, opinions and data contained in all publications are solely those of the individual author(s) and contributor(s) and not of MDPI and/or the editor(s). MDPI and/or the editor(s) disclaim responsibility for any injury to people or property resulting from any ideas, methods, instructions or products referred to in the content. |
© 2024 by the authors. Licensee MDPI, Basel, Switzerland. This article is an open access article distributed under the terms and conditions of the Creative Commons Attribution (CC BY) license (https://creativecommons.org/licenses/by/4.0/).
Share and Cite
Yang, K.; Hu, J.; Ren, Y.; Zhang, Z.; Tang, M.; Shang, Z.; Zhen, Q.; Zheng, J. Enhancement of Soil Organic Carbon, Water Use Efficiency and Maize Yield (Zea mays L.) in Sandy Soil through Organic Amendment (Grass Peat) Incorporation. Agronomy 2024, 14, 353. https://doi.org/10.3390/agronomy14020353
Yang K, Hu J, Ren Y, Zhang Z, Tang M, Shang Z, Zhen Q, Zheng J. Enhancement of Soil Organic Carbon, Water Use Efficiency and Maize Yield (Zea mays L.) in Sandy Soil through Organic Amendment (Grass Peat) Incorporation. Agronomy. 2024; 14(2):353. https://doi.org/10.3390/agronomy14020353
Chicago/Turabian StyleYang, Kaiqi, Jian Hu, Yunzhuo Ren, Zhiao Zhang, Mei Tang, Zhenkun Shang, Qing Zhen, and Jiyong Zheng. 2024. "Enhancement of Soil Organic Carbon, Water Use Efficiency and Maize Yield (Zea mays L.) in Sandy Soil through Organic Amendment (Grass Peat) Incorporation" Agronomy 14, no. 2: 353. https://doi.org/10.3390/agronomy14020353
APA StyleYang, K., Hu, J., Ren, Y., Zhang, Z., Tang, M., Shang, Z., Zhen, Q., & Zheng, J. (2024). Enhancement of Soil Organic Carbon, Water Use Efficiency and Maize Yield (Zea mays L.) in Sandy Soil through Organic Amendment (Grass Peat) Incorporation. Agronomy, 14(2), 353. https://doi.org/10.3390/agronomy14020353