Article

Enhanced Cotton Yield and Fiber Quality by Optimizing Irrigation Amount and Frequency in Arid Areas of Northwest China

1
Zhengzhou Research Base, National Key Laboratory of Cotton Bio-Breeding and Integrated Utilization, School of Agricultural Sciences, Zhengzhou University, Zhengzhou 450001, China
2
State Key Laboratory of Cotton Biology, Institute of Cotton Research, Chinese Academy of Agricultural Sciences, Anyang 455000, China
*
Authors to whom correspondence should be addressed.
Agronomy 2024, 14(2), 266; https://doi.org/10.3390/agronomy14020266
Submission received: 22 December 2023 / Revised: 10 January 2024 / Accepted: 11 January 2024 / Published: 25 January 2024
(This article belongs to the Section Water Use and Irrigation)

Abstract

:
Optimizing irrigation strategies is crucial for sustaining cotton production in the face of growing water scarcity. The three-year experimental study (2020–2022) focused on the impact of varying irrigation amounts (320, 370, and 420 mm) and frequencies (4-, 8-, and 12-day intervals) on cotton growth, yield, yield components, and fiber quality in southern Xinjiang. Employing a completely randomized design with three replications, the results indicated higher irrigation amounts resulted in numerically 2.5–7.5% higher lint yields compared to those under medium and low irrigation amounts, notably significant in 2021. Boll density emerged as the primary yield component influencing yield loss due to irrigation amount, followed by seed cotton weight boll−1. Increased boll density was associated with a greater total number of fruiting sites. Additionally, the increased seed cotton weight boll−1 could be linked to an increased seed number boll−1 and a decreased boll fraction at the lower fruiting branches with lower seed cotton weight boll−1. Higher irrigation frequency improved lint yield by increasing boll density, though a significant effect was observed only in 2020. Increased irrigation amounts generally led to longer fiber lengths but lower micronaire values, while increased irrigation frequency resulted in longer, stronger fibers and reduced micronaire values. Furthermore, the highest yield stability was observed under the condition of high irrigation amount and high frequency. This study holds certain guiding significance for water resource management in cotton production in arid regions.

1. Introduction

Approximately 70% of global cotton production is estimated to face potential adverse impacts from drought [1]. The escalating impact of global climate change has intensified drought events, posing a substantial threat to cotton production worldwide [2,3]. Hence, investigating irrigation strategies that optimize cotton yield while minimizing water consumption is imperative.
As the largest cotton-producing region in China, Xinjiang is confronting a growing scarcity of water resources. The concurrent reduction in irrigation capacity necessitates the adoption of more efficient strategies. Over the past decades, the widespread adoption of under-film drip irrigation has improved irrigation water use efficiency and enhanced cotton yield [4]. Nonetheless, water resource use efficiency in this region is still far lower than that in other prominent cotton-producing countries, such as the United States and Australia [5]. Hence, further improvements in water use efficiency remain an important need for the region.
Applying an appropriate irrigation strategy is pivotal for achieving favorable crop yields and benefits [6]. Irrigation frequency and amount are critical design parameters in irrigation scheduling [7]. Insufficient irrigation can induce water stress in cotton plants, leading to reductions in leaf area, biomass accumulation, boll density, and seed cotton weight boll−1 [8,9], ultimately resulting in decreased yield and fiber quality [10,11]. Conversely, excessive irrigation promotes vegetative growth, causing unnecessary water loss and reduced water use efficiency [12]. Different irrigation frequencies, even with constant total irrigation amounts, can lead to different yields and water use efficiencies, primarily due to variations in soil moisture and wetting patterns. Higher irrigation frequency might create favorable conditions for soil water movement and root water uptake [13]. Studies have shown that higher irrigation frequency, with equal total irrigation water, increased final lint yield in cotton. This is because irrigation events that are frequent and of a small amount prevent deep water percolation, enhance water retention, optimize conditions for water absorption and nutrient uptake, and promote the allocation of assimilates to reproductive organs, thus improving overall water use efficiency [14]. However, low-frequency irrigation may offer the advantage of convenience in drip irrigation management and can help minimize additional expenditures [15]. It was observed that during the reproductive growth stage, the water relationship of cotton plants was highly dependent on the irrigation frequency [16]. Therefore, understanding the effects of deficit irrigation, irrigation frequency, and their combined effects on cotton yield and fiber quality is of paramount significance, particularly when considering plastic mulch conditions.
Cotton lint yield depends on various components, including boll density, seed cotton weight boll−1, and lint percentage [17]. However, it is essential to recognize that fibers develop from protruding cells on the cottonseed coat [18]. Consequently, lint yield can be further broken down into smaller within-boll yield components, such as seeds boll−1, fibers seed−1, seed surface area (SSA), and fiber density. These within-boll components are closely linked to the final seed cotton weight boll−1 and lint percentage [19]. The relationships among cotton lint yield and its components are complex and influenced by genetic and environmental factors [20,21,22]. Despite numerous studies on the effects of irrigation on cotton yield and fiber quality [10,23], limited information exists on how irrigation frequency and amount specifically affect within-boll yield components and their contribution to cotton yield variation. Additionally, cotton plants’ indeterminate growth habit means different irrigation strategies can influence boll accumulation patterns and distribution, contributing to variations in fiber quality [24]. However, understanding how boll distribution and within-boll yield components are affected by irrigation frequency and amount remains limited.
In the current study, we hypothesized that optimizing irrigation amount and frequency can further improve yield and fiber quality, enhancing water use efficiency in under-film drip irrigation systems in arid regions like Xinjiang. Therefore, the objectives were to evaluate the effects of different irrigation amounts and frequencies on yield, yield components and fiber quality, and water use efficiency.

2. Material and Methods

2.1. Experimental Site Characteristics

The experiment was conducted at the Alar experiment station (latitude 40°51′ N, longitude 81°30′ E, altitude 1011 m) of the Cotton Research Institute, Chinese Academy of Agricultural Sciences (CAAS), in China, from 2020 to 2022. This experimental station is located in southern Xinjiang and is characterized by a warm temperate continental arid climate. The area experiences low rainfall and high evaporation. The soil type is sandy loam with moderate fertility. The top 20 cm of soil contains 10.58 g kg−1 of organic matter, 84.87 mg kg−1 of alkali-hydrolyzable nitrogen, 0.64 g kg−1 of total nitrogen, 25.38 mg kg−1 of available phosphorus, 190.5 mg kg−1 of available potassium and has a pH of 7.7. The water table depth ranges from 30 to 50 m. Meteorological data were collected from a local weather station (Campbell Scientific, Logan, UT, USA) near the experimental field (Campbell Scientific, Logan, UT, USA). The weather conditions significantly varied among the three cotton growing seasons, particularly in terms of rainfall and temperature (Figure 1). In the 2020 growing season, rainfall was notably lower than that in the 2021 and 2022 growing seasons, with total rainfall (from sowing to harvest) measuring 19.7 mm, 52.9 mm, and 50.4 mm, respectively. The average temperatures during the growing seasons in 2020, 2021, and 2022 were 20.7 °C, 20.5 °C, and 21.6 °C, respectively.

2.2. Field Experimental Design

To facilitate the seedling establishment, a flood irrigation of 180 mm was applied to the field plot before sowing. In-season irrigation was conducted using an under-mulch drip irrigation system as outlined (Figure 1c). During the seedling stage, no irrigation was applied, and two irrigations, each with an amount of 45 mm, were conducted during the squaring stage. Comprising three irrigation amounts (I1: 320 mm; I2: 370 mm; I3: 420 mm) and three irrigation frequencies (F1: every 4 days; F2: every 8 days; F3: every 12 days), these treatments were arranged in a randomized block design with three replications, totaling 9 irrigation treatments and 27 plots (Figure 1). The irrigation strategy of 420 mm amount and 12-day interval represents the regular local practice. It should be noted that the irrigation amount here actually represents the total amount of water applied, including both irrigation and rainfall. Specifically, the amount of water for each irrigation is determined by subtracting the rainfall received from the last irrigation from the current one from the designed irrigation amount. Each plot, with an area of 63.84 m2, maintained a planting density of 195,000 plants ha−1. Following the cultivation technique known as “one film, three irrigation tapes, and six cotton rows,” cotton plants were arranged in wide and narrow rows (66 cm + 10 cm). Drip irrigation lines were positioned at the center of the narrow rows (Figure 1). The cultivars used were CRI619 in 2020 and Xinluzhong 82 in 2021 and 2022, both being primary cultivars in the local area. Fertilization was consistent across treatments, with the application of 4.8 t ha−1 of organic fertilizer, 225 kg ha−1 (46.4% N) of urea, and 300 kg ha−1 (46% P2O5). Disease and pest control, as well as chemical regulation, were conducted according to local practices and maintained consistently across all treatments. The growth regulator used in this study is mepiquat chloride (MC). The regulation began after the emergence of cotton and was conducted a total of nine times throughout the growing season. The total amount of MC applied was 480 g hm−2. The planting dates for the years 2020, 2021, and 2022 were 21 April, 20 April, and 21 April, respectively, while the harvest dates were 10 October, 10 October, and 11 October, respectively.

2.3. Data Collection

2.3.1. Boll Spatial Distribution

Before harvest, plant mapping was conducted by randomly selecting 30 plants from the central two rows of each plot. Parameters including the plant height, number of nodes, number of fruiting sites, and number of harvestable bolls were recorded. Individual bolls by node and fruiting position were hand-picked. To analyze the distribution of harvestable bolls within the plant, the boll numbers by node and fruiting position were categorized into three vertical zones (bottom zone: fruiting nodes 1–5, middle zone: fruiting nodes 6–10, top zone: fruiting nodes ≥10) and two horizontal zones (inner part: fruiting positions 1–2, outer part: fruiting positions ≥3). The boll fraction of each zone was calculated by summing the boll numbers within the zone and dividing it by the total boll number. For seed cotton weight boll−1 at different vertical zones, cotton bolls from each vertical zone were weighed and divided by the boll number to determine the seed cotton weight boll−1.

2.3.2. Cotton Maturity Determination

To assess cotton maturity, cotton boll distribution by node and fruiting position was adjusted by combining 2nd- and 3rd-position bolls with age-concurrent 1st-position bolls, employing the method described [25]. Specifically, 2nd-position bolls were combined with 1st-position bolls located two nodes higher on the plant, while the 3rd-position bolls were combined with 1st-position bolls located four nodes higher on the plant. Cotton maturity was determined by identifying nodes at the 90th percentile (N90), representing the node at which 90% of the total yield was obtained.

2.3.3. Yield, Yield Component Determination and IWP

At the beginning of October, cotton bolls from a designated area measuring 20.52 m2 (2.28 m × 9 m) in the central 6 rows (in one film) of each plot were manually harvested. The harvested seed cotton was dried and weighed. The harvested seed cotton was sun-dried to achieve a consistent moisture content across all samples before being weighed. For boll mapping, this processed seed cotton was further utilized to determine both the overall seed cotton yield and the weight of individual bolls. Then, the harvested seed cotton for boll mapping was also added to determine the seed cotton yield, as well as the weight of individual bolls. Subsequently, seed cotton was ginned to obtain lint percentage and lint yield. The cotton yield stability (Si) was assessed according to the following formula [26]. A higher Si value indicates lower variability and greater stability. The calculation is represented by the formula:
S i = 1 C V % = M e a n i S D i
where CV denotes the coefficient of variation, Meani (kg ha−1) denotes the average seed cotton yield observed across years, and SDi (kg ha−1) represents the standard deviation of cotton yield.

2.3.4. Fiber Quality

Fifty cotton bolls were collected from each plot and then ginned to separate the lint from the seeds. The lint samples were then forwarded to the Cotton Quality Testing Center, Ministry of Agriculture, located in Anyang, Henan, for fiber quality test using the high-volume instrument (HVI). Various fiber quality parameters, including fiber length, fiber uniformity, micronaire value, and fiber strength, were examined.

2.3.5. Within-Boll Yield Components

Seed cotton samples obtained from plant mapping were ginned to separate lint and seed, with subsequent recording of seed numbers. From these data, seed index (g per 100 seed) and seed number boll−1 were estimated. The average seed surface area (SSA) was estimated from seed index as SSA = 35.74 + 6.59 × seed index [27]. The estimated average weight of individual cotton fiber (weight fiber−1) was calculated as HVI fiber length (in inches) × uniformity × micronaire × 10−6 [28]. Fibers Seed−1 was determined by dividing lint weight seed−1 by individual fiber weight, and fiber density was calculated by dividing the number of fibers per seed by SSA [28].

2.3.6. Contributions of Yield Components to Yield Variation

To attribute yield losses to specific yield components, a simple path model was employed [29]. The irrigation amount treatment I3 and irrigation frequency treatment F1 were used as controls for this estimation. We first considered lint yield (Y) as the product of boll density, seed cotton weight boll−1, and lint percentage. Yield losses attributable to boll density (LBD), seed cotton weight boll−1 (LSW), and lint percentage (LLP) for any given treatment (T) relative to the control (CT) can be calculated according to the following equation.
L B D = Y C T × 1 B D T / B D C T
L S W = Y C T L B D × 1 S W T / S W C T
L L P = Y C T L B D L S W × 1 L P T / L P C T

2.4. Statistical Analysis

Given the distinct weather conditions in different years, separate statistical analyses were carried out for each year. The data were processed and analyzed using SPSS v.26 (SPSS Inc., USA) for analysis of variance (ANOVA). In the ANOVA, irrigation amount, irrigation frequency, and their interaction were considered fixed effects, while replication and its interaction with the main factors were treated as random effects. Multiple comparisons were conducted using the least significant difference (LSD) method, with the significance level set at p < 0.05. The software Origin v. 2019 (OriginLab Inc., Northampton, MA, USA) was employed for generating figures.

3. Results

3.1. Environmental Conditions

The three cotton growing seasons exhibited substantial differences in weather conditions, particularly in terms of rainfall and temperature (Table 1 and Figure 1). The 2020 growing season experienced notably lower rainfall compared to 2021 and 2022, with total rainfall (from sowing to harvest) of 18.9 mm, 51.1 mm, and 66.9 mm, respectively. The maximum daily precipitation (49 mm) occurred in August 2022. Irrigation events occurred from early July to the end of August, a period during which cotton is at the flowering and boll-forming stage. Notably, rainfall before the initiation of irrigation and multiple rainfall events during irrigation in 2021 and 2022 could have influenced the irrigation amount and frequency of treatments, potentially affecting the experimental outcomes. Average temperatures during the growth periods in 2020, 2021, and 2022 were 21.3 °C, 21.5 °C, and 22.2 °C, respectively, while accumulated heat units from 2020 to 2022 were 1409 °C, 1561 °C, and 1418 °C, respectively, with a base temperature of 15 °C.

3.2. Agronomic Characteristics

The interaction between irrigation amount and frequency did not significantly affect any agronomic parameter except for the shedding rate in 2020 (Table 2). Plant height was significantly influenced by irrigation amount and frequency in both 2020 and 2022. Additionally, irrigation amount had a significant effect on fruiting branches and fruiting sites in 2020.
As shown in Table 2, compared to the high irrigation amount, plant height under low and medium irrigation amounts decreased by 5.8 and 3.8%, respectively, averaging across the three years. In 2020, fruiting branches and fruiting sites were highest under the high irrigation amount (9.9 and 17.2, respectively) and lowest under the low irrigation amount (9.1 and 15.0, respectively). Plant height did not significantly differ between low and medium irrigation frequencies across all years, while high-frequency irrigation consistently resulted in the lowest plant height values in all years. The shedding rate was significantly lower only under low irrigation amounts in 2020.

3.3. Cotton Boll Distribution within the Canopy

The interaction between irrigation amount and frequency had no significant impact on the boll fraction in the canopy, except for the boll fraction at the middle zone in 2022. No boll fractions at vertical zones showed a significant response to irrigation frequency in any year. Irrigation amount significantly influenced the boll fraction in all vertical zones in 2020 and only significantly affected the boll fraction in the middle zone in 2022 (Table 3).
As shown in Table 3, a decrease in irrigation amounts generally resulted in an increase in boll fractions in the bottom zone and a decrease in boll fractions in the top zone. The boll fraction in the middle zone was lowest (35.2%) under the high irrigation amount and highest (37.1%) under the low irrigation amount, averaged across three years. In 2020, a significant increase in boll fraction in the inner zone under the high irrigation amount was observed. High irrigation frequency led to a higher boll fraction in the inner zone (89.8%), surpassing the medium and low irrigation frequencies by 3.7 and 3.6%, respectively.
There was no interaction effect between irrigation amount and frequency on N90 in any of the years (Table 2). In 2020, N90 demonstrated a significant response to different irrigation amounts and frequencies. Cotton plants reached the maximum N90 under high irrigation amount (8.77) and high frequency (8.77), while the minimum N90 was observed under low irrigation amount (8.23) and low irrigation frequency (8.20).

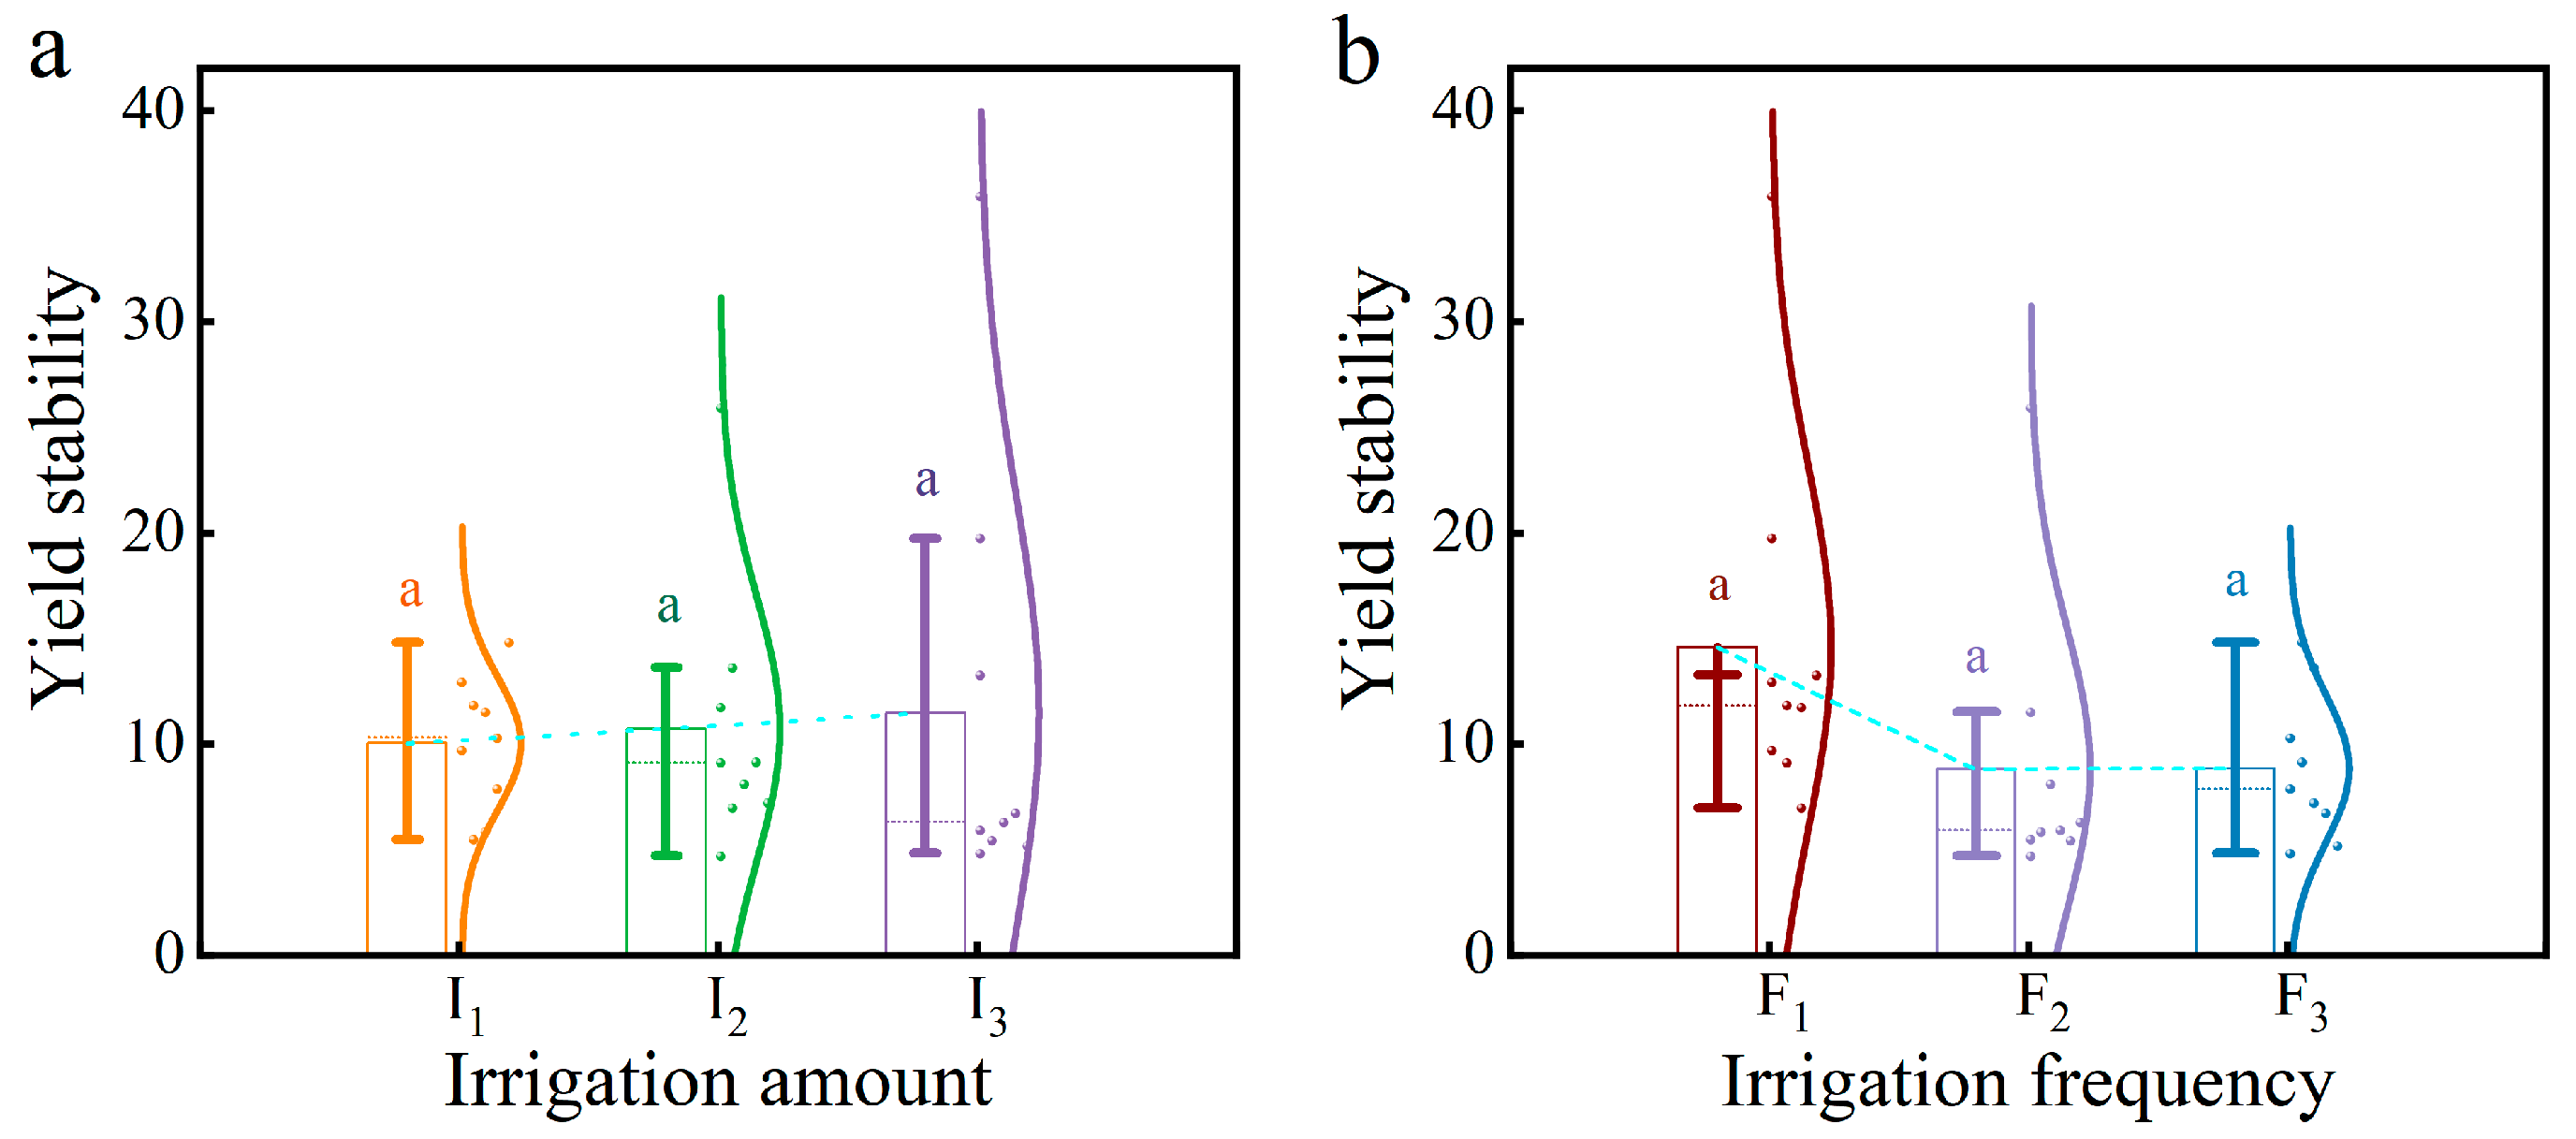
3.4. Lint Yield, IWP, and Yield Stability

No significant effect of the interaction between irrigation frequency and irrigation amount on lint yield was found in any of the years (Table 4). However, it was observed that the irrigation amount had a significant impact on cotton lint yield in 2021, whereas irrigation frequency played a significant role in 2020. Over the three years, increasing irrigation amounts consistently led to a rise in lint yield. Compared to high irrigation amounts, lint yields relative to medium and low irrigation amounts were reduced by 2.5% and 7.5%, respectively, averaged across three years. In 2021, the highest lint yield of 2903 kg ha−1 was achieved under high-frequency irrigation, with no significant difference between medium-frequency and low-frequency irrigation.
The interaction between irrigation amount and frequency did not have a significant effect on IWP in any year (Table 2). However, irrigation amount had a significant impact on IWP in all years, while irrigation frequency significantly affected IWP only in 2020. It was observed that IWP increased significantly with decreasing irrigation amounts. Based on the three-year average, IWP under low and medium irrigation amounts significantly increased by 11.2% and 22.2%, respectively, relative to high irrigation amounts. In 2020, IWP under high-frequency irrigation treatment was significantly higher than that under medium-frequency and low-frequency irrigation treatments, with IWP increasing by 15.3% and 12.9%, respectively.
Analyzing the data over the three years revealed significant variations in cotton yield stability among different treatments (Figure 2). The results showed that an increased irrigation amount resulted in higher yield stability. Compared to medium and low irrigation amounts, high irrigation amounts increased yield stability by 6.9% and 14.4%, respectively. In addition, high-frequency irrigation increased the yield stability by 6.6% and 6.5% relative to medium and low irrigation frequencies, respectively.

3.5. Yield Components and Within-Boll Yield Components

Except for the seed cotton weight boll−1 in 2020, no interaction was observed between the irrigation amount and irrigation frequency for all yield components (boll density, lint percentage, and seed cotton weight boll−1) (Table 4). Boll density increased with increasing irrigation amount but only reached statistical significance in 2021. In terms of irrigation frequency, a notable impact on boll density was observed in both 2020 and 2021, with the highest density recorded under the high-frequency irrigation treatment (122 in 2020 and 119 bolls per square meter in 2021). The irrigation amount had no significant effect on the lint percentage over the three years, while the irrigation frequency had a significant impact on the lint percentage in 2022. Specifically, the treatment with a moderate irrigation frequency recorded the highest lint percentage (45.25%) in 2022, with no significant variance observed between high and low frequencies. In 2021, irrigation amount significantly influenced the seed cotton weight boll−1, with an increase in seed cotton weight as the irrigation amount increased. The irrigation frequency had no significant effect on the seed cotton weight boll−1.
There was no significant interaction effect between irrigation frequency and irrigation amount on any within-boll yield component, except for the seeds boll−1 and fiber seed−1 (Table 5). The irrigation amount had a significant impact on both the seed index and SSA across all years. Notably, in 2021, low irrigation amounts resulted in the smallest seed index and SSA, while the opposite trend was observed in the other two years. Furthermore, low irrigation amounts resulted in the fewest seeds boll−1, reaching statistical significance in 2020 and 2021. In addition, in 2020, the lint weight seed−1 was significantly affected by the irrigation amounts. Compared to low irrigation amounts, medium and high irrigation amounts resulted in a 3.33% and 4.44% reduction in lint weight seed−1, respectively. Over the years, irrigation frequency did not have a significant impact on any within-boll yield components, except for lint weight seed−1 and weight fiber−1 in 2022. In 2022, medium irrigation frequency resulted in the greatest lint weight seed−1 and weight fiber−1.

3.6. Fiber Quality

No significant interaction effect between the irrigation amount and irrigation frequency was observed, with the exception of the micronaire value in 2020 (Table 6). In 2020 and 2022, fiber length was impacted by irrigation frequency. The longest fiber length was consistently observed under the high irrigation frequency in all three years, with no significant difference between medium and low irrigation frequencies. The fiber uniformity index was only significantly influenced by irrigation frequency in 2020, with high frequency resulting in a higher uniformity index (83.44%). In 2020, the micronaire value of the fiber was significantly influenced by irrigation amount, showing a higher micronaire value under low irrigation amounts (5.06). Fiber strength was significantly influenced by both the irrigation amount and irrigation frequency, except for the irrigation amount in 2020. In 2021 and 2022, the fiber strength significantly increased with increasing irrigation amount. Compared to low irrigation frequency, the medium and high-frequency irrigation increased fiber strength by 1.1% and 1.4%, respectively, averaged across the three years.

3.7. Contributions of Yield Components to Lint Yield Losss

The contributions of the yield components to lint yield loss induced by irrigation amount and frequency were assessed in Figure 3. In general, boll density was the greatest contributor to lint yield loss induced by irrigation amount, followed by seed cotton weight boll−1, while lint percentage accounted for a smaller and more consistent portion of lint yield loss. In 2021, lint yield loss represented by boll density ranged from 212.8 kg ha−1 in medium irrigation amount to 304.0 kg ha−1 in low irrigation amount relative to high irrigation amount. Similarly, lint yield loss represented by seed cotton weight boll−1 ranged from −10.7 kg ha−1 in medium irrigation amount to 129.7 kg ha−1 in low irrigation amount relative to high irrigation amount. Boll density was also the largest contributor to lint yield loss caused by irrigation frequency. In 2020, lint yield loss represented by boll density ranged from 453.2 kg ha−1 in medium irrigation frequency and 381.7 kg ha−1 in low irrigation frequency relative to high irrigation frequency. Seed cotton weight boll−1 and lint percentage were less influenced by irrigation frequency and contributed less to lint yield loss.

4. Discussion

4.1. The Effect of the Irrigation Amount and Frequency on the Lint Yield and Yield Components

Appropriate irrigation is one of the most effective means to promote plant growth and development, as well as the yield and quality of cotton [30,31]. The weather data for the three years revealed that solar radiation and temperature conditions were most favorable in 2021 and 2022, while 2020 exhibited the least favorable conditions, leading to lower yields in 2020 compared to the other two years. In 2021 and 2022, there was an increase in rainfall by 20 mm and 40 mm, respectively, during the cotton flowering and boll development periods compared to that in 2020. This increase in rainfall may, to some extent, have impacted the efficacy of the irrigation frequency treatment.
We did not identify any interaction effect between the irrigation amount and frequency on lint yield in any of the years. Lint yields in plots receiving the high irrigation amount were numerically 2.5–7.5% higher compared to those under medium and low irrigation amounts, with the difference between the irrigation amount treatments being significant in 2021. This result aligned with those from previous studies [10,23]. Some scholars have reported that under the same irrigation amount, increasing frequency benefited yield and water use efficiency (WUE) of crops such as cotton, potato, melon, bell pepper, and green beans [7]. In the present study, a higher irrigation frequency generally led to an improved lint yield, although a significant effect was observed only in 2020. More frequent irrigation with less water amount per irrigation event might help maintain a higher moisture state at the soil surface [32], provide a continuous water supply to a growing plant, enhance the water absorption capacity of cotton roots, mitigate periodic stress, alleviate soil water stress due to drought, and reduce yield loss caused by root degradation [33]. Additionally, delivering large amounts of water at longer intervals is more likely to result in overwatering and reduced root activity [34].
Agronomic traits are closely related to cotton yield. In general, it is evident that higher irrigation amounts had a positive impact on all measured agronomic characteristics. The increased irrigation amount was observed to result in taller cotton plants, more fruiting branches, and increased fruiting sites (Table 2). Previous studies have also shown that reduced irrigation amount negatively affects cotton growth, leading to smaller plants, fewer fruiting branches, fewer fruiting sites, and shorter internodes [24]. Due to the higher rainfall in 2021 and 2022, the influence of the irrigation frequency was diminished, and as a result, most agronomic characteristics were not significantly affected by irrigation frequency during these two years. According to a previous study [35], a higher irrigation amount led to a lower shedding rate. However, in the present study, the shedding rate was significantly higher under a high irrigation amount in 2020, and no significant differences were observed in the shedding rate between irrigation amounts in the other years (Table 2). In addition, no significant effect of irrigation frequency was observed in any of the years. Cotton has been shown to preferentially retain or lose bolls at different canopy levels in response to abiotic stress, including water deficit. Higher fruiting branches and fruiting positions further from the main stem tend to have fewer bolls when soil moisture is limited [24,36]. In contrast, the lower canopy level, where most bolls were located, is more likely to be retained in response to reduced soil moisture [37]. However, this study primarily focused on the overall shedding rate, which might explain the different results we attained. Therefore, further investigation of shedding rates at various positions within the canopy under different irrigation amounts and frequencies is still necessary.
Cotton possesses a unique growth pattern characterized by indeterminate growth, where both vegetative and reproductive growth occur concurrently throughout much of its growth cycle [24]. The spatial distribution of cotton bolls plays a crucial role in determining cotton yield and fiber quality, as bolls from different positions within the plant develop at varying times and under different environmental conditions [38]. In the current study, the irrigation amounts primarily influenced the vertical distribution of the bolls. Reduced irrigation led to an increase in boll distribution in the lower and middle canopies, while it decreased in the top canopy. This shift may be attributed to reduced fruiting branches and plant height resulting from decreased irrigation amounts as stated above. Irrigation frequency had no significant impact on the vertical distribution of bolls across the years. However, in 2020, irrigation frequency did significantly affect the horizontal distribution of bolls, particularly reducing the fraction of inner zone bolls with increasing irrigation frequency. These variations in boll distribution can influence differences in crop maturity [39]. The presence of more upper bolls delays the maturation of cotton plants [40], while bolls produced on the first position of sympodial branches have been associated with earlier maturity [24]. In our study, we observed a smaller N90 value (indicating later maturity) with increasing irrigation amount and low irrigation frequency in 2020, suggesting that increased irrigation amounts and extended irrigation intervals delayed the maturity of the cotton crop. This observation aligns with previous research [41]. The delayed crop maturity due to increased irrigation amounts was attributed to the later formation of more top bolls toward the end of the growing season. Conversely, the delay in maturity resulting from low irrigation frequency was attributed to a lower fraction of bolls in the inner zone.
Within-boll yield components are important variables that can be used to accurately analyze cotton yield changes [42]. Seed cotton weight boll−1 was more stable than boll density under water stress [36]. The analysis of cotton yield loss indicated that boll density varied significantly under different irrigation amounts, followed by seed cotton weight boll−1 and seeds boll−1, consistent with a previous study [23]. Our study also revealed that among various irrigation frequencies, cotton boll density remained the yield component that was most significantly affected. The decrease in boll density was mainly attributed to the reduction in plant height, fruiting nodes, and fruiting sites, resulting in a reduced sink capacity. Furthermore, variations in cotton boll distribution may contribute to the variations in individual seed cotton weight boll−1, particularly as the lower bolls within the cotton plant tend to have a lower seed cotton weight boll−1 (Figure 4). The low irrigation amount treatment exhibited slight positive effects on lint weight seed−1, seeds boll−1, seed cotton weight boll−1, and lint percentage. On the other hand, the low irrigation frequency treatment had a slight positive impact on lint weight seed−1, which could partially offset some of the yield losses associated with different irrigation amounts and frequencies.

4.2. The Effect of Irrigation Amount and Frequency on Fiber Quality

Some scholars have investigated the impact of the irrigation amount on cotton fiber quality. However, there has been limited research on the impact of irrigation frequency on cotton fiber quality. This study expands on existing knowledge by assessing the effect of both irrigation amount and frequency on fiber quality. In the current study, no significant effect of irrigation amount on fiber length was observed in any of the years. Based on previous studies, the fiber length has been shown to decrease [11] and remain unchanged [43] under water deficit. The varied results might be attributed to the differences drought in intensity. In this study, high-frequency irrigation generally led to an improvement in fiber length. This phenomenon could be explained by the fact that the increased irrigation frequency helps maintain a higher amount of soil surface moisture [32], thus mitigating water stress [44]. The micronaire value is regarded as being more sensitive to environmental changes [37], and the value is related to both fiber development and the maturation process. Any factor that inhibits development and maturation can result in changes in fiber thickness and maturity. Previous studies presented contradictory findings regarding the response of micronaire to water stress. The micronaire value can exhibit a decrease [45], an increase [46], or remain unaffected [47] as irrigation increases. In the present study, we found that fiber micronaire value remained unaffected by the irrigation amount across all years. However, it was notably impacted by irrigation frequency in 2022, with medium irrigation frequency yielding the highest micronaire value and high irrigation frequency resulting in the lowest micronaire value. It was reported that fiber strength is determined by a few major genes rather than by variations in the growth environment [48]. However, in this study, fiber strength was significantly reduced under the lowest irrigation amount, and the high irrigation frequency resulted in significantly higher fiber strength compared to medium and low irrigation frequency, which contrasts with a previous study [36], which showed that irrigation did not affect fiber strength. It was reported that fiber strength improved with a decrease in water application in 2001 but was not affected in 2003 [47]. On the other hand, it was found that fiber strength was well correlated with soil water, which is similar to the findings of this study [49]. As stated above, the irrigation amount and frequency influenced boll distribution. The strength of cotton fibers has been shown to vary with boll position, seed position, and fiber length [50]. Therefore, the difference in cotton fiber differences in this study between the irrigation amount and frequency might be due to the varied boll distribution. Further studies are still needed to clarify the effect of the irrigation amount and frequency on the fiber strength.

5. Conclusions

This study aimed to evaluate the influence of varying irrigation amounts and frequencies on cotton yield, yield components, and fiber quality while quantifying associated yield losses. It is helpful to understand the physiological mechanism and biological growth process of cotton boll by quantifying the changes of within-boll yield components under different irrigation amounts and frequencies. Higher irrigation amounts significantly increased cotton yield, particularly notably in 2021, primarily driven by increased boll density and seed cotton weight boll−1. Increased irrigation frequency positively influenced cotton yield in 2020 due to increased boll density. Both irrigation amount and frequency influenced fiber quality. Increased irrigation amounts enhanced fiber strength and reduced micronaire values and higher frequency contributed to longer, stronger fibers and lower micronaire values. Notably, the combination of high irrigation amount and high frequency provided the highest yield stability. Therefore, increasing irrigation frequency, alongside a consistent amount, emerges as a viable strategy for optimizing cotton yield and fiber quality, offering practical insights for sustainable cotton cultivation in under-film drip irrigation in arid regions like Xinjiang.

Author Contributions

Conceptualization: Y.J. and L.F.; Methodology, Y.J. and L.F.; Software, Y.J.; Validation, Y.J. and L.F.; formal analysis, Y.J.; investigation, B.Y., Y.H., G.W., X.L., Y.L. (Yaping Lei), X.Z., S.X., M.X., Y.L. (Yabing Li), T.S. and L.F.; resources, B.Y., Y.H., G.W., X.L., Y.L. (Yaping Lei), X.Z., S.X., M.X., Y.L. (Yabing Li) and L.F.; data curation, B.Y., Y.L. (Yabing Li) and L.F.; writing—original draft, Y.J.; writing—review and editing, L.F.; visualization, Y.J.; supervision, Y.L. (Yabing Li) and L.F.; project administration, L.F.; funding acquisition, L.F. All authors have read and agreed to the published version of the manuscript.

Funding

The authors would like to thank the Science and Technology Research Project of Henan Province (232102110030) for the financial support. The funder had no role in the design, data collection, and decision to publish or prepare of manuscript.

Data Availability Statement

The original contributions presented in the study are included in the article, further inquiries can be directed to the corresponding author.

Acknowledgments

We highly acknowledge the help of technicians of the research station from the Institute of Cotton Research Chinese Academy of Agricultural Sciences.

Conflicts of Interest

The authors declare no conflicts of interest.

References

  1. Jans, Y.; von Bloh, W.; Schaphoff, S.; Müller, C. Global cotton production under climate change–Implications for yield and water consumption. Hydrol. Earth Syst. Sci. 2021, 25, 2027–2044. [Google Scholar] [CrossRef]
  2. Huang, W.B.; Wu, F.Q.; Han, W.R.; Li, Q.Q.; Han, Y.C.; Wang, G.P.; Feng, L.; Li, X.F.; Yang, B.F.; Lei, Y.P.; et al. Carbon footprint of cotton production in China: Composition, spatiotemporal changes and driving factors. Sci. Total Environ. 2022, 821, 153407. [Google Scholar] [CrossRef]
  3. Wu, F.Q.; Yang, B.F.; Guo, S.M.; Huang, W.B.; Lei, Y.P.; Xiong, S.W.; Han, Y.C.; Wang, Z.B.; Feng, L.; Li, X.F.; et al. Adopting different cotton cropping systems may regulate the spatiotemporal variation in soil moisture and affect the growth, WUE and yield of cotton. Ind. Crops Prod. 2022, 186, 115259. [Google Scholar] [CrossRef]
  4. Feng, L.; Dai, J.L.; Tian, L.W.; Zhang, H.J.; Li, W.J.; Dong, H.Z. Review of the technology for high-yielding and efficient cotton cultivation in the northwest inland cotton-growing region of China. Field Crops Res. 2017, 208, 18–26. [Google Scholar] [CrossRef]
  5. Feng, L.; Chi, B.J.; Dong, H.Z. Cotton cultivation technology with Chinese characteristics has driven the 70-year development of cotton production in China. J. Integr. Agric. 2022, 21, 597–609. [Google Scholar] [CrossRef]
  6. Karam, F.; Lahoud, R.; Masaad, R.; Daccache, A.; Mounzer, O.; Rouphael, Y. Water use and lint yield response of drip irrigated cotton to the length of irrigation season. Agric. Water Manag. 2006, 85, 287–295. [Google Scholar] [CrossRef]
  7. Çolak, Y.B.; Yazar, A.; Gönen, E.; Eroğlu, E.Ç. Yield and quality response of surface and subsurface drip-irrigated eggplant and comparison of net returns. Agric. Water Manag. 2018, 206, 165–175. [Google Scholar] [CrossRef]
  8. Dagdelen, N.; Basal, H.; Yilmaz, E.; Gurbuz, T.; Akcay, S. Different drip irrigation regimes affect cotton yield, water use efficiency and fiber quality in western Turkey. Agric. Water Manag. 2009, 96, 111–120. [Google Scholar] [CrossRef]
  9. Wanjura, D.F.; Upchurch, D.R.; Mahan, J.R.; Burke, J.J. Cotton yield and applied water relationships under drip irrigation. Agric. Water Manag. 2022, 55, 217–237. [Google Scholar] [CrossRef]
  10. Feng, L.; Bufon, V.B.; Mills, C.I.; Hequet, E.; Bordovsky, J.P.; Keeling, W.; Boman, R.; Bednarz, C.W. Effects of irrigation and plant density on cotton within-boll yield components. Agron. J. 2010, 102, 1032–1036. [Google Scholar] [CrossRef]
  11. Feng, L.; Bufon, V.B.; Mills, C.I.; Hequet, E.; Bordovsky, J.P.; Keeling, W.; Boman, R.; Bednarz, C.W. Effects of irrigation, cultivar, and plant density on cotton within-boll fiber quality. Agron. J. 2011, 103, 297–303. [Google Scholar] [CrossRef]
  12. Yazar, A.; Sezen, S.M.; Sesveren, S. LEPA and trickle irrigation of cotton in the Southeast Anatolia Project (GAP) area in Turkey. Agric. Water Manag. 2002, 54, 189–203. [Google Scholar] [CrossRef]
  13. Segal, E.; Ben-Gal, A.; Shani, U. Water Availability and Yield Response to High-Frequency Micro-Irrigation in Sunflowers. In Proceedings of the Sixth International Micro-irrigation Congress on ‘Micro-Irrigation Technology for Developing Agriculture’, Cape Town, South Africa, 22–27 October 2000; pp. 22–27. [Google Scholar]
  14. Pereira, L.S.; Paredes, P.; Cholpankulov, E.D.; Inchenkova, O.P.; Teodoro, P.R.; Horst, M.G. Irrigation scheduling strategies for cotton to cope with water scarcity in the Fergana Valley, Central Asia. Agric. Water Manag. 2009, 96, 723–735. [Google Scholar] [CrossRef]
  15. Enciso, J.M.; Unruh, B.L.; Colaizzi, P.D.; Multer, W.L. Cotton response to subsurface drip irrigation frequency under deficit irrigation. Appl. Eng. Agric. 2003, 19, 555–558. [Google Scholar] [CrossRef]
  16. Radin, J.; Mauney, J.; Kerridge, P. Water uptake by cotton roots during fruit filling in relation to irrigation frequency. Crop Sci. 1989, 29, 1000–1005. [Google Scholar] [CrossRef]
  17. Conaty, W.C.; Constable, G.A. Factors responsible for yield improvement in new Gossypium hirsutum L. cotton cultivars. Field Crops Res. 2020, 250, 107780. [Google Scholar] [CrossRef]
  18. Constable, G.A.; Bange, M.P. The yield potential of cotton (Gossypium hirsutum L.). Field Crops Res. 2015, 182, 98–106. [Google Scholar] [CrossRef]
  19. Clement, J.D.; Constable, G.A.; Walford, S.A. Improving the precision in estimating cotton seed fibre density. Field Crops Res. 2014, 160, 77–80. [Google Scholar] [CrossRef]
  20. Coyle, G.G.; Smith, C.W. Combining ability for within-boll yield components in cotton, Gossypium hirsutum L. Crop Sci. 1997, 37, 1118–1122. [Google Scholar] [CrossRef]
  21. Bednarz, C.W.; Nichols, R.L.; Brown, S.M. Within-boll yield components of high yielding cotton cultivars. Crop Sci. 2007, 47, 2108–2112. [Google Scholar] [CrossRef]
  22. Ruan, Y.L. Boosting seed development as a new strategy to increase cotton fiber yield and quality. J. Integr. Plant Biol. 2013, 55, 572–575. [Google Scholar] [CrossRef]
  23. Hu, W.; Snider, J.L.; Wang, H.; Zhou, Z.; Chastain, D.R.; Whitaker, J.; Perry, C.D.; Bourland, F.M. Water-induced variation in yield and quality can be explained by altered yield component contributions in field-grown cotton. Field Crops Res. 2018, 224, 139–147. [Google Scholar] [CrossRef]
  24. Snowden, C.; Ritchie, G.; Cave, J.; Keeling, W.; Rajan, N. Multiple irrigation levels affect boll distribution, yield, and fiber micronaire in cotton. Agron. J. 2013, 105, 1536–1544. [Google Scholar] [CrossRef]
  25. Schaefer, C.; Nichols, B.; Collins, G.; Whitaker, J.; Bednarz, C.; Main, C.; Ritchie, G. Cotton maturity determination through vertical mapping. Crop Sci. 2017, 57, 62–70. [Google Scholar] [CrossRef]
  26. Ji, C.; Kiril, M.; Erik, L.P.; Uffe, J. Biomass yield, yield stability and soil carbon and nitrogen content under cropping systems destined for biorefineries. Soil. Tillage Res. 2022, 221, 105397. [Google Scholar] [CrossRef]
  27. Groves, F.E.; Bourland, F.M. Estimating seed surface area of cottonseed. J. Cotton Sci. 2010, 14, 74–81. [Google Scholar]
  28. Groves, F.E.; Bourland, F.M.; Jones, D.C. Relationships of yield component variables to yield and fiber quality parameters. J. Cotton Sci. 2016, 20, 320–329. [Google Scholar] [CrossRef]
  29. Earl, H.J.; Davis, R.F. Effect of drought stress on leaf and whole canopy radiation use efficiency and yield of maize. Agron. J. 2003, 95, 688–696. [Google Scholar] [CrossRef]
  30. Guo, R.; Lin, T.; Tian, L.; Cui, J.P.; Xu, H.J. Effect of regulated deficit irrigation on photosynthesis and chlorophyll fluorescence characteristics in flowering and boll-forming stages of island cotton. Agr. Res. Arid. Areas 2015, 33, 130–134. [Google Scholar]
  31. Zhou, S.; Wang, J.; Liu, J.; Yang, J.; Xu, Y.; Li, J. Evapotranspiration of a drip-irrigated, film-mulched cotton field in northern Xinjiang, China. Hydrol. Process. 2012, 26, 1169–1178. [Google Scholar] [CrossRef]
  32. Meshkat, M.; Warner, R.C.; Workman, S.R. Evaporation reduction potential in an undisturbed soil irrigated with surface drip and sand tube irrigation. Trans. Asae 2000, 43, 79–86. [Google Scholar] [CrossRef]
  33. Loka, D.A.; Oosterhuis, D.M.; Ritchie, G.L. Water-deficit stress in cotton. Stress. Physiol. Cotton 2011, 7, 37–72. [Google Scholar]
  34. DeTar, W.R.; Phene, C.J.; Clark, D.A.; Kerby, T.A. Comparison of water use and yields of Acala and Pima cottons for subsurface drip vs. furrow irrigation. In Proceedings of the Beltwide Cotton Conferences, New Orleans, LA, USA, 10–14 January 1993. [Google Scholar]
  35. Ertek, A.; Kanber, R. Effects of different drip irrigation programs on the boll number and shedding percentage and yield of cotton. Agric. Water Manag. 2003, 60, 1–11. [Google Scholar] [CrossRef]
  36. Pettigrew, W.T. Moisture deficit effects on cotton lint yield, yield components, and boll distribution. Agron. J. 2004, 96, 377–383. [Google Scholar] [CrossRef]
  37. Wang, R.; Ji, S.; Zhang, P.; Meng, Y.L.; Wang, Y.H.; Chen, B.L.; Zhou, Z.G. Drought effects on cotton yield and fiber quality on different fruiting branches. Crop Sci. 2016, 56, 1265–1276. [Google Scholar] [CrossRef]
  38. Nie, J.J.; Yuan, Y.C.; Qin, D.L.; Liu, Y.H.; Wang, S.L.; Li, J.P.; Zhang, M.L.; Zhao, N.; Guo, W.J.; Qi, J.; et al. Spatial distribution of bolls affects yield formation in different genotypes of Bt cotton varieties. J. Integr. Agric. 2019, 18, 2492–2504. [Google Scholar] [CrossRef]
  39. Bednarz, C.W.; Nichols, R.L. Phenological and morphological components of cotton crop maturity. Crop Sci. 2005, 45, 1497–1503. [Google Scholar] [CrossRef]
  40. Gwathmey, C.O.; Clement, J.D. Alteration of cotton source–sink relations with plant population density and mepiquat chloride. Field Crops Res. 2010, 116, 101–107. [Google Scholar] [CrossRef]
  41. Sharma, B.; Ritchie, G.L. High-throughput phenotyping of cotton in multiple irrigation environments. Crop Sci. 2015, 55, 958–969. [Google Scholar] [CrossRef]
  42. Bednarz, C.W.; Bridges, D.C.; Brown, S.M. Analysis of cotton yield stability across population densities. Agron. J. 2000, 92, 128–135. [Google Scholar] [CrossRef]
  43. Meng, Z.; Bian, X.; Liu, A.; Pang, H.; Wang, H. Effect of regulated deficit irrigation on growth and development characteristics in cotton and its yield and fiber quality. Cotton Sci. 2008, 20, 39–44. [Google Scholar] [CrossRef]
  44. Bucks, D.; Allen, S.; Roth, R.; Gardner, B. Short staple cotton under micro and amount-basin irrigation methods. Irrig. Sci. 1988, 9, 161–176. [Google Scholar] [CrossRef]
  45. Davidonis, G.H.; Johnson, A.; Landivar, J.; Hinojosa, O. Influence of low-weight seeds and motes on the fiber properties of other cotton seeds. Field Crops Res. 1996, 48, 141–153. [Google Scholar] [CrossRef]
  46. Bradow, J.M.; Davidonis, G.H. Quantitation of fiber quality and the cotton production-processing interface: A physiologist’s perspective. J. Cotton Sci. 2000, 4, 34–64. [Google Scholar]
  47. Booker, J.D.; Bordovsky, J.R.; Lascano, J.; Segarra, E. Variable rate Irrigatıon on Cotton Lint yield and Fiber Quality. In Proceedings of the Beltwide Cotton Conferences, San Antonio, TX, USA, 3–5 January 2006; pp. 1768–1776. [Google Scholar]
  48. May, O.L. Genetic variation in fiber quality. In Cotton Fibers; Basra, A.S., Ed.; Food Products Press: New York, NY, USA, 1999; pp. 183–229. [Google Scholar]
  49. Johnson, R.M.; Downer, R.G.; Bradow, J.M.; Bauer, P.J.; Sadler, E.J. Variability in cotton fiber yield, fiber quality, and soil properties in a southeastern coastal plain. Agron. J. 2022, 94, 1305–1316. [Google Scholar] [CrossRef]
  50. Liu, J.; Yang, H.; Hsieh, Y.L. Variations of mature cotton fiber tensile properties: Association with seed position and fiber length. Text. Res. J. 2001, 71, 1079–1086. [Google Scholar] [CrossRef]
Figure 1. (a) The number of irrigation times and water amount applied for each irrigation event. (b) Weather conditions from the planting month to the harvest month of cotton at experimental sites from 2020 to 2022. (c) Schematic diagram of cotton row spacing configuration and drip irrigation pipe placement.
Agronomy 14 00266 g001
Figure 2. The stability of cotton yield under varying irrigation amounts (a) and irrigation frequencies (b) from 2020 to 2022. The blue dashed lines represent the mean of the values. Values not sharing a common letter within each column are significantly different at p < 0.05.
Agronomy 14 00266 g002
Figure 3. Yield loss contributions attributed to individual yield components for different irrigation amounts during the 2021 cotton growing season (a) and for different irrigation frequencies for the 2020 cotton growing season (b). Lint yield was considered a product of boll density, seed cotton weight boll−1, and lint percentage. Values are means ± standard error (n = 9).
Agronomy 14 00266 g003
Figure 4. Seed cotton weight boll−1 for different fruiting branches from 2020 to 2022. Values are means ± standard error (n = 27) and those not sharing a common letter within each column are significantly different at p < 0.05.
Agronomy 14 00266 g004
Table 1. Average daily minimum (Tmin), maximum (Tmax), mean temperatures (Tmean), rainfall, GDD, and sunshine hours by month during the 2020–2022 experimental periods.
Climatic VariableYearMayJunJulAugSepOctMean/Total
Tmean (°C)202022.823.724.725.219.811.621.3
202121.525.126.523.821.110.821.5
202224.325.326.922.922.211.722.2
Tmax (°C)202035.237.536.037.832.222.933.6
202135.835.239.935.834.530.935.4
202236.337.840.734.936.024.935.1
Tmin (°C)202011.411.014.714.98.30.210.1
20215.014.416.210.08.5−1.68.7
202210.311.113.913.29.5−0.19.7
Rainfall (mm)20200.022.1912.223.720.75018.9
202120.89.013.03.33.81.251.1
20220.60.516.849.00066.9
GDD (°C)2020241.0260.5301.0326.6143.21.21273
2021210.9303.1357.9281.2183.28.81345
2022289.1310.0368.1252.2215.84.01439
Sunshine hours (h)2020194.4268.2283.3265.2201.3196.41409
2021237.0294.9257.3259.6293.9219.01562
2022224.4276.7240.6170.6275.3230.31418
Table 2. Effects of various irrigation amounts, frequencies, and their interaction on the plant height, number of fruiting branches, fruiting sites, shedding rate, and crop maturity (N90) for cotton grown at Alar, Xinjiang, during the growing seasons from 2020 to 2022. Values are means (n = 9) and those not sharing a common letter within each column are significantly different at p < 0.05. NS indicates p > 0.05, * indicates p < 0.05, and ** indicates p < 0.01.
FactorsPlant Height (cm)Fruiting Branches
-
Fruiting Sites
-
Shedding Rate
(%)
N90
202020212022Mean202020212022Mean202020212022Mean202020212022Mean202020212022Mean
Irrigation (I)
I156.0 b77.664.7 c66.19.1 b8.67.18.315.0 b13.712.113.647.2 b61.055.154.38.23 b7.256.397.29
I256.9 ab78.966.8 b67.59.6 ab8.77.18.516.7 ab13.411.513.951.2 ab60.955.555.98.68 ab7.156.417.41
I360.9 a80.069.6 a70.29.9 a8.77.38.717.2 a13.812.114.452.6 a60.855.656.38.77 a7.356.597.57
Frequency (F)
F155.4 b78.365.7 b66.59.68.77.18.516.814.011.814.248.861.454.855.08.77 a7.356.217.44
F260.1 a78.968.3 a69.19.88.67.38.617.013.612.014.252.461.955.556.68.71 a7.186.537.47
F358.3 ab79.367.2 a68.39.28.87.28.415.214.312.013.849.860.455.955.48.20 b7.236.657.36
Source of variance
I*NS** *NSNS *NSNS *NSNS *NSNS
F*NS** NSNSNS NSNSNS NSNSNS *NSNS
I × FNSNSNS NSNSNS NSNSNS **NSNS NSNSNS
Table 3. Effect of various irrigation amounts, frequencies, and their interaction on the boll distribution within cotton plants for cotton grown at Alar, Xinjiang, during the growing seasons from 2020 to 2022. Values are means (n = 9) and those not sharing a common letter within each column are significantly different at p < 0.05. NS indicates p > 0.05, * indicates p < 0.05, and ** indicates p < 0.01.
FactorsVertical Boll Fraction (%)Horizontal Boll Fraction (%)
Bottom Zone
(Fruiting Nodes 1–3)
Middle Zone
(Fruiting Nodes 4–6)
Top Zone
(Fruiting Nodes ≥ 7)
Inner Zone
(Fruiting Positions 1)
Outer Zone
(Fruiting Positions ≥ 2)
202020212022Mean202020212022Mean202020212022Mean202020212022Mean202020212022Mean
Irrigation (I)
I146.9 a46.950.948.233.3 a37.640.3 a37.119.8 b15.58.814.777.2 ab89.294.586.922.8 ab10.75.513.0
I244.1 ab47.550.847.530.9 b37.339.9 ab36.025.0 a15.29.216.575.1 b89.996.087.024.9 a9.94.012.9
I341.8 b46.251.946.632.9 a36.436.2 b35.225.2 a17.411.918.279.2 a91.693.988.220.8 b8.36.111.7
Frequency (F)
F143.245.853.047.331.636.739.335.925.217.57.716.874.4 b89.894.586.225.6 a9.95.513.7
F244.248.351.648.032.637.337.735.923.214.410.716.176.2 b88.793.486.123.8 a11.16.613.8
F345.446.649.147.033.037.239.436.521.616.211.416.480.9 a92.196.589.819.1 b7.93.510.2
Source of variance
I*NSNS *NS* *NSNS *NSNS *NSNS
FNSNSNS NSNSNS NSNSNS **NSNS **NSNS
I × FNSNSNS NSNS* NSNSNS NSNSNS NSNSNS
Table 4. Effects of various irrigation amounts, frequencies, and their interaction on lint yield, boll density, lint percentage, seed cotton weight boll−1, seed index, and irrigation water productivity (IWP) for cotton grown at Alar, Xinjiang, during the growing seasons from 2020 to 2022. Values are means (n = 9) and those not sharing a common letter within each column are significantly different at p < 0.05. NS indicates p > 0.05, * indicates p < 0.05, and ** indicates p < 0.01.
FactorsLint Yield
(kg ha−1)
IWP
(m3 ha−1)
Boll Density
(bolls m−2)
Lint Percentage
(%)
Seed Cotton Weight Boll−1 (g)Seed Index
(g)
202020212022202020212022202020212022202020212022202020212022202020212022
Irrigation (I)
I125683202 b30031.68 a2.12 a2.09 a107110 b10247.7147.1344.805.036.16 b6.579.20 a8.54 b9.21 a
I226473439 a30781.55 a1.96 b1.85 b111113 ab10747.1147.5145.025.066.43 a6.399.04 ab8.65 b8.90 b
I327513588 a31451.34 b1.81 c1.67 c113120 a10847.5347.4044.655.126.41 a6.528.77 b8.93 a9.17 a
Frequency (F)
F12910 a352830291.66 a1.941.85122 a119 a10547.4047.0444.37 b5.036.306.509.068.709.18
F22499 b336630691.44 b2.011.86103 b113 ab10447.4647.4145.25 a5.116.286.529.048.689.09
F32554 b339331031.47 b1.931.88106 b111 b10747.5047.6044.84 b5.076.426.478.928.739.00
Source of variation
INS**NS****NS*NSNSNSNSNS*NS***
F*NSNS*NSNS***NSNSNS*NSNSNSNSNSNS
I× FNSNSNSNSNSNSNSNSNSNSNSNS*NSNSNSNSNS
Table 5. Effect of various irrigation amounts, frequencies, and their interaction on seeds boll−1, seed surface area (SSA), lint weight seed−1, fibers seed−1, fiber density, and weight fibe−1 for cotton grown at Alar, Xinjiang, during the growing seasons from 2020 to 2022. Values are means (n = 27) and those not sharing a common letter within each column are significantly different at p < 0.05. NS indicates p > 0.05, * indicates p < 0.05, and ** indicates p < 0.01.
FactorsSeeds Boll−1 (No.)SSA (mm2 Seed−1)Lint Weight Seed−1 (g)Fibers Seed−1 (No.)Fiber Density
(No. mm−2)
Weight Fiber−1 (μg)
202020212022202020212022202020212022202020212022202020212022202020212022
Irrigation (I)
I126.84 b33.03 b33.4996.36 a92.06 b96.44 a0.090 a0.0900.08819,77118,77019,243205.27204.02199.694.58 a4.704.60
I227.56 ab33.87 a33.4695.41 ab92.73 b96.19 a0.087 b0.0890.08619,72819,11018,898206.48206.10200.274.46 ab4.734.57
I328.25 a33.39 ab33.5393.80 b94.58 a94.40 b0.086 b0.0800.08719,43019,32619,017207.19204.62197.814.43 b4.664.59
Frequency (F)
F127.1533.3333.3895.6093.1096.280.0880.0890.087 ab19,66019,13919,273205.61205.64200.294.494.664.50 b
F227.8233.1133.3495.4492.9695.630.0880.0890.089 a19,83818,69918,972207.67201.41198.394.474.764.69 a
F327.6833.8533.7794.5493.3195.090.0870.0900.086 b19,43219,36918,914205.66207.69199.094.514.674.56 ab
Source of variation
I***NS*****NSNSNSNSNSNSNSNS*NSNS
FNSNSNSNSNSNSNSNS*NSNSNSNSNSNSNSNS*
I × FNS*NSNSNSNSNSNSNSNSNS*NSNSNSNSNSNS
Table 6. Effects of various irrigation amounts, frequencies and their interaction fiber length, uniformity index, micronaire, and fiber strength for cotton grown at Alar, Xinjiang, during the growing seasons from 2020 to 2022. Values are means (n = 27) and those not sharing a common letter within each column are significantly different at p < 0.05. NS indicates p > 0.05, * indicates p < 0.05, and ** indicates p < 0.01.
FactorsFiber Length
(mm)
Uniformity Index
(%)
Micronaire
-
Fiber Strength
(cN tex−1)
202020212022202020212022202020212022202020212022
Irrigation (I)
I127.829.129.282.984.986.05.06 a4.874.6528.1427.67 b29.05 b
I228.029.329.483.084.786.34.85 b4.834.5928.2428.21 a29.33 b
I328.229.429.583.285.186.34.83 b4.844.5827.8228.28 a29.90 a
Frequency (F)
F128.2 a29.329.7 a83.4 a85.086.24.84 b4.824.47 b28.53 a28.50 a29.94 a
F227.0 ab29.429.3 ab82.9 b84.786.24.99 a4.874.71 a27.83 b27.75 b29.15 b
F327.7 b29.129.1 b82.7 b84.986.34.90 ab4.834.63 ab27.84 b27.91 b29.18 b
Source of variation
INSNSNSNSNSNS**NSNSNS**
F*NS**NSNS*NS****
I × FNSNSNSNSNSNS**NSNSNSNSNS
Disclaimer/Publisher’s Note: The statements, opinions and data contained in all publications are solely those of the individual author(s) and contributor(s) and not of MDPI and/or the editor(s). MDPI and/or the editor(s) disclaim responsibility for any injury to people or property resulting from any ideas, methods, instructions or products referred to in the content.

