Article

Strategies for Regulating the Bioavailability and Mobility of Se and Cd in Cd-Contaminated Seleniferous Soils: Coupling the Bioavailable Se:Cd Molar Ratio with Soil Properties

1
College of Land Resources and Environment, Jiangxi Agricultural University, Nanchang 330045, China
2
Key Laboratory of Crop Physiology, Ecology and Genetic Breeding, Ministry of Education, Nanchang 330045, China
3
Northeast Institute of Geography and Agroecology, Chinese Academy of Sciences, Changchun 130012, China
4
Agro-Environmental Protection Institute, Ministry of Agriculture and Rural Affairs, Tianjin 300191, China
5
Key Laboratory of Agricultural Resources and Ecology in Poyang Lake Watershed of Ministry of Agriculture and Rural Affairs in China, Ministry of Agriculture and Rural Affairs, Nanchang 330045, China
*
Authors to whom correspondence should be addressed.
Agronomy 2024, 14(12), 2941; https://doi.org/10.3390/agronomy14122941
Submission received: 15 November 2024 / Revised: 6 December 2024 / Accepted: 9 December 2024 / Published: 10 December 2024
(This article belongs to the Section Soil and Plant Nutrition)

Abstract

:
The prevalent issue of cadmium (Cd) in naturally selenium (Se)-enriched soils has significantly impacted the safe utilization of Se-rich soils. Although Se antagonizes Cd and is affected by Se:Cd stoichiometry, the mechanism behind this interaction remains unclear. To reveal the relation between the soil bioavailable Se:Cd molar ratio (AMR-Se:Cd) and the transformation of Se and Cd fractions, as well as to identify the principal controlling factors, we conducted a study in Shanggao County, Yichun City, a naturally Se-rich area in Jiangxi Province, and quantitatively analyzed the distribution features of Se, Cd, and AMR-Se:Cd across different soil types and land use types. The results demonstrated that soil AMR-Se:Cd was statistically positively correlated with the bioavailable Se content (r = 0.331, p < 0.01) and had a negative correlation with the bioavailable Cd content (r = −0.402, p < 0.001). Cd was transformed from highly bioavailable fractions to less bioavailable fractions as the AMR-Se:Cd increased. A suitable AMR-Se:Cd was conducive to achieving a higher mobility of Se (mobility factor of 12.31%) and a lower mobility of Cd (mobility factor of 23.49%) simultaneously. Spearman correlation analysis and partial least squares path modeling revealed that soil type and land use type modulated the morphological transformation of soil Se and Cd by influencing changes in free Fe-Al oxides and soil organic matter content, which in turn altered the AMR-Se:Cd. Therefore, the findings of this study can offer guidance for regulating the appropriate AMR-Se:Cd in Se-rich soils through management practices to enhance the bioavailability and mobility of soil Se while diminishing the bioavailability and mobility of Cd.

1. Introduction

Selenium (Se) is a vital element with dual biological functions of nutrition and detoxification and is known as a life-protecting agent [1]. Se at certain levels has been demonstrated to positively influence plant growth and enhance tolerance to abiotic stressors [2]. In recent years, investigations have identified natural Se-rich soil resources including those in Enshi City, Ziyang County, Yichun City, and elsewhere [3,4,5]. However, Se is often associated with cadmium (Cd) due to isomorphism, which seriously affects the safe utilization of soils that are rich in Se [6]. Cd is one of the most poisonous trace heavy metal elements for crops and animals and is readily absorbed by crop roots and then enters the human body through the food chain, causing harm to organs and the immune system [7]. Se resources are unevenly distributed in China, with approximately 51% of the area exhibiting Se deficiency [1]. Therefore, how to make rational use of Se-rich soil is of great significance in ensuring food safety and human Se nutrition.
Current research suggests that Se can antagonize Cd, reducing Cd uptake by plants while also alleviating its toxic effects [8,9]. The interactions of Se and Cd can be influenced by the stoichiometry relationships between the two elements. The Se:Cd molar ratio threshold has been demonstrated to be crucial in controlling the buildup of Cd in plants [10]. The addition of Se increased Cd uptake by plants when the soil AMR-Se:Cd ratio was below 0.7. However, when the ratio exceeded this threshold, Cd accumulation was significantly reduced, and the aboveground bioavailable Se content increased [11]. In a hydroponic test, the concentration of Cd in all parts of the rice and the transfer factor simultaneously reached the lowest value when the molar ratio of solution Se and Cd was higher than 1 [9]. The results of the in situ desorption kinetics experiments with Se and Cd demonstrated that a lower AMR-Se:Cd was indicative of a greater potential for Cd hazards in soil [12]. Although little research has been reported on the Se:Cd ratio in Se-enriched soil, exploring its relationship with the transformation of Se and Cd fractions would contribute to a more extensive grasp of their interactions.
The primary sources of Se and Cd contents are the parent materials of the soil [12]. As the process of soil formation progresses, the influence of soil parent materials on Se and Cd distribution diminishes, while the role of soil physico-chemical properties becomes more pronounced [13]. The physico-chemical properties of different soil types exhibit notable disparities contingent on the soil-forming conditions, including the climate, soil parent materials, vegetation, and topography [14]. Consequently, the contents of Se and Cd vary across different soil types. Different land use types can redistribute nutrients in the soil and alter the soil environment, leading to significant changes in soil physico-chemical properties [15]. Studies have shown that the accumulation and uptake of Se and Cd by plants, as well as their interactions in the soil, depend not only on their total contents in soils but also on the specific fractions of Se and Cd present [16]. However, there are fewer reports on how land use types and soil types affect the soil Se:Cd ratio, as well as how the Se:Cd ratio influences the transformation of Se and Cd fractions. Conducting an in-depth study of the key factors that affect the transformation of Se and Cd fractions is crucial for guiding the safe and efficient utilization of Se-enriched soil resources.

2. Materials and Methods

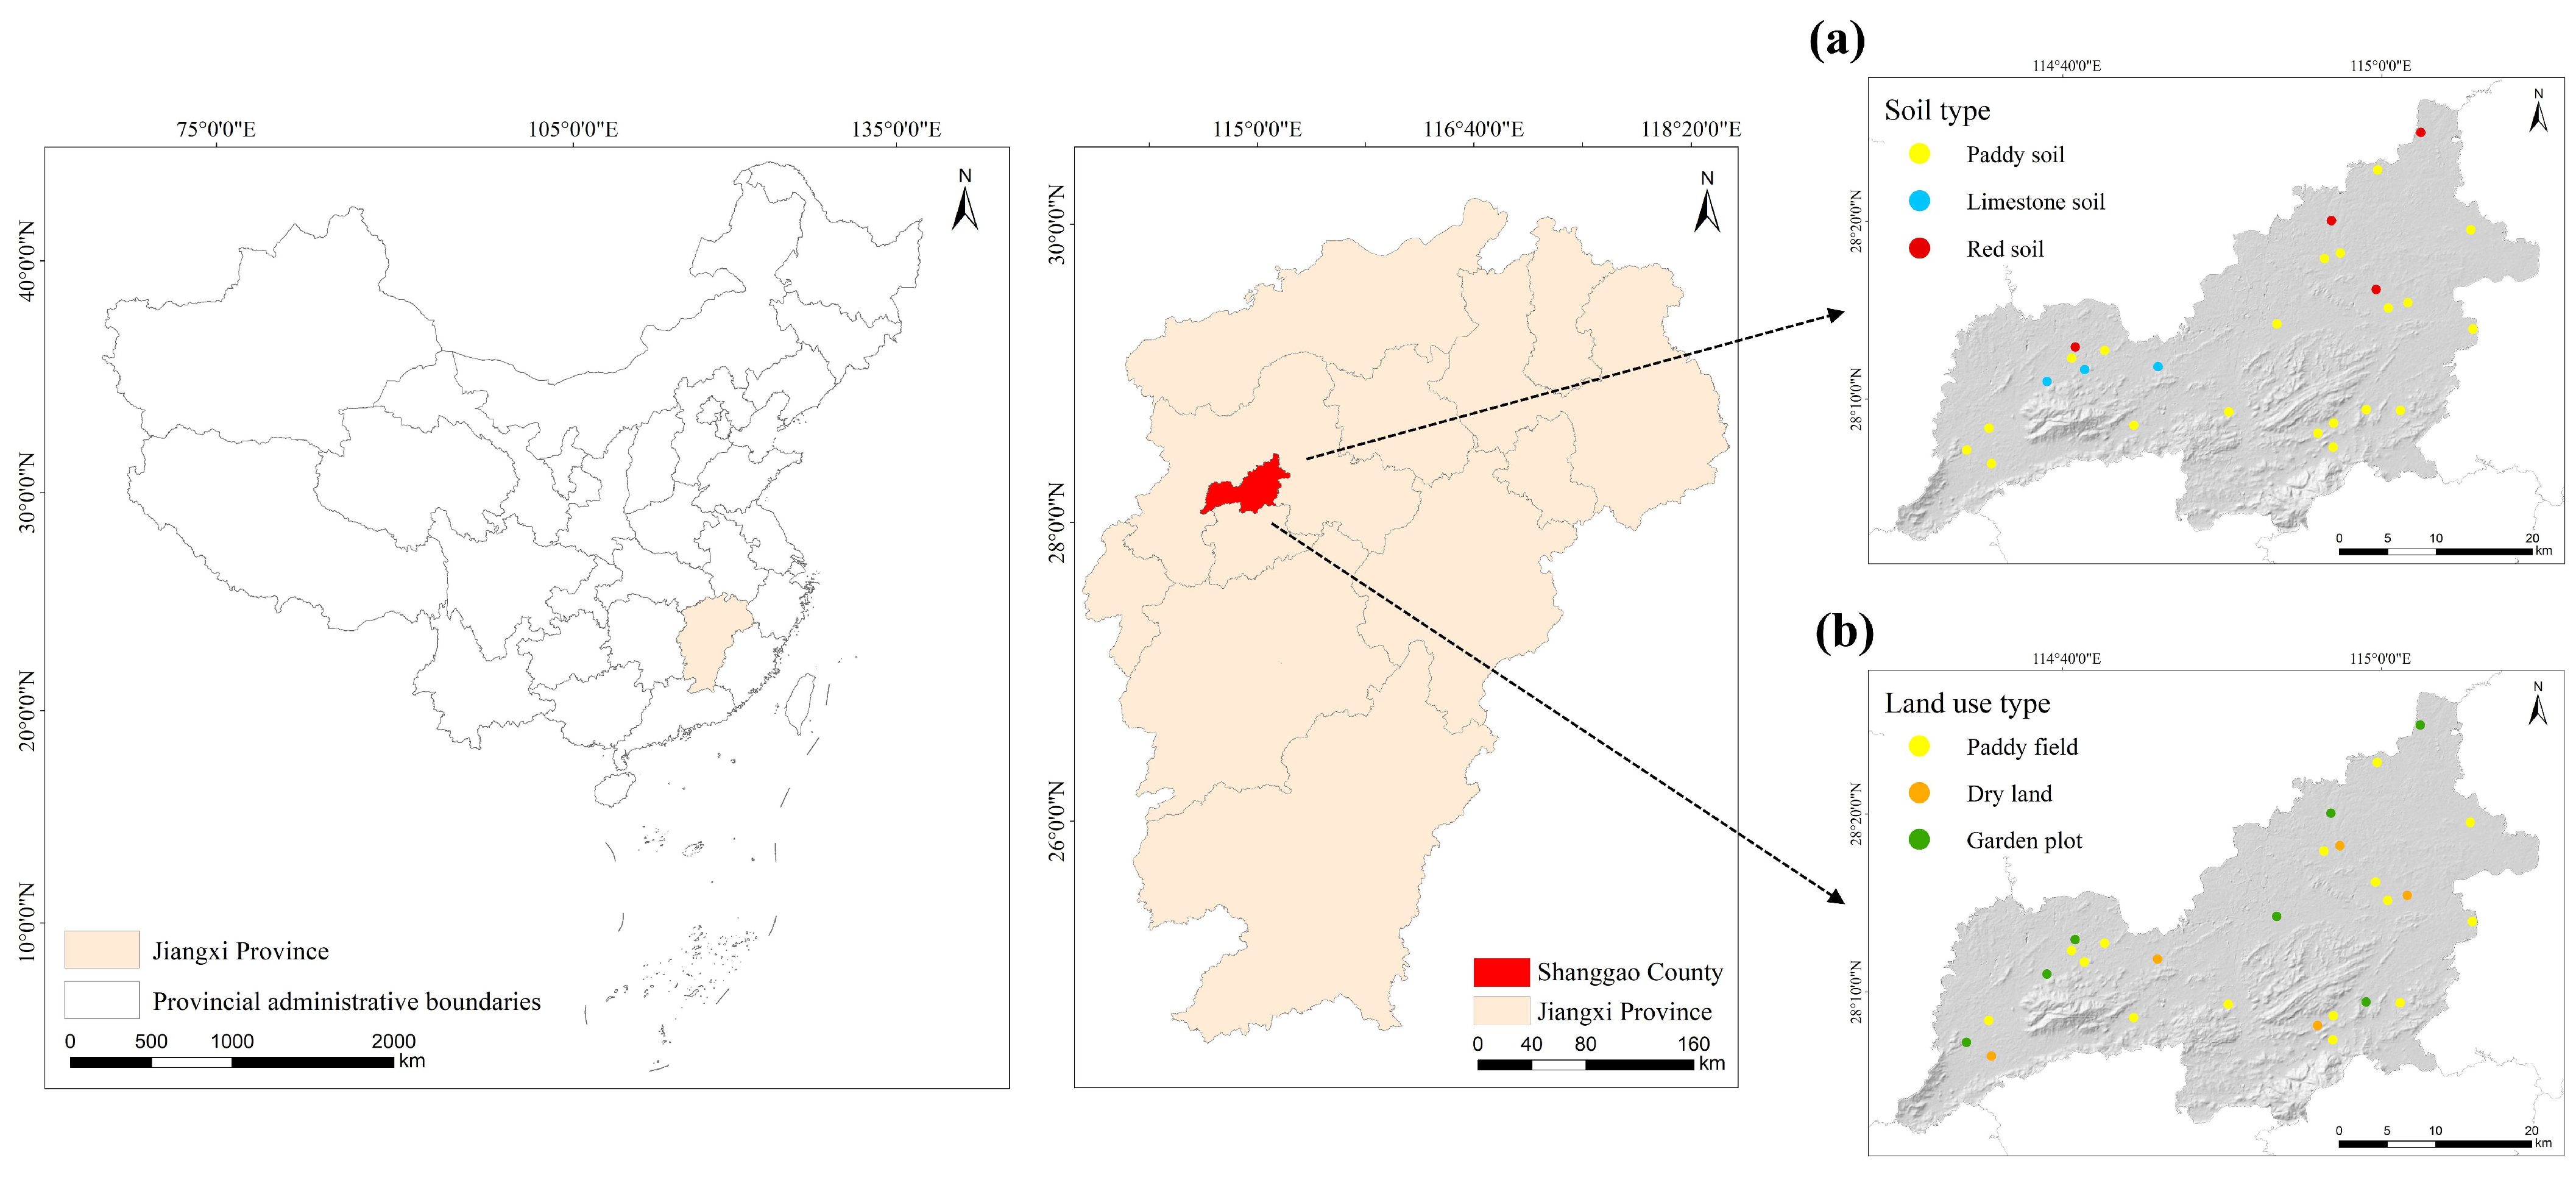
2.1. Overview of the Study Area

Shanggao County is situated in the northwestern region of Jiangxi Province and falls under the jurisdiction of Yichun City, which is a typical Se-rich natural area in Jiangxi (Figure 1). And its geographical coordinates are between 28°02′ and 28°25′ N and 114°28′ and 115°10′ E, with a total area of about 1350 km2. The climate is a subtropical monsoon climate. The region receives an average of 1700 h of sunshine per year, with a frost-free period of 276 days on average. The annual mean temperature is 17.6 °C, and the average yearly rainfall is 1733.4 mm. The terrain is generally gentle, with higher elevations in the southwest, flat areas in the center, and lower elevations in the northeast. The landforms of the region are predominantly mountainous and hilly, ranging in altitude from 20 m to 1006 m.
Soil Se levels in Jiangxi Province are 0.44 mg·kg−1, which is much higher than the global average (0.15 mg·kg−1) and the national average in China (0.29 mg·kg−1) [17]. In Yichun City, it was found that the distribution area of Se-rich soils accounted for 82.50% of the total area. And the average Se and Cd levels in the soil were 0.51 mg·kg−1 and 0.32 mg·kg−1, respectively [5]. Tan et al. found significant differences in Se levels across different soil types. Red soil had a higher Se level (0.36 mg·kg−1) compared with paddy soil (0.20 mg·kg−1) in China [18]. The distribution of soil types in Shanggao County is influenced by topographical factors, with paddy soil, red soil, and limestone soil dominating. The major land use types in the study area are paddy field, dry land, and garden plot, where the major crops include rice (Oryza sativa L.), peanut (Arachis hypogaea L.), and oilseed rape (Brassica napus L.), and cropping systems are single and double.

2.2. Sample Collection and Processing

From September to November 2022, through the collection of relevant information and field visits to the study area, 81 surface soils were sampled at 27 locations by using the random distribution method, taking full account of factors such as topographical features, soil types, and land use types, and incorporating the representative principle (Figure 1a,b). The GPS data and basic information about the sampling sites were recorded during the collection of soil samples. The 81 soil samples included 60 paddy soils; 9 limestone soils; 12 red soils; and 45, 15, and 21 samples from paddy fields, dry lands, and garden plots. The different soil types were named according to the Classification and codes for Chinese soil (GB/T 17296-2009) [19]. The samples were air-dried indoors in a naturally ventilated environment. Gravel, along with animal and plant debris, was carefully removed. The soils were then ground and passed through 10 and 100 mesh sieves for the analysis of relevant properties.

2.3. Analysis and Test

Soil physico-chemical properties such as the pH (water to soil ratio of 2.5:1), total nitrogen (TN), soil organic matter (SOM), available phosphorus (AK), available phosphorus (AP), free Fe oxide (Fed), free Al oxide (Ald), and soil texture (sand, silt, and clay) were determined according to Lu’s manual [20]. Dissolved organic carbon (DOC) was analyzed by a TOC analyzer after leaching at a water–soil ratio of 5:1 [21]. Soil samples were microwave digested with HCl-HNO3-HF-H2O2, and the resulting solution was used for direct determination of the total Cd content by graphite furnace atomic absorption spectroscopy (GFAAS). Another portion of the digested solution was reduced with HCl and then used for the determination of the total Se concentration via hydride generation-atomic fluorescence spectrometry (HG-AFS). Soluble Se (SOL-Se), exchangeable Se (EXC-Se), Fe-Mn oxide-bound Se (OX-Se), organic matter-bound Se (OM-Se), and residual Se (RES-Se) were sequentially extracted using the improved method of Liu et al. [22]. Five fractions of Cd such as exchangeable Cd (EXC-Cd), carbonate-bound Cd (CAR-Cd), Fe-Mn oxide-bound Cd (OX-Cd), organic matter-bound Cd (OM-Cd), and residual Cd (RES-Cd) were obtained using the sequential extraction method by Tessier et al. [23]. The determination of the contents of different Se and Cd fractions was conducted in a manner analogous to that used for total Se and total Cd. SOL-Se and EXC-Se have high bioavailability in soil, and the sum of their contents is generally considered as the content of bioavailable Se [24]. EXC-Cd has high bioavailability and is the major fraction affecting Cd toxicity in soil, plants, and animals, and it is therefore referred to as bioavailable Cd [25]. The mobility factor of Se (or Cd) was calculated using the percentage of bioavailable Se (or Cd) to total Se (or Cd) to evaluate the mobility of Se and Cd in soil [26]. To ensure the reliability and precision of the analyses, all indicators were incorporated into blanks and analytical replicates.

2.4. Data Analysis

Microsoft Excel 2016 and SPSS 25.0 were employed for the processing of data and the performance of descriptive statistical analysis. The graphs were plotted using GraphPad Prism 9.0. ArcGIS 10.3 was employed to plot the distribution of sampling points. The Shapiro–Wilk test indicated that the majority of the continuous variables did not follow a normal distribution, so the non-parametric Kruskal–Wallis combined with the Dunn’s test was used for significance analysis. The relation between the Se and Cd fractions and the physico-chemical properties of soils was analyzed by Spearman correlation. Partial least squares path modeling (PLS-PM) was conducted using Smart PLS 3.0.

3. Results

3.1. Physico-Chemical Properties of Soils in the Study Area

As illustrated in Table 1, the overall soil pH in the study area was acidic, with a median pH of 5.76 for paddy soil, which was significantly higher than that of limestone soil and red soil. Except for pH, the SOM, AP, and DOC contents of paddy soil were found to be significantly higher than those of limestone soil and red soil. Meanwhile, the TN, AK, and silt contents of paddy soil were significantly higher than in red soil, although there was no significant difference with limestone soil. We also found that the highest contents of Fed and Ald were found in limestone soil with 45.44 g·kg−1 and 10.42 g·kg−1, respectively, and were significantly higher than in paddy soil.
The pH of the paddy field, when compared with other land use types, was found to be 5.80, which was higher than that of the dry land and garden plot. However, no marked difference was found among the three. The TN, SOM, and DOC contents of the paddy field were 0.20%, 32.21 g·kg−1, and 179.60 mg·kg−1, respectively, which were significantly higher than the other two land use types. Additionally, the paddy field exhibited the highest silt content, which was significantly different from the garden plot. The AK content from highest to lowest was found in the dry land, paddy field, and garden plot with significant differences among all three. The soil AP content was significantly higher in the paddy field and dry land than in the garden plot. However, the Fed content was highest in the garden plot and significantly different from the paddy field.

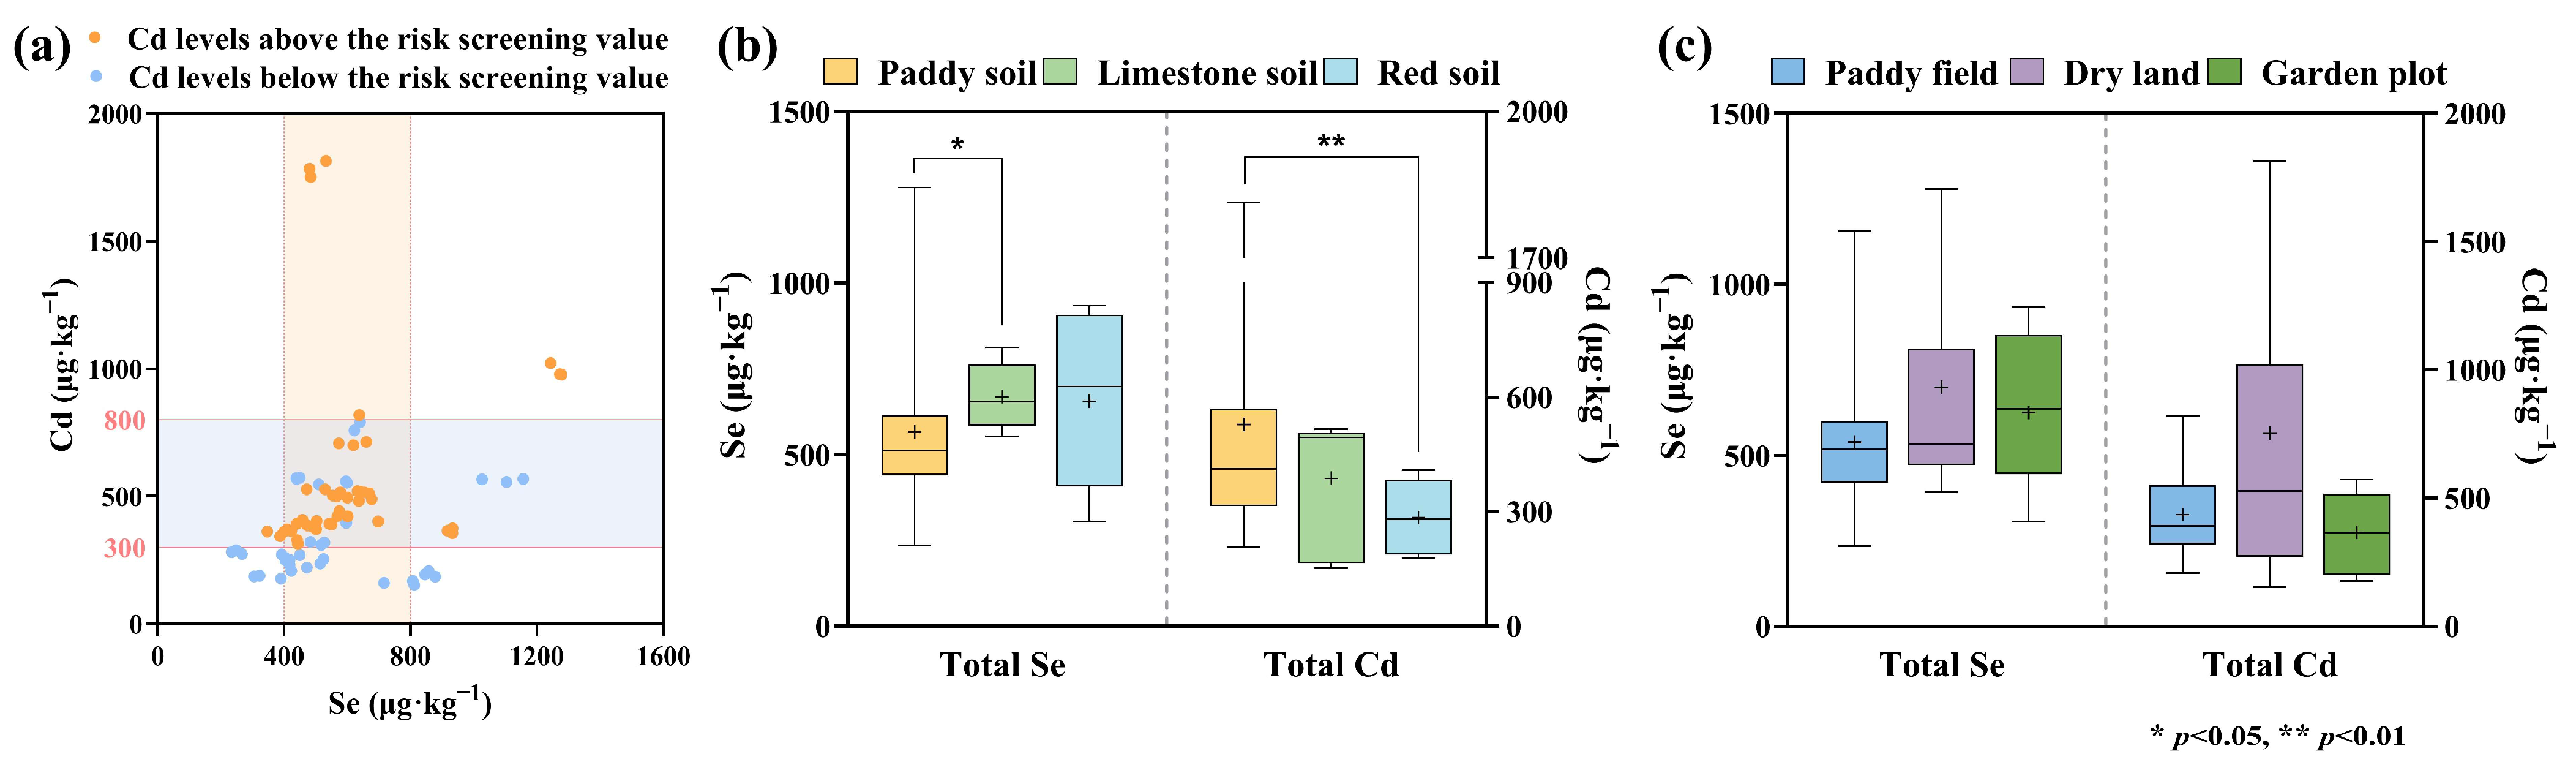
3.2. Characteristics of Total Se and Cd Distribution in the Study Area

The soil total Se and total Cd contents in the study area are shown in Figure 2. The total Se content varied between 234.69 and 1278.45 μg·kg−1, with a mean of 590.79 μg·kg−1 and a median of 532.94 μg·kg−1. According to the standard of Se-rich soil (≥400 μg·kg−1) [27], the proportion of Se-enriched soil in the study area was 88.89%, suggesting a high potential for Se-rich resource development. The soil total Cd content exhibited a range of 151.85–1813.91 μg·kg−1, with mean and median values of 476.18 μg·kg−1 and 392.25 μg·kg−1, respectively. Based on China’s Soil Environmental Quality Risk Control Standard for Soil Contamination of Agricultural Land (GB 15618-2018) [28], 54.32% of the Cd content of the collected soil samples surpassed the risk screening value. According to the delineation criteria of Huang [29], the soils in the study area with excessive Cd contamination were mainly low-contaminated soils (300–800 μg·kg−1), and a small proportion were moderately contaminated soils (800–2000 μg·kg−1) and concentrated between the range of low-Se-enriched soils with Se content of 400–800 μg·kg−1.
The comparison of the total Se or Cd contents of various soil types and land use types revealed (Figure 2b,c) that the mean values of the Se contents of different soil types ranged from 566.16 to 668.65 μg·kg−1, and the median values exhibited a range of 512.06–698.52 μg·kg−1, with paddy soil having the lowest Se content, which was significantly lower than that of limestone soil. On the contrary, the Cd content of paddy soil was relatively high, with a mean of 527.85 μg·kg−1 and a median of 412.43 μg·kg−1, which were notably higher than those observed in red soil. The total Se or Cd contents showed no significant variation across different land use types. The median values of the Se content from low to high were 517.69 μg·kg−1, 532.94 μg·kg−1, and 636.71 μg·kg−1, corresponding to the paddy field, dry land, and garden plot, respectively. Similar to the previous results, the garden plot with a higher Se content exhibited a lower Cd content than both the paddy field and the dry land content.

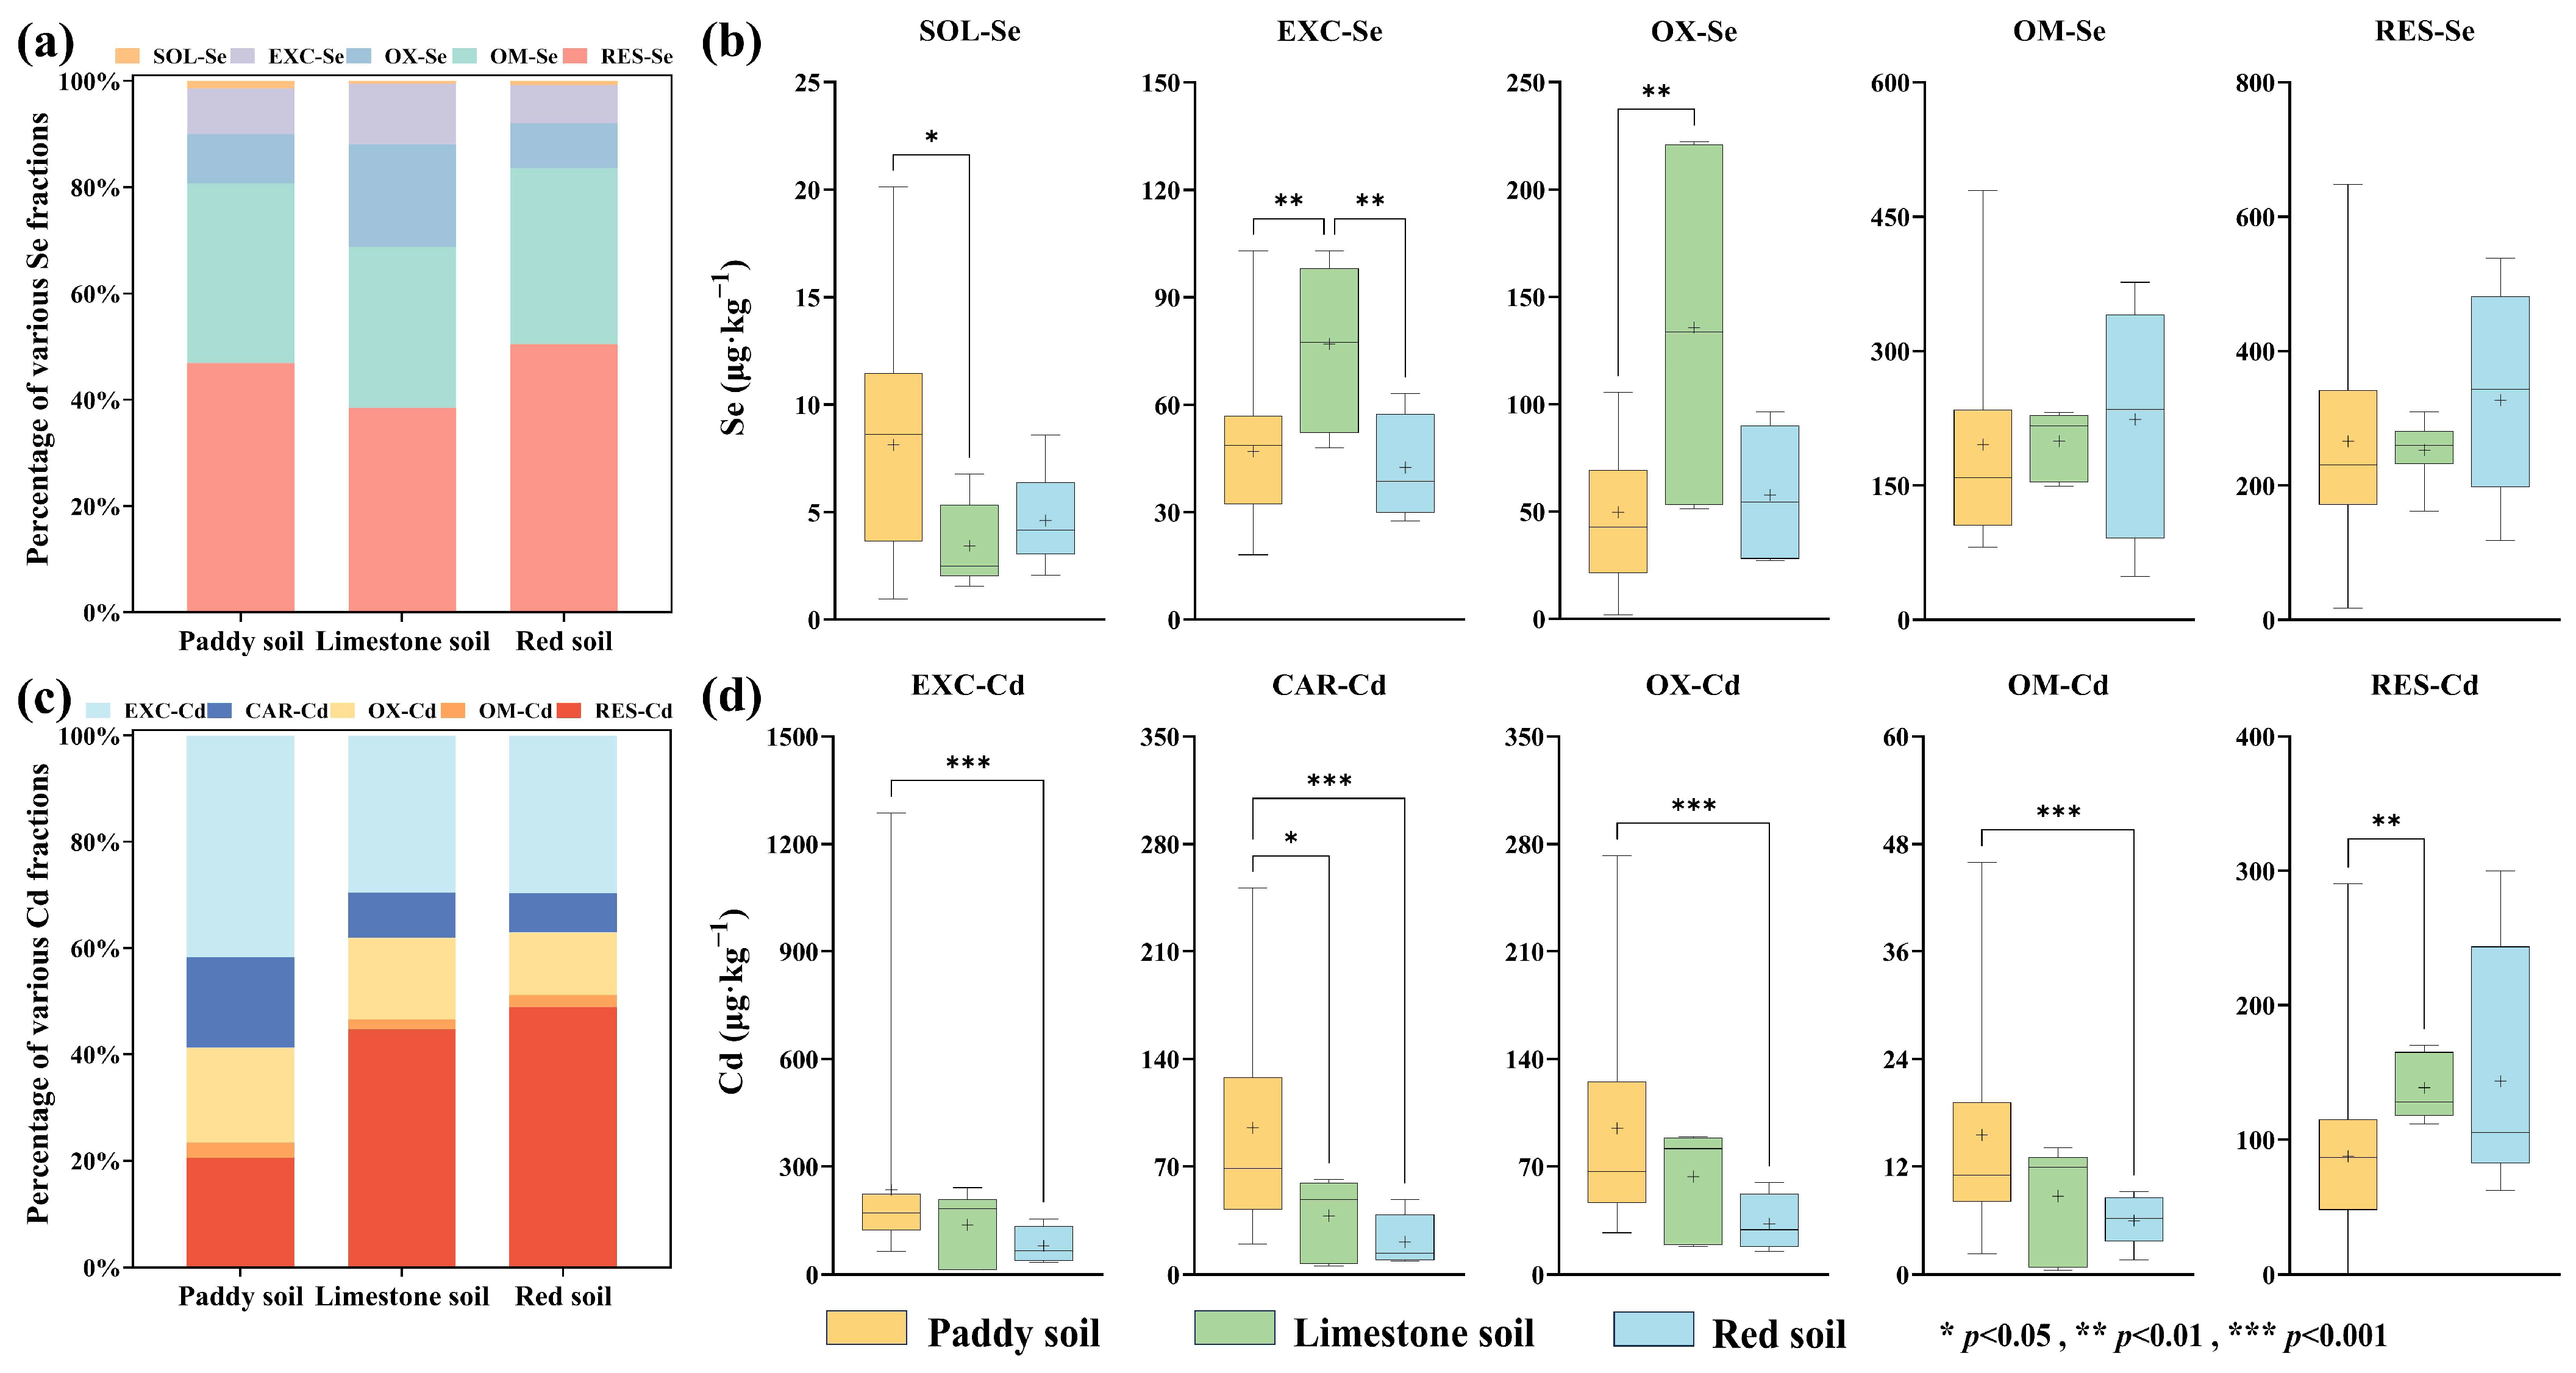
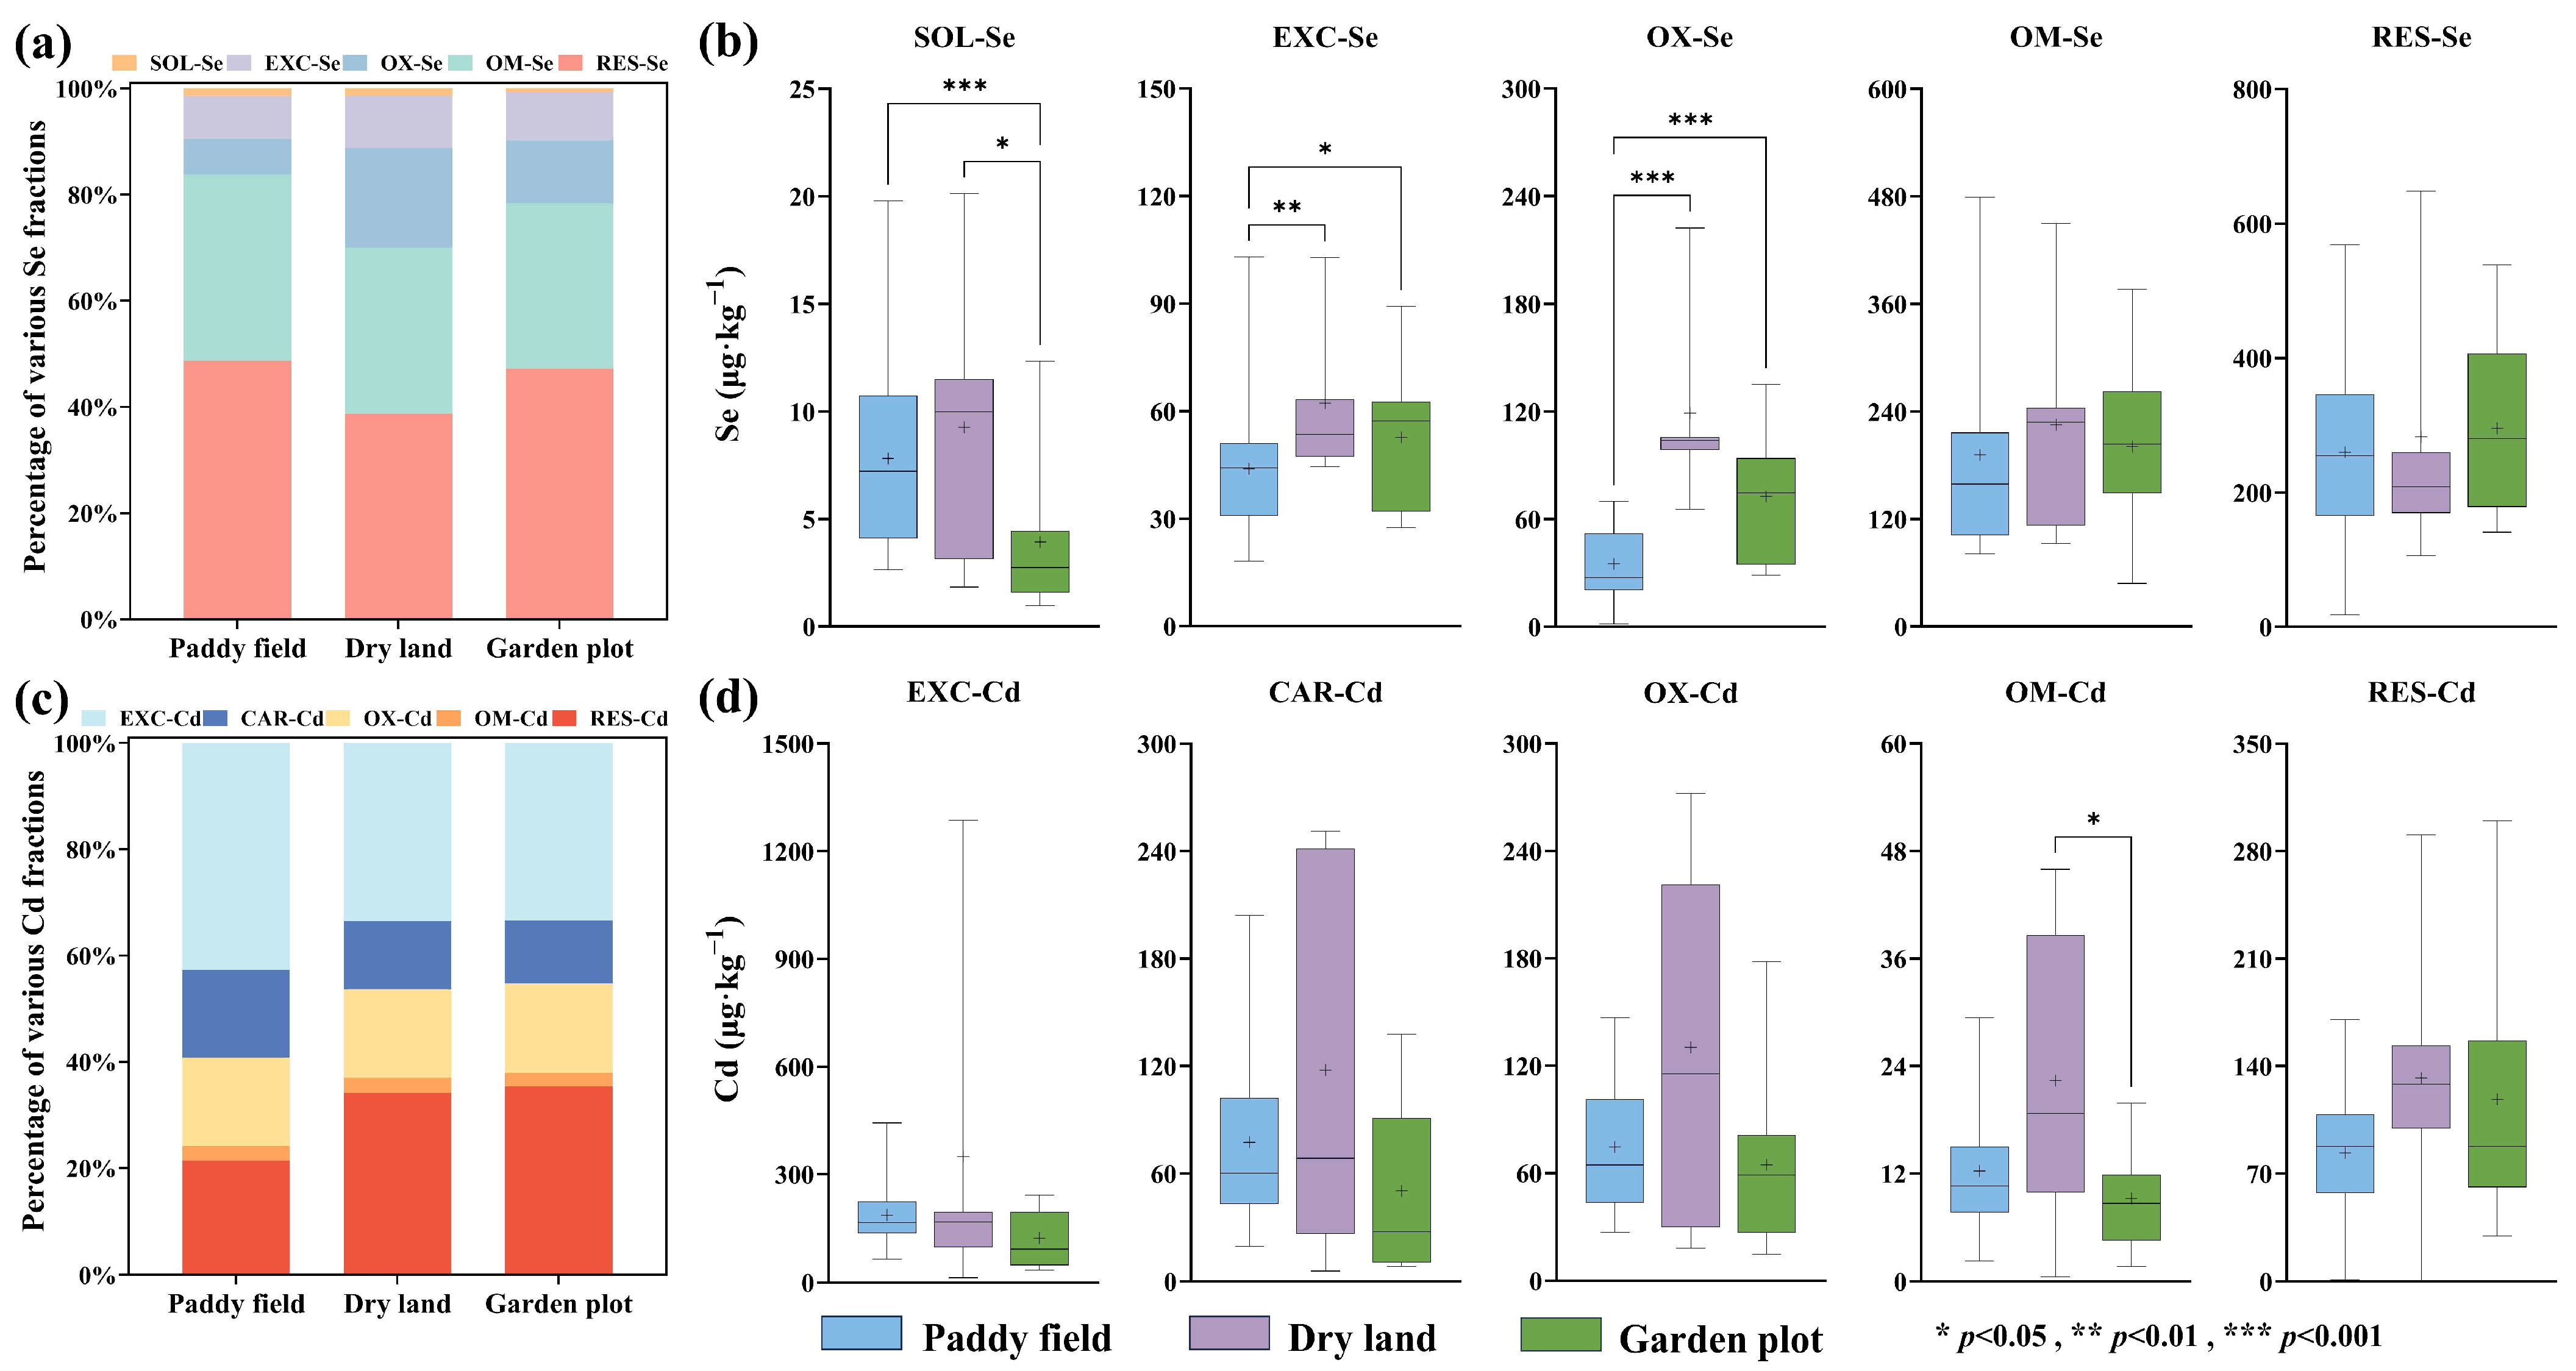
3.3. Characteristics of Distribution of Different Fractions of Se and Cd in Soils

The results demonstrated that the contents of all five fractions of Se in the three soil types of the study area were as follows: RES-Se > OM-Se > OX-Se > EXC-Se > SOL-Se (Figure 3a). The SOL-Se contents of the paddy soil, limestone soil, and red soil were only 1.44%, 0.55%, and 0.81% of the total Se content, while RES-Se, which had the highest percentage, accounted for 46.87%, 38.46%, and 50.40%, respectively. By comparing the differences in the content of each Se fraction on different soil types (Figure 3b), it was found that the SOL-Se content of paddy soil was significantly higher than that of limestone soil, whereas the OX-Se concentration was significantly lower than that of limestone soil. In addition, the EXC-Se content was highest in limestone soil with mean and median values of 77.02 μg·kg−1 and 77.42 μg·kg−1, respectively, which were significantly different from paddy soil and red soil.
Analysis of the five Cd fractions percentages across different soil types (Figure 3c) showed that RES-Cd was the highest in limestone and red soil, accounting for 44.70% and 48.83% of the total Cd content, followed by EXC-Cd with a share of 29.55% and 29.65%, respectively. The results obtained in paddy soil were in opposition to the aforementioned findings, with the highest percentage of EXC-Cd at 41.71%, followed by RES-Cd at 20.51%. Furthermore, the lowest percentage of OM-Cd was observed in all soil types, with values ranging from 1.84% to 2.35%. The results demonstrated that the contents of Cd in all fractions exhibited notable variations across different soil types (Figure 3d). The highest levels of EXC-Cd, CAR-Cd, OX-Cd, and OM-Cd were observed in paddy soil, while the lowest contents were recorded in red soil. The median values of the above four fractions of Cd content in red soil were 65.75 μg·kg−1, 14.16 μg·kg−1, 29.12 μg·kg−1, and 6.28 μg·kg−1. Finally, the content of the least bioavailable Cd (RES-Cd) was lowest in paddy soil and highest in limestone soil with median values of 86.40 μg·kg−1 and 128.11 μg·kg−1, respectively.
Overall, the percentages of the five Se fractions to the total Se content in different land use types were RES-Se, OM-Se, OX-Se, EXC-Se, and SOL-Se in descending order (Figure 4a), but EXC-Se in the paddy field accounted for a slightly higher percentage than OX-Se, with the former reaching 8.13% and the latter 6.68%. The range of RES-Se percentage means among the three land use types was 38.72–48.67% for the highest percentage and 0.74–1.43% for the lowest percentage of SOL-Se. A comparison of the content of the different Se fractions revealed that the median value of SOL-Se content in the garden plot was 2.75 μg·kg−1, which was notably lower than the paddy field and dry land (Figure 4b). The median levels of EXC-Se and OX-Se in the paddy field were 44.15 μg·kg−1 and 27.35 μg·kg−1, individually, which were both statistically obviously lower than those observed in the dry land and garden plot. Notably, no marked differences were found in OM-Se and RES-Se, irrespective of soil type or land use type. The higher proportion of RES-Se and OM-Se in total Se content was indicative of the generally lower bioavailability of Se in the study area.
The contents of EXC-Cd and RES-Cd accounted for a larger percentage of total Cd in different land use types (Figure 4c). In the dry land and garden plot, there was little difference between the contents of EXC-Cd and RES-Cd as a percentage of total Cd. In the paddy field, the contents of EXC-Cd and RES-Cd were 42.68% and 21.43%, respectively, and the percentage of total Cd accounted for by EXC-Cd was about twice as high as that of RES-Cd. Similarly, it was also the OM-Cd content that accounted for the lowest percentage among the three land use types, with a range of 2.60–2.79%. The content of OM-Cd was the highest in dry land (Figure 4d), with mean and median values of 22.36 μg·kg−1 and 18.72 μg·kg−1, individually, which statistically significantly exceeded the OM-Cd concentration in the garden plot. Apart from this, the contents of the other four Cd fractions did not differ significantly in the different land use types of soils.

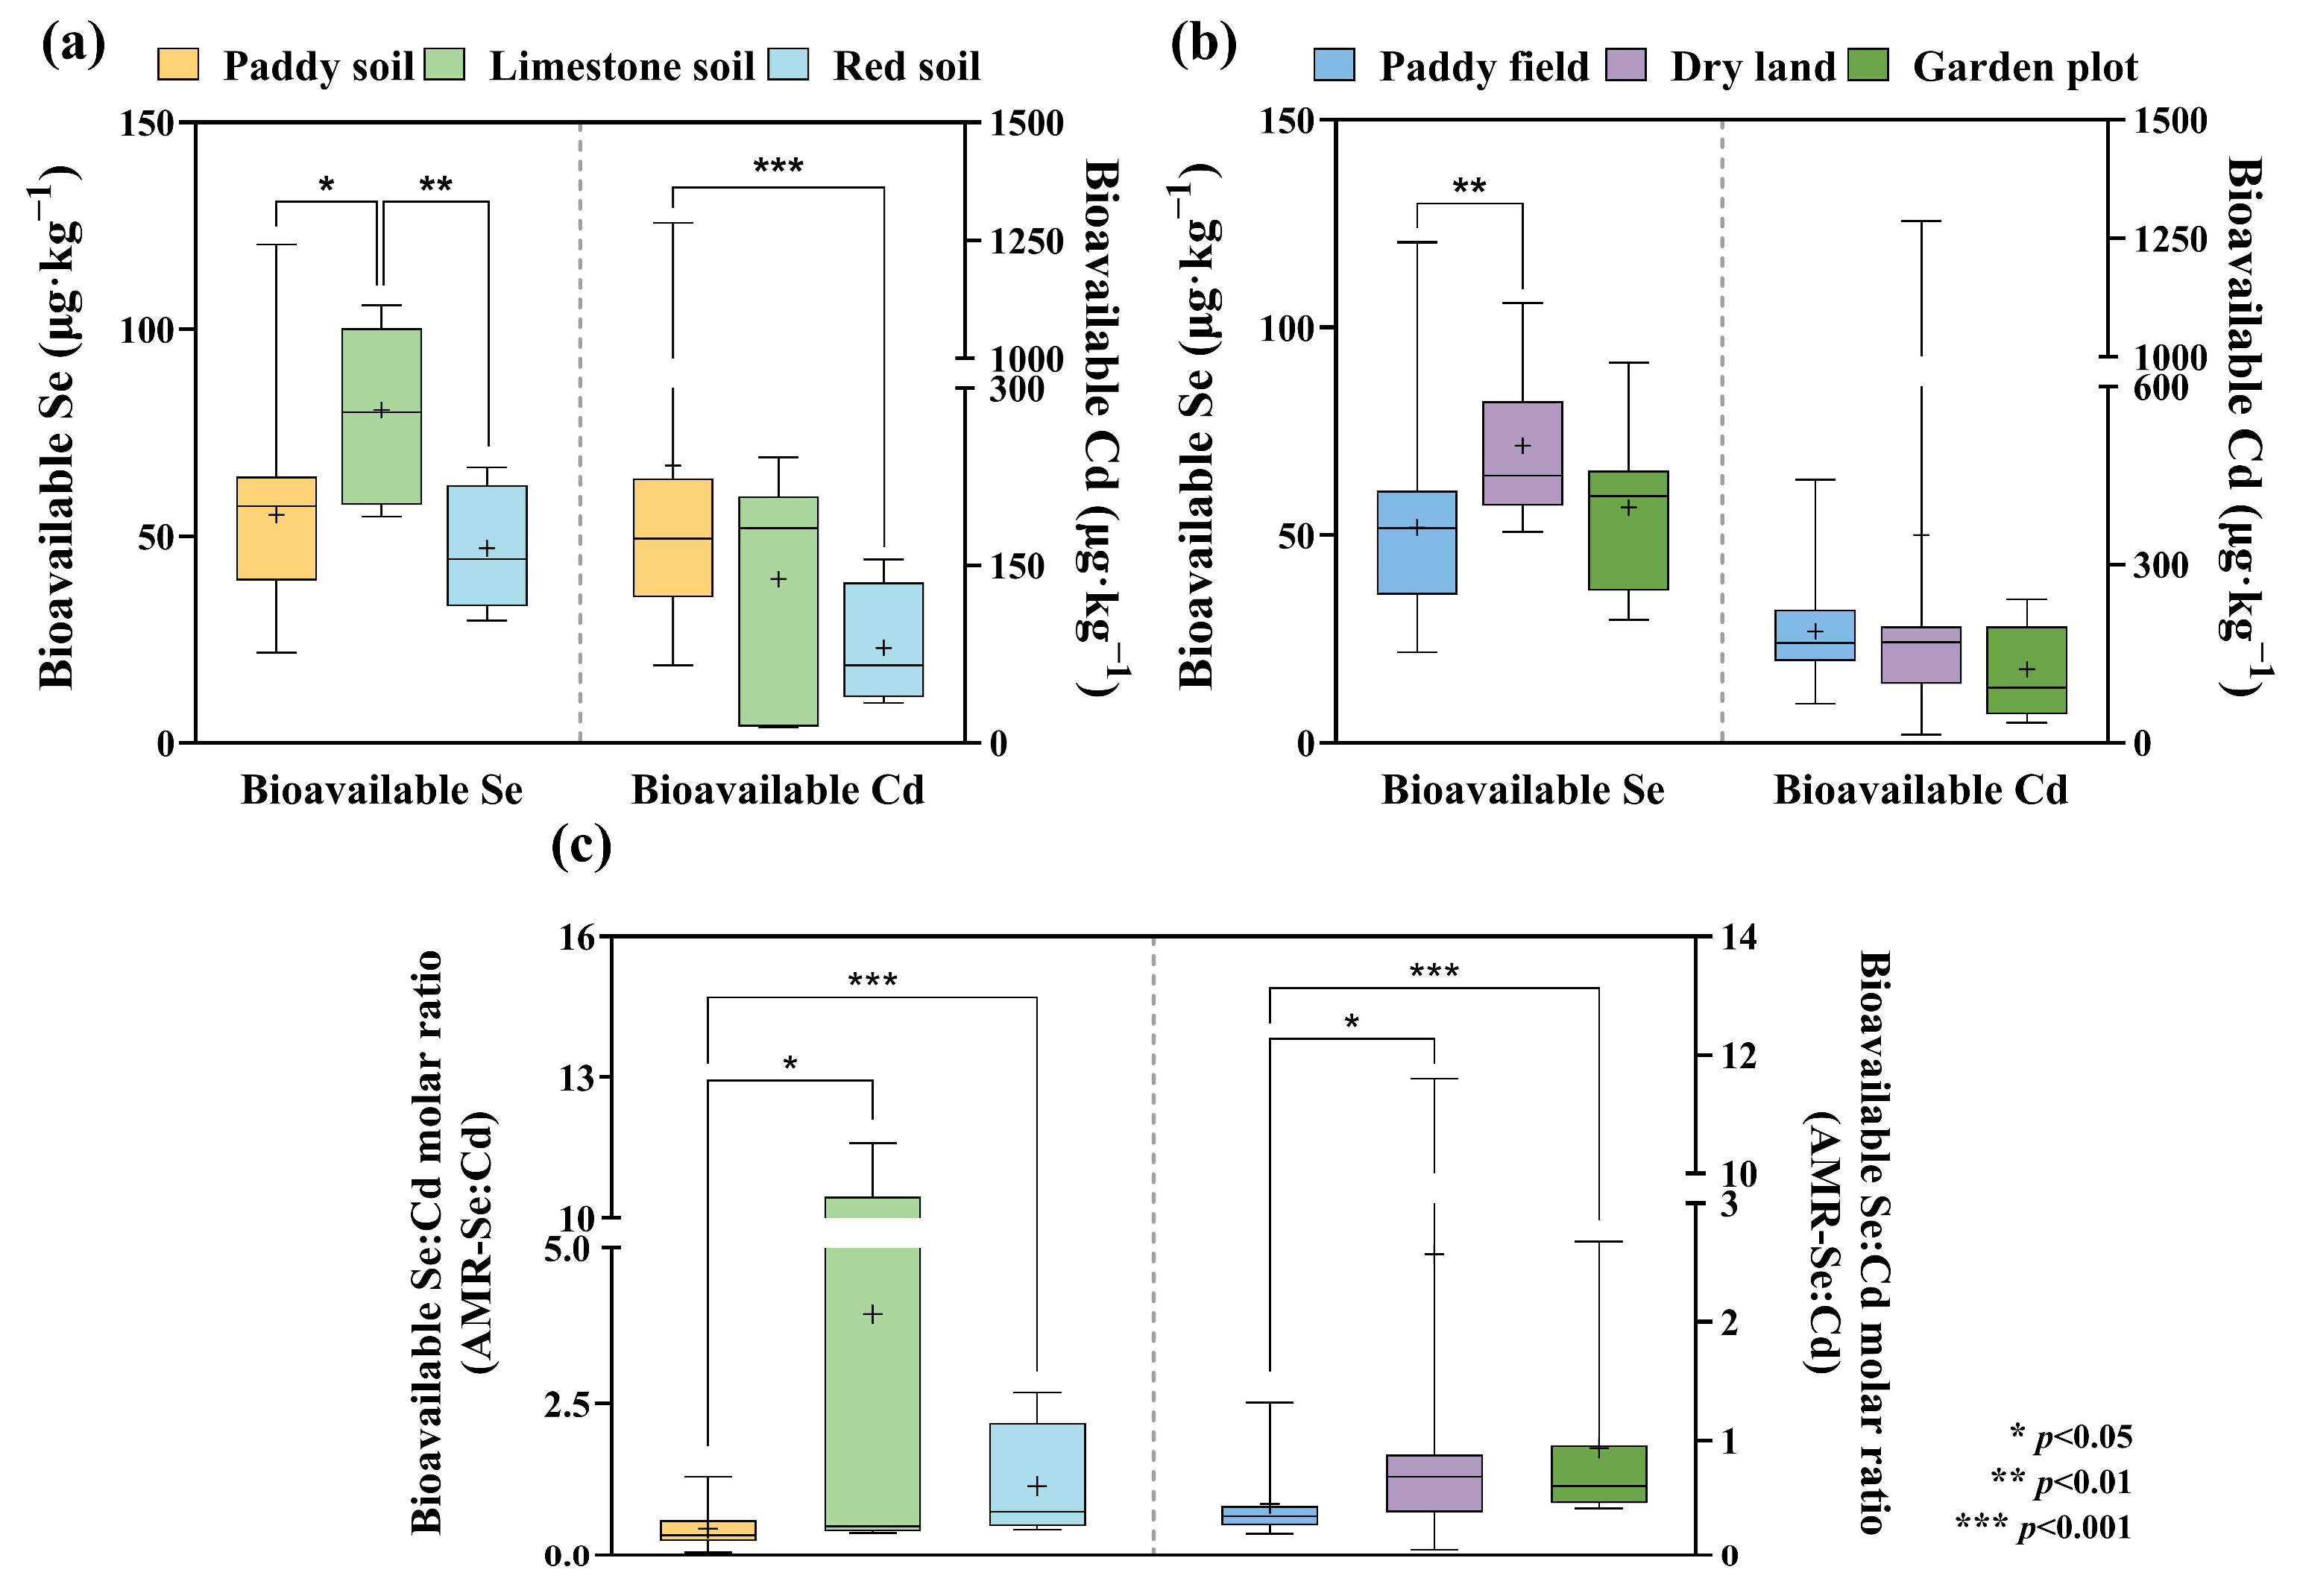
3.4. Characteristics of the Distribution of Bioavailable Se, Cd, and AMR-Se:Cd in Soils

Among the different soil types in the research region, the highest concentration of bioavailable Se was found in limestone soil with mean and median values of 80.45 μg·kg−1 and 79.92 μg·kg−1, individually, which were significantly higher than those of paddy soil and red soil (Figure 5a). Meanwhile, the red soil, which had the lowest bioavailable Se content, also demonstrated a lower bioavailable Cd content than paddy soil and limestone soil, with mean and median bioavailable Cd values of 80.55 μg·kg−1 and 65.75 μg·kg−1, respectively, and differed significantly from that of paddy soil in terms of bioavailable Cd content. As illustrated in Figure 3a,c, the bioavailable Se content as a percentage of the total Se content (mobility factor of Se) was also slightly lower in red soil at 7.96%. Paddy soil exhibited the highest bioavailable Cd percentage (mobility factor of Cd) at 41.71%, compared with 29.55% in limestone soil and 29.65% in red soil.
Among the different land use types (Figure 5b), the bioavailable Se content was from high to low in the dry land, garden plot, and paddy field and was significantly higher in the dry land than in the paddy field. The bioavailable Cd content was still highest in the dry land, with mean and median values of 349.86 μg·kg−1 and 168.81 μg·kg−1, respectively. However, no significant difference was found in the bioavailable Cd content among the three land use types. The analysis of the bioavailable Se and bioavailable Cd content as a percentage of the total revealed that the mean values of the bioavailable Se percentage (mobility factor of Se) ranged from 9.56% to 11.24%, which was higher in dry land. The mean values of the bioavailable Cd percentage (mobility factor of Cd) ranged from 33.42% to 42.68%, with the highest levels observed in the paddy field (Figure 4a,c).
In consideration of the interaction between Se and Cd in soil, the soil AMR-Se:Cd is frequently employed as an indicator of Cd plant availability. The AMR-Se:Cd in the study area exhibited a range of 0.06 to 11.60 (Figure 5c), with a mean of 0.98 and a median of 0.43. Soil AMR-Se:Cd was found to be the lowest in paddy soil, recording average and median values of 0.49 and 0.38, respectively. These values differed significantly from those observed in limestone soil and red soil. Among the different land use types, the mean and median values of the AMR-Se:Cd were 0.47 and 0.36 for the paddy field, which were significantly lower than those for dry land and the garden plot. The median value for dry land, which exhibited the highest ratio, was 0.69, which was approximately twice the value observed for the paddy field.

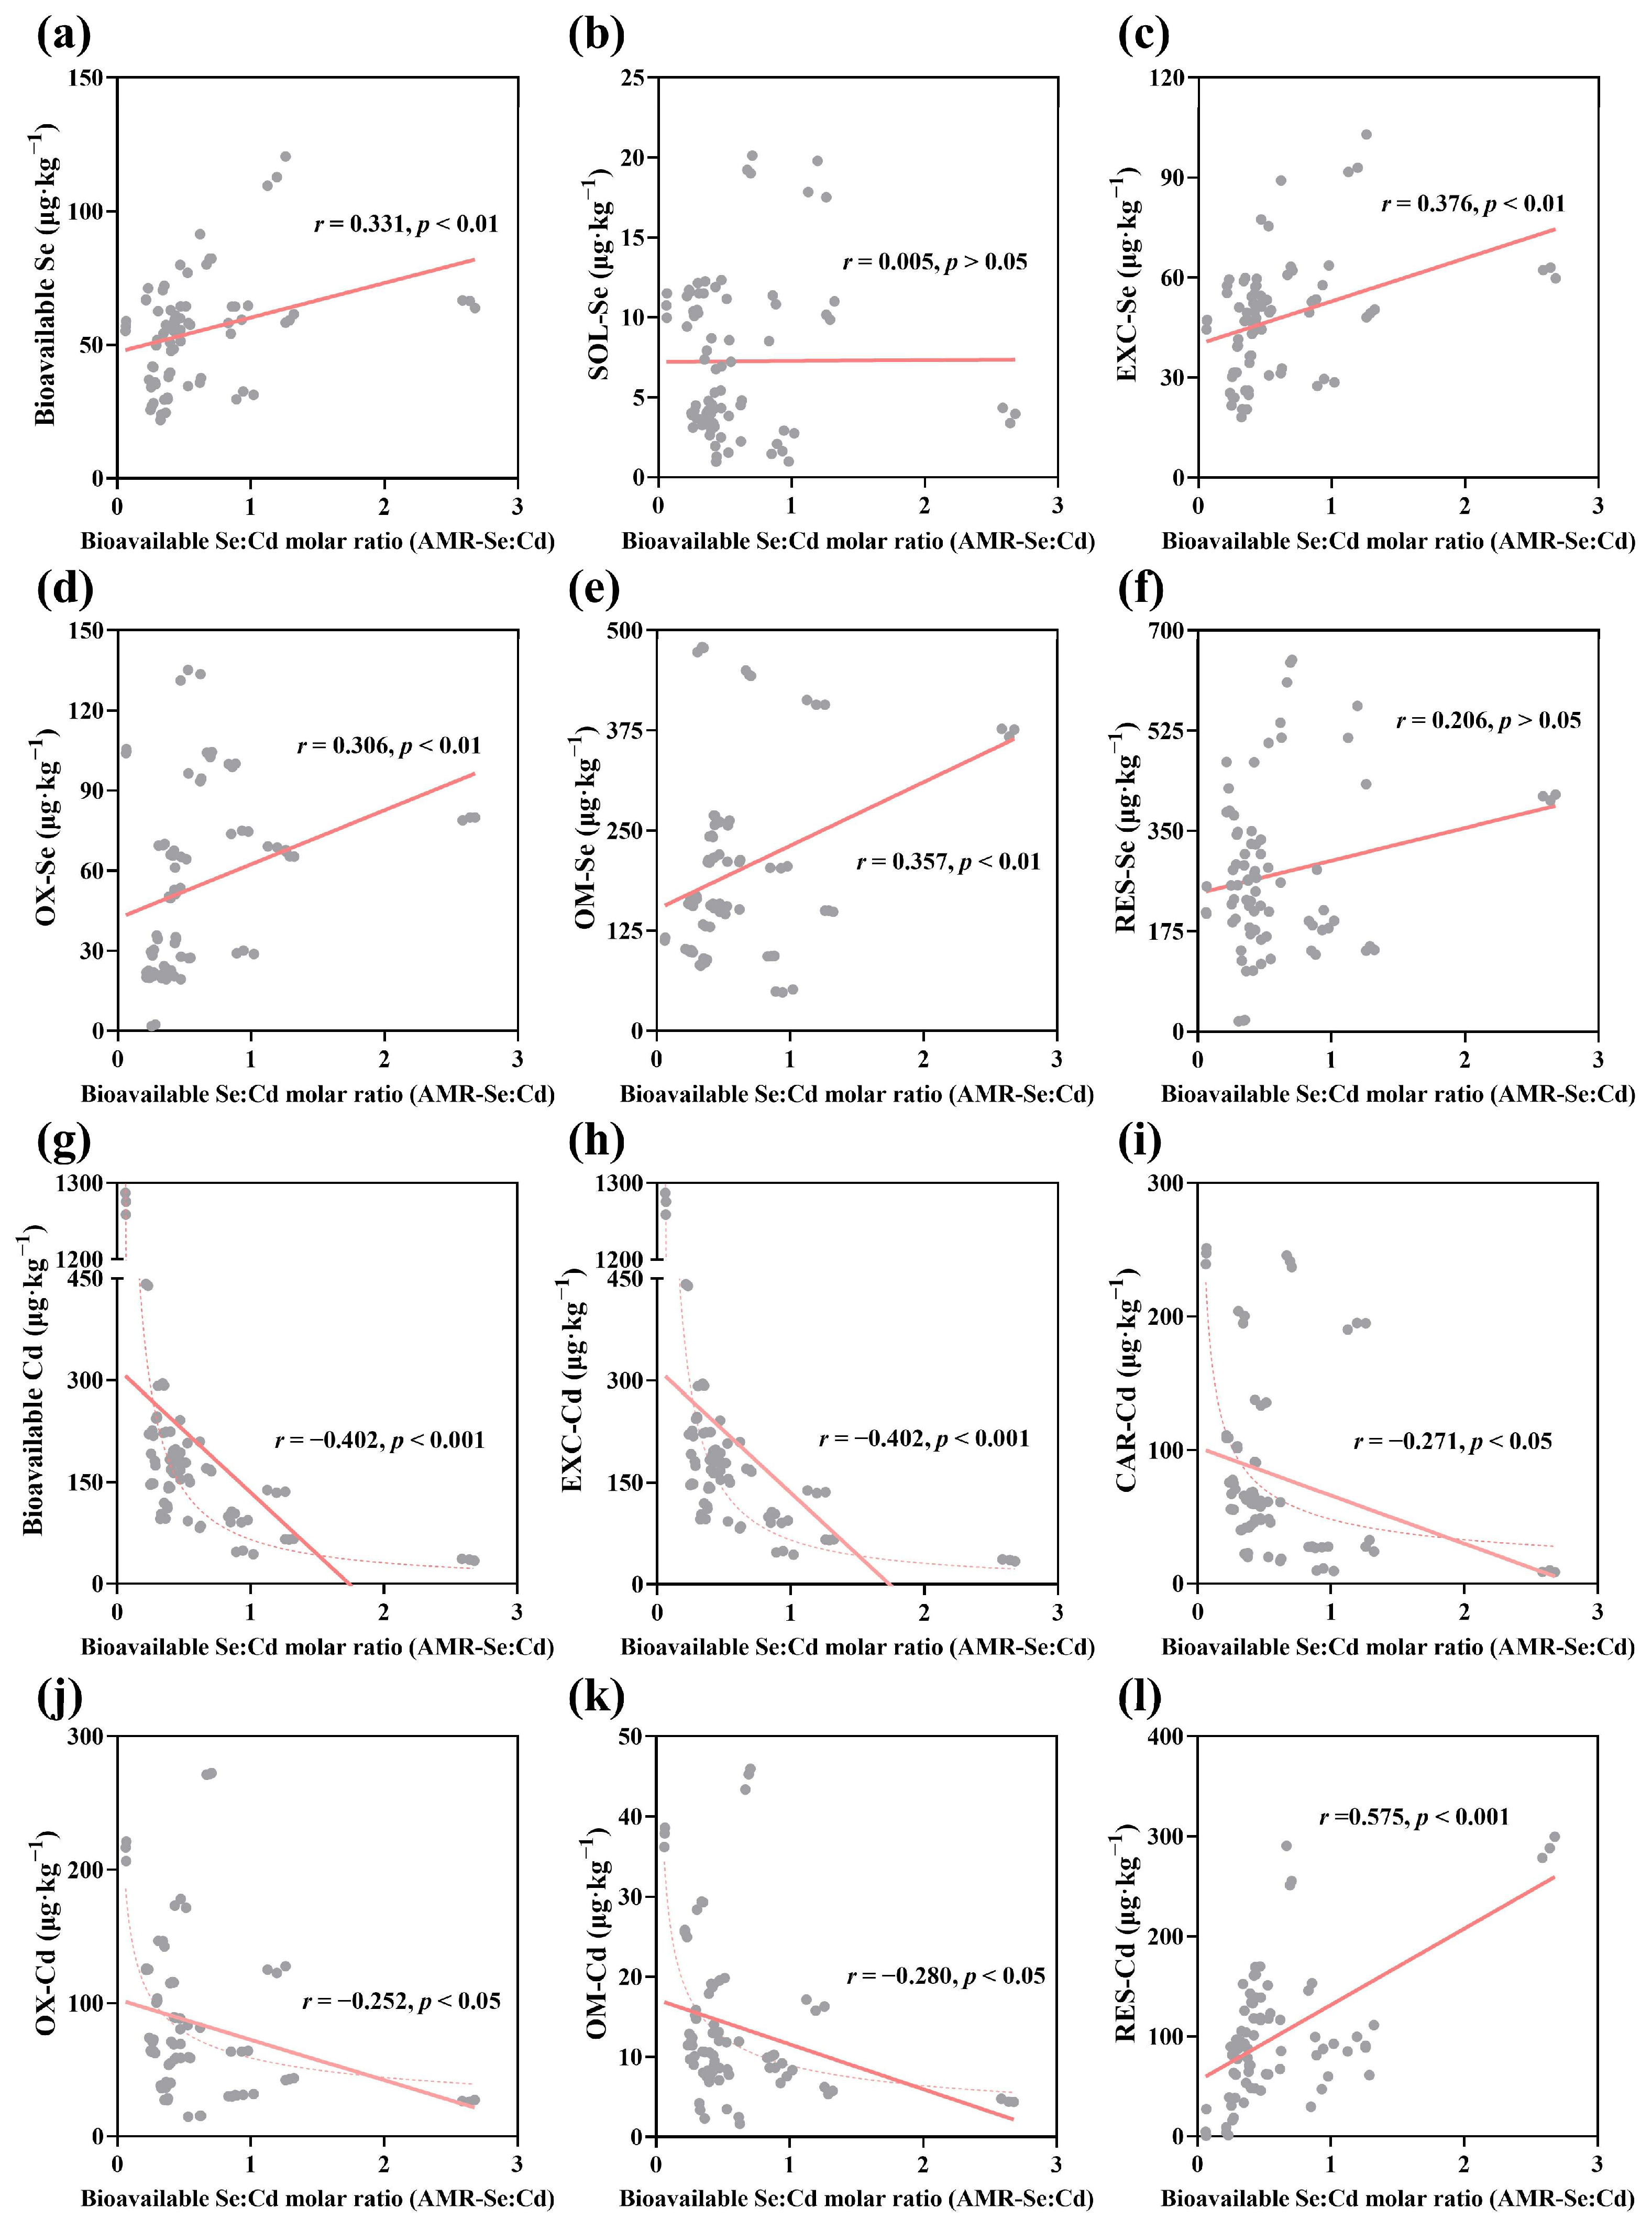
3.5. Relationship Between Soil AMR-Se:Cd and the Distribution of Se and Cd Fractions

Regression analysis was used to examine the relationship between the soil AMR-Se:Cd ratio and the concentrations of bioavailable Se and Cd, as well as various fractions of Se and Cd (Figure 6). The fitted regression curves demonstrated a statistically positive correlation between the soil AMR-Se:Cd and the bioavailable Se concentration (r = 0.331, p < 0.01) and a significant negative correlation with the bioavailable Cd content (r = −0.402, p < 0.001) (Figure 6a,g). Further analyses revealed that the AMR-Se:Cd was significantly and positively correlated with the three Se fraction concentrations, EXC-Se (r = 0.376, p < 0.01), OX-Se (r = 0.306, p < 0.01), and OM-Se (r = 0.357, p < 0.01) (Figure 6c–e), but there was no significant relationship with the contents of SOL-Se and RES-Se (p > 0.05) (Figure 6b,f). In addition, the AMR-Se:Cd was negatively correlated (p < 0.05) with the remaining four Cd fractions (Figure 6h–k), except for a significant positive correlation with the RES-Cd content (r = 0.575, p < 0.001) (Figure 6l).
Using the relationship between the soil AMR-Se:Cd and the percentage of bioavailable Se or Cd to analyze the correlation pattern between the AMR-Se:Cd and the Se and Cd fraction transformation, we found that there was a significant negative correlation between the AMR-Se:Cd and the percentage of bioavailable Cd (mobility factor of Cd) (r = −0.731, p < 0.001) (Figure 7g). A significant negative correlation was observed between the AMR-Se:Cd and the percentage of bioavailable Se (mobility factor of Se) when the AMR-Se:Cd exceeded 1 (r = −0.744, p < 0.05), but a slight positive trend was shown when the AMR-Se:Cd was less than 1 (r = 0.188, p > 0.05) (Figure 7a). When the AMR-Se:Cd ratio was increased to 1, the Se mobility factor reached 12.31%, while the Cd mobility factor decreased from a higher value to 23.49%.
Further analysis of the relation between the soil AMR-Se:Cd and the percentages of different Se and Cd fractions indicated that with a threshold value of 1, the percentages of EXC-Se, OX-Cd, and OM-Cd all showed a trend of first increasing and then decreasing as the AMR-Se:Cd increased (Figure 7c,j,k). On one hand, none of the percentages of the other Se fractions were significantly related to the AMR-Se:Cd (p > 0.05) (Figure 7b–f). On the other hand, exploring the relationship between soil AMR-Se:Cd and the percentages of various Cd fractions revealed significant correlations for all of them. The AMR-Se:Cd was negatively correlated with the percentage of CAR-Cd (r = −0.291, p < 0.05) (Figure 7i), similar to the pattern observed in the relationship with the percentage of EXC-Cd (bioavailable Cd) (Figure 7g,h). Finally, the AMR-Se:Cd was found to be significantly and positively correlated with the RES-Cd percentage (r = 0.754, p < 0.001) (Figure 7l).

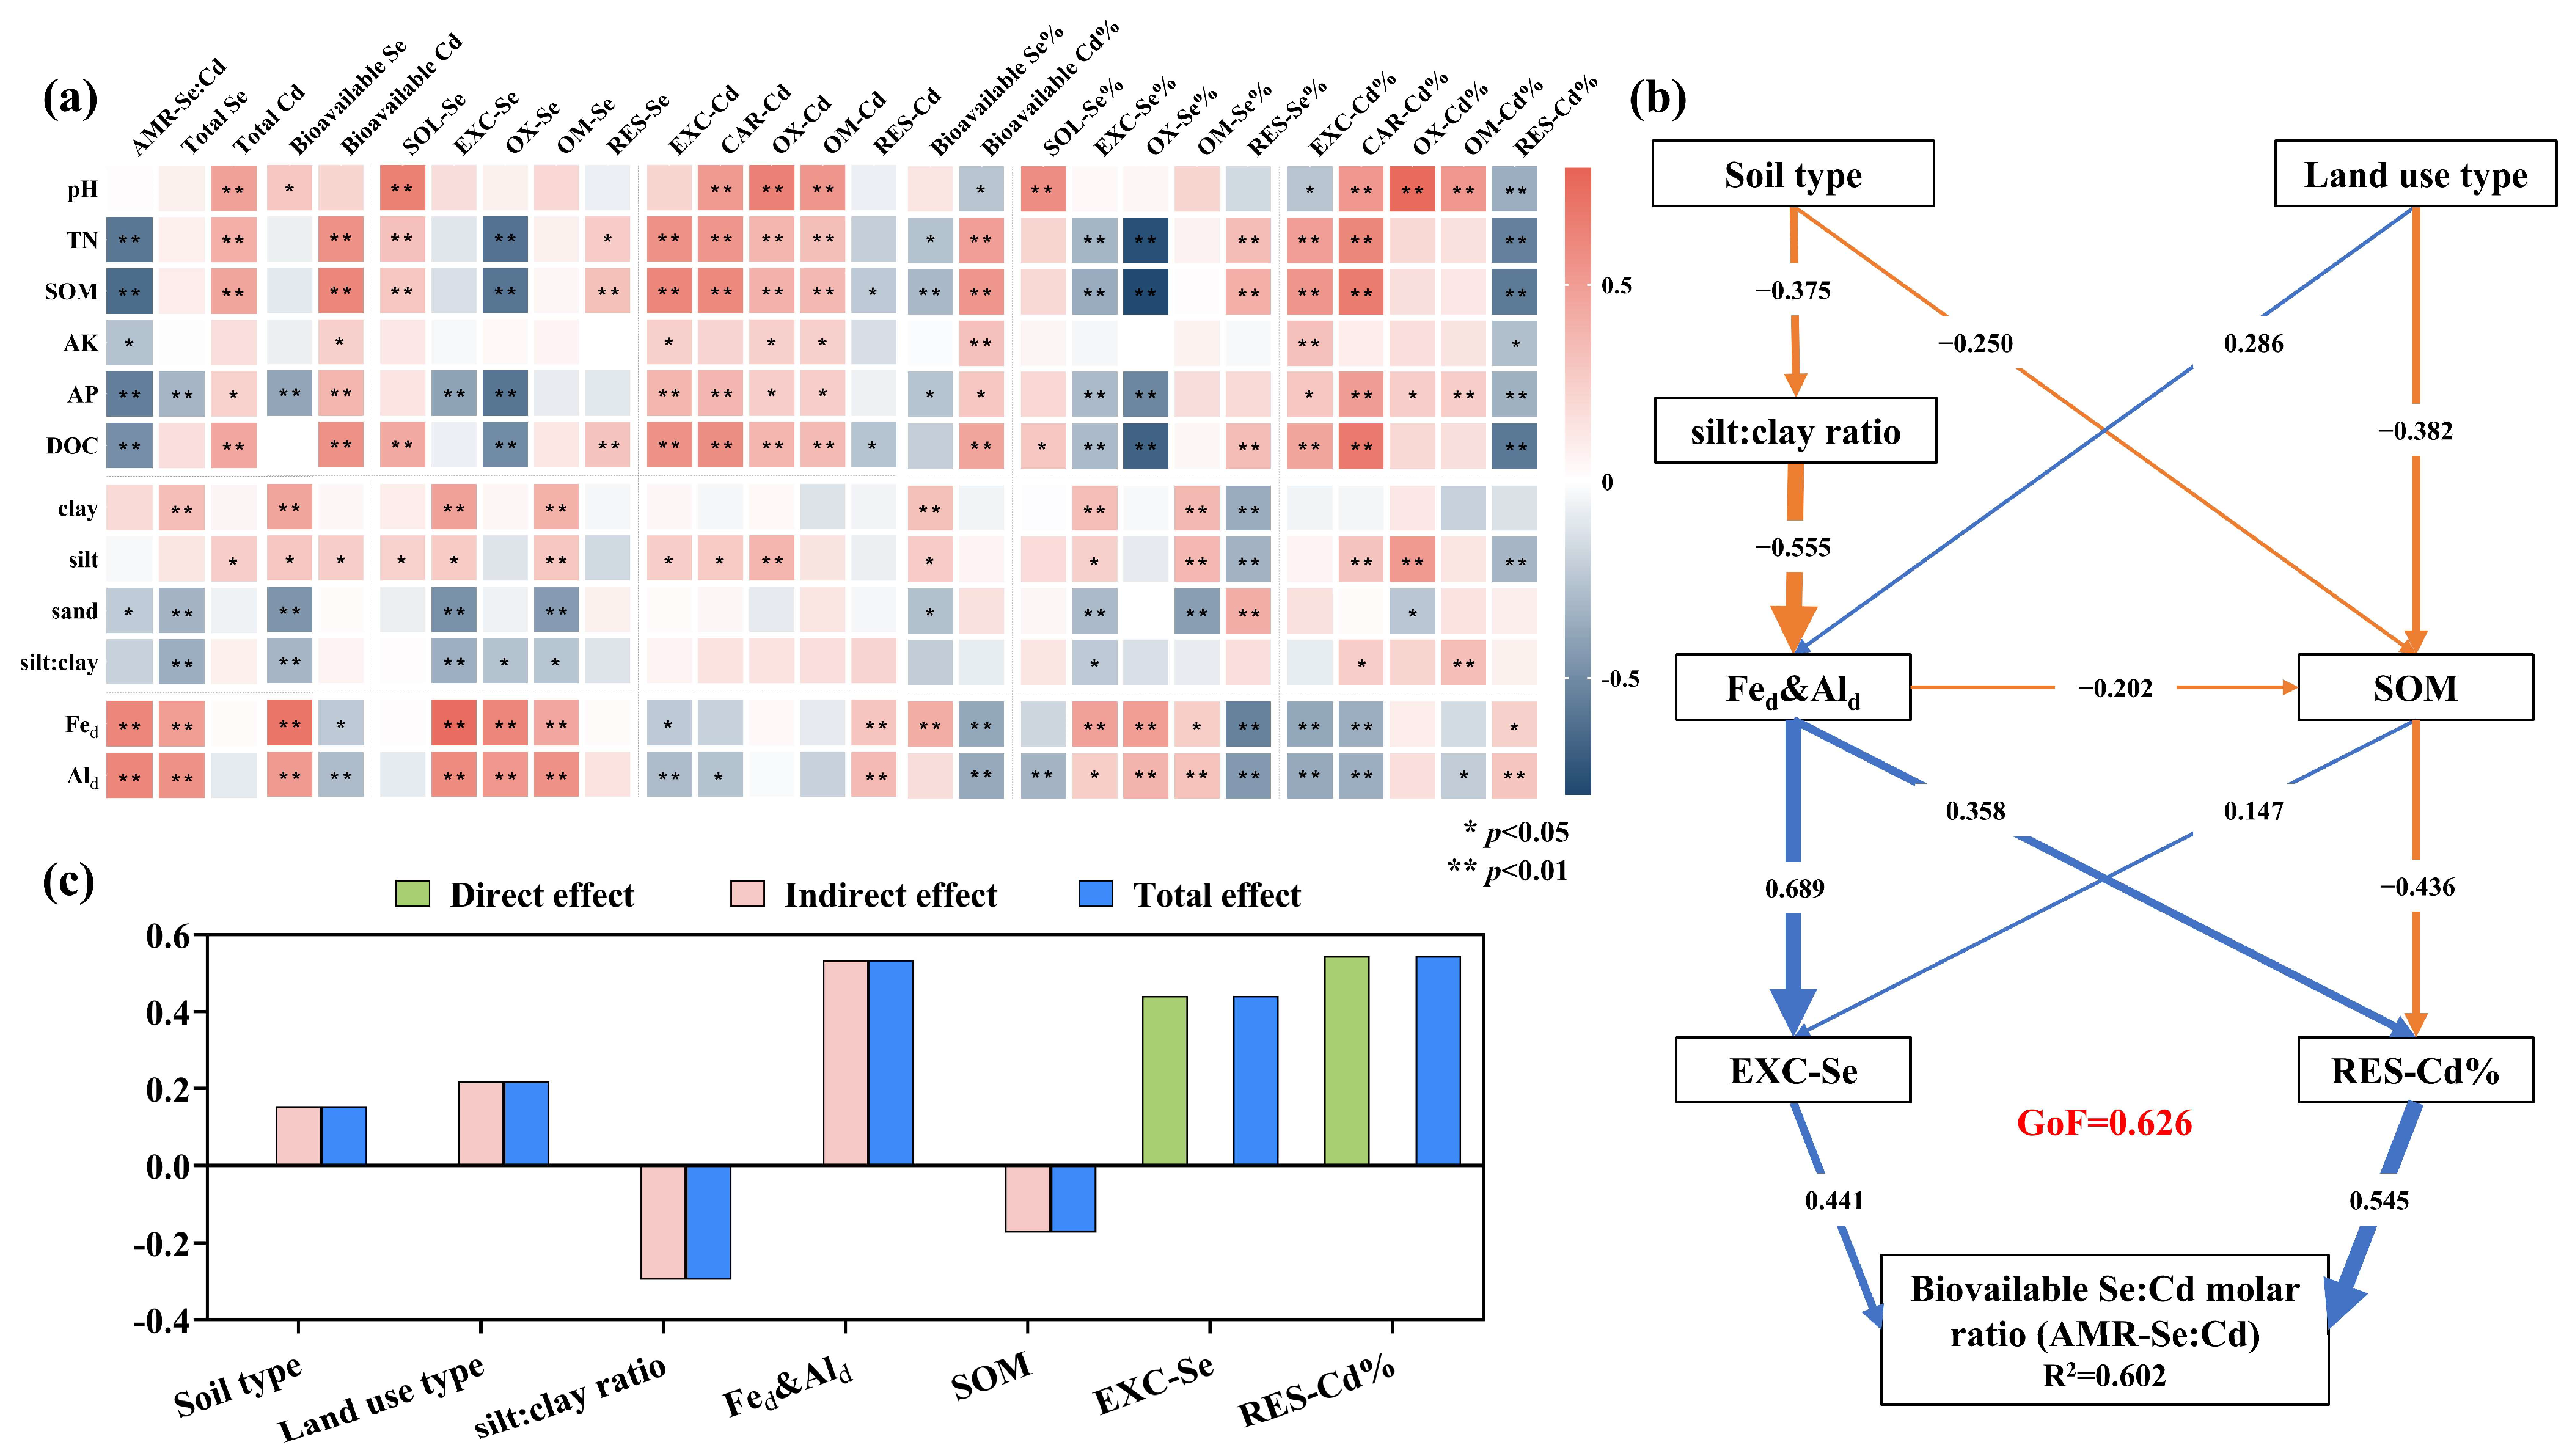
3.6. Influencing Factors of the Soil AMR-Se:Cd

To explore the key factors affecting the soil AMR-Se:Cd, soil physico-chemical properties were correlated with various Se and Cd (Figure 8a). The findings revealed that Se was significantly correlated with soil physical properties (sand, silt, clay, and silt–clay ratio), Fed and Ald, and some nutrient indicators (TN, SOM, and DOC), whereas Cd was statistically correlated with soil nutrient indicators (pH, TN, SOM, DOC, AK, and AP) and Fed and Ald. This highlights the varying impacts of soil physico-chemical properties on Se and Cd.
PLS-PM was further constructed to confirm the effects of soil physico-chemical properties on the soil AMR-Se:Cd under different soil types and land use types (Figure 8b). The path analysis explained 60.2% of the variation in the AMR-Se:Cd. The EXC-Se content and RES-Cd percentage had a direct positive influence on the AMR-Se:Cd, with path coefficients of 0.441 and 0.545, respectively. Fed, Ald, and SOM were able to significantly affect the EXC-Se content and the RES-Cd percentage. The total effect demonstrated that soil type, land use type, Fed and Ald, EXC-Se, and RES-Cd% exerted a positive influence on the AMR-Se:Cd, with effect values of 0.154, 0.219, 0.534, 0.441, and 0.545, respectively (Figure 8c). The silt–clay ratio and SOM had a negative influence on the AMR-Se:Cd with effect values of −0.296 and −0.173. Alterations in the contents of Fed, Ald, and SOM, which are influenced by different soil types and land use types, regulate the distribution of Se and Cd fractions, thereby altering the AMR-Se:Cd of Se-rich soils.

4. Discussion

4.1. Effects of Different Soil Types and Land Use Types on the Distribution of Se and Cd

Overall, the soil type determines soil properties such as the contents of soil texture, Fe-Al oxides, SOM, and pH, which in turn determine Se and Cd distribution characteristics [30]. This study revealed differences in the total Se content among different soil types, particularly in paddy soil and limestone soil (Figure 2b). The soil formation process in paddy soil is influenced by both anthropogenic activities and natural factors, and prolonged flooding for rice cultivation strongly alters soil properties, thereby masking the original characteristics of the soil [31]. Limestone soil had higher Fed and Ald contents and lower pH (Table 1). In acidic soils, SeO32− dominates among Se species and is readily adsorbed by Fe-Al oxides [30,32]. So, limestone soil retained a higher total Se content (Figure 2b). The soil pH affects the migration of Se, primarily regulating the adsorption/desorption and precipitation/dissolution processes [33,34]. However, the effect of pH on Se is complex, and no significant relationship between pH and total Se content was found in this study (Figure 8a) [35]. Limestone soil possessed the highest bioavailable Se content because it had the highest EXC-Se content, with EXC-Se accounting for a much higher percentage of total Se than SOL-Se (Figure 3a,b and Figure 5a). Previous studies have also shown that EXC-Se is the primary source of bioavailable Se [3]. The significant negative correlation between AP and bioavailable Se in this study may be due to competition between PO43− and SeO32− for adsorption sites in the soil, which resulted in lower bioavailable Se content in paddy soil (Figure 5a and Figure 8a) [36]. The total Cd content in paddy soil was significantly higher than in red soil across different soil types, which may be closely related to pH (Figure 2a and Figure 8a). We observed a positive correlation between soil pH and total Cd. An increase in pH reduced Cd solubility while also increasing the number of adsorption sites for Cd on the surface of organic matter [37]. Therefore, a significant positive correlation between the total Cd and the composition of soil organic matter (e.g., TN, SOM, and DOC) was also observed (Figure 8a). In addition, paddy soil had the highest bioavailable Cd content and bioavailable Cd percentage, reflecting the higher risk of Cd contamination in paddy soil (Figure 3c and Figure 5a). The lowest content of Fe-Al oxides was found in paddy soil, which would be unfavorable for the immobilization of Cd (Table 1) [26].
Different land use types can also modify soil physico-chemical properties, leading to substantial variations in soil Se or Cd contents [38]. The effects of different land use types on Se were more pronounced in this study area. We found that the total Se content was lower in paddy fields, which were more affected by human agricultural activities, and prolonged inundation and plowing could lead to Se loss (Figure 2b) [39]. There were also significant differences in the contents of different Se fractions, with the garden plot having the lowest SOL-Se content, likely related to its lower pH (Figure 4b and Figure 8a). Lyu et al. found a significant positive correlation between SOL-Se and pH in soil [3]. When the soil pH decreased, more Se was adsorbed onto the soil solid phase, contributing to the conversion of SOL-Se to a less bioavailable form [33]. In addition, both EXC-Se and OX-Se contents were lowest in the paddy field (Figure 4b). On one hand, the soil environment with alternating dry and wet cycles promoted the activation of Se in the paddy field; on the other hand, this also increased the risk of Se leaching, as both EXC-Se and OX-Se were fractions of Se that were susceptible to leaching [40].

4.2. Relationship Between Soil AMR-Se:Cd and Se and Cd Transformation

Current studies have shown that the addition of exogenous Se to soil can alter its physical and chemical properties, improve nutrient cycling, reduce heavy metal toxicity, and mitigate the adverse effects of heavy metals on plants [41]. In our study, we observed that that as the soil AMR-Se:Cd increased, the content of both the bioavailable Cd (EXC-Cd) and the potentially bioavailable Cd (CAR-Cd, OX-Cd, and OM-Cd) showed a decreasing trend, while the RES-Cd content showed an increasing trend (Figure 6g–l). These patterns demonstrated the antagonistic effect of Se on Cd. In addition to binding with Cd to form complexes, Se can weaken the activity of Cd in soil through the charge-shielding effect between ions. Furthermore, Se can enter microorganisms and induce the formation of Cd–(GS)2 complexes [41,42]. We also observed that the content of both bioavailable Se and potentially bioavailable Se (OX-Se and OM-Se) tended to increase with increasing soil AMR-Se:Cd (Figure 6a,d,e). The findings of the research suggested that an increase in the soil AMR-Se:Cd was conducive to reducing bioavailable Cd and promoted an increase in bioavailable Se.
To better understand the effects of Se and Cd interactions on the transformation of Se and Cd fractions in soil, we focused on the relationship between the AMR-Se:Cd and the percentage of different Se or Cd fractions in total Se or Cd. The bioavailable Cd percentage decreased with increasing AMR-Se:Cd (Figure 7g), which was in agreement with the findings of Zhang et al. [11]. Se can directly influence the variation of Cd levels in the soil and reduce the bioavailable Cd content, thereby inhibiting Cd transport [43,44]. Similar trends were observed in the relationship between the AMR-Se:Cd and the CAR-Cd percentage and the AMR-Se:Cd and the EXC-Cd percentage (Figure 7h,i), and an opposite trend was observed in the relationship between the AMR-Se:Cd and the RES-Cd percentage (Figure 7l). Therefore, we can assume that the AMR-Se:Cd was closely related to the transformation of various Cd fractions. Interestingly, when the AMR-Se:Cd was below 1, the AMR-Se:Cd showed a slight positive trend with the bioavailable Se percentage. However, when the AMR-Se:Cd exceeded 1, the percentage of bioavailable Se decreased as the AMR-Se:Cd increased (Figure 7a). Thus, a suitable AMR-Se:Cd facilitated both a high Se mobility and a low Cd mobility. Similar patterns, as described above, occurred in the relationships between the AMR-Se:Cd and both OX-Cd and OM-Cd percentages (Figure 7j,k). This result reflected the dynamic process of changes in Cd fractions. Previous studies have found that Se additions favored the transformation of soil Cd into less bioavailable forms, resulting in a higher RES-Cd percentage [45,46]. Notably, the Se and Cd content ratio affected the acquisition and internal transfer of Cd by the crop, and the addition of Se served to facilitate the plant’s absorption of Cd if and when the Cd level was too high [47,48]. When the soil AMR-Se:Cd was low, CdSeO30 and CdSeO40 formed by the reaction between Se and Cd, which readily entered the root system. As the AMR-Se:Cd increased, soil Se reacted with Cd to form Cd–Se complexes with a 1:1 molar ratio, which were not bioavailable to the plant [11,12]. Therefore, an increase in the AMR-Se:Cd promoted the transformation of Cd from highly bioavailable fractions to less bioavailable fractions. Meanwhile, when the AMR-Se:Cd ratio was near 1, the morphological transformation trend of Cd underwent a significant change, which resulted from interactions between Se and Cd.

4.3. Effects of Soil Properties on the AMR-Se:Cd

The previous discussion showed that both soil type and land use type can lead to dynamic changes in Se and Cd fractions by influencing soil physico-chemical properties. Path modeling indicated that Fed, Ald, and SOM directly influenced the distribution of soil Se and Cd fractions, thereby altering the AMR-Se:Cd of the Se-rich soils (Figure 8b).
SOM contains a substantial number of functional groups that are capable of reacting with ions and interacting with Se and Cd through a multitude of mechanisms, largely due to the diverse composition of SOM. For instance, the FA-bound Se or Cd is readily released into the soil environment, whereas the HA-bound Se or Cd exhibits relatively greater stability. These mechanisms have the potential to influence the fixation or release of Se and Cd from the soil [49,50,51]. The present study revealed considerable variation in the percentages of OM-Se and OM-Cd to the total, with a mean value of 33.35% for OM-Se% and a mean value of only 2.69% for OM-Cd% (Figure 3a,c and Figure 4a,c). This discrepancy may be attributed to the differing capacities of SOM to immobilize Se and Cd. At low soil pH and low SOM levels, Cd is more readily recharged into the soil solution than Se [12]. The strong desilification under the hot and humid climatic conditions in the southern subtropical region results in the formation of soil that is rich in free Fe-Al oxides. The large specific surface area, rich pore structure, numerous active sites, and charge-carrying properties of Fed and Ald result in their adsorption properties for Se and Cd [30,52]. Concurrently, both SOM and Fe-Al oxides are capable of immobilizing ions, with SOM exhibiting greater stability through covalent bonding to heavy metals. In contrast, Fe-Al oxides demonstrate a reduced capacity for binding to heavy metals through adsorption [53]. The results of the study demonstrated lower OX-Se% than OM-Se% and higher OX-Cd% than OM-Cd% (Figure 3a,c and Figure 4a,c). These findings reflected the differences in Se and Cd fixation by Fed, Ald, and SOM. Therefore, the distribution of soil Se and Cd fractions and the AMR-Se:Cd can be regulated by changing the Fed, Ald, and SOM contents.

5. Conclusions

Soil type and land use type influence the distribution of Se and Cd in naturally Se-rich soils. Both soil type and land use type affected the composition of Se and the content of AMR-Se:Cd, while the composition of Cd was predominantly influenced by soil type. The soil AMR-Se:Cd was strongly linked to the transformation of Se and Cd. An increase in the AMR-Se:Cd was conducive to enhancing the bioavailability of Se and reducing that of Cd. Concurrently, the molar ratio increase promoted the transformation of Cd from highly bioavailable fractions to less bioavailable fractions. A suitable AMR-Se:Cd was conducive to achieving a higher mobility of Se and a lower mobility of Cd simultaneously. The soil type and land use type modulated the morphological transformation of soil Se and Cd by influencing changes in the Fed, Ald, and SOM content, which in turn altered the AMR-Se:Cd. Specifically, the rational selection of fertilization patterns in agricultural production, the increased application of Fe, and the raising of pH in acidic soils are all viable measures. Therefore, The findings of this study can offer guidance for regulating the appropriate AMR-Se:Cd in Se-rich soils through management practices to enhance the bioavailability and mobility of soil Se while diminishing the bioavailability and mobility of Cd. In the future, more attention could be given to the compositions of SOM and Fe-Al oxides in the soil as this would better explain their moderating effect on Se and Cd.

Author Contributions

Z.T., data curation, formal analysis, investigation, writing—original draft, and writing—review and editing; Q.R., conceptualization, data curation, funding acquisition, investigation, methodology, and writing—review and editing; W.W., validation, software, and writing—review and editing; H.J., methodology and resources; L.Y., methodology and resources; J.H., methodology and resources; J.C., conceptualization, methodology, and writing—review and editing; X.L., validation, software, and writing—review and editing; X.Z., validation, supervision, and writing—review and editing; C.Z., validation, supervision, and writing—review and editing. All authors have read and agreed to the published version of the manuscript.

Funding

This research was supported by the National Natural Science Foundation of China (No. 32060728), the Special Key Grant Project of Technology Research and Development of Jiangxi Province (“Take-and-lead” Program) (No. 20223BBF61016 and No. 20213AAF02026), and the Project of Jiangxi Selenium-Rich Agricultural Research Institute (No. JXFX21-ZD06).

Data Availability Statement

The original contributions presented in this study are included in the article. Further inquiries can be directed to the corresponding authors.

Conflicts of Interest

The authors declare that they have no known competing financial interests or personal relationships that could have appeared to influence the work reported in this paper.

References

  1. Dinh, Q.T.; Cui, Z.; Huang, J.; Tran, T.A.T.; Wang, D.; Yang, W.; Zhou, F.; Wang, M.; Yu, D.; Liang, D. Selenium Distribution in the Chinese Environment and Its Relationship with Human Health: A Review. Environ. Int. 2018, 112, 294–309. [Google Scholar] [CrossRef] [PubMed]
  2. Yang, H.; Yang, X.; Ning, Z.; Kwon, S.Y.; Li, M.-L.; Tack, F.M.G.; Kwon, E.E.; Rinklebe, J.; Yin, R. The Beneficial and Hazardous Effects of Selenium on the Health of the Soil-Plant-Human System: An Overview. J. Hazard. Mater. 2022, 422, 126876. [Google Scholar] [CrossRef] [PubMed]
  3. Lyu, C.; Qin, Y.; Zhao, Z.; Liu, X. Characteristics of Selenium Enrichment and Assessment of Selenium Bioavailability Using the Diffusive Gradients in Thin-Films Technique in Seleniferous Soils in Enshi, Central China. Environ. Pollut. 2021, 273, 116507. [Google Scholar] [CrossRef] [PubMed]
  4. Wang, M.; Cui, Z.; Xue, M.; Peng, Q.; Zhou, F.; Wang, D.; Dinh, Q.T.; Liu, Y.; Liang, D. Assessing the Uptake of Selenium from Naturally Enriched Soils by Maize (Zea mays L.) Using Diffusive Gradients in Thin-Films Technique (DGT) and Traditional Extractions. Sci. Total Environ. 2019, 689, 1–9. [Google Scholar] [CrossRef]
  5. Sun, C.; Rong, Q.; Guo, X.; Guo, J.; Chen, Y.; Chang, Y.; Chen, J.; Zhang, Q.; Zhou, C.; Cai, H.; et al. Land-Use Types Regulate Se:Cd Ratios of Natural Seleniferous Soil Derived from Different Parent Materials in Subtropical Hilly Areas. Forests 2023, 14, 656. [Google Scholar] [CrossRef]
  6. Du, Y.; Luo, K.; Ni, R.; Hussain, R. Selenium and Hazardous Elements Distribution in Plant–Soil–Water System and Human Health Risk Assessment of Lower Cambrian, Southern Shaanxi, China. Environ. Geochem. Health 2018, 40, 2049–2069. [Google Scholar] [CrossRef]
  7. Yang, R.; He, Y.; Luo, L.; Zhu, M.; Zan, S.; Guo, F.; Wang, B.; Yang, B. The Interaction between Selenium and Cadmium in the Soil-Rice-Human Continuum in an Area with High Geological Background of Selenium and Cadmium. Ecotoxicol. Environ. Saf. 2021, 222, 112516. [Google Scholar] [CrossRef]
  8. Yuan, Z.; Cai, S.; Yan, C.; Rao, S.; Cheng, S.; Xu, F.; Liu, X. Research Progress on the Physiological Mechanism by Which Selenium Alleviates Heavy Metal Stress in Plants: A Review. Agronomy 2024, 14, 1787. [Google Scholar] [CrossRef]
  9. Guo, Y.; Mao, K.; Cao, H.; Ali, W.; Lei, D.; Teng, D.; Chang, C.; Yang, X.; Yang, Q.; Niazi, N.K.; et al. Exogenous Selenium (Cadmium) Inhibits the Absorption and Transportation of Cadmium (Selenium) in Rice. Environ. Pollut. 2021, 268, 115829. [Google Scholar] [CrossRef]
  10. Wu, J.; Li, R.; Lu, Y.; Bai, Z. Sustainable Management of Cadmium-Contaminated Soils as Affected by Exogenous Application of Nutrients: A Review. J. Environ. Manag. 2021, 295, 113081. [Google Scholar] [CrossRef]
  11. Zhang, Z.; Yuan, L.; Qi, S.; Yin, X. The Threshold Effect between the Soil Bioavailable Molar Se:Cd Ratio and the Accumulation of Cd in Corn (Zea mays L.) from Natural Se-Cd Rich Soils. Sci. Total Environ. 2019, 688, 1228–1235. [Google Scholar] [CrossRef] [PubMed]
  12. Zhang, C.; Guan, D.-X.; Jiang, Y.-F.; Menezes-Blackburn, D.; Yu, T.; Yang, Z.; Ma, L.Q. Insight into the Availability and Desorption Kinetics of Se and Cd in Naturally-Rich Soils Using Diffusive Gradients in Thin-Films Technique. J. Hazard. Mater. 2024, 465, 133330. [Google Scholar] [CrossRef] [PubMed]
  13. Xiao, K.; Tang, J.; Chen, H.; Li, D.; Liu, Y. Impact of Land Use/Land Cover Change on the Topsoil Selenium Concentration and Its Potential Bioavailability in a Karst Area of Southwest China. Sci. Total Environ. 2020, 708, 135201. [Google Scholar] [CrossRef] [PubMed]
  14. Eger, A.; Koele, N.; Caspari, T.; Poggio, M.; Kumar, K.; Burge, O.R. Quantifying the Importance of Soil-Forming Factors Using Multivariate Soil Data at Landscape Scale. J. Geophys. Res. Earth Surf. 2021, 126, e2021JF006198. [Google Scholar] [CrossRef]
  15. Ma, Y.; Zhang, N.; Li, Y.; Zhao, H.; Zhou, F.; Xue, M.; Lyu, L.; Yang, J.; Man, Y.B.; Wu, F.; et al. Differences in Selenium Concentration and Bioavailability between Paddy and Dryland Soils of China: A Study Based on Literature Collection and Field Sampling. J. Hazard. Mater. 2023, 445, 130467. [Google Scholar] [CrossRef]
  16. Xu, Y.; Li, Y.; Li, H.; Wang, L.; Liao, X.; Wang, J.; Kong, C. Effects of Topography and Soil Properties on Soil Selenium Distribution and Bioavailability (Phosphate Extraction): A Case Study in Yongjia County, China. Sci. Total Environ. 2018, 633, 240–248. [Google Scholar] [CrossRef]
  17. Jiang, F.; Wu, Y.; Islam, M.; Jiang, X.; Wang, B.; He, S.; Lin, X.; Sun, Y.; Chen, G.; Chen, X.; et al. Selenium Levels in Soil and Tea as Affected by Soil Properties in Jiangxi Province, China. BMC Plant Biol. 2024, 24, 1130. [Google Scholar] [CrossRef]
  18. Tan, J.; Zhu, W.; Wang, W.; Li, R.; Hou, S.; Wang, D.; Yang, L. Selenium in Soil and Endemic Diseases in China. Sci. Total Environ. 2002, 284, 227–235. [Google Scholar] [CrossRef]
  19. GB/T 17296-2009; Classification and Codes for Chinese Soil. General Administration of Quality Supervision, Inspection and Quarantine of China, and Standardization Administration of China: Beijing, China, 2009; pp. 2–112.
  20. Lu, R.-K. Soil and Agro-Chemistry Analytical Methods; Agriculture Science and Technology Press of China: Beijing, China, 1999. [Google Scholar]
  21. Meng, Q.; Diao, T.; Yan, L.; Sun, Y. Effects of Single and Combined Contamination of Microplastics and Cadmium on Soil Organic Carbon and Microbial Community Structural: A Comparison with Different Types of Soil. Appl. Soil Ecol. 2023, 183, 104763. [Google Scholar] [CrossRef]
  22. Liu, X.; Zhao, Z.; Duan, B.; Hu, C.; Zhao, X.; Guo, Z. Effect of Applied Sulphur on the Uptake by Wheat of Selenium Applied as Selenite. Plant Soil 2015, 386, 35–45. [Google Scholar] [CrossRef]
  23. Tessier, A.; Campbell, P.G.C.; Bisson, M. Sequential Extraction Procedure for the Speciation of Particulate Trace Metals. Anal. Chem. 1979, 51, 844–851. [Google Scholar] [CrossRef]
  24. Lyu, C.; Chen, J.; Li, L.; Zhao, Z.; Liu, X. Characteristics of Se in Water-Soil-Plant System and Threshold of Soil Se in Seleniferous Areas in Enshi, China. Sci. Total Environ. 2022, 827, 154372. [Google Scholar] [CrossRef] [PubMed]
  25. Lyu, C.; Qin, Y.; Chen, T.; Zhao, Z.; Liu, X. Microbial Induced Carbonate Precipitation Contributes to the Fates of Cd and Se in Cd-Contaminated Seleniferous Soils. J. Hazard. Mater. 2022, 423, 126977. [Google Scholar] [CrossRef] [PubMed]
  26. Huang, Q.; Di, X.; Liu, Z.; Zhao, L.; Liang, X.; Sun, Y.; Qin, X.; Xu, Y. Mercapto-Palygorskite Efficiently Immobilizes Cadmium in Alkaline Soil and Reduces Its Accumulation in Wheat Plants: A Field Study. Ecotoxicol. Environ. Saf. 2023, 266, 115559. [Google Scholar] [CrossRef] [PubMed]
  27. Han, Z.; Li, Y.; Zhao, R.; Yang, Y.; Cai, Y.; Lu, H. Co-Enrichment of Selenium and Cadmium in Soils of Southern China and Its Implication for the Safe Utilisation of Selenium-Rich Lands. J. Geochem. Explor. 2024, 262, 107487. [Google Scholar] [CrossRef]
  28. GB 15618-2018; Soil Environmental Quality Risk Control Standard for Soil Contamination of Agricultural Land. Ministry of Ecology and Environment of China, and State Administration for Market Regulation of China: Beijing, China, 2018; p. 2.
  29. Huang, F.; Chen, L.; Zhou, Y.; Huang, J.; Wu, F.; Hu, Q.; Chang, N.; Qiu, T.; Zeng, Y.; He, H.; et al. Exogenous Selenium Promotes Cadmium Reduction and Selenium Enrichment in Rice: Evidence, Mechanisms, and Perspectives. J. Hazard. Mater. 2024, 476, 135043. [Google Scholar] [CrossRef]
  30. Gong, J.; Yang, J.; Wu, H.; Gao, J.; Tang, S.; Ma, S. Spatial Distribution and Environmental Impact Factors of Soil Selenium in Hainan Island, China. Sci. Total Environ. 2022, 811, 151329. [Google Scholar] [CrossRef]
  31. Liu, Y.; Ge, T.; Zhu, Z.; Liu, S.; Luo, Y.; Li, Y.; Wang, P.; Gavrichkova, O.; Xu, X.; Wang, J.; et al. Carbon Input and Allocation by Rice into Paddy Soils: A Review. Soil Biol. Biochem. 2019, 133, 97–107. [Google Scholar] [CrossRef]
  32. Gabos, M.B.; Alleoni, L.R.F.; Abreu, C.A. Background Levels of Selenium in Some Selected Brazilian Tropical Soils. J. Geochem. Explor. 2014, 145, 35–39. [Google Scholar] [CrossRef]
  33. Li, J.; Peng, Q.; Liang, D.; Liang, S.; Chen, J.; Sun, H.; Li, S.; Lei, P. Effects of Aging on the Fraction Distribution and Bioavailability of Selenium in Three Different Soils. Chemosphere 2016, 144, 2351–2359. [Google Scholar] [CrossRef]
  34. He, J.; Shi, Y.; Yang, X.; Zhou, W.; Li, Y.; Liu, C. Influence of Fe(II) on the Se(IV) Sorption under Oxic/Anoxic Conditions Using Bentonite. Chemosphere 2018, 193, 376–384. [Google Scholar] [CrossRef] [PubMed]
  35. Wang, D.; Rensing, C.; Zheng, S. Microbial Reduction and Resistance to Selenium: Mechanisms, Applications and Prospects. J. Hazard. Mater. 2022, 421, 126684. [Google Scholar] [CrossRef] [PubMed]
  36. Huang, J.; Huang, X.; Jiang, D. Phosphorus Can Effectively Reduce Selenium Adsorption in Selenium-Rich Lateritic Red Soil. Sci. Total Environ. 2024, 906, 167356. [Google Scholar] [CrossRef] [PubMed]
  37. Wang, P.; Chen, H.; Kopittke, P.M.; Zhao, F.-J. Cadmium Contamination in Agricultural Soils of China and the Impact on Food Safety. Environ. Pollut. 2019, 249, 1038–1048. [Google Scholar] [CrossRef] [PubMed]
  38. Liu, Y.; Tian, X.; Liu, R.; Liu, S.; Zuza, A.V. Key Driving Factors of Selenium-Enriched Soil in the Low-Se Geological Belt: A Case Study in Red Beds of Sichuan Basin, China. Catena 2021, 196, 104926. [Google Scholar] [CrossRef]
  39. Tu, C.-L.; He, T.-B.; Liu, C.-Q.; Lu, X.-H. Effects of Land Use and Parent Materials on Trace Elements Accumulation in Topsoil. J. Environ. Qual 2013, 42, 103–110. [Google Scholar] [CrossRef]
  40. Pan, Z.; He, S.; Li, C.; Men, W.; Yan, C.; Wang, F. Geochemical Characteristics of Soil Selenium and Evaluation of Se-Rich Land Resources in the Central Area of Guiyang City, China. Acta Geochim. 2017, 36, 240–249. [Google Scholar] [CrossRef]
  41. Zhu, S.; Sun, S.; Zhao, W.; Sheng, L.; Mao, H.; Yang, X.; Chen, Z. Metagenomics and Metabolomics Analysis Revealed That Se-Mediated Cd Precipitation and Nutrient Cycling Regulated Soil-Rice (Oryza sativa L.) Microenvironmental Homeostasis under Cadmium Stress. Environ. Exp. Bot. 2024, 228, 105958. [Google Scholar] [CrossRef]
  42. Feng, R.; Zhao, P.; Zhu, Y.; Yang, J.; Wei, X.; Yang, L.; Liu, H.; Rensing, C.; Ding, Y. Application of Inorganic Selenium to Reduce Accumulation and Toxicity of Heavy Metals (Metalloids) in Plants: The Main Mechanisms, Concerns, and Risks. Sci. Total Environ. 2021, 771, 144776. [Google Scholar] [CrossRef]
  43. Huang, G.; Ding, C.; Guo, F.; Li, X.; Zhang, T.; Wang, X. Underlying Mechanisms and Effects of Hydrated Lime and Selenium Application on Cadmium Uptake by Rice (Oryza sativa L.) Seedlings. Environ. Sci. Pollut. Res. 2017, 24, 18926–18935. [Google Scholar] [CrossRef]
  44. Huang, Q.; Xu, Y.; Liu, Y.; Qin, X.; Huang, R.; Liang, X. Selenium Application Alters Soil Cadmium Bioavailability and Reduces Its Accumulation in Rice Grown in Cd-Contaminated Soil. Environ. Sci. Pollut. Res. 2018, 25, 31175–31182. [Google Scholar] [CrossRef] [PubMed]
  45. Qin, X.; Zhao, P.; Liu, H.; Nie, Z.; Zhu, J.; Qin, S.; Li, C. Selenium Inhibits Cadmium Uptake and Accumulation in the Shoots of Winte Wheat by Altering the Transformation of Chemical Forms of Cadmium in Soil. Environ. Sci. Pollut. Res. 2022, 29, 8525–8537. [Google Scholar] [CrossRef] [PubMed]
  46. Liu, N.; Jiang, Z.; Li, X.; Liu, H.; Li, N.; Wei, S. Mitigation of Rice Cadmium (Cd) Accumulation by Joint Application of Organic Amendments and Selenium (Se) in High-Cd-Contaminated Soils. Chemosphere 2020, 241, 125106. [Google Scholar] [CrossRef] [PubMed]
  47. Feng, R.; Wei, C.; Tu, S.; Ding, Y.; Song, Z. A Dual Role of Se on Cd Toxicity: Evidences from the Uptake of Cd and Some Essential Elements and the Growth Responses in Paddy Rice. Biol. Trace Elem. Res. 2013, 151, 113–121. [Google Scholar] [CrossRef] [PubMed]
  48. Yang, B.-B.; Yang, C.; Shao, Z.-Y.; Wang, H.; Zan, S.-T.; Zhu, M.; Zhou, S.-B.; Yang, R.-Y. Selenium (Se) Does Not Reduce Cadmium (Cd) Uptake and Translocation in Rice (Oryza sativa L.) in Naturally Occurred Se-Rich Paddy Fields with a High Geological Background of Cd. Bull. Environ. Contam. Toxicol. 2019, 103, 127–132. [Google Scholar] [CrossRef]
  49. Li, Z.; Liang, D.; Peng, Q.; Cui, Z.; Huang, J.; Lin, Z. Interaction between Selenium and Soil Organic Matter and Its Impact on Soil Selenium Bioavailability: A Review. Geoderma 2017, 295, 69–79. [Google Scholar] [CrossRef]
  50. Ye, Q.; Ding, Z.; Li, R.; Shi, Z. Kinetics of Cadmium (Cd), Nickel (Ni), and Lead (Pb) Release from Fulvic Acid: Role of Re-Association Reactions and Quantitative Models. Sci. Total Environ. 2022, 843, 156996. [Google Scholar] [CrossRef]
  51. Huang, S.; Wang, Z.; Song, Q.; Hong, J.; Jin, T.; Huang, H.; Zheng, Z. Potential Mechanism of Humic Acid Attenuating Toxicity of Pb2+ and Cd2+ in Vallisneria natans. Sci. Total Environ. 2023, 864, 160974. [Google Scholar] [CrossRef]
  52. Yong, Y.; Yang, T.; Wang, Y.; Xu, Y.; Huang, Q.; Liang, X.; Sun, Y.; Wang, L. Mercapto–Palygorskite Decreases the Cd Uptake of Wheat by Changing Fe and Mn Fraction in Cd Contaminated Alkaline Soil. Geoderma 2024, 441, 116751. [Google Scholar] [CrossRef]
  53. Li, N.; Xia, Y.; He, X.; Yuan, L.; Li, W.; He, C.; Xia, K. Research Progress of Cd Form Transformation and the Effective Environmental Factors in Soil Based on Tessier Analysis. Chin. J. Soil Sci. 2021, 52, 1505–1512. [Google Scholar] [CrossRef]
Figure 1. Geographical location of the study area and distribution of sampling points across various soil types (a) and land use types (b).
Agronomy 14 02941 g001
Figure 2. Soil Se enrichment and Cd exceedance (a) and distribution of total Se and total Cd contents under different soil types (b) and land use types (c).
Agronomy 14 02941 g002
Figure 3. Comparison of the percentage of various fractions of Se in total Se content (a), various fractions of Cd in total Cd content (c), and the content of various fractions of Se (b) and Cd (d) in different soil types.
Agronomy 14 02941 g003
Figure 4. Comparison of the percentage of various fractions of Se in total Se content (a), various fractions of Cd in total Cd content (c), and the content of various fractions of Se (b) and Cd (d) in different land use types.
Agronomy 14 02941 g004
Figure 5. Distribution of soil bioavailable Se or Cd contents under different soil types (a) and land use types (b) and the distribution of soil AMR-Se:Cd (c).
Agronomy 14 02941 g005
Figure 6. Relationships between soil AMR-Se:Cd and the contents of bioavailable Se (a) and bioavailable Cd (g), and the contents of different fractions of Se (bf) and Cd (hl). Red dashed line was variation trend.
Agronomy 14 02941 g006
Figure 7. Relationships between soil AMR-Se:Cd and the percentages of bioavailable Se (a) and bioavailable Cd (g) and the percentages of different fractions of Se (bf) and Cd (hl). Red dashed line was variation trend.
Agronomy 14 02941 g007
Figure 8. Spearman correlation analysis of soil physico-chemical properties with various Se and Cd (a). Partial least squares path modeling (PLS-PM) of soil physico-chemical properties on soil AMR-Se:Cd for different soil types and land use types, with all variables in the model VIF < 5, Cronbach’s alpha > 0.7, factor loading > 0.707, AVE > 0.5, and HTMT < 0.85. The model reliability and validity were assessed as good, and the fit passed. SRMR < 0.08 and GoF = 0.626, indicating good model fit. The blue and orange paths indicate positive and negative effects, respectively. The line thickness indicates the size of the path coefficients. All paths reach a significant level (p < 0.05). R2 indicates the fit coefficient (b). Total, direct, and indirect effects of different factors on soil AMR-Se:Cd (c).
Agronomy 14 02941 g008
Table 1. Contents of soil physico-chemical properties under different soil types and land use types.
IndicatorsSoil TypeLand Use Type
Paddy SoilLimestone SoilRed SoilPaddy FieldDry LandGarden Plot
pH5.76 (5.19, 7.10) a4.69 (4.60, 5.98) b5.11 (4.72, 5.67) b5.80 (5.18, 6.30)5.51 (5.19, 5.71)5.06 (4.61, 5.95)
TN/%0.19 (0.14, 0.27) a0.15 (0.10, 0.17) ab0.07 (0.04, 0.17) b0.20 (0.18, 0.28) a0.14 (0.10, 0.15) b0.13 (0.06, 0.17) b
SOM/g·kg−131.69 (20.78, 42.48) a20.13 (14.11, 24.09) b11.21 (4.94, 27.43) b32.21 (28.14, 43.09) a18.67 (13.92, 21.23) b18.29 (9.83, 24.09) b
AK/mg·kg−1101.60 (68.74, 140.10) a85.30 (73.99, 110.50) ab71.82 (45.65, 96.49) b95.33 (70.99, 110.50) b125.3 (104.30, 402.00) a56.32 (45.32, 97.48) c
AP/mg·kg−127.77 (19.78, 52.52) a8.63 (0.47, 16.64) b0.45 (0.00, 17.93) b28.06 (20.20, 53.39) a15.05 (7.98, 52.27) a7.12 (0.00, 21.59) b
DOC/mg·kg−1162.60 (94.44, 222.90) a103.60 (53.18, 133.20) b87.96 (36.77, 137.80) b179.60 (117.50, 236.00) a71.73 (60.48, 93.83) b117.40 (54.73, 134.60) b
Sand/%38.81 (28.75, 50.29)36.26 (13.48, 46.62)47.25 (21.71, 82.74)35.47 (28.44, 46.21)46.18 (36.26, 54.18)46.56 (20.51, 65.81)
Silt/%38.34 (30.66, 43.53) a36.16 (31.77, 38.25) ab18.80 (9.16, 36.33) b38.72 (30.66, 43.65) a35.70 (30.55, 38.25) ab30.50 (17.09, 42.07) b
Clay/%25.50 (17.86, 28.16)25.50 (21.61, 50.36)23.83 (8.10, 51.87)25.61 (23.02, 28.21)20.31 (15.27, 25.50)20.36 (17.09, 36.01)
Fed/g·kg−127.63 (24.20, 37.42) b45.44 (44.81, 59.20) a37.76 (20.57, 75.64) ab26.57 (21.78, 40.68) b32.41 (30.69, 38.56) ab34.95 (26.32, 60.06) a
Ald/g·kg−15.35 (3.39, 6.29) b10.42 (8.30, 16.29) a7.41 (4.18, 11.86) ab5.56 (3.20, 6.58)6.11 (4.87, 10.11)7.61 (4.20, 12.91)
Note: Data are median and upper and lower quartiles (n = 81). Different lowercase letters indicate that each indicator differs significantly across soil types or land use types (p < 0.05).
Disclaimer/Publisher’s Note: The statements, opinions and data contained in all publications are solely those of the individual author(s) and contributor(s) and not of MDPI and/or the editor(s). MDPI and/or the editor(s) disclaim responsibility for any injury to people or property resulting from any ideas, methods, instructions or products referred to in the content.

