Article

Synergistic Matching and Influencing Factors of Grain Production and Cropland Net Primary Productivity in the Black Soil Region of Northeast China

1
School of Management, Gansu Agricultural University, Lanzhou 730070, China
2
School of Civil Engineering, Qinghai University, Xining 810016, China
3
College of Public Administration, Huazhong University of Science and Technology, Wuhan 430079, China
4
School of Public Policy and Management, China University of Mining and Technology, Xuzhou 221116, China
*
Author to whom correspondence should be addressed.
Agronomy 2024, 14(12), 2932; https://doi.org/10.3390/agronomy14122932
Submission received: 27 October 2024 / Revised: 3 December 2024 / Accepted: 6 December 2024 / Published: 9 December 2024
(This article belongs to the Special Issue Sustainable Agriculture for Food and Nutrition Security)

Abstract

:
Exploring the spatiotemporal dynamics, spatial mismatch, and complex influencing mechanism of grain production and cropland productivity in the black soil region of northeast China (BSRNC) is essential for the synergistic protection and utilization of black soil cropland and sustainable grain production. The BSRNC has realized cropland expansion and grain production increases in the past decades. This implied a substantial investment has been made in the region’s agriculture. However, at present, knowledge on the spatial mismatch and influencing factors of grain production and cropland productivity is still unclear. This study analyzed the spatial–temporal mismatch characteristics of grain production and cropland net primary productivity (CNPP) using the gravity center model, spatial autocorrelation analysis, and spatial mismatch index (SMI), and identified the spatial heterogeneity and prediction–response relationships of influencing factors based on a geographically and temporally weighted regression (GTWR) model and boosted regression tree (BRT) machine learning algorithm. The findings indicated that grain production and CNPP have been increasing, but the overall spatial pattern of cold hotspots has not changed obviously in the BSRNC from 2000 to 2020. The SMI has shown a decreasing trend, indicating that the synergistic development of grain production and CNPP has been obvious, which plays an important role in sustainable food supply capacity. Agricultural production and the natural environment have always been critical factors influencing the spatial mismatch. Specifically, the marginal impact of fertilizer application has undergone a shift. This study may provide new clues for the formulation of regional strategies for sustainable food supply and black soil cropland system protection.

1. Introduction

The global and regional food security situation has been reversed after a long time of continuous improvement, owing to multiple challenges such as serious agricultural environmental pollution, tight food supply, intensifying climate change, and the Russia–Ukraine crisis [1,2,3]. The Sustainable Development Goals (SDGs) in 2015 listed poverty eradication and zero hunger as the top two of the seventeen goals, underscoring the paramount significance of agricultural development and food security in global sustainable development [4,5]. Cropland protection and food security are the ballast stones and stabilizers to ensure the realization of Chinese-style modernization [6]. Since the initial establishment of the grain production support and protection policy system in 2003, China has completed a historic nineteen consecutive increase in grain production as of 2022 [7,8]. However, it must be recognized that not only actual increases in yields should be pursued, but also the productive capacity of cropland [9,10,11]. That is, sustainable cropland productivity is critical for ensuring food security [12]. Unoptimistically, studies have shown that 69.15% of cropland in China, which previously increased productivity, has started to decline, and the stable cropland average productivity in 2030 (baseline year of SDGs) will decline to 78.89–85.78% of that in 2015 [11]. In parallel, Niu et al. observed a gross primary production increase in cropland in northern regions of China, but a significant decrease in southern China [13], which could increase the challenge of food security in China [14]. Thus, a comprehensive understanding of the spatial mismatch and influencing factors of grain production and cropland productivity is urgent.
Extensive research on grain production has long been conducted and has yielded fruitful results. The existing literature has focused on the spatiotemporal variation in grain production [4,15], structural characteristics [16], efficiency [17,18], resilience measures [19], and carbon emissions [20]. Furthermore, investigations have been conducted on the coupled and coordinated relationships between grain production and fertilizer application [21], agricultural labor [22,23], economic development [24], and urbanization [25]. Both research and statistics found that the patterns of grain production and grain circulation in China have evolved: the gravity center of grain production has moved from south to north [26]; and grain circulation has shifted from the “grain in the south being transported to the north” to the “grain in the north being transported to the south” [4,27]. These transitions have been influenced by a range of factors, such as the surrounding natural environment, socioeconomic conditions, investments in agriculture, different cropping systems, and policies [28,29]. Specifically, some studies have shown that changes in cropland resources, cropland transitions, and cropland abandonment pose a profound impact on grain production [30,31,32]. Since 1980, the spatial reconstruction of grain production in China has been remarkable [33], resulting in the mismatch of grain production and cropland resources [34]. Researchers have already paid attention to the spatial mismatch and influencing factors of grain production, cropland resources, and the global population [35,36]. It is well known that the cropland production capacity is the most central basis for increased grain production [37]. Satellite observation data have created possibilities for capturing cropland productivity and its variation trends over a longer time period (e.g., two decades) [38]. Net primary productivity (NPP) indirectly reflects the production capacity of cropland resources under natural conditions [39], and it has been regarded as an important indicator to measure cropland productivity by researchers [10,40]. For example, Liu et al. explored the accuracy of crop production data in China through the NPP indicator [41]; an empirical analysis by Li et al. in the Loess Plateau region showed that the increase in crop production was mainly attributed to the increase in cropland productivity and urbanization does not endanger food security [42]; Yang et al. found a grain yield increase in the region of the synergistic evolution of grain productivity and NPP [43]. These findings provide a key reference for this study.
Research on various aspects of grain production and cropland productivity has achieved a wealth of results through continuous exploration. However, there are still some critical points to be explored. First, previous research has focused on understanding grain production or NPP in croplands, with relatively few studies investigating the whole, ignoring the potential impact of a mismatch between the two on food supply security and sustainability. The spatial mismatch theory is mainly used to reveal the matching phenomenon of interrelated elements in a spatial distribution [3] and has been widely used in fields such as ecology, land resources, and agricultural transitions [36,44]. The geographical features, resource endowment, and socioeconomic conditions of different regions vary greatly, leading to uncertain and mismatched patterns in grain production and cropland productivity at different spatial scales. The spatial mismatch theory was introduced to help systematically understand the regional food–cropland relationships. Second, the influencing mechanisms of spatial mismatch have not yet been explored. The geographically and temporally weighted regression (GTWR) model has a distinct advantage in revealing the spatial and temporal non-stationarity of influencing factors, while the boosted regression tree (BRT) algorithm from machine learning has been used to capture how the dependent variable relates to a single explanatory variable in a complex predictor–response relationship (partial dependency plot), which conventional regression models would not allow us to achieve. These two methods provide a multidimensional analysis of influencing factors in terms of “heterogeneous regression effects-importance ranking-local dependence information”, although this has not yet been applied to the spatial mismatch mechanism of the food–cropland relationship. Finally, the study area focused on the national and county scales and has not yet paid special attention to the main grain-producing areas of the black soil region of northeast China (BSRNC).
The BSRNC is one of the four major black soil regions in the world. Since reclamation in the 1950s, the different agricultural cropping patterns have had a positive impact on food sustainability [45,46]. While the region has contributed to guaranteeing national food security, it is also under strong pressure due to black soil protection [47], and part of the black soil cropland is at risk of degradation [48,49]. In summary, it is important to explore the spatiotemporal mismatch and influencing factors of grain production and cropland net primary productivity (CNPP) in the BSRNC in the context of national food security and black soil legislation protection. Here, this study first investigates the spatiotemporal variation characteristics of grain production and CNPP in the administrative region (prefecture level) from 2000 to 2020 using a hotspot analysis. Second, the spatial mismatch of grain production and CNPP is investigated by integrating the gravity center model, bivariate local spatial autocorrelation, and spatial mismatch analysis. Finally, using the GTWR model and the BRT algorithm with the spatiotemporal heterogeneity and prediction–response relationship as the entry point, the key factors impacting this spatial mismatch are comprehensively identified. In addition, the historical trends and future sustainability of black soil cropland productivity at pixel scales are quantitatively discussed using the Theil–Sen (T-S) estimator, Mann–Kendall (M-K) test, and Hurst exponent. This study aims to provide a reference point for the development of a regional strategy for sustainable food supply and cropland system protection.

2. Materials and Methods

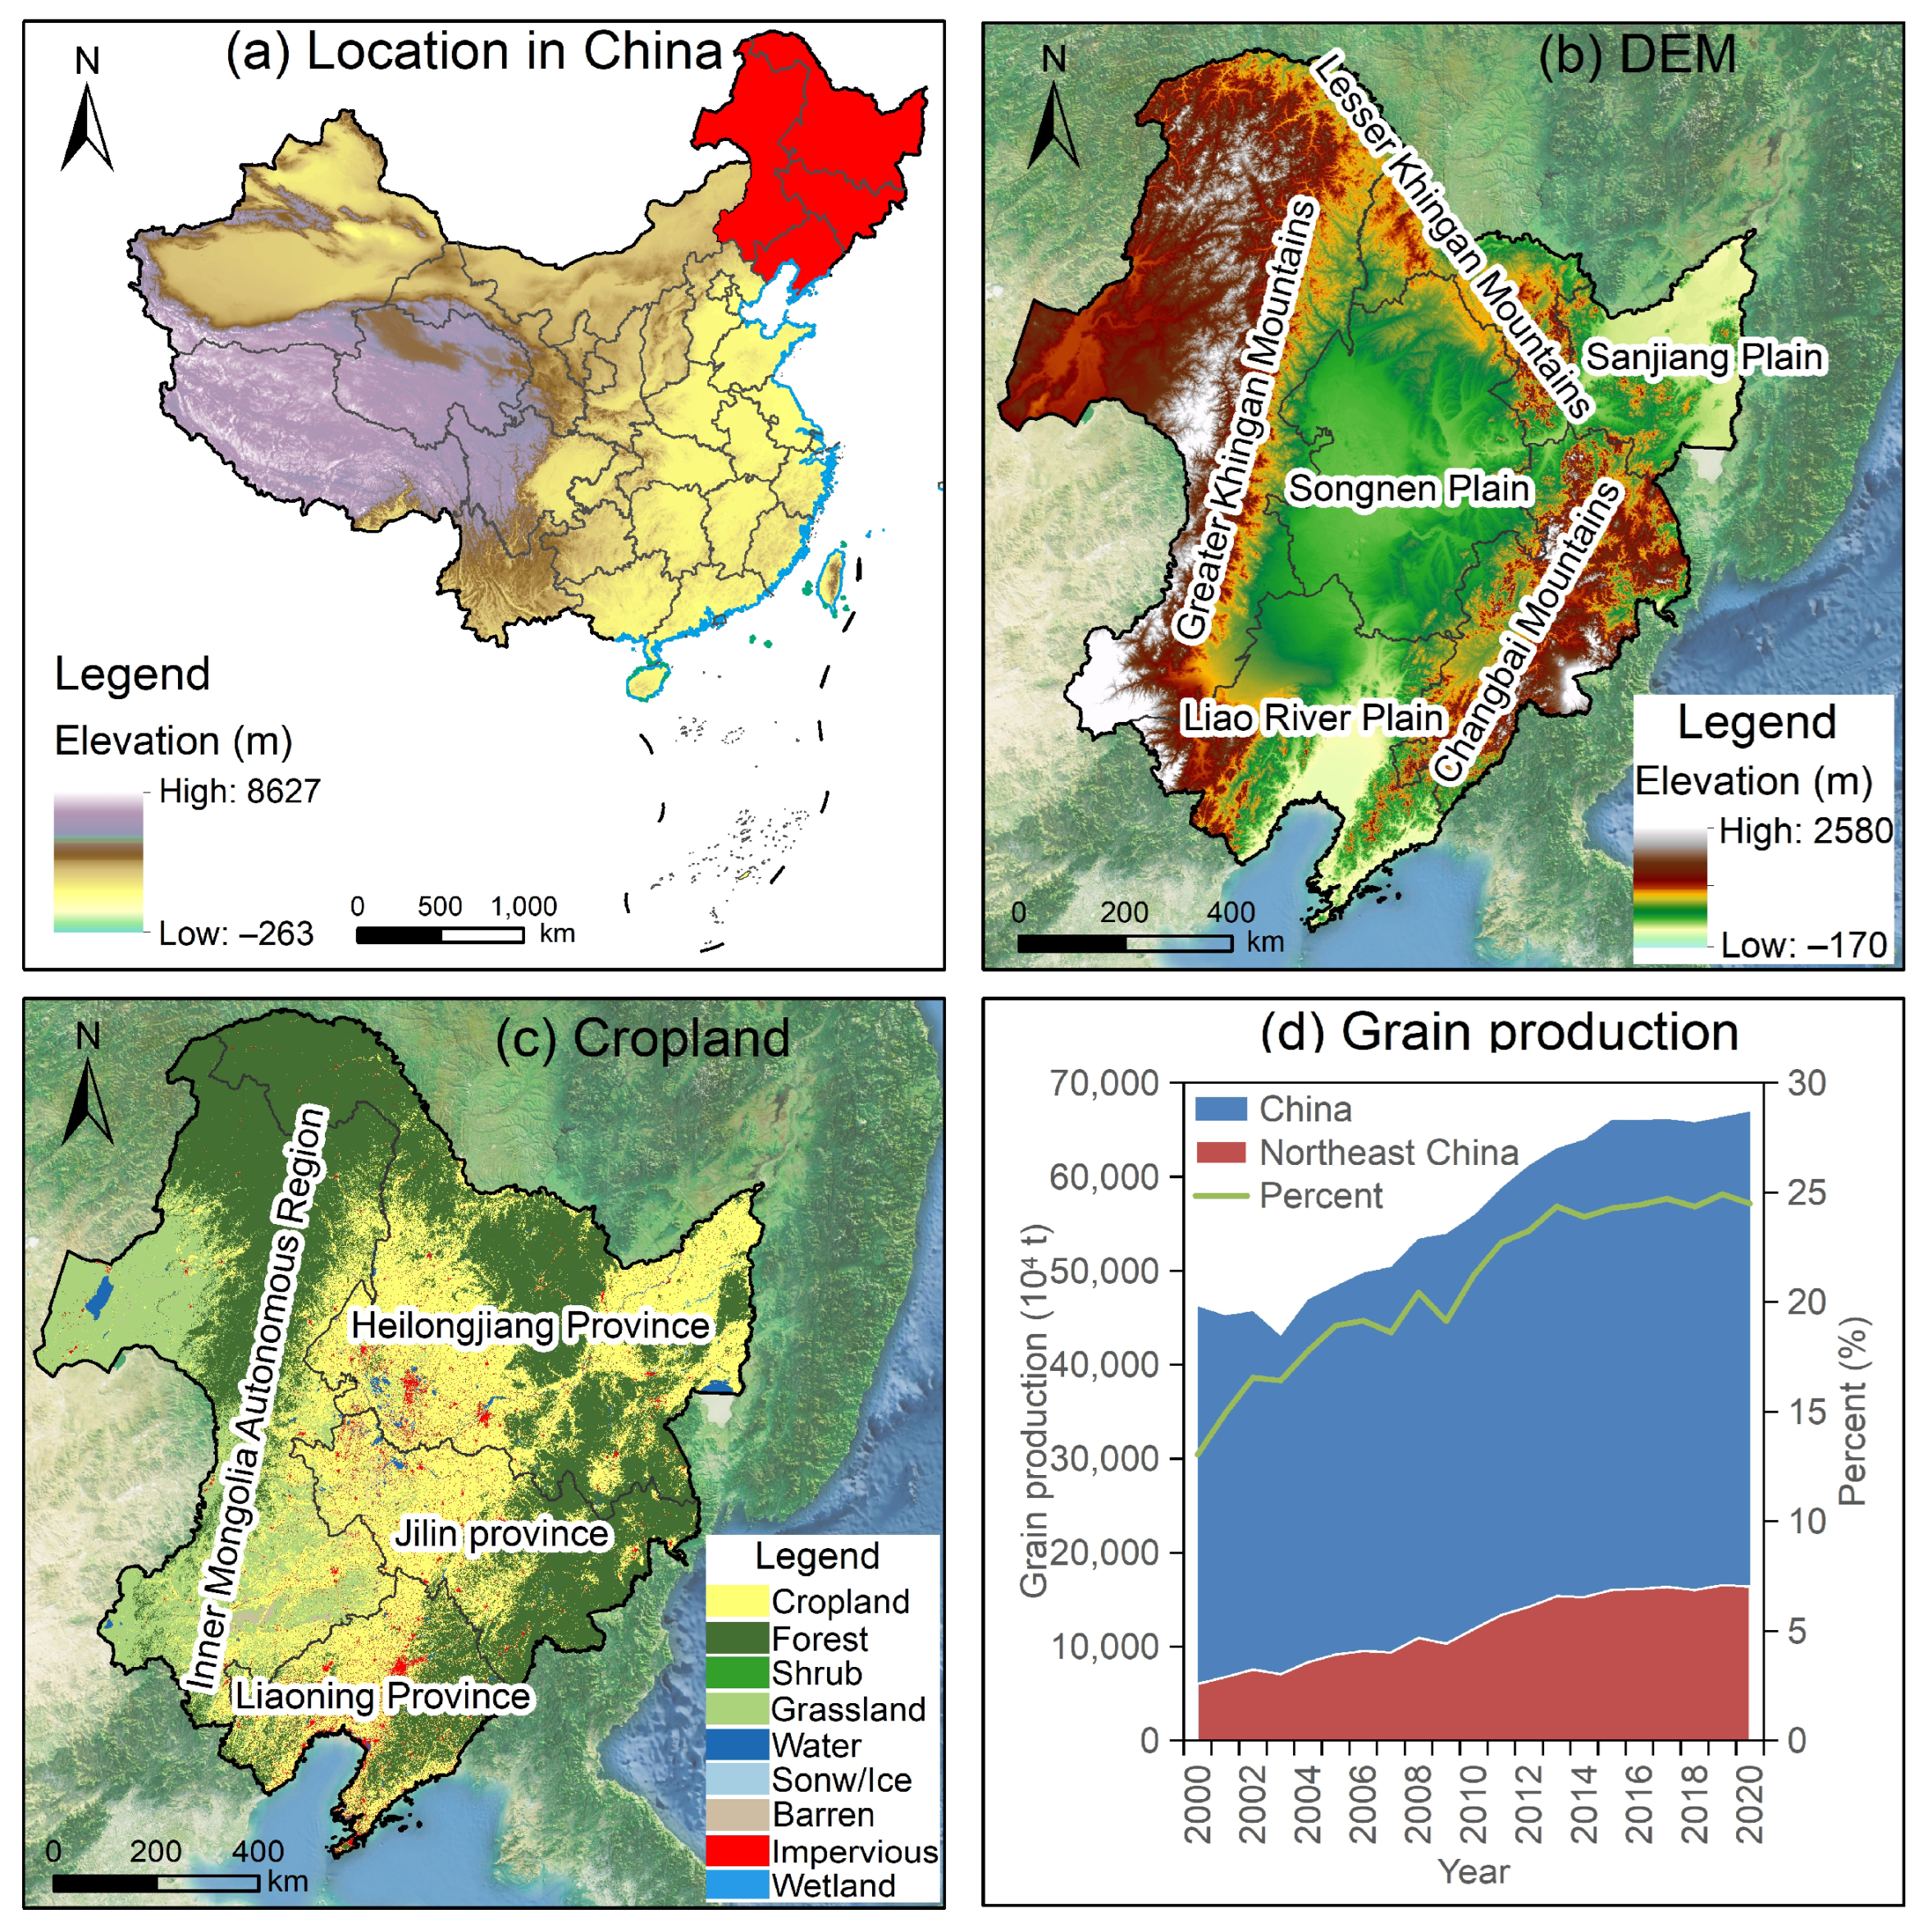
2.1. Overview of Study Area

The study area is the BSRNC in a broad sense (Figure 1), which has a strong grain “production capacity” [50,51]. The region has a variety of topographical features, including plains, mountains, and low hills, and is rich in climatic resources, with a cold temperate and humid and sub-humid climate. The crops are dominated by annual corn, rice, and soybeans under these conditions. In 2020, they accounted for 98.9% of the total grain crop acreage. An analysis of the statistical data showed (Figure 1d) that total grain production in China first decreased and then increased, while grain production increased rapidly in the BSRNC. Therefore, it is of great significance to explore the spatial mismatch and influencing factors of the increase in grain production and cropland productivity by taking the BSRNC as the study area.

2.2. Data and Processing

The cropland data were obtained from the annual China Land Cover Dataset (CLCD) [52]. Since the release of this dataset, it has been widely used to study cropland abandonment and cropland resource changes in China [32,53]. An assessment of these data by Cui et al. resulted in the highest cropland classification accuracy in the BSRNC [54], followed by GlobeLand30. In this study, the dynamic pattern of cropland resources in BSRNC during 2000–2020 was extracted; this pattern forms the basis for obtaining the cropland productivity data.
The CNPP data were obtained from NPP data, derived from the MODIS product (MOD17A3HGF v006) database, which is the most widely used data product. This study downloaded the NPP data of China’s mainland extent in the Google Earth Engine (GEE) and converted the original unit kg c/m2 to g c/m2. Finally, the NPP data were processed in the ArcGIS 10.8 platform with a cropland layer mask to obtain the CNPP data from 2000 to 2020.
Precipitation and temperature data were obtained from the National Earth System Science Data Center in China (http://www.geodata.cn/data/, (accessed on 18 July 2024)), with a spatial resolution of about 1 km [55]. The data in this study have been preprocessed and analyzed to derive the annual average precipitation and temperature for the study period in the BSRNC, which will be utilized to characterize the natural environmental factors contributing to the spatial mismatch.
In addition to the above data, this study also utilized the Heilongjiang Statistical Yearbook, Jilin Statistical Yearbook, and Liaoning Statistical Yearbook. These yearbooks were used as sources of influencing factor indicators.

2.3. Methods

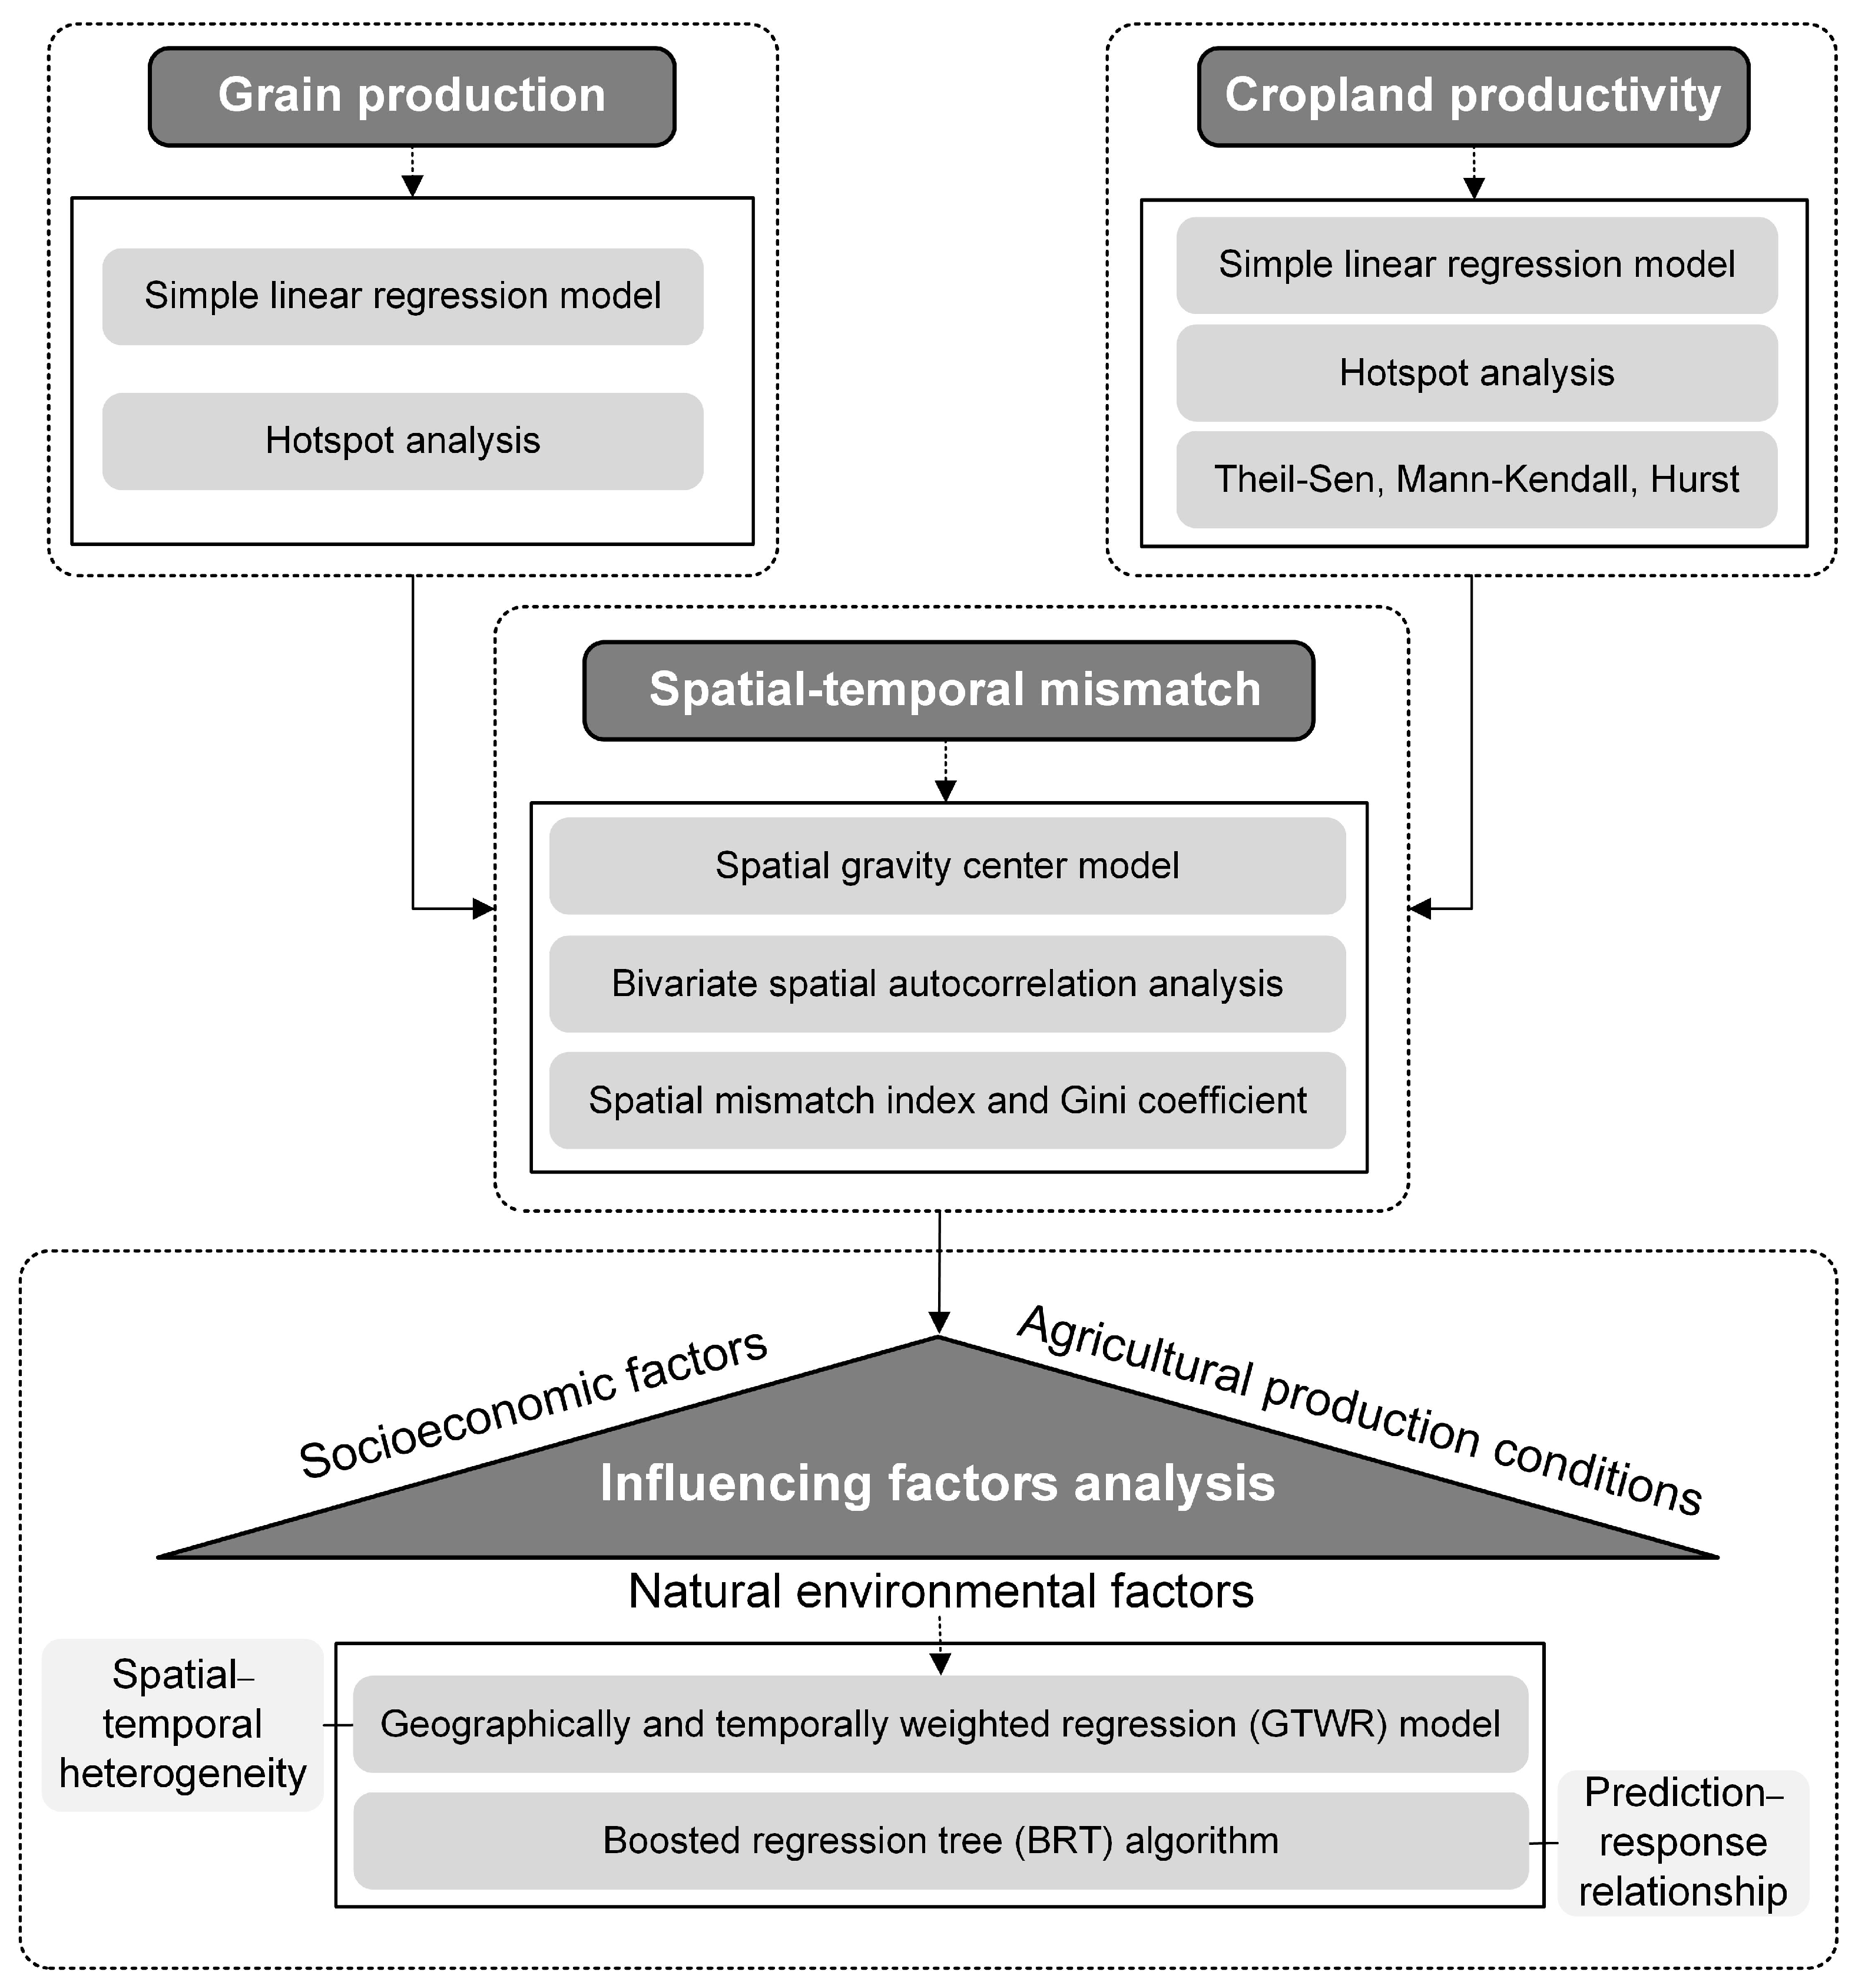
2.3.1. Methodological Framework

The methodological framework is constructed to investigate the spatial mismatch influencing factors and grain production and CNPP. The framework consists of three steps (Figure 2): (1) the spatial–temporal hotspot patterns of grain production and CNPP are revealed by using a simple linear regression model and hotspot analysis from 2000 to 2020. Historical trends and the future development sustainability of CNPP are investigated using the T-S estimator, M-K test, and Hurst exponent. (2) Given the intricate nature of the relationship between the food–land system, it is important to adopt multiple approaches to fully comprehend the spatial mismatch. Hence, various analytical perspectives such as the gravity center model, bivariate spatial autocorrelation, and spatial mismatch theory have been employed to examine the temporal and spatial mismatch. (3) Using the GTWR model and the BRT algorithm with the spatiotemporal heterogeneity and prediction–response relationship as the entry point, the key factors impacting this spatial mismatch are comprehensively identified. The details of these processes are described as follows.

2.3.2. Statistical Analysis and Hotspot Analysis

This study used statistical and hotspot analyses to understand spatial–temporal variations and clustering patterns of grain production and CNPP. The statistical analysis was applied to statistically summarize each pixel value in the CNPP map and to fit the changing trends in grain production and CNPP from 2000 to 2020 based on a simple linear regression model. In addition, the hotspot analysis and spatial autocorrelation analysis have been widely used to reveal the spatial clustering characteristics of geographic things and phenomena [56,57]. The hotspot pattern of grain production and CNPP was realized using the hotspot analysis tool. For more information about the formula, see the hotspot analysis tools of ArcGIS 10.8 software.

2.3.3. Gravity Center Model

From a geometric perspective, the spatial mismatch is the phenomenon of the separation of the geometric gravity centers of two closely connected elements in space [3,26]. The model was used to analyze the gravity centers of grain production and CNPP to understand the spatial mismatch state at the macro level. The calculation formula is as follows:
M ( X ¯ , Y ¯ ) = i = 1 n w i x i i = 1 n w i , i = 1 n w i y i i = 1 n w i
where M ( X ¯ , Y ¯ ) is the gravity center, n is the number, wi is the weight, and xi and yi are the coordinates. This study utilized the mean center of gravity spatial analysis tool in ArcGIS 10.8 software to perform the analysis.

2.3.4. Bivariate Local Spatial Autocorrelation

The gravity center analysis only reveals the mismatch phenomenon of grain production and CNPP at the macro level and cannot interpret the distribution pattern of the spatial mismatch between the two at the local level. This model can reveal the spatial association of multiple attributes in a spatial distribution [43], which was used to explore the spatial interaction response relationship between grain and CNPP. The model was calculated as follows:
I l m p = X l p X ¯ l σ l q = 1 n W p q X m q X ¯ m σ m
where I l m p is the Moran’s I, n is the number of units, X l p and X m q are the grain production and CNPP, X ¯ l and X ¯ m are the average value, σ l and σ m are the variances in grain production and CNPP, and W p q is the spatial weight matrix.

2.3.5. Spatial Mismatch Analysis

This research investigated the spatial and temporal mismatch of grain production and CNPP by utilizing the spatial mismatch index (SMI), aiming to understand the coordination relationship of grain and cropland, with the formulas described in [36]:
S M I i = G i i = 1 n G i P i i = 1 n P i × 100
S M I = i = 1 n S M I i
where S M I i is the spatial mismatch index in the ith city, G i and N i are the grain production and CNPP in the ith city, respectively, and S M I is the total mismatch level. When the SMI is greater than 0 (positive mismatch), it indicates that grain production efficiency in city i is much higher than CNPP, and the grain–cropland relationship develops relatively harmoniously. Conversely, when the SMI is less than 0 (negative mismatch), it shows that grain production efficiency in city i is lagging far behind CNPP, and the grain–cropland relationship is in conflict. Therefore, the SMI was divided into six types based on the actual values: negative high mismatch (SMI ≤ −3), negative medium mismatch (−3 < SMI ≤ −2), negative low mismatch (−2 < SMI ≤ 0), positive low misalignment (0 < SMI ≤ 2), positive medium misalignment (2 < SMI ≤ 3), and positive high misalignment (SMI > 3). Furthermore, the cities with a directional shift in SMI from 2000 to 2020 were identified, which were divided into four types: positive → negative (SMI changed from <0 to >0), negative → positive (SMI changed from >0 to <0), positive → negative→ positive (SMI changed from >0 to <0 and then to >0), and negative → positive → negative (SMI changed from <0 to >0 and then to <0).
To enhance the reliability of the findings from the spatial mismatch analysis, this study additionally employed the Gini coefficient to depict the evolution of the spatial imbalance in grain production and CNPP.
G = 1 f × ( 2 a g )
where G is the Gini coefficient (between 0 and 1), f and g are the proportions of grain production and CNPP, respectively, and a is the cumulative percentage of grain production. Generally, a higher G value reflects a more imbalanced grain production and CNPP relationship.

2.3.6. Geographically and Temporally Weighted Regression (GTWR) Model

The GTWR model has solved the spatial and temporal non-stationarity, and the estimation results exhibit enhanced efficiency [58]. At present, this model has been applied to various spatial issues, such as ecological civilization performance [59] and high-quality development [60], achieving better results. This study used the GTWR model to identify the influencing factors of the spatial mismatch. This model is calculated as follows:
Y i = β 0 ( u i , v i , t i ) + k = 1 p β k ( u i , v i , t i ) X i k + ε i
where Y and X are the SMI and explanatory variable, respectively; i is the city; ( u i , v i , t i ) is the location coordinates of city i; t is time; β 0 ( u i , v i , t i ) is the intercept term; β k ( u i , v i , t i ) is the coefficient of the influencing factor; and ε i is the random perturbation term.

2.3.7. Boosted Regression Tree (BRT) Algorithm

In recent years, the machine learning technique has demonstrated significant applicability in analyzing intricate nonlinear relationships between dependent and independent variables. The BRT algorithm can identify complex, nonlinear response relationships among predictor variables and is applied to determine the influencing factors of crop production [28] and cropland abandonment [32]. This study introduces partial dependency plots within the BRT algorithm to capture and visualize prediction–response curves of influencing factors for the spatial mismatch, which is more helpful for the root cause analysis. The algorithm is described as follows [28]:
y ^ ( x ) = t w t h t ( x )
O ( x ) = i l y ^ i , y i + t Ω ( f t )
where h ( x ) is the tree of the output, w is the weight, l ( y ^ i , y i ) is the loss function, and Ω ( f t ) represents the regularization function. In this study, the algorithm is implemented using open-source R 4.3.1 software with the third-party package “gbm”.

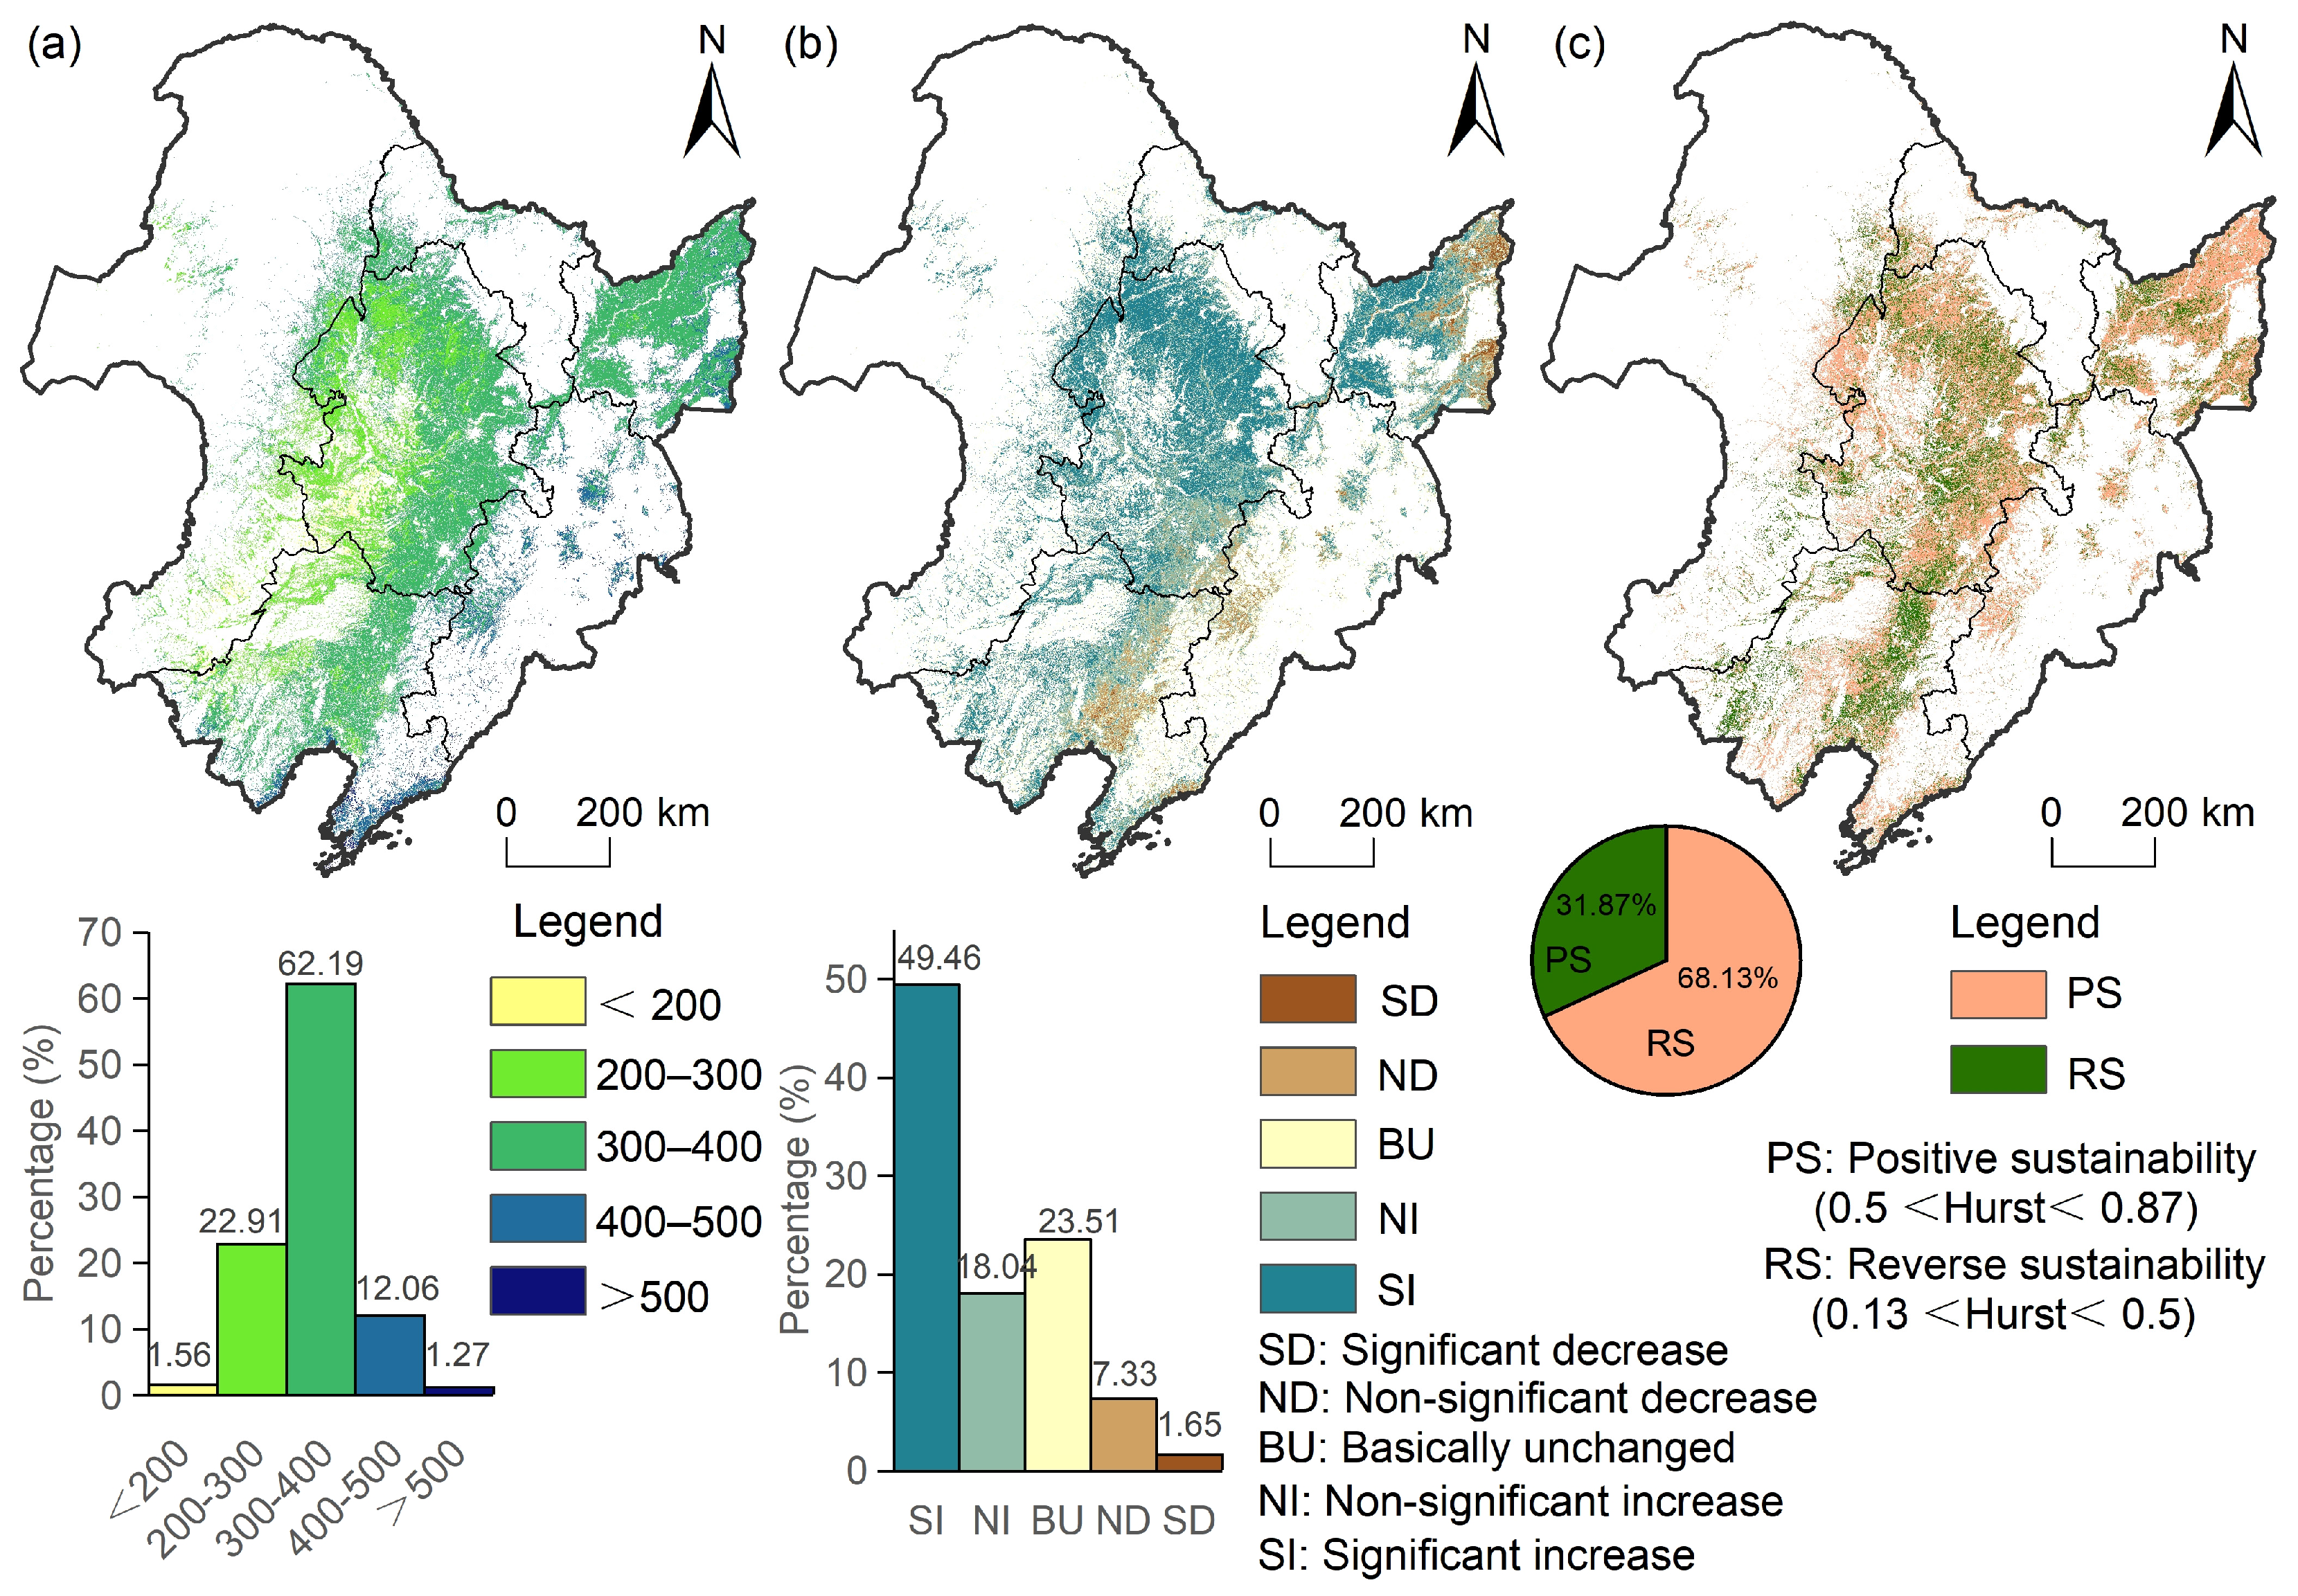
2.3.8. Theil–Sen Estimator, Mann–Kendall Test, and Hurst Exponent

The T-S Median method and M-K test have been used to detect historical time trends in variables [61], often coupling the calculations of the two. The Hurst exponent, an analytical method for quantitatively describing the information dependence of a time series [61], has gained significant popularity in examining the prospective sustainability of a specific entity. Therefore, this study coupled the T-S and M-K methods to examine the changing trend in stable cropland productivity from 2000 to 2020 and used the Hurst exponent to quantitatively assess the future development trend. The classifications of T-S and M-K models are shown in Table A1. The Hurst exponent has values between 0 and 1, with 0.5 < H < 1 indicating positive persistence, 0 < H < 0.5 indicating reverse sustainability, and H = 0 indicating a random sequence.

2.4. Explanatory Variables of Influencing Factors

The spatial mismatch refers to the inconsistent spatial distribution of grain yields and CNPP on the same geographic unit, which is fundamentally due to the spatial heterogeneity of the distribution of grain and cropland in the same region. According to previous findings on grain production and CNPP [36,62,63,64], and also considering the analysis unit and the data operationalization, the study finally focused on the three aspects of socioeconomic factors, agricultural production conditions, and natural environmental factors, and selected eight representative indicators as influencing factors to systematically explore the influencing mechanism of spatial mismatch of grain and cropland productivity. The influencing factors are specified below (Table 1):
The socioeconomic factors indicate human interference with cropland resources [64]. The urbanization expansion increases the demand for grain and also occupies high-quality cropland, directly affecting the cropland productivity and increasing regional grain production pressure to improve cropland productivity [25]. Differences in cropland production elements and cropland intensification across various levels of economic development directly impact the balance relationship within the grain and cropland system [65]. The per capita area of cropland influences the explicit–invisible transition process of cropland use efficiency [31]. The aforementioned socioeconomic changes indirectly impact the mismatch of grain and cropland systems.
The key elements of crop production to achieve output are determined by agricultural production conditions [66], and only the three indicators, including grain crop area, agricultural labor, and fertilizer consumption, were selected. Agricultural labor and fertilizer application represent the inputs of the utilization and management of cropland, which enhance grain yield and cropland productivity to a certain extent [22,23]. However, the excessive use of chemical fertilizers may also decrease cropland quality and cropland productivity, which directly affects grain yield [21]. The above changes in agricultural production conditions directly impact on the spatial mismatch.
Natural environmental factors provide the essential prerequisites [39]. Climate, topography, and soil features constitute the underlying factors influencing cropland productivity and grain production [41,67]. Due to the limited reliability of certain data metrics, such as topography and soil conditions at the administrative level, coupled with the probable influence of climate change on crop yield [47,68], only two variables were selected for this investigation: average annual precipitation and average annual temperature.
Furthermore, it is widely acknowledged that the existence of multicollinearity among independent variables can greatly influence the effectiveness of the model [69]. The findings indicate that the variance inflation factor (VIF) of the eight indicators closely associated with spatial mismatch selected for this study is less than 10, suggesting an absence of multicollinearity among these factors (Table 1). The detailed process of the indicator calculation is shown in Table A2.

3. Results

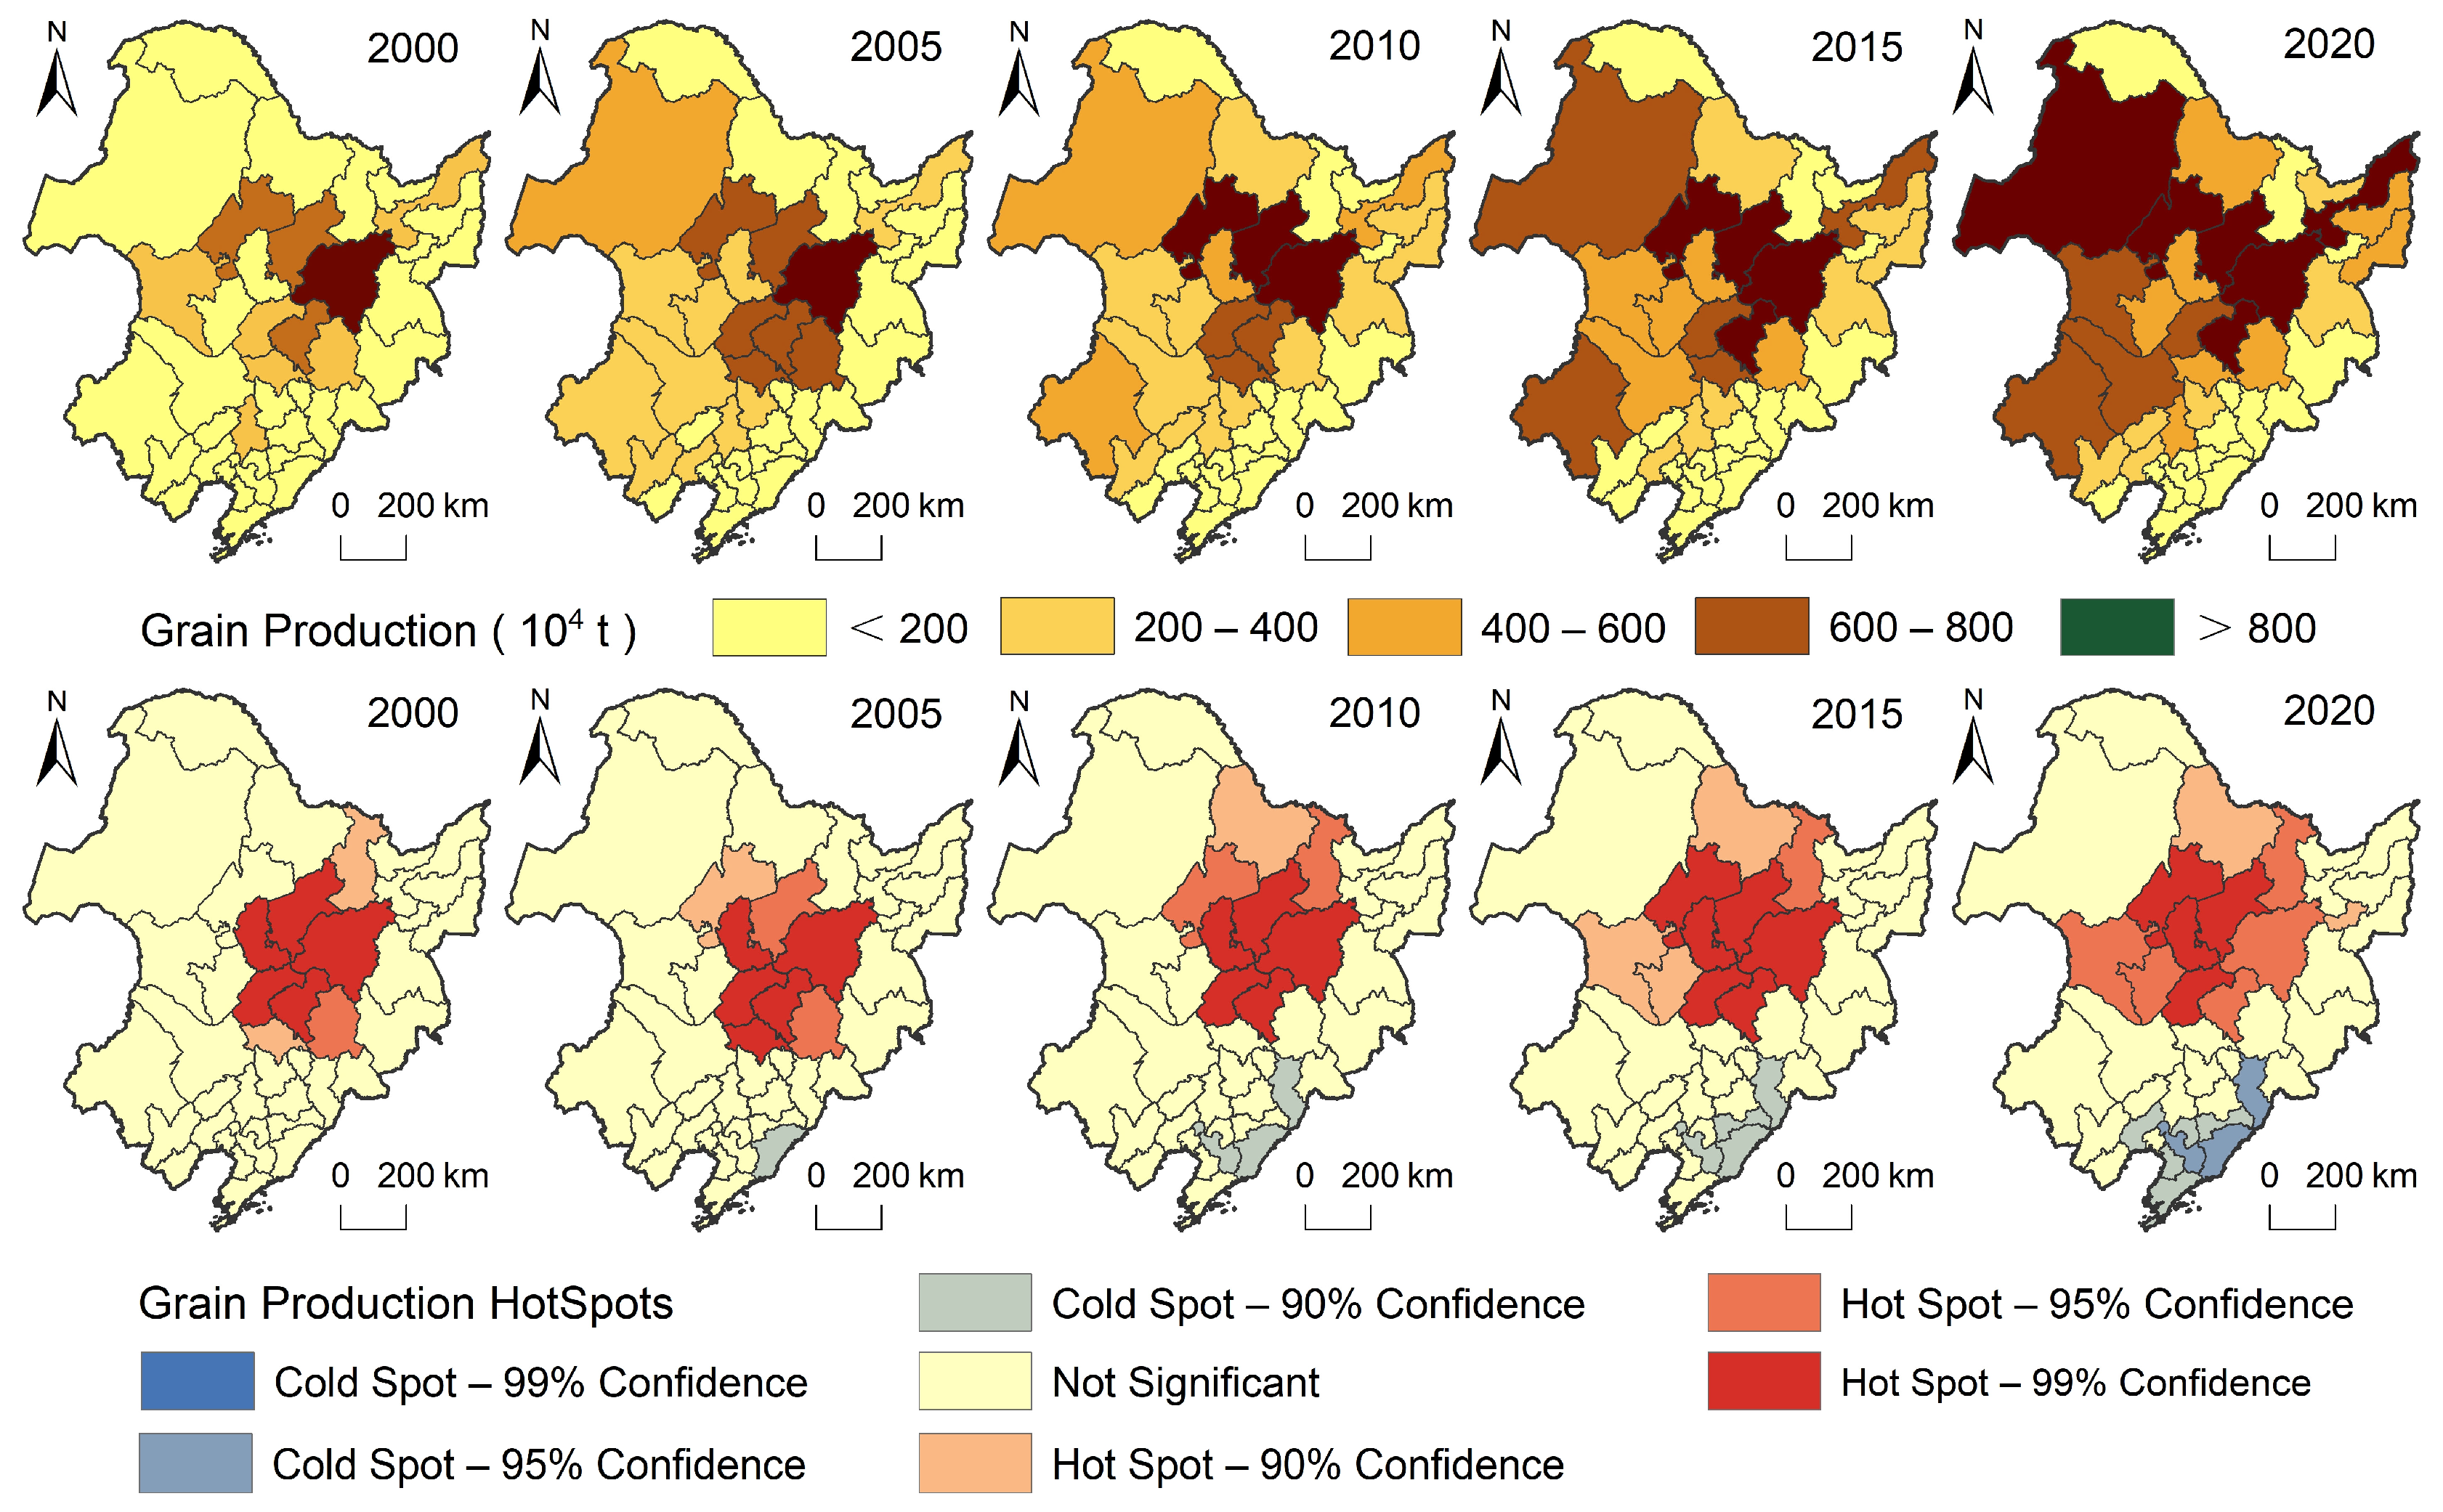
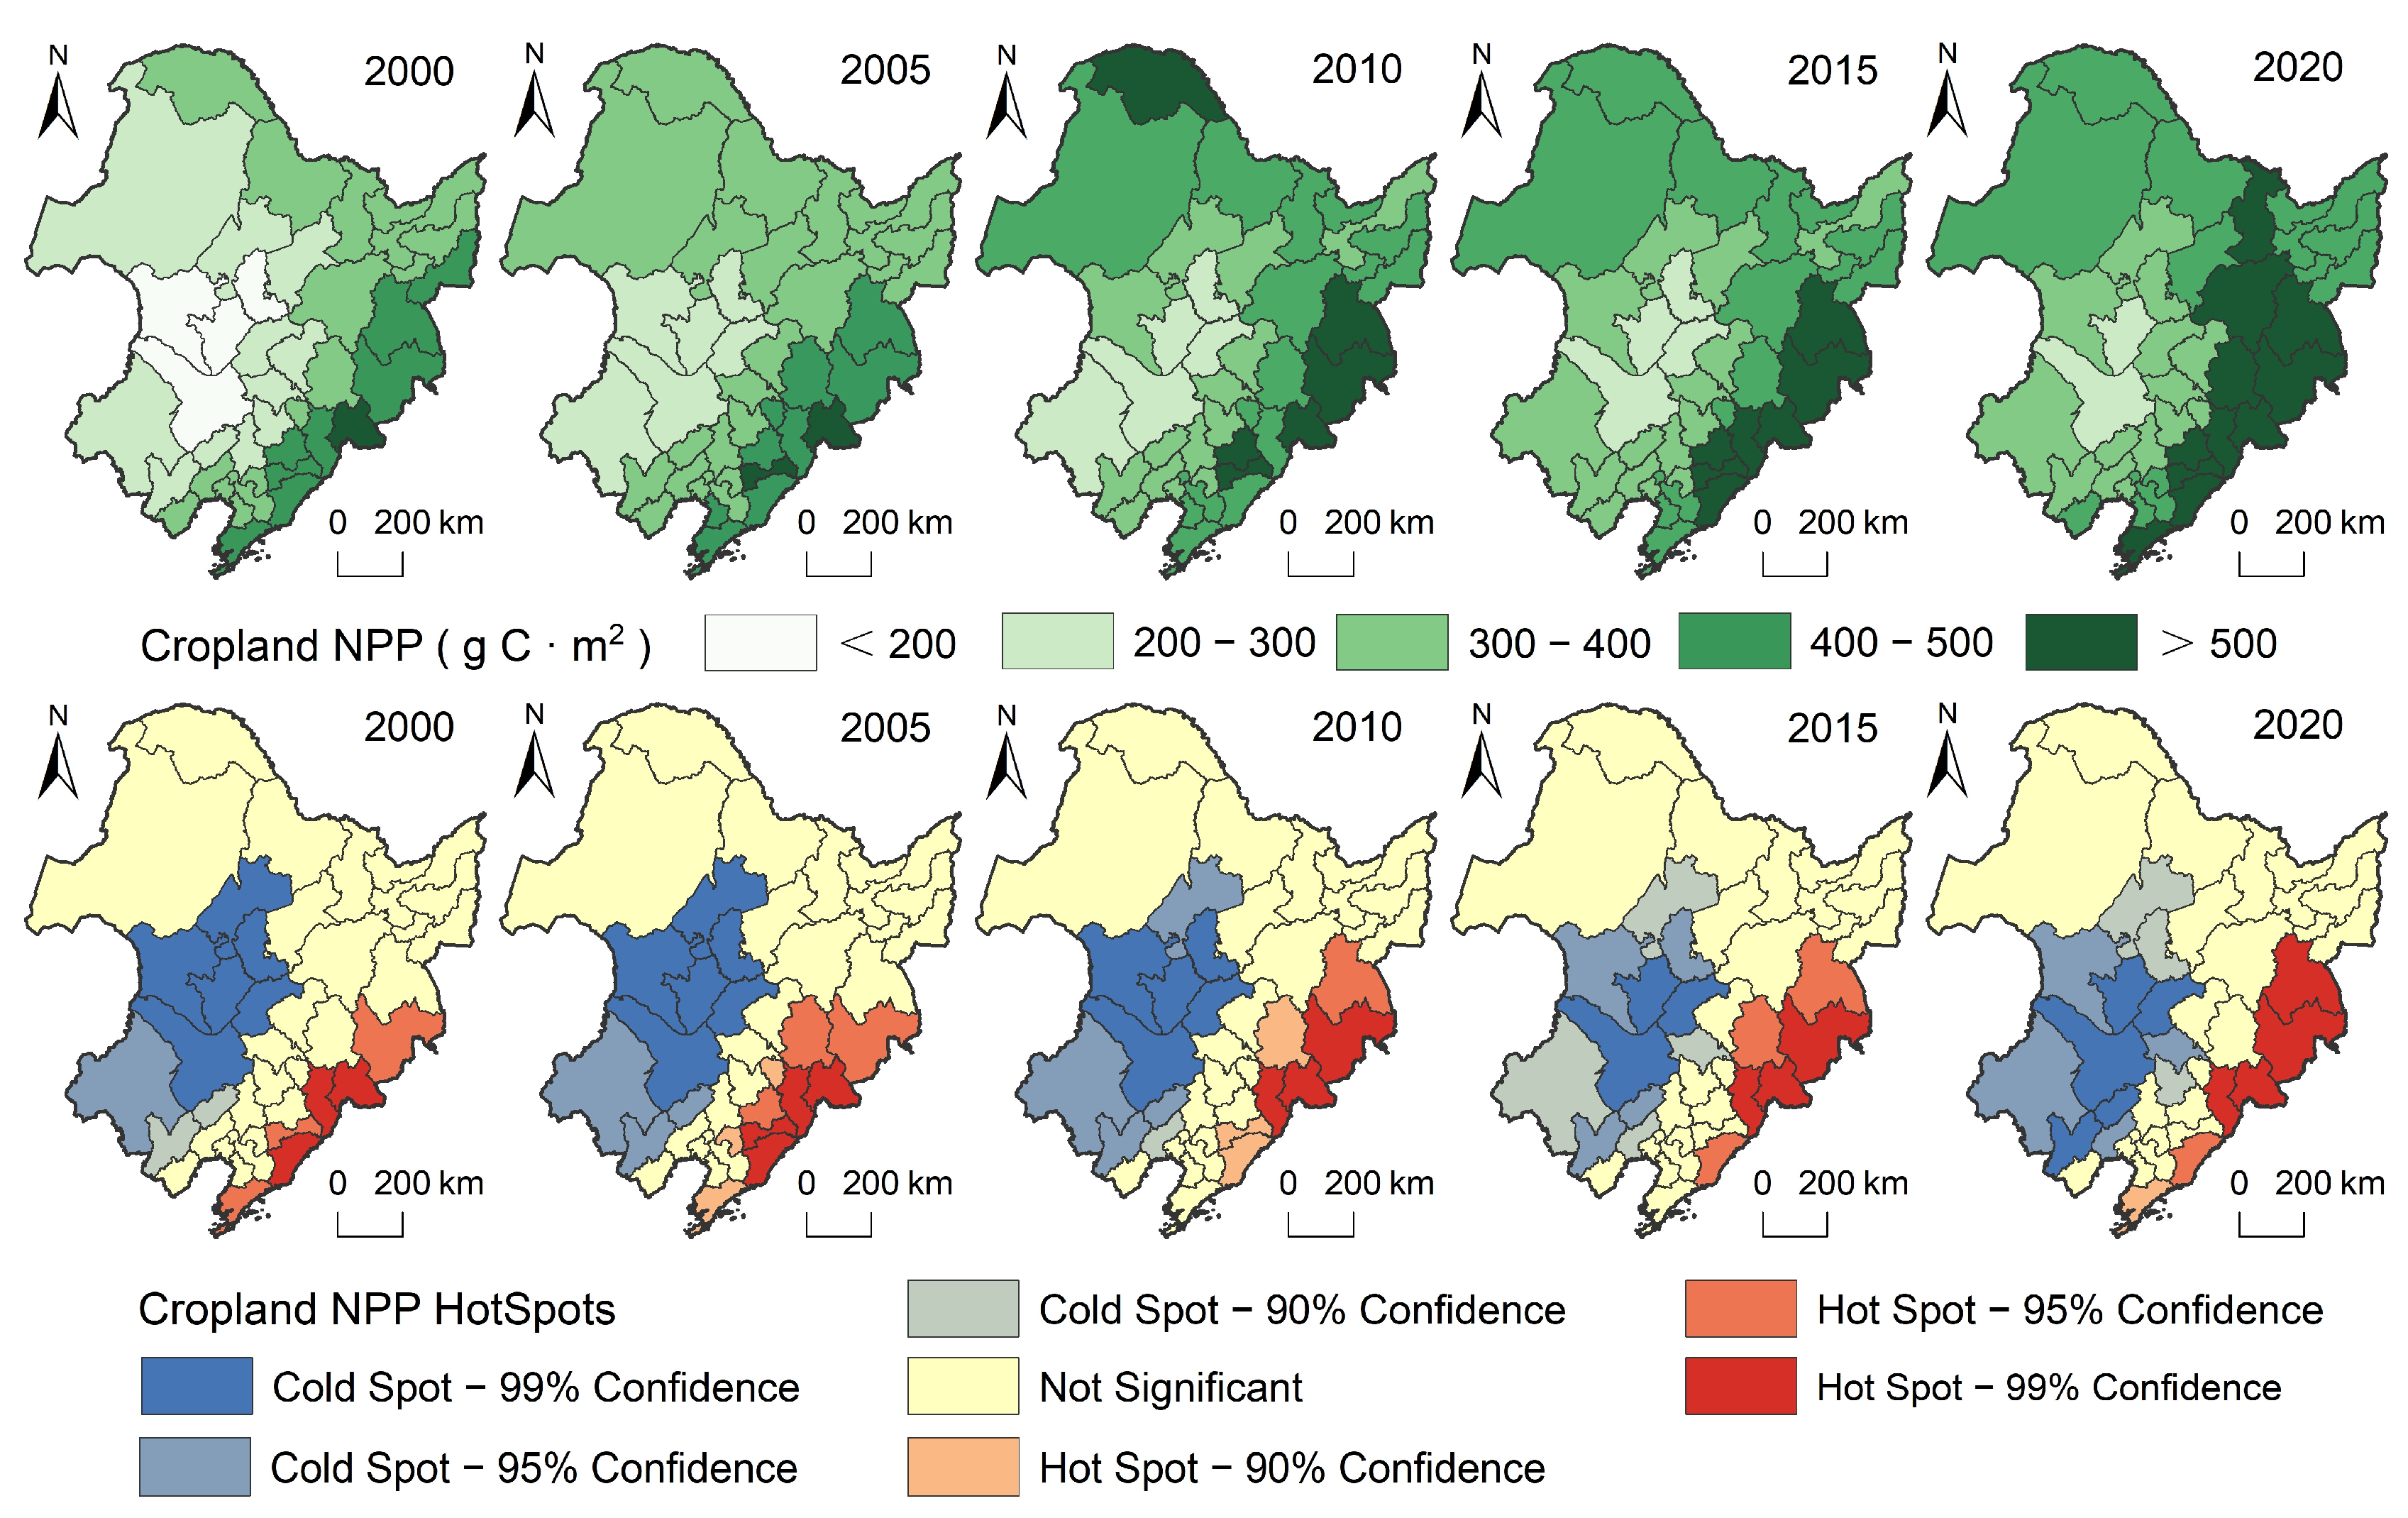
3.1. Hotspot Patterns of Grain Production and Cropland Productivity

There was an overall increase in grain production, but with some fluctuations, from 6031.36 × 104 t in 2000 to 16,398.61 × 104 t in 2020, indicating a growth rate of 171.89%. CNPP increased from 279.45 g C/m2 in 2000 to 365.72 g C/m2 in 2020, which is an increase of 86.21 g C/m2 (Figure 3).
The results indicated that grain production had significant spatial heterogeneity during the study period (Figure 4). This spatial distribution difference was closely related to the supply status of cropland resources. In terms of topographic distribution, the Songnen Plain is concentrated in contiguous areas with a high grain output. The results of the hotspot analysis showed that a high value of grain production was mainly found in Harbin, Qiqihar, Jiamusi, and Suihua, while a low value of grain production was mainly found in and around Benxi City in eastern Liaoning. Intuitively, there was no significant temporal variation in the spatial distribution of grain production.
Figure 5 shows the spatial differences and hotspot patterns of CNPP for the five selected time points. Overall, the spatial–temporal variations in CNPP and their clustering characteristics are consistent. Spatially, CNPP showed a pattern of increasing from west to east, especially when the range of CNPP > 400 g C/m2 was expanding. The hotspot analysis of CNPP indicates that intuitively spatial patterns of cold hotspots have not changed obviously. Among them, the cold spot regions were mainly concentrated in Inner Mongolia, where there were fewer cropland resources and lower cropland productivity.

3.2. Spatial–Temporal Mismatch of Grain Production and Cropland Productivity

3.2.1. Variation Analysis of Spatial Gravity Center

Figure 6 showed the gravity center of grain production and CNPP, and the asynchrony of the distance and direction of the gravity center movement in different periods was obvious (Table 2). The gravity center of grain production moves northeastward overall, passing through Changchun City and Songyuan City, with the latitude and longitude of the gravity center shifting between 125.07° E to 125.65° E and 44.75° N to 45.36° N. The gravity center of CNPP moves in a relatively consistent direction with the gravity center of grain production, but the gravity center change of CNPP is smaller (between 125.38° E to 125.54° E and 43.84° N to 44.13° N), and it has always been in Changchun city.

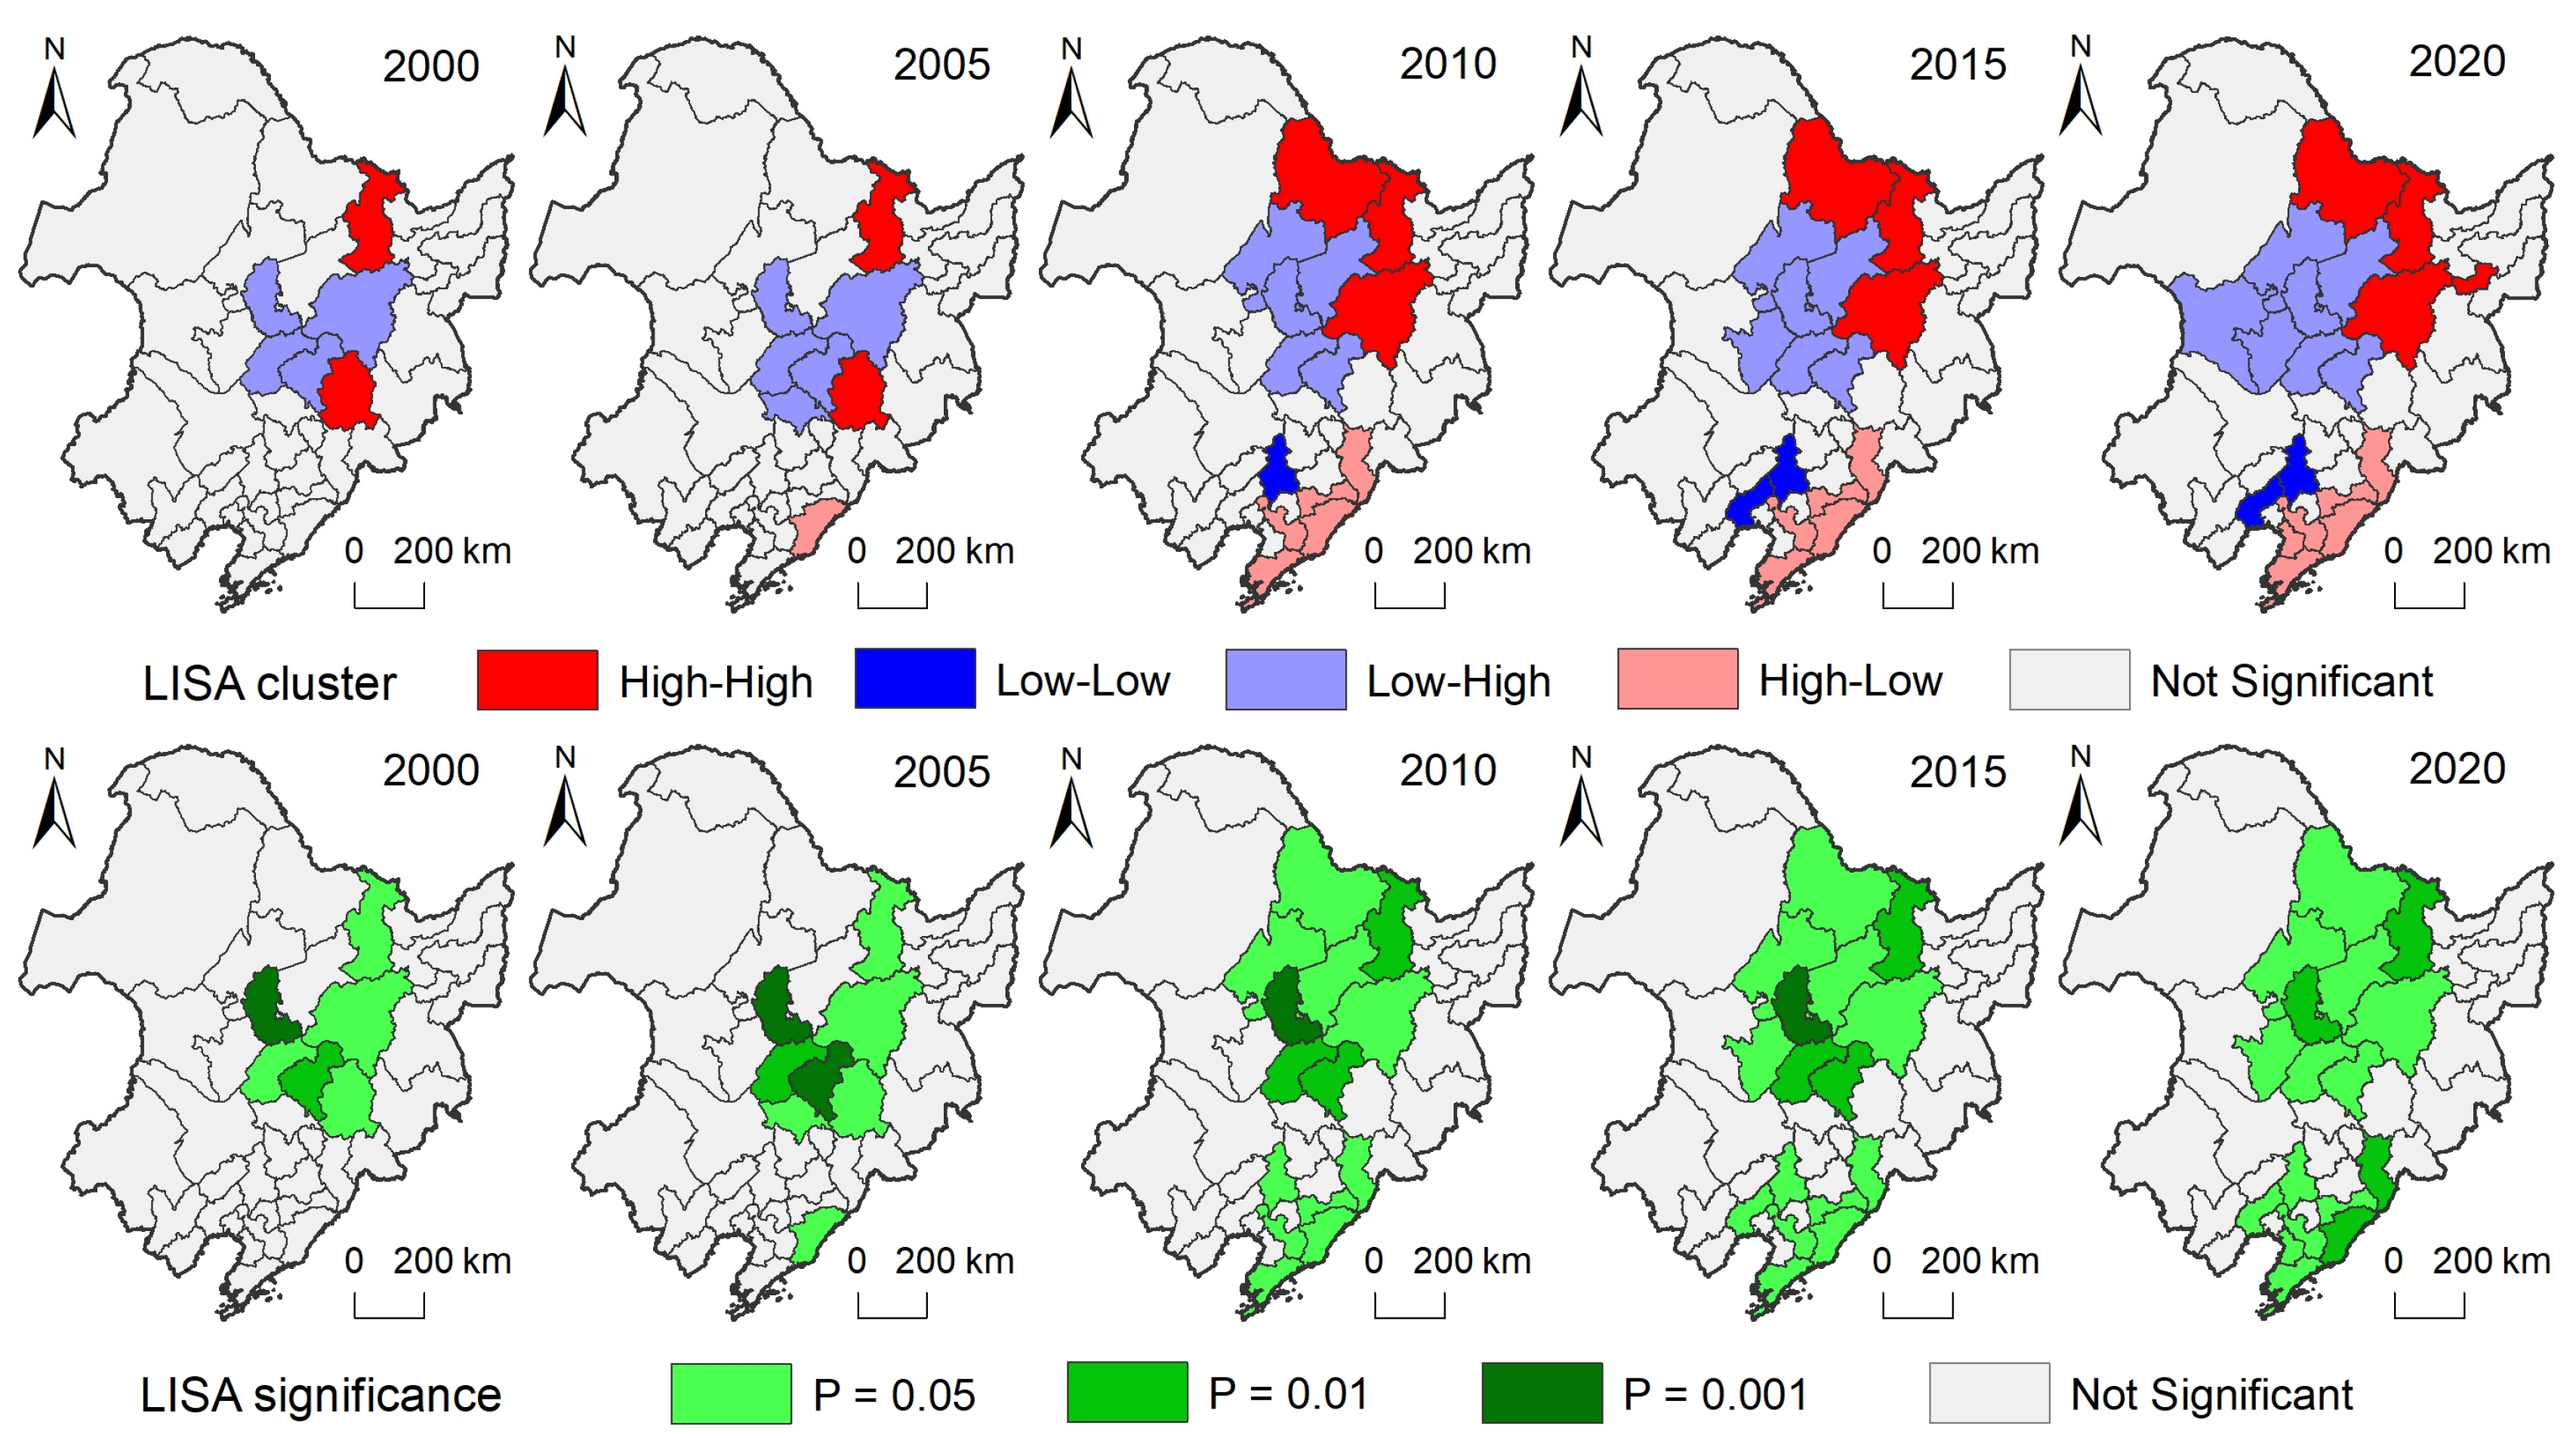
3.2.2. Spatial Interaction Pattern

The spatial autocorrelation results show that there is a negative spatial correlation of grain production and CNPP, and Moran’s I changed from −0.217 in 2000 to −0.154 in 2020 (Table 3). This indicates a shift from trade-off status to synergistic development between grain production and cropland productivity during the study period. The results showed that the distribution pattern of clustering types of grain production and CNPP was stable overall (Figure 7). The High-High and Low-High patterns gradually expanded, while the High-Low and Low-Low patterns appeared and expanded after 2010. Spatially, the Low-High patterns were distributed in the Songnen Plain, while the Low-Low patterns were concentrated in the Lower Liaohe Plain.

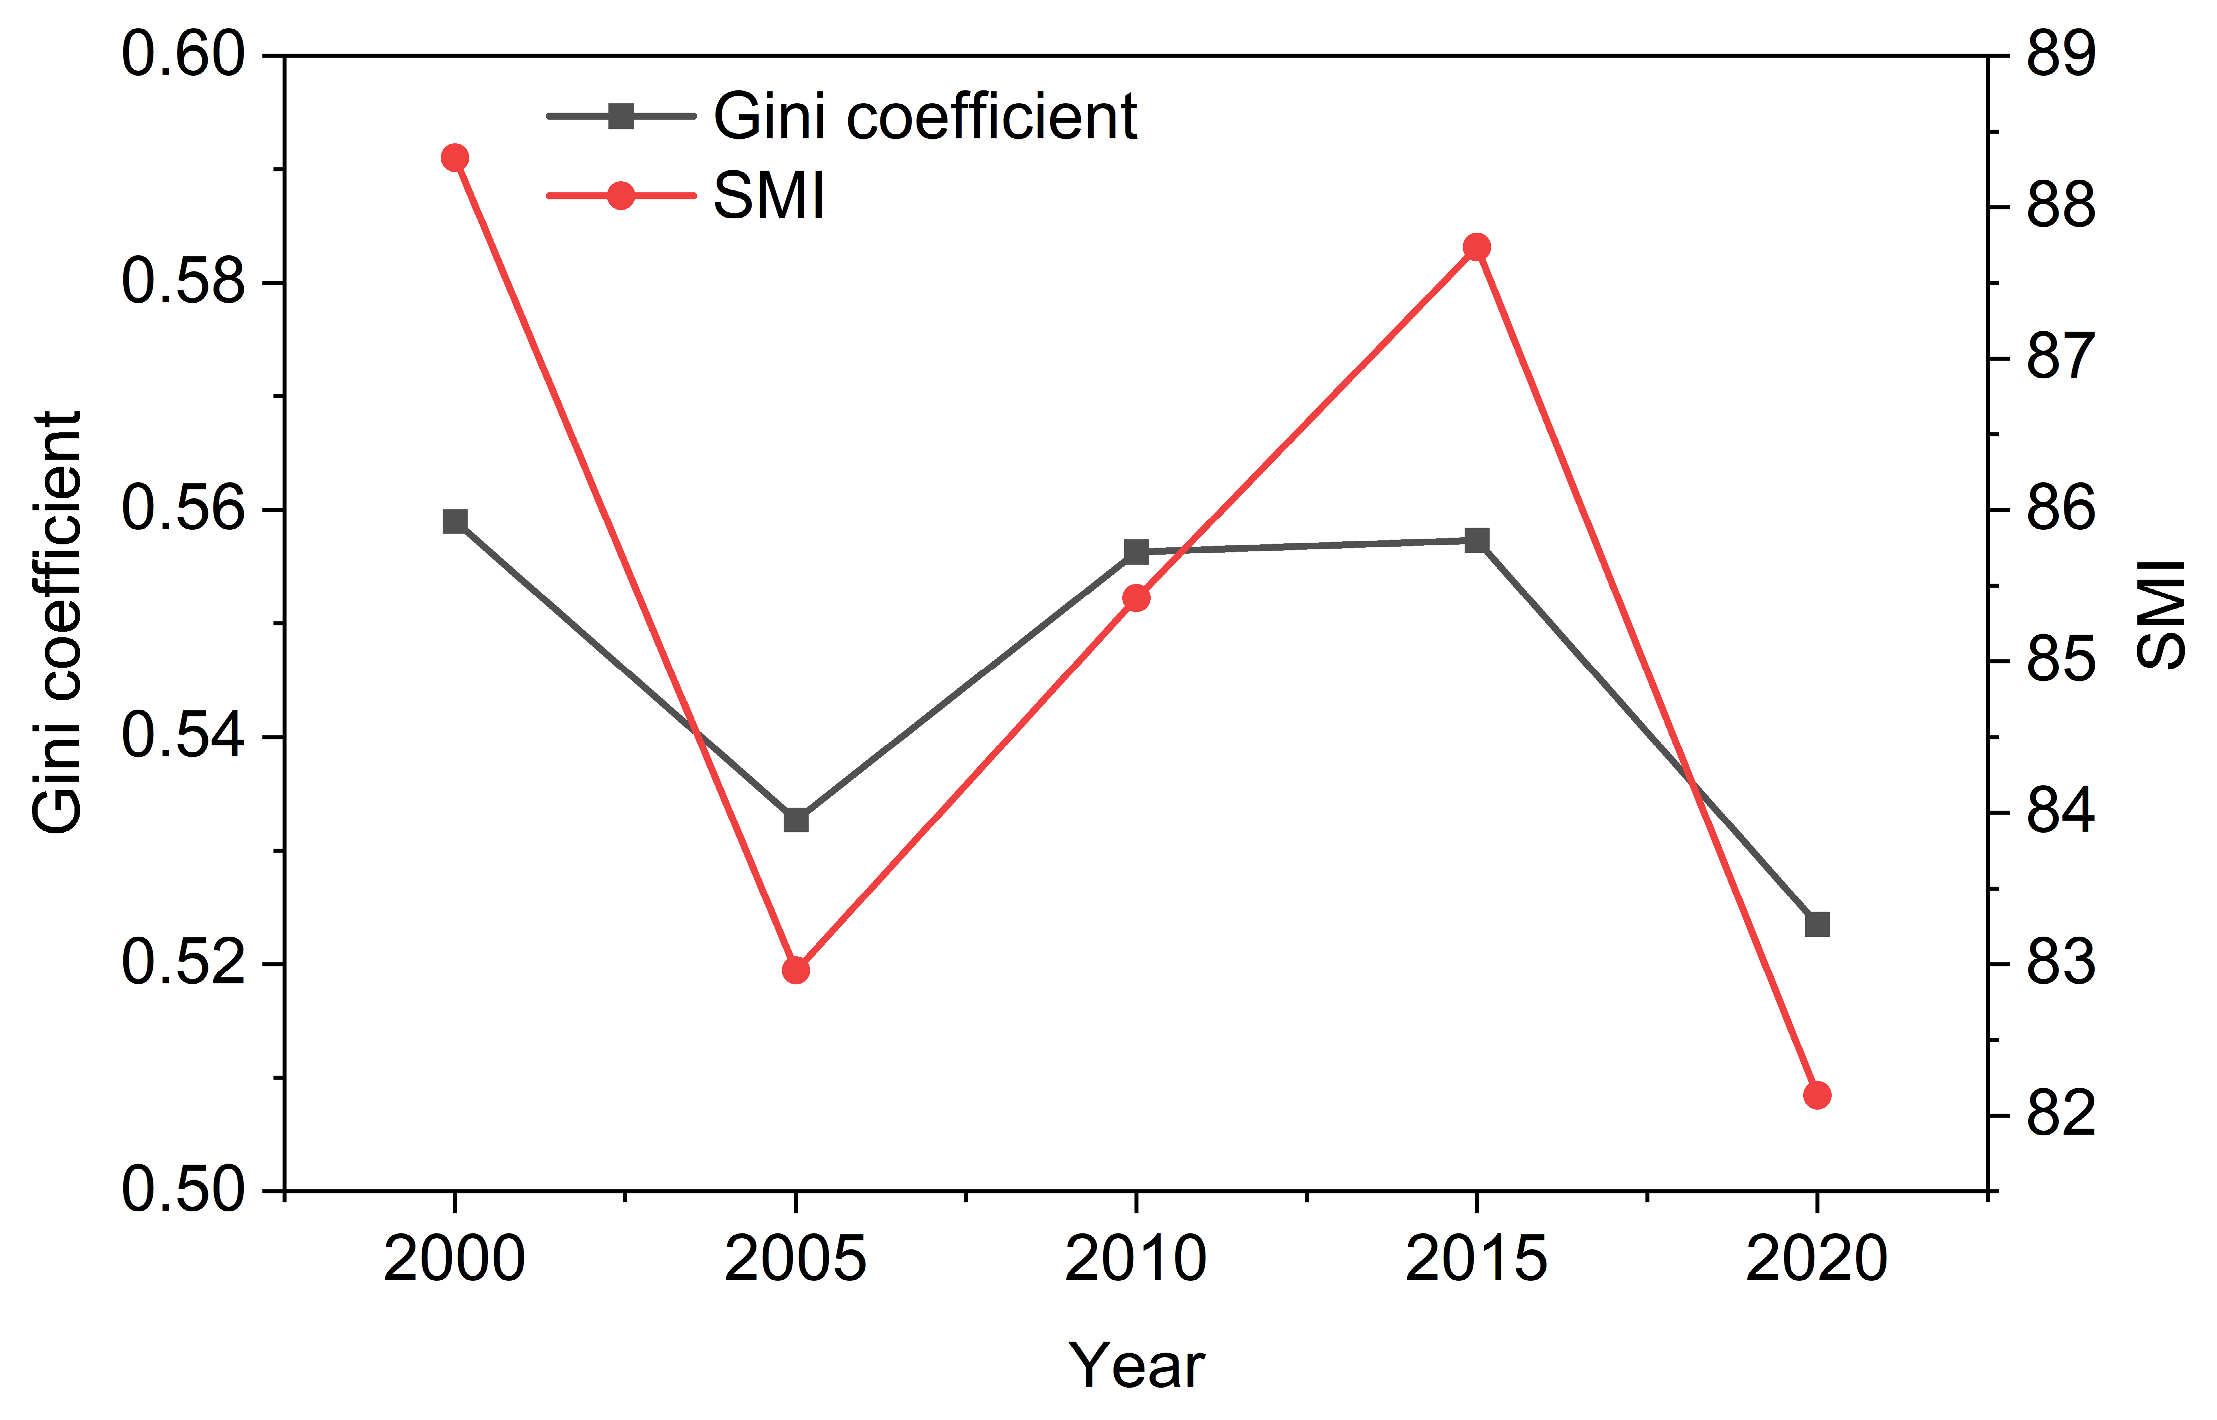
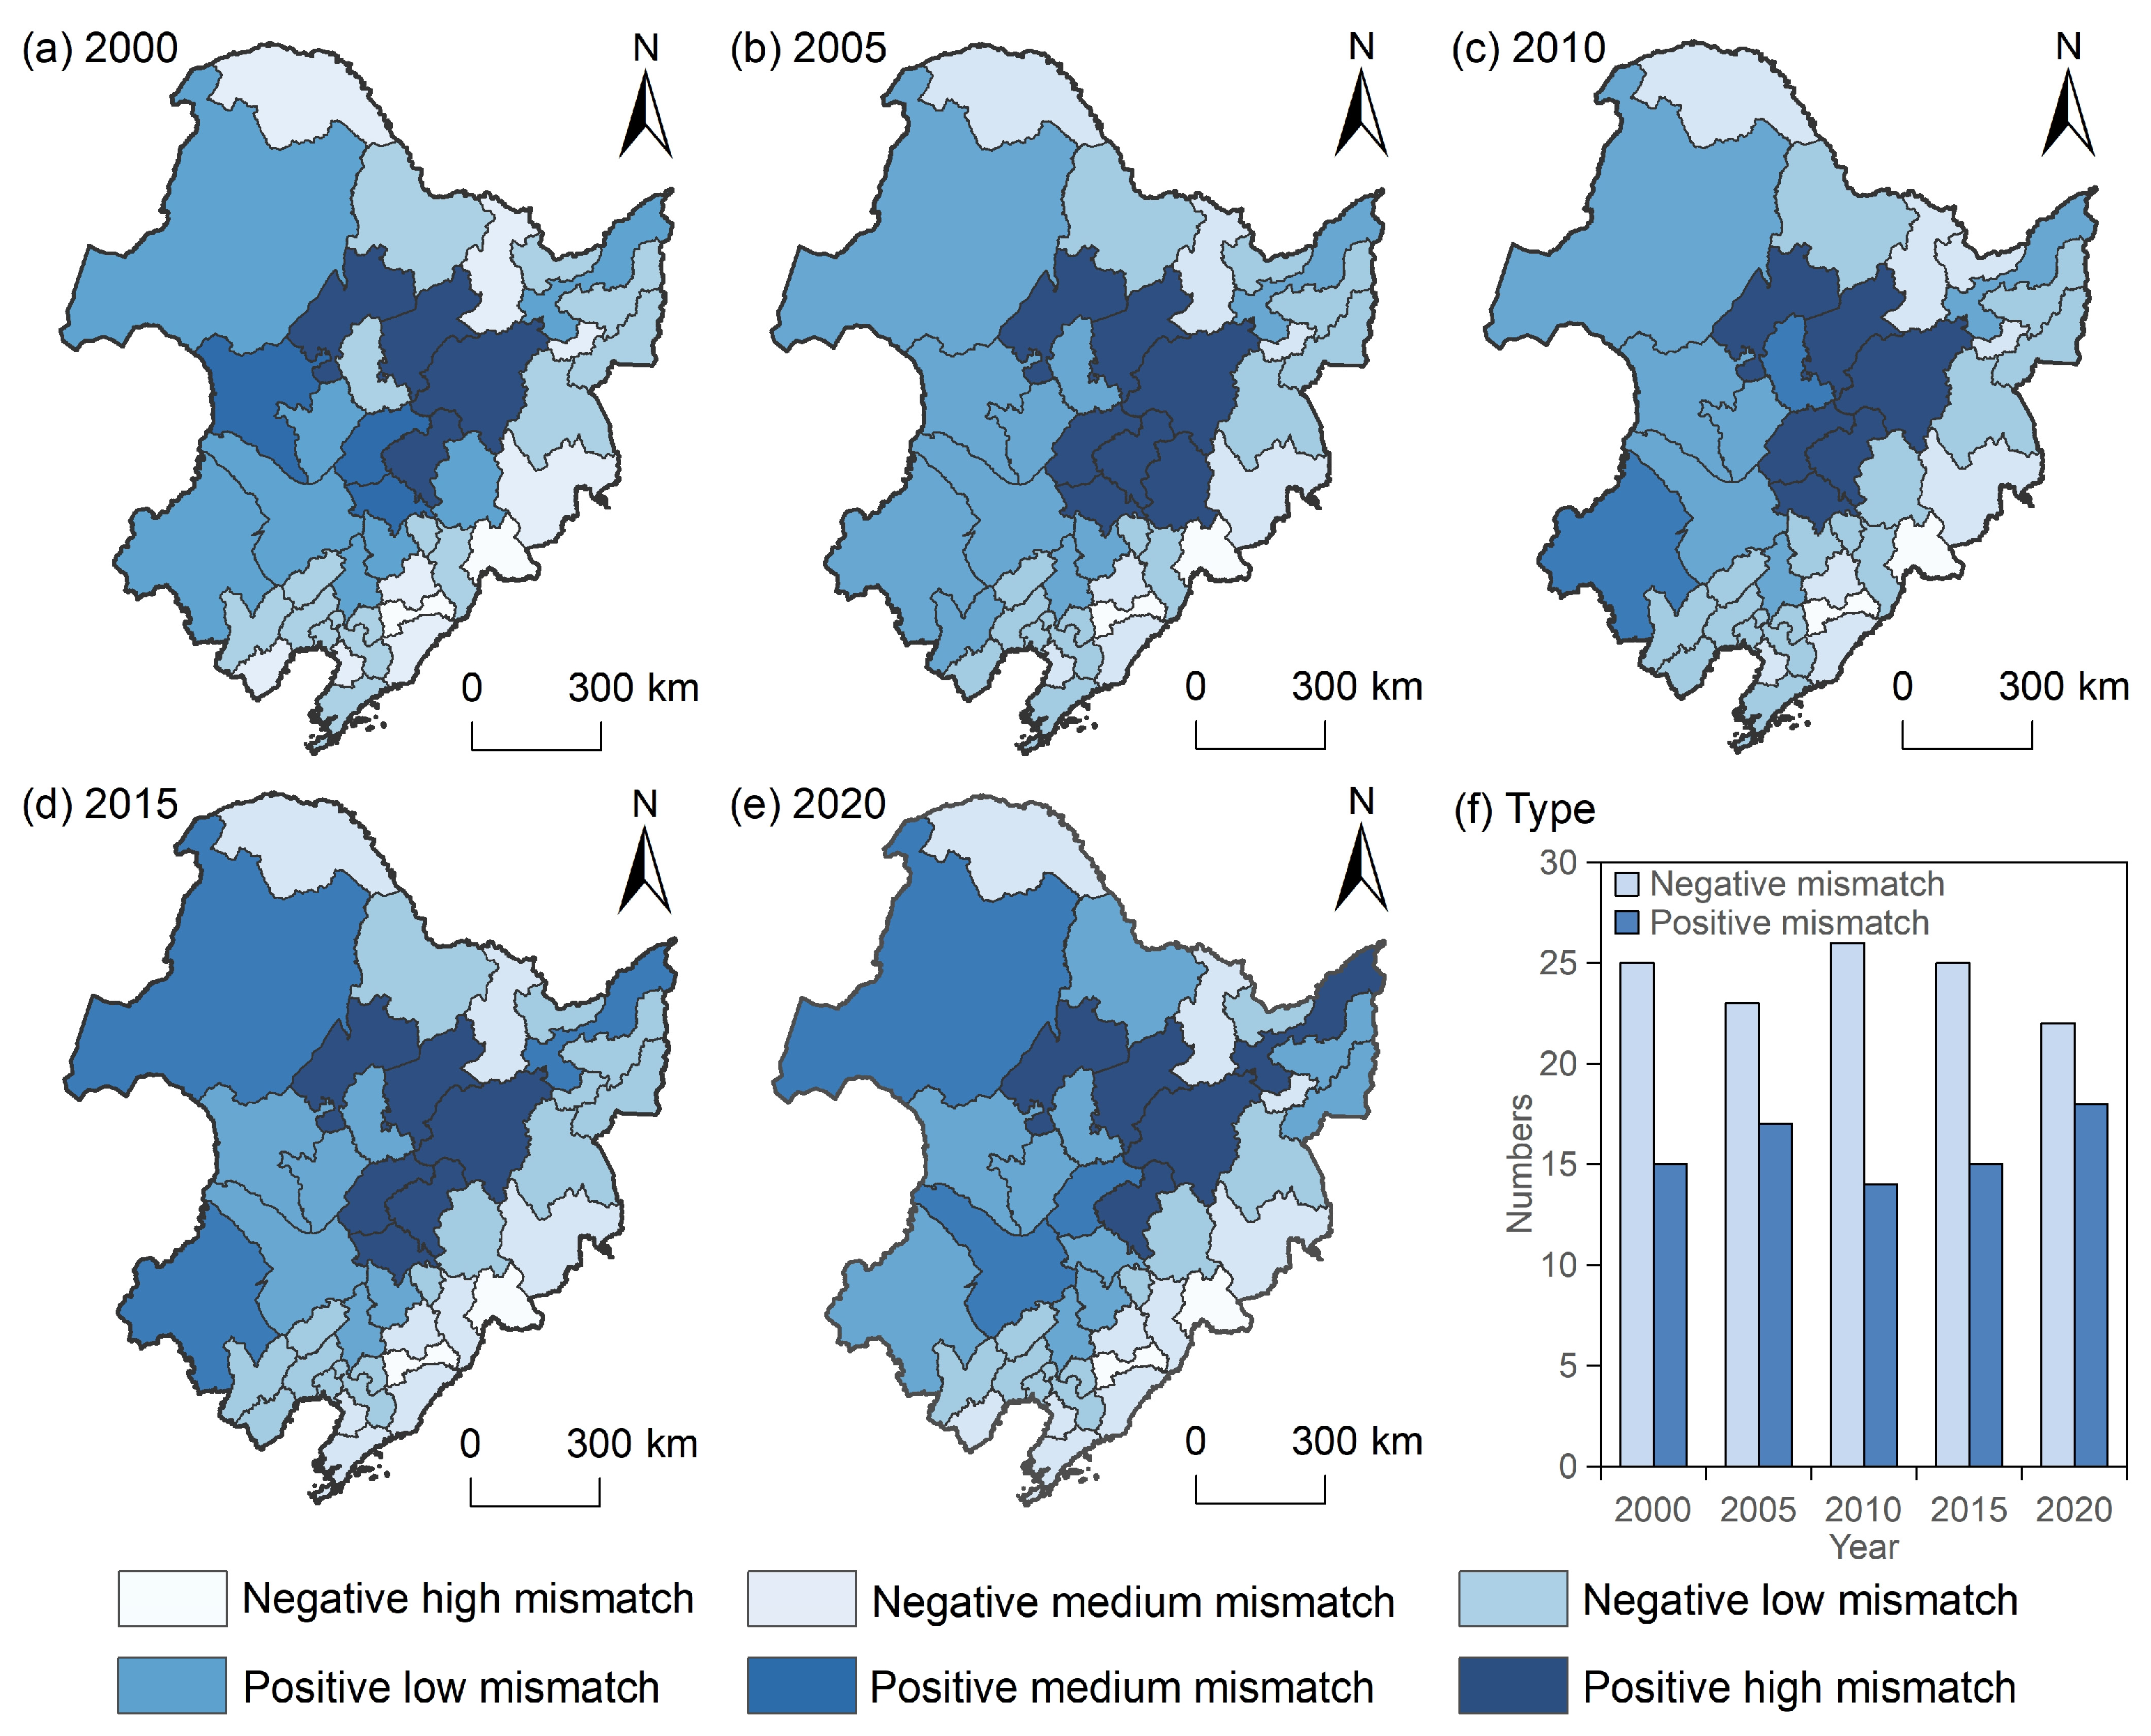
3.2.3. Spatial Mismatch Analysis

As shown in Figure 8, the SMI and Gini coefficients fluctuated during the study period, with consistent trends, indicating the instability in the imbalance of grain production and cropland productivity.
The resulting spatial mismatch types show little quantitative change (Figure 9), with a decrease in negative mismatch cities and an increase in positive mismatch cities, indicating that the increase and spatial changes in grain production and CNPP from 2000 to 2020 have led to an increase in the fitness of the food and land complex system, which has tended to be relatively harmonized on the whole. Spatially, the spatial–temporal pattern of the spatial mismatch of grain production and CNPP was stable. Specifically, the positive mismatch regions are dominated by the Songnen Plain, which is enriched by centralized and contiguous cropland resources and has higher quality cropland, resulting in higher grain production than other regions. Negative mismatch regions are dominated by the Liaodong regions of the Changbai Mountains and the Lesser Khingan, where topography, agricultural production conditions, and other factors limit grain production, but the stability of cropland ecosystems is higher.
The results in Table 4 show that there are seven cities where the SMI shifted during 2000–2020. Specifically, they can be categorized into three types: the first type is that the SMI shifted from negative → positive, including the four cities of Jixi, Shuangyashan, Daqing, and Heihe, where grain production growth was relatively more rapid than the increase in CNPP. The second type is that the SMI changed from positive → negative, and the increase in grain production and CNPP were relatively synergistic in Jilin City. The third type is the transformation pattern of the SMI showing “negative → positive → negative”; grain production in Tieling City is in stable growth, but the CNPP shows a fluctuation change of “increase-decrease-increase”, which makes the SMI undergo a fundamental transition.

3.3. Spatial–Temporal Heterogeneity of Influencing Factors on Spatial Mismatch

3.3.1. Model Selection and GTWR Regression Results

According to the data in Table 5, the R2 of GTWR is 0.981, suggesting that the regression performance obtained from the GTWR model exhibits superior performance compared to the ordinary least square regression (OLS) model and marginally outperforms the geographically weighted regression (GWR) model.
The statistical analysis of the regression findings from the GTWR model is presented in Table 6, revealing a positive association between grain crop area, agricultural labor, fertilizer application, and average annual temperature with the spatial mismatch. Conversely, the urbanization rate, per capita GDP, per capita cropland area, and average annual precipitation have a negative impact on the spatial mismatch. In addition, the statistical results found that the influence degree of each factor to the spatial mismatch in different regions varied significantly, which needs to be further explored for spatiotemporal heterogeneity and prediction–response relationship.

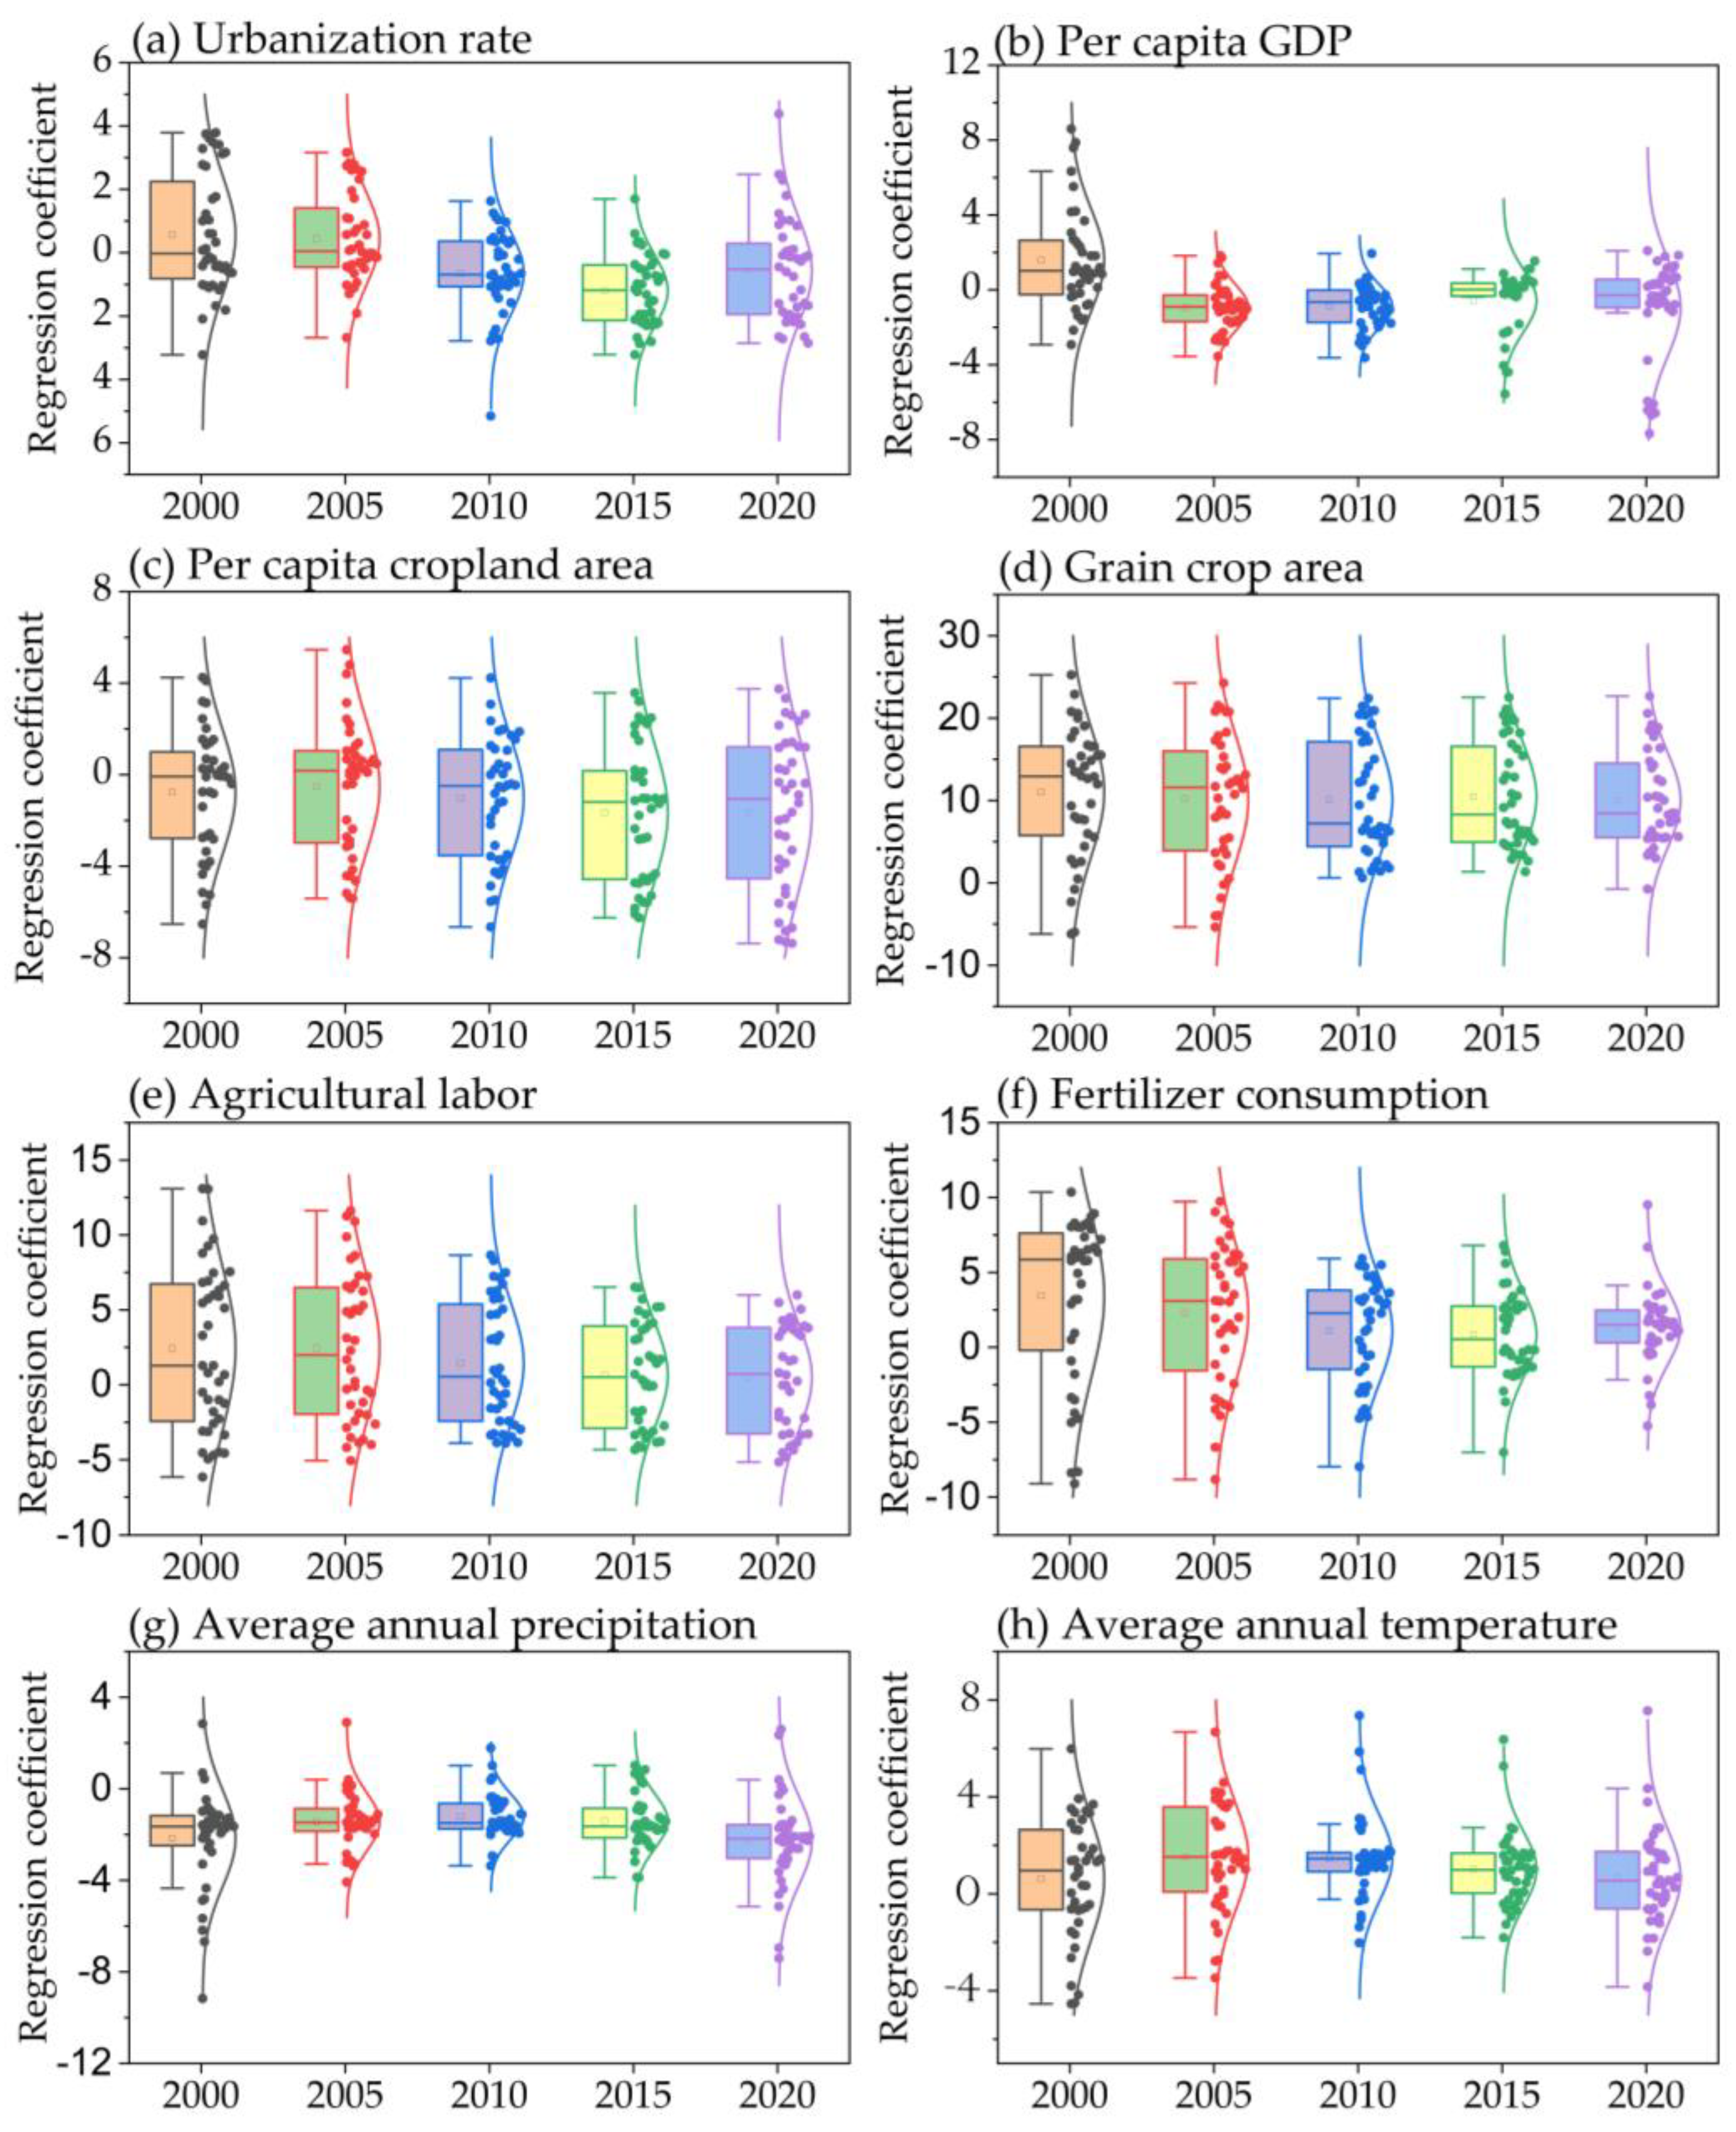
3.3.2. Changes in Influencing Factors over Time

The GTWR model was utilized to analyze the temporal changes in influencing factors on the spatial mismatch, and box plots were generated for each regression coefficient (Figure 10). The results showed that influencing factors on the spatial mismatch have time–response effects during the study period. Specifically, the coefficients of per capita cropland area and grain crop area show relatively stable trends, the coefficients of urbanization rate, per capita GDP, agricultural labor, and fertilizer application generally show a decreasing trend, and average annual precipitation and average annual temperature firstly increase and then tend to be stable over time.

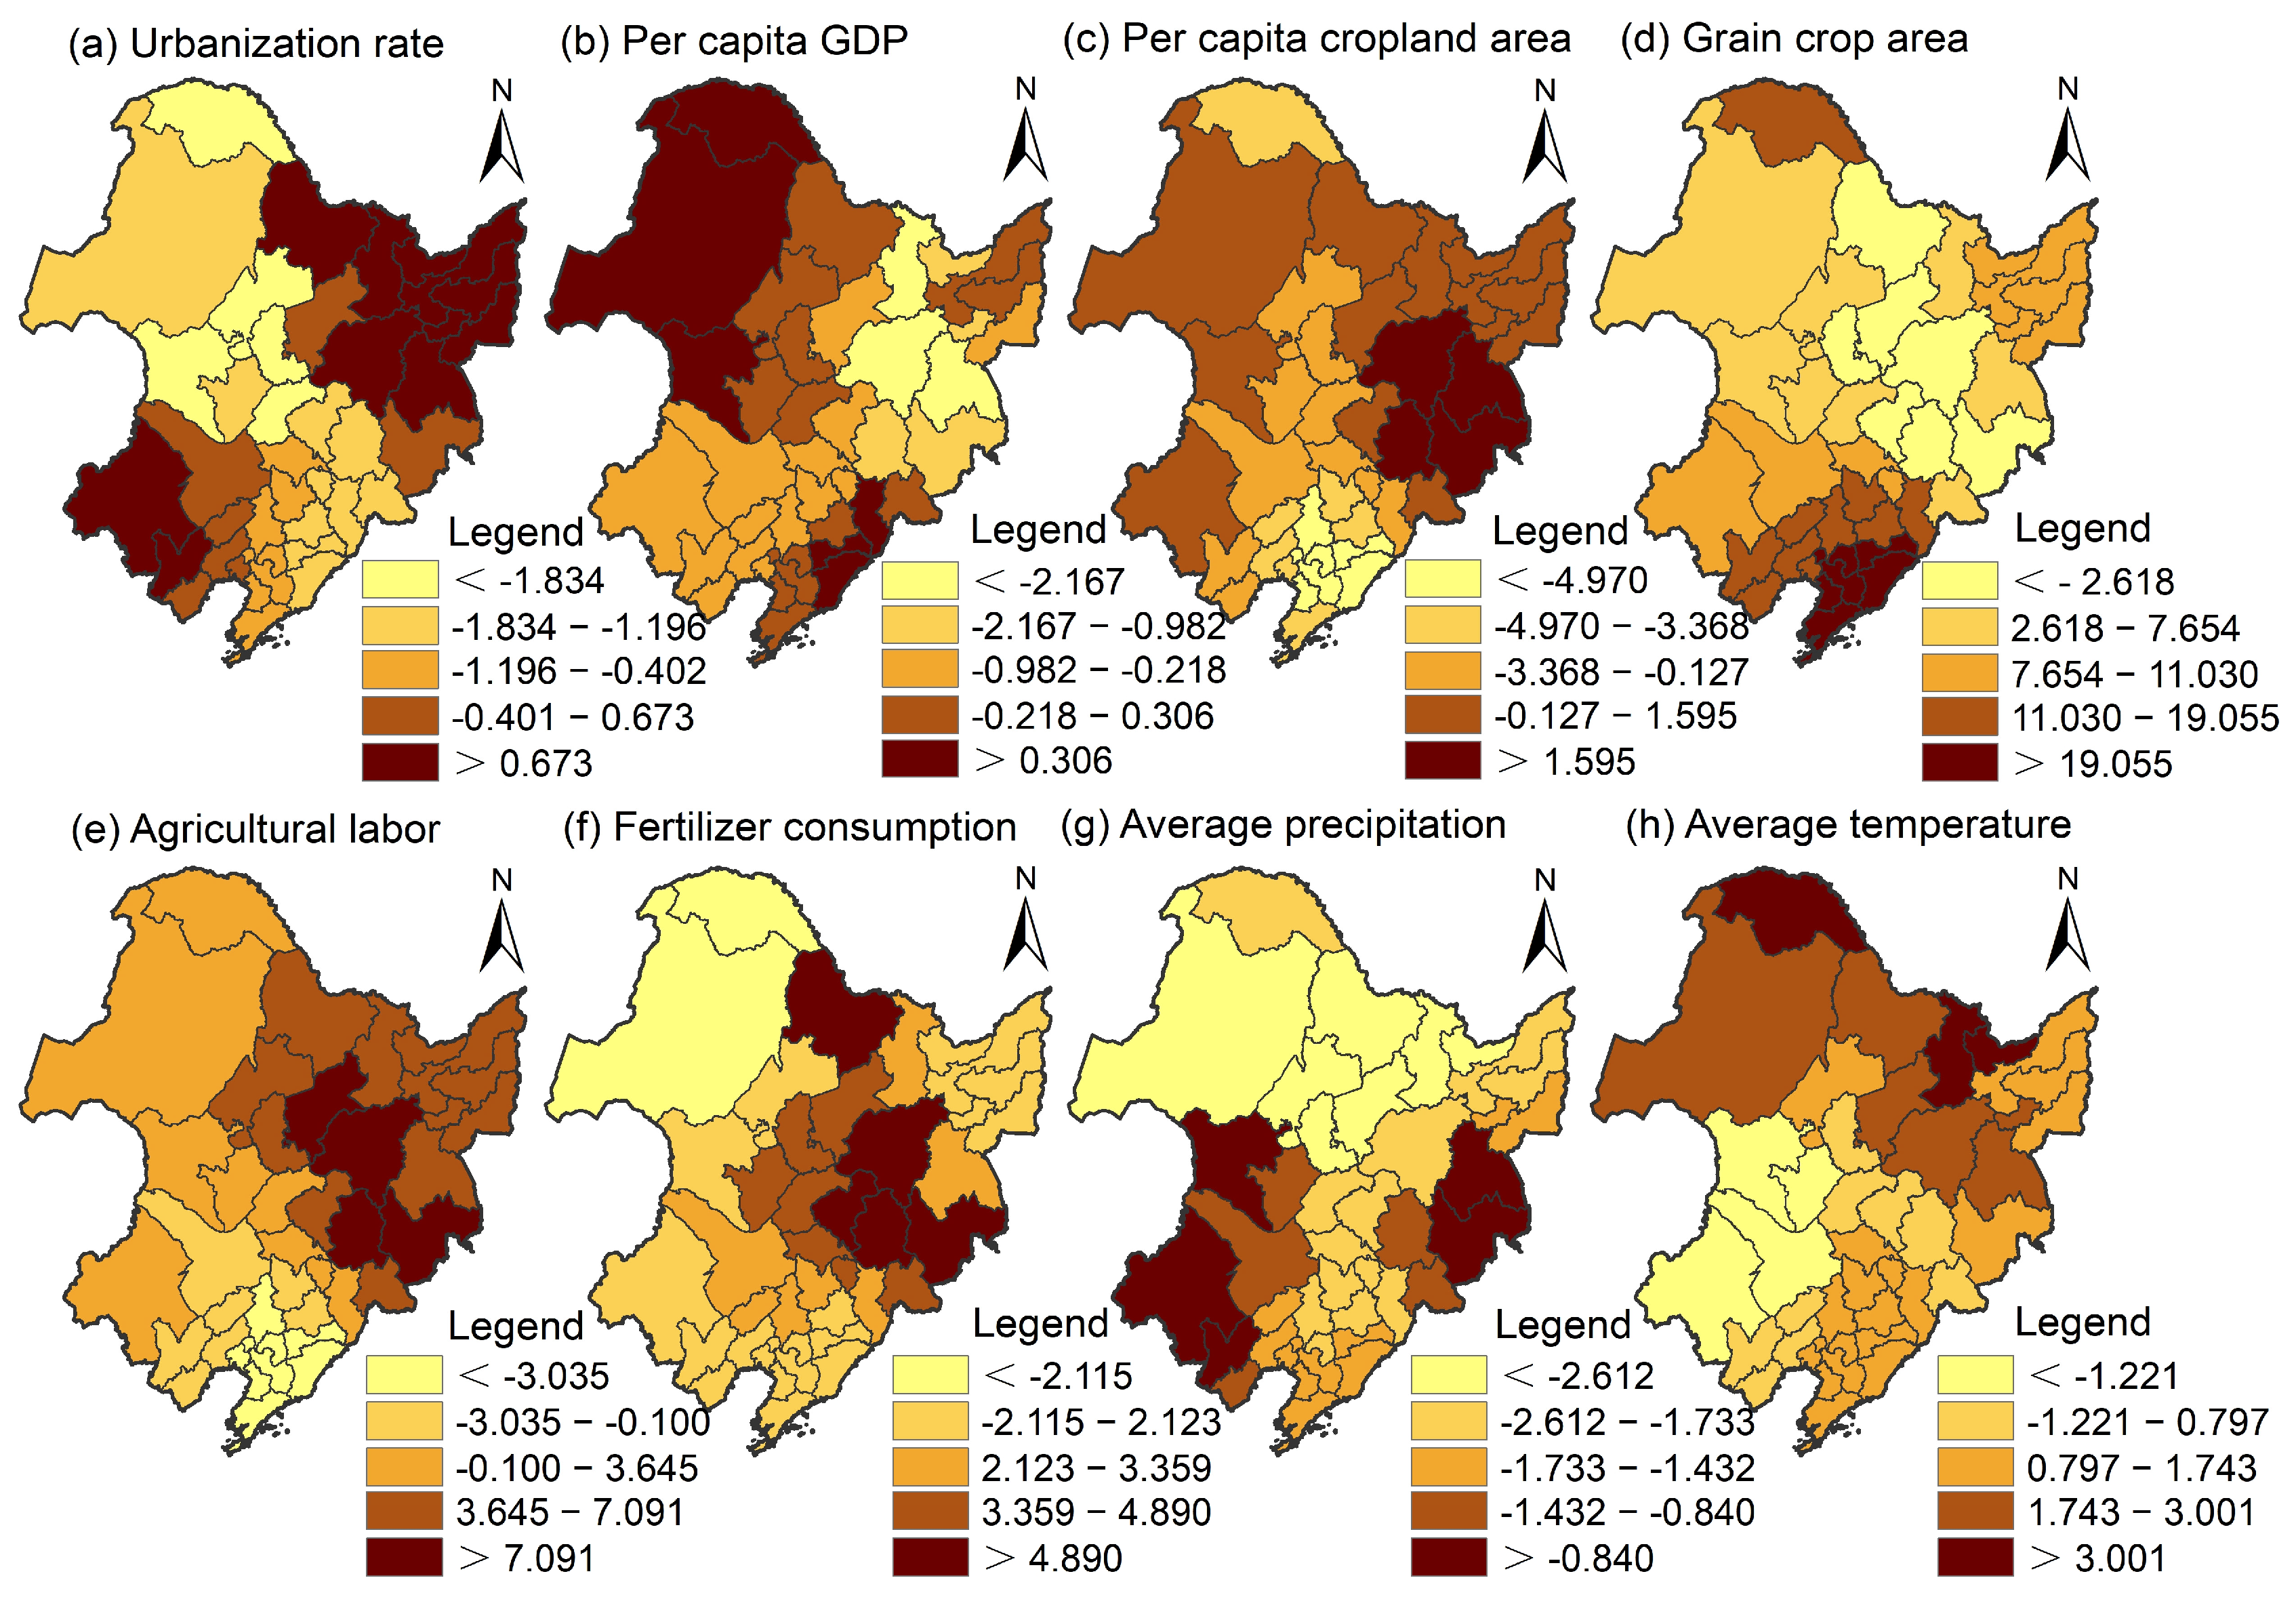
3.3.3. Spatial Heterogeneity of Influencing Factors

Based on the GTWR model results, the spatial visualization of average regression coefficients for eight influencing factors is shown (Figure 11). It can be found that the influencing factors of the spatial mismatch of grain production and CNPP have significant spatial heterogeneity. The spatial non-stationarity of influencing factors can be interpreted as follows:
The impact of the urbanization rate on the spatial mismatch exhibited a positive association in the southwest and northeast regions, while displaying a negative correlation in most other regions. The positive influence of per capita GDP on the spatial mismatch was observed in the northwest and southeast regions. The positive impact of per capita cropland area on spatial mismatch was found to be significant in the northeast region, mainly due to cropland expansion, which enhanced grain productivity in the Songnen Plain and Sanjiang Plain during the study period.
Spatially, the positive impacts of grain crop area and fertilizer application on spatial mismatch were significant, while the spatial distribution of positive and negative effects of agricultural labor exhibited a relatively balanced pattern. The coefficient of the grain crop area was positive in most regions, mainly concentrated in Inner Mongolia. The regression coefficient of agricultural labor was negative in Liaoning Province, while these regions showed a significant positive spatial mismatch. The fertilizer application coefficient was positive in Songnen Plain and Sanjiang Plain, indicating that there was a promotion effect on grain production increase and cropland productivity improvement during the study period.
The impact of natural environmental factors on spatial mismatch was as follows. The average annual precipitation and average annual temperature showed different influencing directions in the study area. Specifically, the coefficient of average precipitation was negative, indicating a significant inhibition of the spatial mismatch of CNPP and grain production. The regression coefficient of the average temperature was negative in the southwest and positive in other regions, indicating that it has a significant impact on the spatial mismatch.

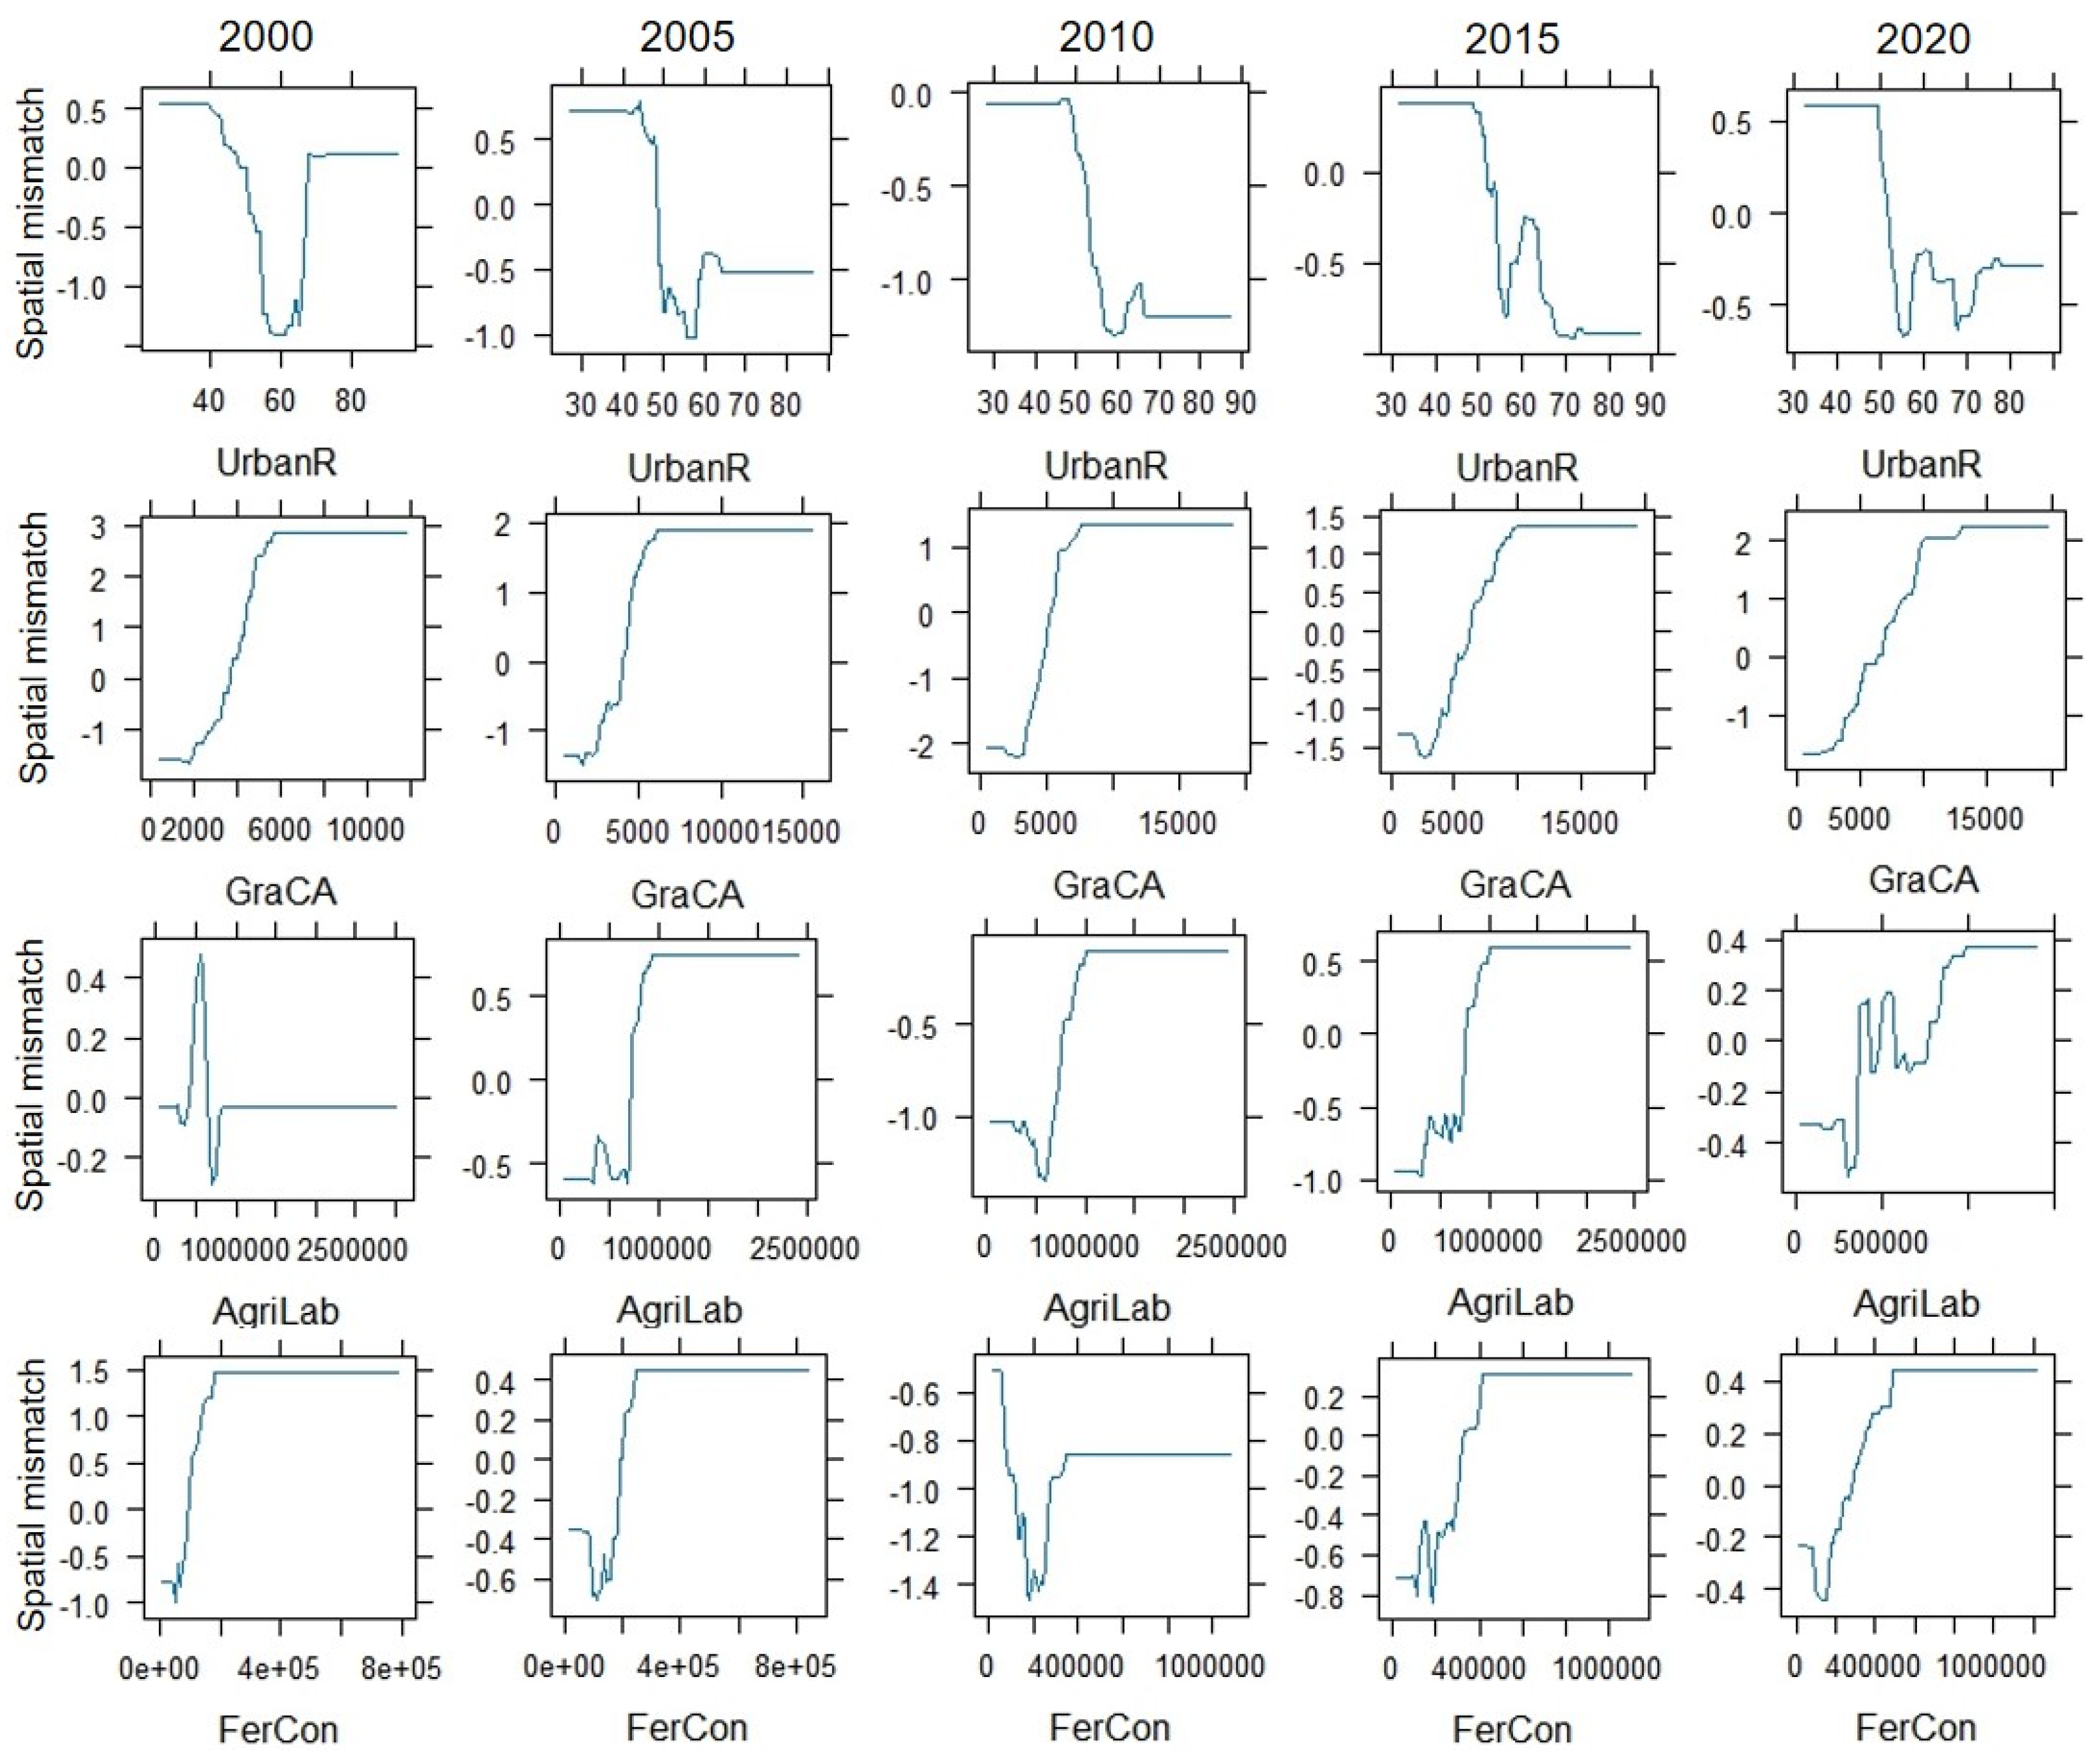
3.4. Predictor–Response Relationships of Influencing Factors on Spatial Mismatch

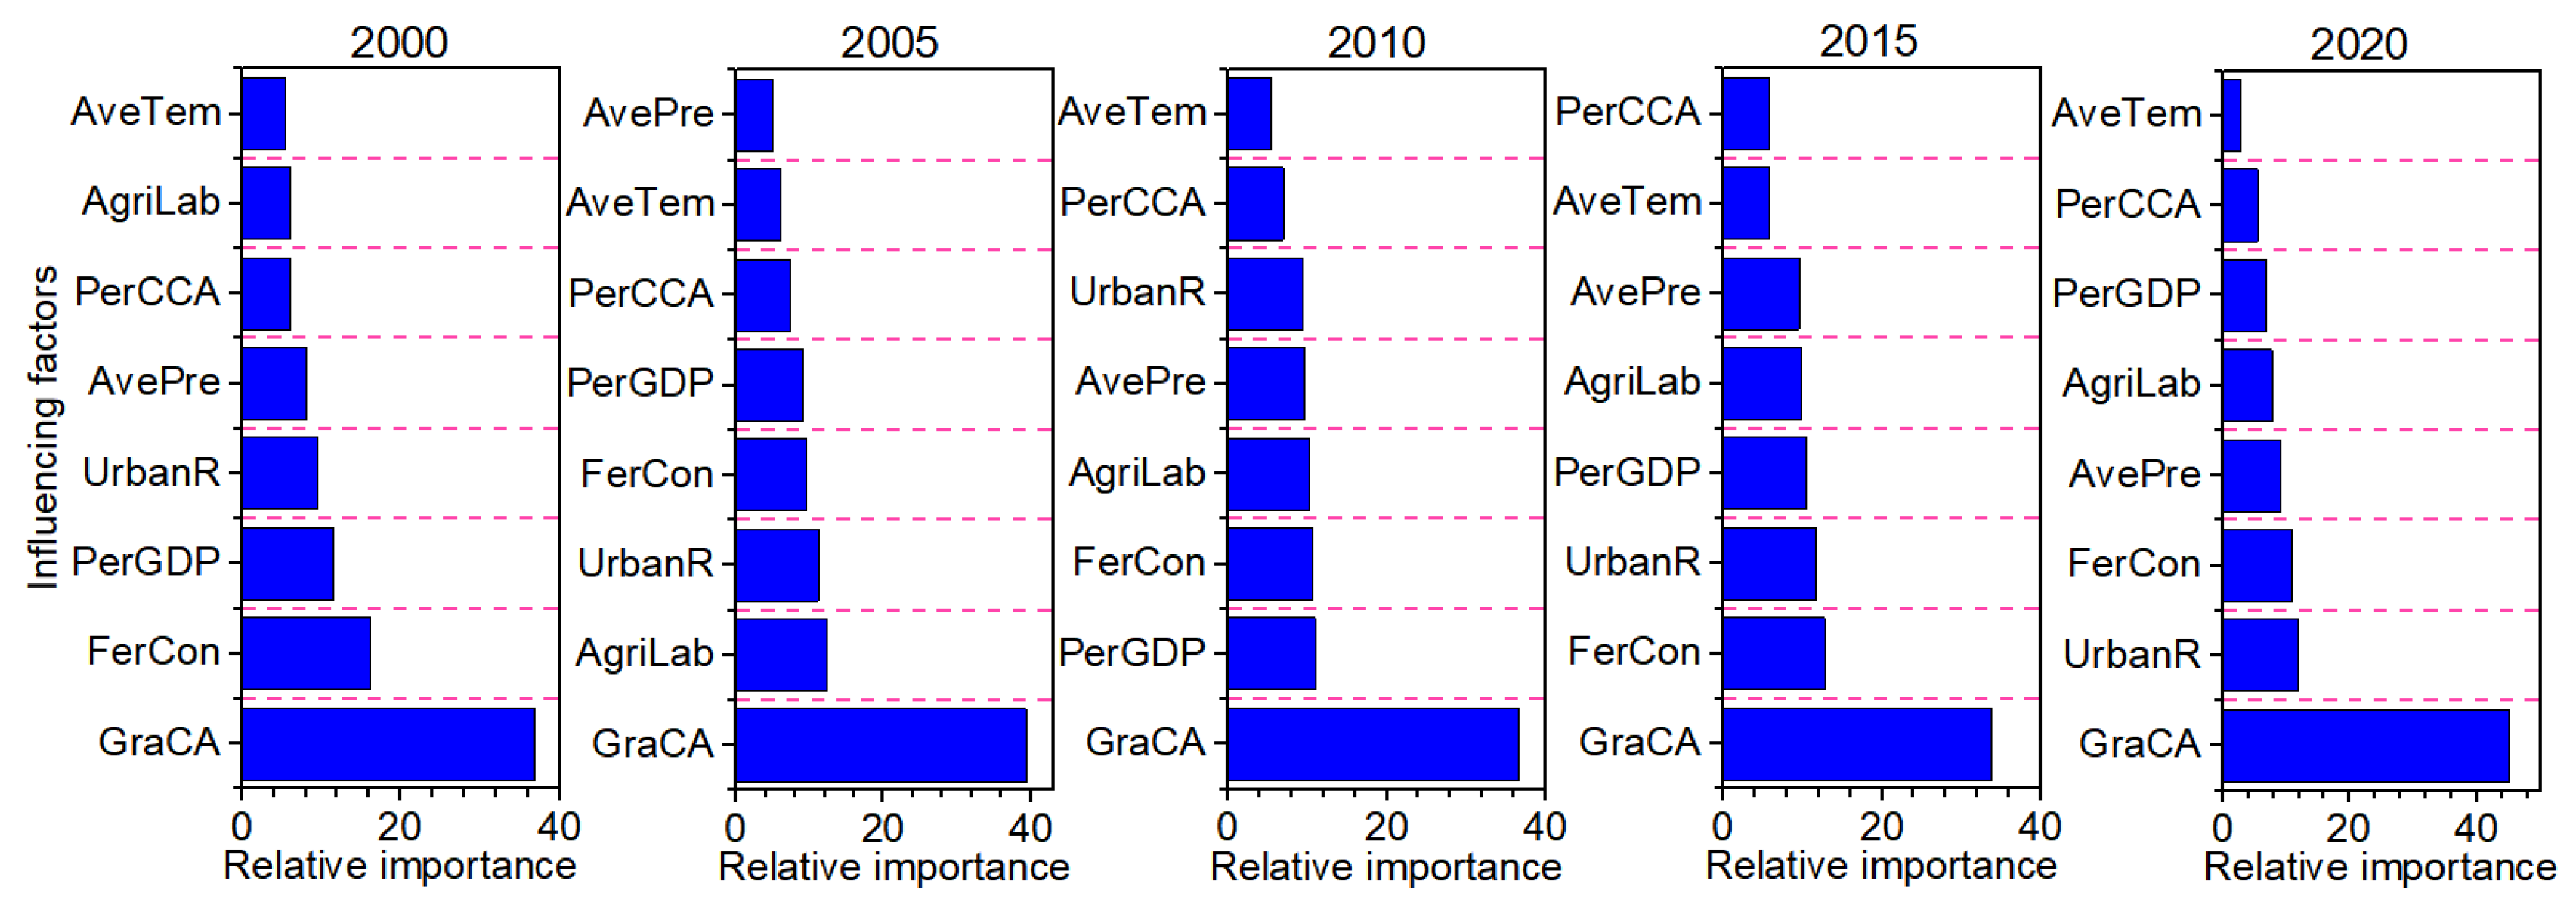
3.4.1. Relative Importance of Influencing Factors

The BRT algorithm was further used to capture the relative importance and nonlinear prediction–response relationship of influencing factors at different periods to fill the gaps in related studies. The relative importance analysis results showed the different contribution of each influencing factor to the spatial mismatch in the five periods (Figure 12). The relative importance of the grain crop area ranked at the top among the eight influencing factors, with relative importance values of 36.87%, 39.36%, 36.55%, 33.84%, and 45.08% in 2000, 2005, 2010, 2015, and 2020, respectively, which is much larger than the other factors, and played a key role in the spatial mismatch of grain and cropland productivity. The relative importance of the urbanization rate, agricultural labor, fertilizer application, and per capita GDP also ranked very highly, but with differences in the specific rankings of each factor in the five periods. Therefore, considering relative importance and comparative analysis, four key factors common to all five time points were finally determined to analyze the marginal impacts.

3.4.2. Response Relationships of Key Influencing Factors

The partial dependency plot reflects the complex prediction–response relationships between the spatial mismatch and key influencing factors (Figure 13). From the relative impact change graph, the urbanization rate showed a strong negative correlation to the spatial mismatch. The urbanization rate in all years except 2000 led to a decrease in the possibility of the spatial mismatch within a certain range. However, grain crop area, agricultural labor, and fertilizer application showed the opposite law, i.e., with an increase in grain crop area, agricultural labor, and fertilizer application, the probability of the spatial mismatch also increased. Interestingly, compared to grain crop area and agricultural labor, fertilizer application in 2010 showed a strong negative correlation. Meanwhile, the influencing range of fertilizer application in 2000 and 2005 was different from the other years (2015 and 2020). This observed phenomenon may be closely associated with both excessive and insufficient levels of fertilizer application, which can have significant impacts on grain yield and cropland productivity. Overall, there are significant marginal effects of four influencing key factors on the spatial mismatch, and the effects also alternate between positive and negative in different states of factors.

4. Discussion

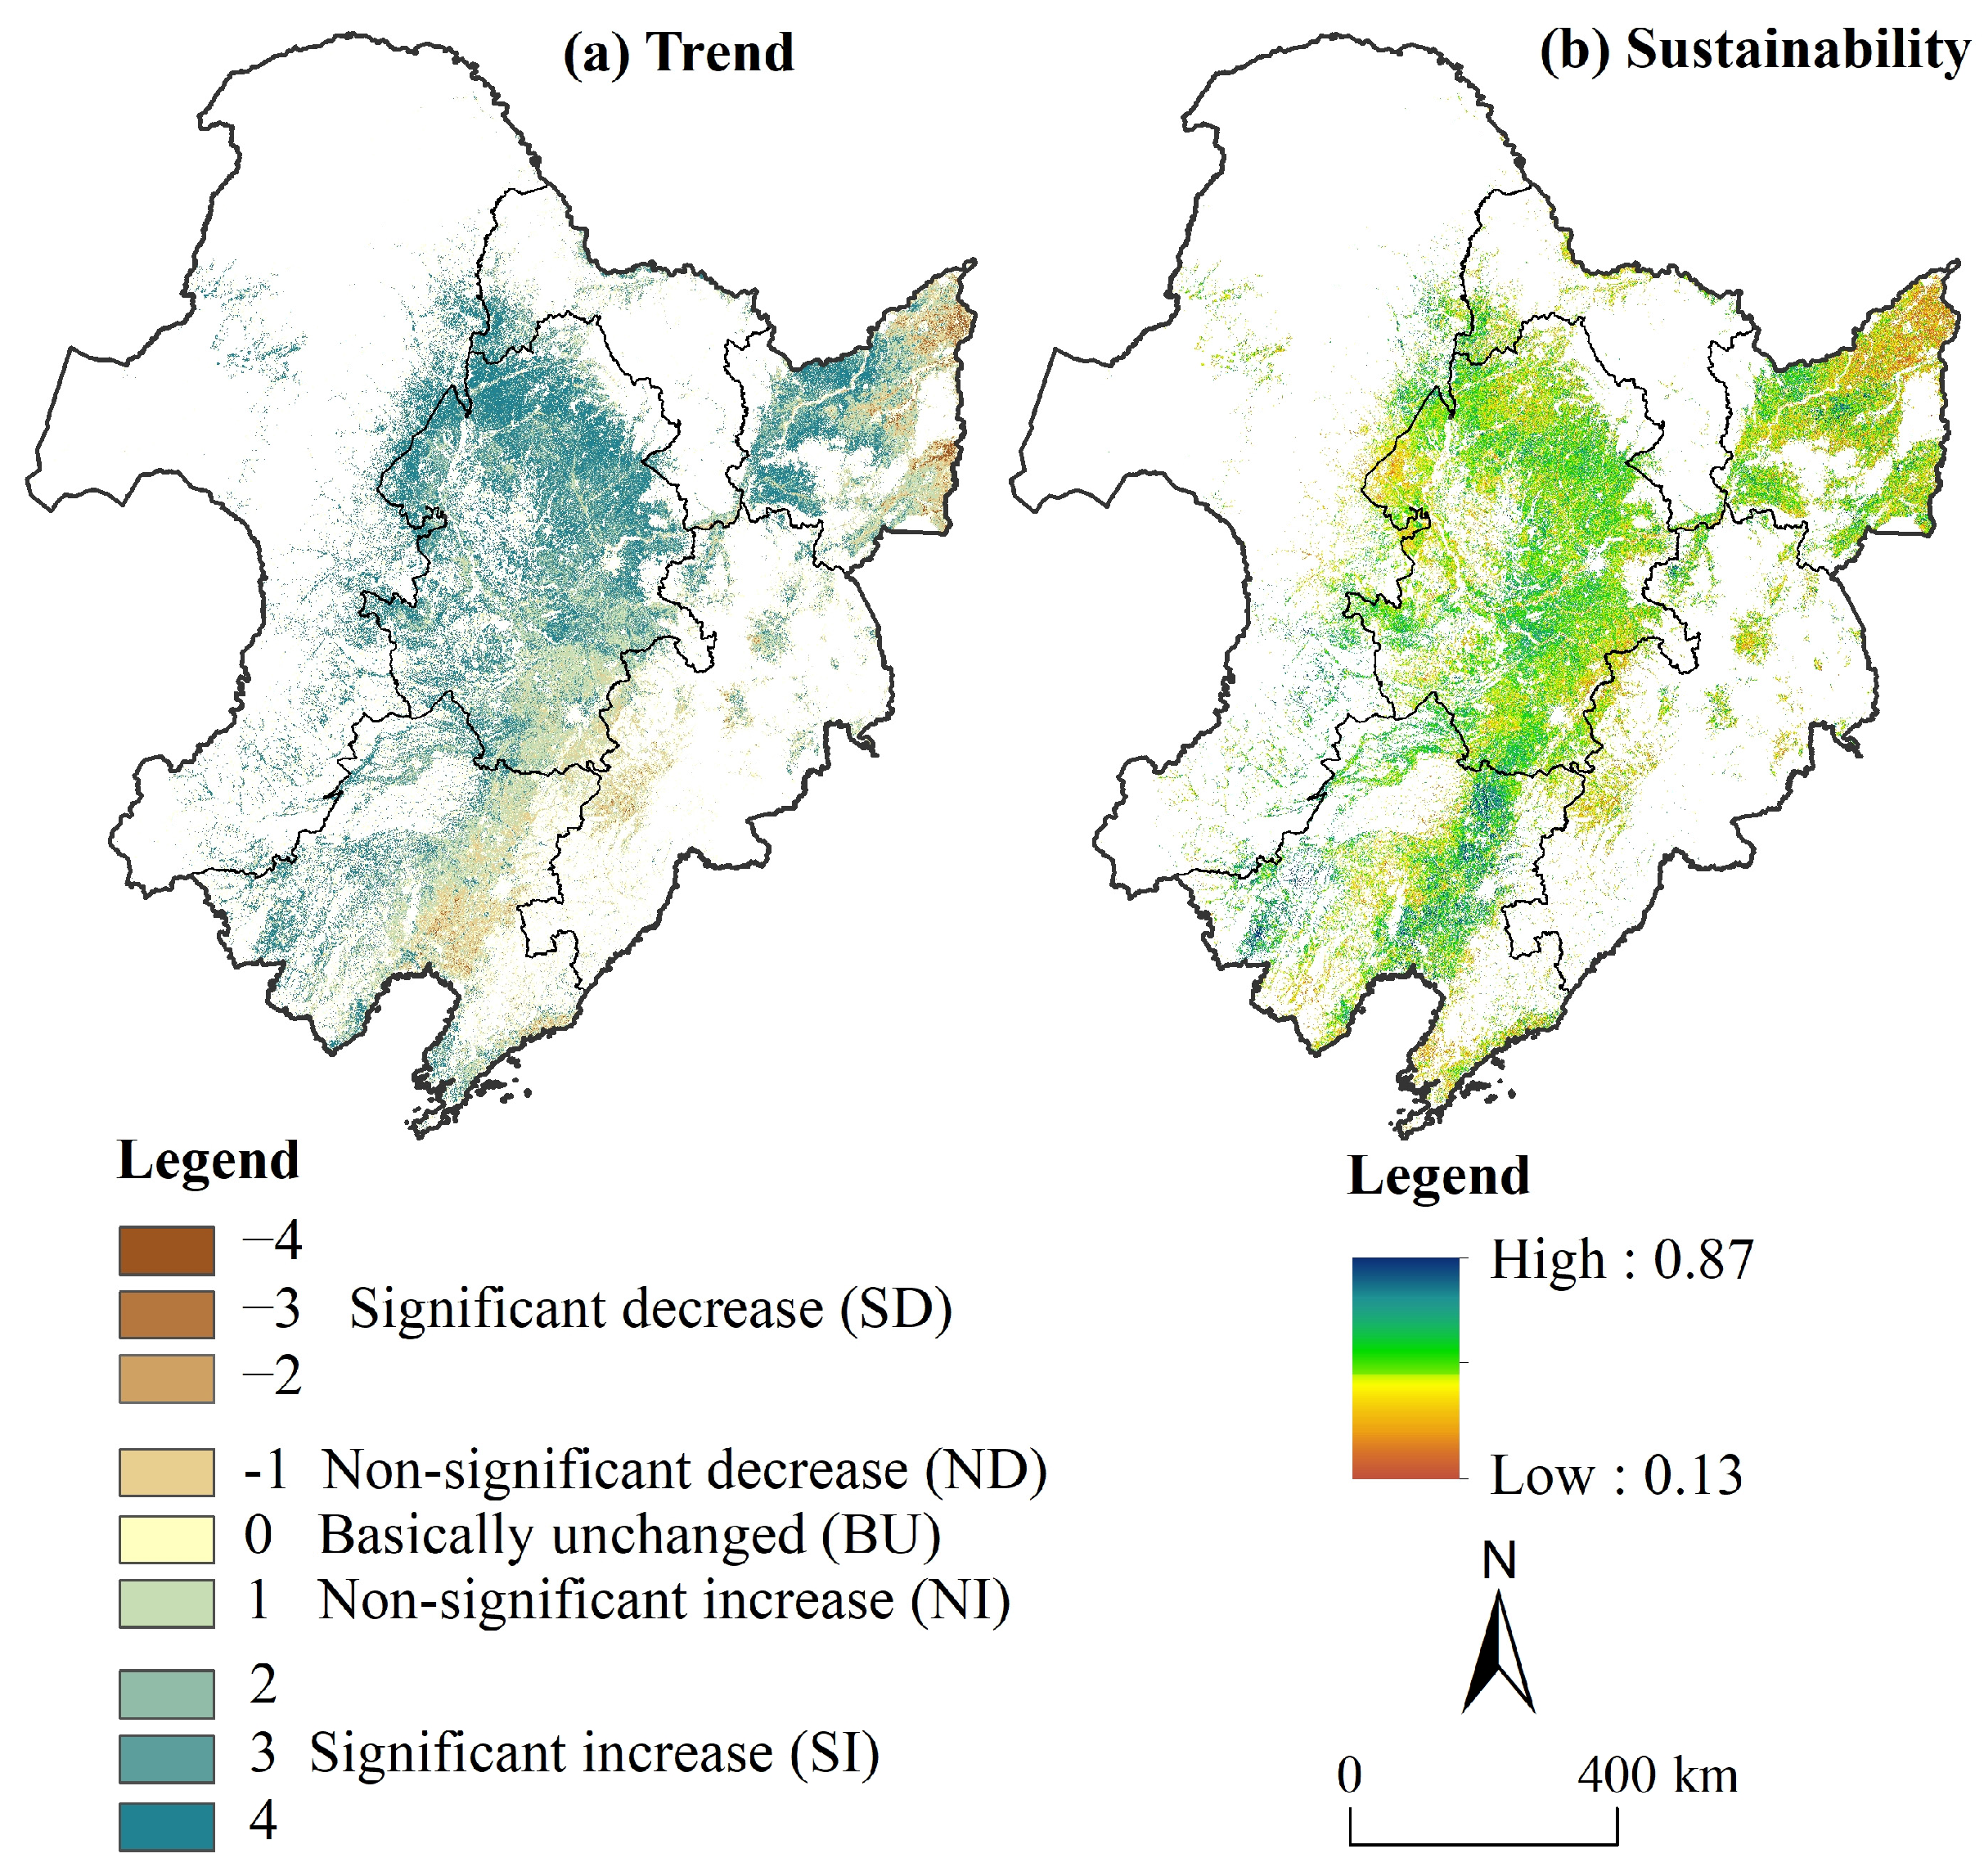
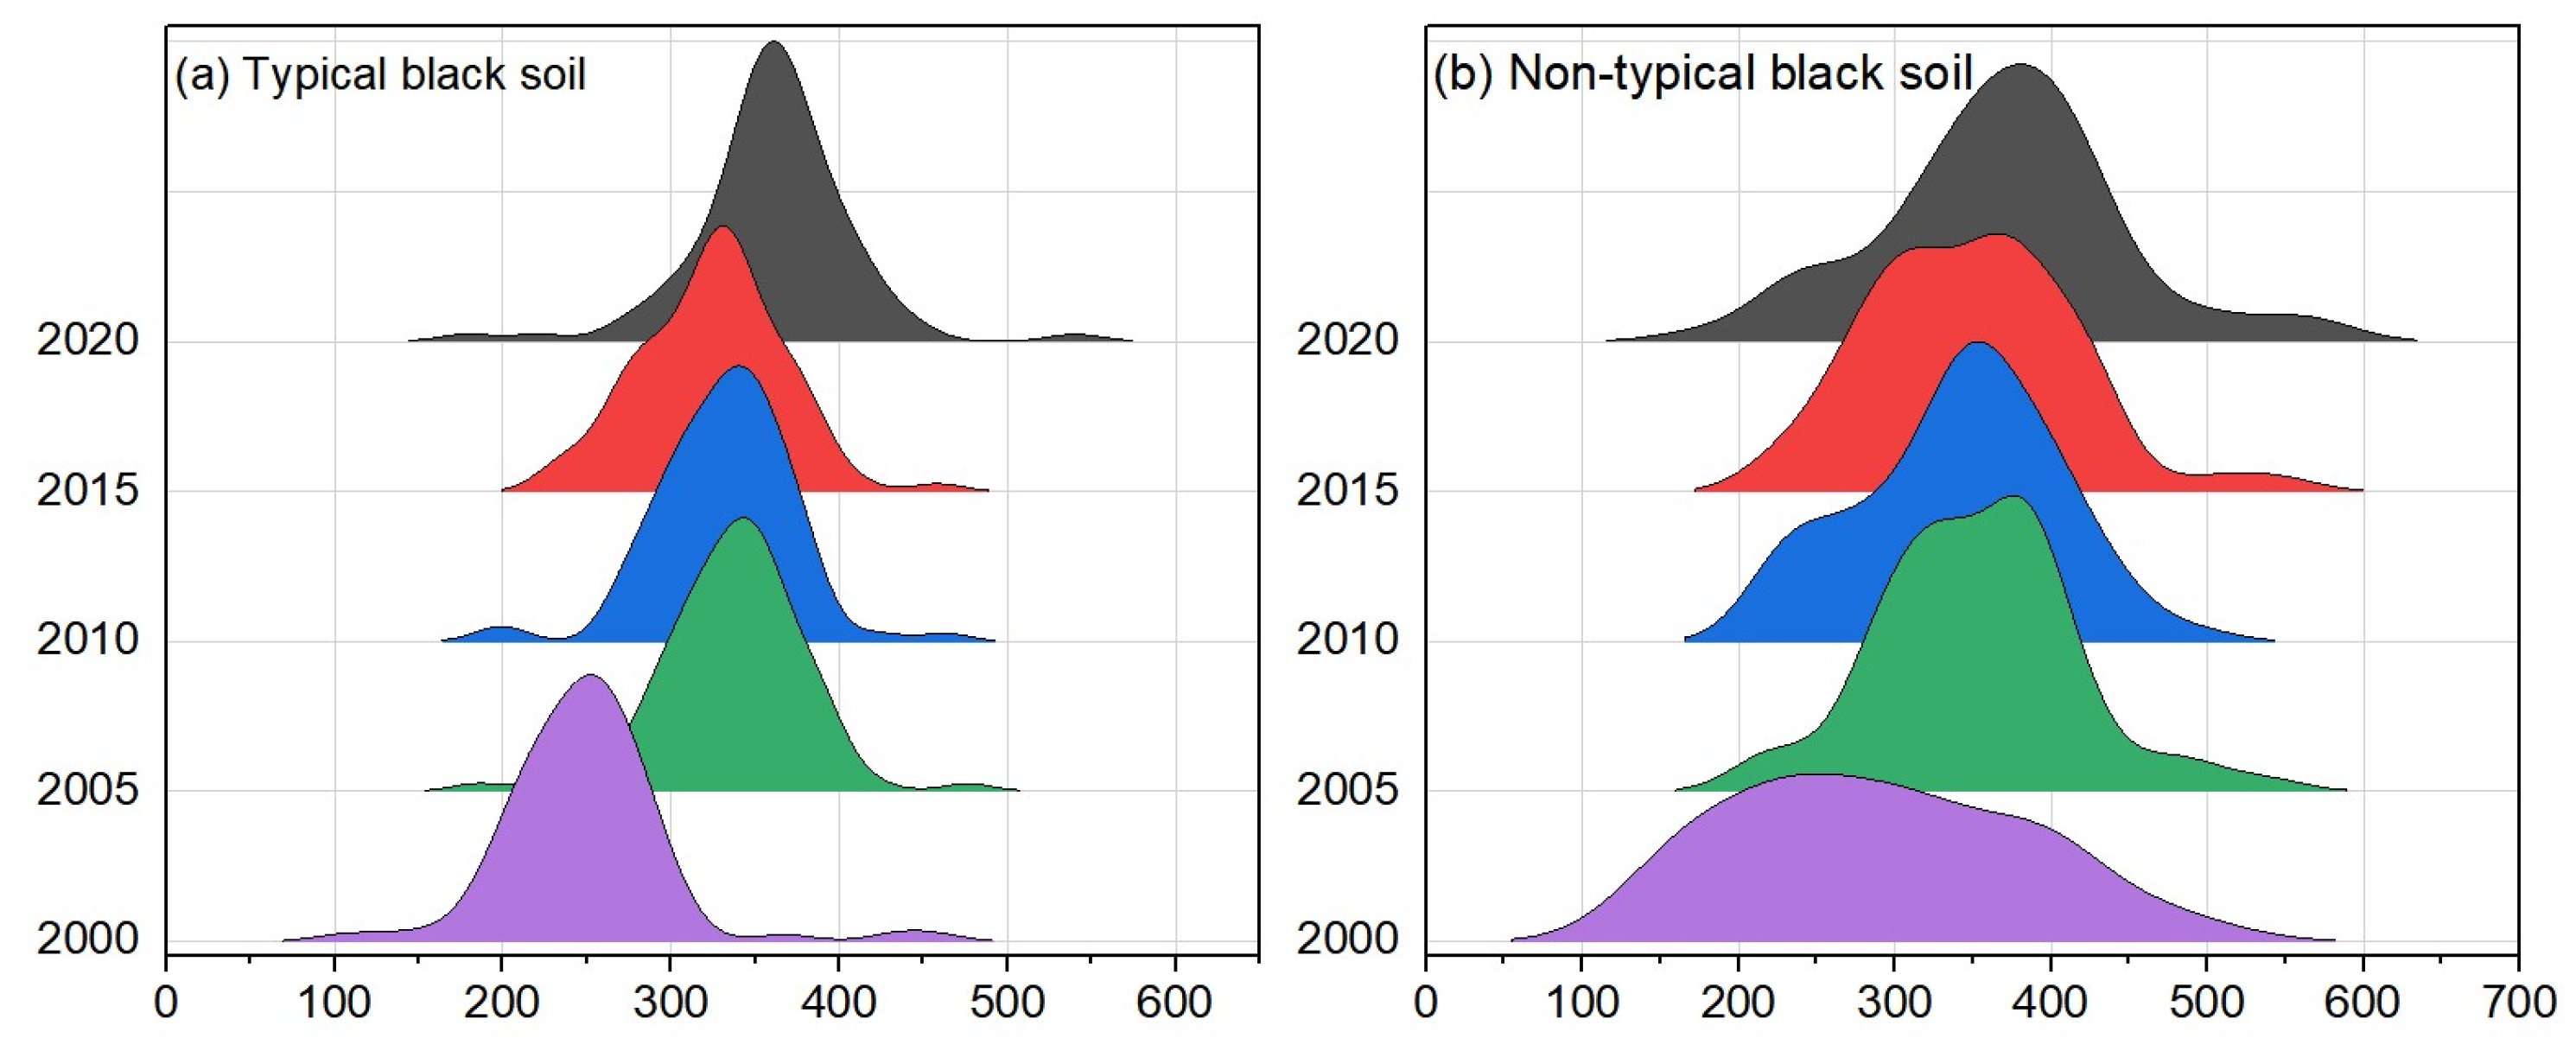
4.1. Historical Trend and Future Sustainability of Stable CNPP at Pixel Scale

Sustainable cropland productivity is a key foundation for maintaining stable grain production and increasing grain production without stagnation. A global study showed that stable global CNPP growth accounted for 34% of total CNPP growth from 2003 to 2019 [70]. This study first compared the trend of CNPP in typical and non-typical black soil regions by randomly selecting sample points (see Figure A1 for random points). From the distribution curves of the ridge map (Figure 14), CNPP continued to increase from 2000 to 2020 in both types of black soil regions, but the stability of CNPP in the non-typical black soil was weaker (the curve was flattened). So, what are the changing trends and future sustainability of stable cropland (defined here as cropland that has not changed from 2000 to 2020) productivity in the BRSNC?
This study extracted stable CNPP based on the unchanged range of cropland, and the T-S estimator, M-K test, and Hurst exponent were used to determine the historical change trend and future sustainability of stable CNPP at pixel scales (Figure 15). In this study, the model results were reanalyzed (Figure A2 shows the original results); the multi-year average statistical values of stable CNPP during 2000–2020 were dominated by 200–300 g C/m2 (22.91%) and 300–400 g C/m2 (62.19%), which were concentrated in the three plains (Figure 15a). The stable CNPP pixels increased during the study period, of which 49.46% increased significantly and 18.04% increased non-significantly. The percentage of stable CNPP pixels decreasing was very small, of which the proportion of pixels with non-significant and significant decreases were 7.33% and 1.65% (Figure 15b), mainly in the Liaohe Plain. The Hurst exponent of stable CNPP in the BRSNC ranged from 0.13 to 0.87, suggesting a weaker future sustainability of CNPP. Among the values, 32.87% and 68.13% of the total pixels reflect the positive sustainability and negative sustainability of stable CNPP pixels, respectively (Figure 15c). In particular, although there are more pixels reflecting the increasing trend of stable CNPP during 2000–2020, the future development trend is not optimistic, which may be driven by climate change and human high-intensity activities over a long period of time.

4.2. Spatial–Temporal Synergistic Matching of Grain Production and CNPP

Compared to the cropland resources, maintaining a stable or growing production capacity of cropland resources is the prerequisite basis for grain production increase. The gravity center analysis revealed a greater magnitude of change in the gravity center of grain production within the study area compared to that of the gravity center of CNPP, indicating distinct spatial mismatch characteristics. It is noted that although the distance and direction of the gravity centers in different periods showed asynchrony, overall, the two gravity centers migrated to the north and northwest instead of going in opposite directions. The findings from the analysis of spatial autocorrelation revealed that the overall trend in basic synergistic development between grain production and CNPP ranged from strong correlation to weak correlation. The SMI and Gini coefficient showed similar fluctuation characteristics, suggesting that the imbalance between grain production and CNPP continued to slow down and overall tended to a relatively coordinated development. The above three analytical perspectives have revealed the evolving characteristics of the synergistic matching of grain production and CNPP from 2000 to 2020.

4.3. Interpretation of Spatial Mismatch Influencing Factors and Characteristics of GTWR and BRT

The results of the analyses showed that agricultural production and natural environmental factors played a key role in the spatial mismatch. According to the results of the GTWR model, the regression coefficients of per capita cropland area and grain crop area showed relatively stable trends, and the coefficients of the urbanization rate, per capita GDP, agricultural labor force, and fertilizer application showed an overall decreasing trend, and the annual precipitation and average annual temperature first increased and then flattened out over time. Despite differences in the relative importance results of influencing factors captured by the BRT algorithm, the overall GTWR regression results are consistent. Notably, the partial dependence plot of key factors showed that the possibility of the spatial mismatch between grain production and cropland productivity increased as the grain crop area, agricultural labor, and fertilizer application increased. Compared to grain crop area and agricultural labor force, the impact range of fertilizer application in the early part (2000 and 2005) of the study period was significantly different from that in the later part (2015 and 2020). This may be closely related to entering a period of structural adjustment of agricultural production factor inputs in the BSRNC.
The GTWR and BRT models provide a more insightful and innovative perspective on spatial mismatch mechanisms. The GTWR model and machine learning BRT algorithm have become the main analytical tools for identifying the relationship between dependent and explanatory variables [28,32]. Unlike traditional regression (e.g., multiple linear regression) and GWR models, the GTWR model analyzes spatial–temporal non-stationarity by constructing spatial and temporal dependent local models, which allow the independent variables to have data attributes in both time and space. The GTWR model revealed the spatial and temporal heterogeneity of influencing factors on the spatial mismatch, which is helpful for formulating target policies and management measures in different regions. On the other hand, compared with the regression tree algorithms, which can also assess the relative importance of independent variables, the resampling and ensemble techniques allow the BRT algorithm to obtain a significantly higher model performance and more reliable and stable results regarding the relative importance of independent variables [28,71].

4.4. Implications for Sustainable Black Soil Cropland Protection and Food Supply Security

Different regions need to implement differentiated management policies according to specific conditions to ensure black soil cropland productivity stabilization and sustainable food production. The food–cropland complex systems in Songnen Plain and Sanjiang Plain showed a synergistic matching trend during the study period. However, the grain-dominated agricultural cropping pattern has been formed for a long time. Due to the single cropping of cropland systems, the continuous cropping of main crops is not conducive to the sustainable utilization of black soil cropland [72]. The BSRNC needs to implement a planting system that combines cropland use and cropland nurturing techniques, such as crop rotation, and promote moderate fallow in accordance with the relevant national regulations. From the perspective of sustainable development, a high production capacity for cropland resources is one of the direct approaches to increase grain production. It is imperative to maintain that the total area of black soil cropland is not reduced, the function is not degraded, the quality is improved, and the production capacity is sustainable. Practice and research have shown that vigorously promoting technical models of black soil cropland protection and use is the key to realizing cropland productivity sustainability and guaranteeing food security [73].
This study showed a significant change in the marginal impact of fertilizer application. Statistics provide evidence that the average amount of per mu fertilizer application is higher than the world average. Therefore, it is imperative to optimize the input structure of agricultural production elements and insist on taking the path of green agricultural development. Precipitation and temperature also have some impact on the spatial mismatch, and these factors determine the boundaries of suitable planting areas for grain crops [10]. Influenced by global climate change, it is necessary to consider suitable planting areas for grain crops, scientifically formulate planting zoning, and optimize the crop spatial distribution.

4.5. Limitations of the Study and Prospects in the Future

NPP-based indicators are only indirect proxies for assessing cropland productivity. The NPP data from satellite observation products were directly used in the study; however, there is some uncertainty. A time-series-enhanced vegetation index (EVI)-based study also found that cropland productivity improved in Jilin Province during 2000–2019 [74], aligning with the findings of this current investigation. The study scale is the administrative region (prefecture level), and a comprehensive multi-scale analysis needs to be carried out. Due to the limitations of agricultural statistical yearbooks, there is no investigation from the lower administrative region (county level). Despite the high performance of both GTWR models and BRT algorithms, multiple-scale analyses can provide more insight. Several potentially explanatory variables that could not be assessed are missing, such as land management (policy), agro-environmental conditions (e.g., soil properties and meteorological hazards), and cropping systems (e.g., crop rotation). What are the spatial and temporal mismatches of grain production and cropland productivity under different cropping patterns (e.g., maize continuous cropping, soybean and maize rotation)? This question deserves further exploration.

5. Conclusions

This study revealed the spatial–temporal variations and spatial mismatches of grain production and CNPP in BSRNC from 2000 to 2020, and explored the influencing factors using the GTWR model and BRT algorithms, and the following main conclusions are drawn:
From 2000 to 2020, there was a sustained increase in grain production and CNPP. The spatial mismatch between the gravity center of CNPP and the gravity center of grain production was closely related to socioeconomic development, cropland space reconstruction, and natural resource endowment. The SMI and the Gini coefficient showed a decreasing trend, indicating that synergistic development trends lead to increases in grain production and CNPP, which are crucial for food supply capacity sustainability and food security. Agricultural production factors (grain crop area, fertilizer application, and agricultural labor) and natural environmental factors (precipitation and temperature) play a key role in the spatial mismatch. It is worth noting that it is important to stabilize main grain crop areas and to adjust the investment structure of agricultural production elements. Furthermore, the influence of precipitation and temperature on the spatial mismatch reminds us that it is necessary to optimize the spatial pattern of different grain crops by considering the appropriateness of grain cropping.

Author Contributions

Conceptualization, methodology, and writing—original draft preparation, Q.W. and J.R.; resources, funding acquisition, and writing—review and editing, J.R., X.L. and M.Z.; software, data curation, and visualization, Q.W. and H.S. All authors have read and agreed to the published version of the manuscript.

Funding

This work was supported by the National Social Science Foundation Youth Project of China (NO. 21CGL040) and the Natural Science Foundation of Gansu Province (NO. 24J RRA641).

Data Availability Statement

The data that support the findings of this study are available from the corresponding authors upon reasonable request.

Acknowledgments

The authors wish to thank the editor and the anonymous reviewers for their constructive comments, which were considerably valuable in improving the paper. In addition, the authors acknowledge the data support from National Earth System Science Data Center, National Science & Technology Infrastructure of China (http://www.geodata.cn).

Conflicts of Interest

The authors declare no conflicts of interest.

Appendix A

Table A1. Theil–Sen and Mann–Kendall trend classification.
SCNPPZCNPPTrend CodeTrend Types
SCNPP > 02.58 < ZCNPP4Significant increase (SI)
1.96 < ZCNPP ≤ 2.583
1.65 < ZCNPP ≤ 1.962
ZCNPP ≤ 1.651Non-significant increase (NI)
SCNPP = 0ZCNPP0Basically unchanged (BU)
SCNPP < 0ZCNPP ≤ 1.65−1Non-significant decrease (ND)
1.65 < ZCNPP ≤ 1.96−2Significant decrease (SD)
1.96 < ZCNPP ≤ 2.58−3
ZCNPP ≤ 2.58−4
Table A2. The selected indicators system of influencing factors.
TypesInfluencing FactorsDescription Calculation
Socioeconomic factorsUrbanization ratePopulation urbanization rate,
urban population/total population
Per capita GDPGDP/total population
Per capita cropland areaCropland area/total population
Agricultural production factorsGrain crop areaGrain crop area, obtained directly from statistical yearbooks
Agricultural laborRural practitioners
Fertilizer consumptionTotal fertilizer application
Natural factorsAverage annual precipitationStatistics based on precipitation and temperature raster datasets to administrative units (prefecture level) using ArcGIS 10.8 software
Average annual temperature
Note: considering data availability, only 8 indicators were selected.
Figure A1. Spatial distribution of random sampling points in typical and non-typical black soil regions. Note: The data on the distribution of black soil were acquired from the spatial distribution information of soil types in China, which was downloaded from the Resource and Environmental Science and Data Center (https://www.resdc.cn, (accessed on 18 July 2024)). The typical regions known for their black soils and black calcareous soils were identified by extracting relevant information using ArcGIS software.
Agronomy 14 02932 g0a1
Figure A2. (a) The original results of Theil–sen and Mann–Kendall methods. (b) The original results of the Hurst exponent. Note: these calculations were performed in Matlab 2021a and ArcGIS 10.8 software.
Agronomy 14 02932 g0a2

References

  1. Abay, K.A.; Breisinger, C.; Glauber, J.; Kurdi, S.; Laborde, D.; Siddig, K. The Russia-Ukraine War: Implications for Global and Regional Food Security and Potential Policy Responses. Glob. Food Secur. Agric. Policy 2023, 36, 100675. [Google Scholar] [CrossRef]
  2. Chen, Y.; Wang, J.; Zhang, F.; Liu, Y.; Cheng, S.; Zhu, J.; Si, W.; Fan, S.; Gu, S.; Hu, B.; et al. New patterns of globalization and food security. J. Nat. Resour. 2021, 36, 1362–1380. [Google Scholar] [CrossRef]
  3. Luo, X.; Yang, R.; Xu, Q. Spatial mismatch evolution of global population and food and its influencing factors. J. Nat. Resour. 2021, 36, 1381–1397. [Google Scholar] [CrossRef]
  4. Liu, Z.; Zhong, H.; Li, Y.; Wen, Q.; Liu, X.; Jian, Y. Change in grain production in China and its impacts on spatial supply and demand distributions in recent two decades. J. Nat. Resour. 2021, 36, 1413–1425. [Google Scholar] [CrossRef]
  5. Saccone, D.; Vallino, E. Food Security in the Age of Sustainable Development: Exploring the Synergies between the SDGs. World Dev. 2022, 152, 105815. [Google Scholar] [CrossRef]
  6. Jin, X.; Liang, X.; Han, B.; Wang, S.; Hong, B.; Song, J. Theoretical analysis and geographical support framework of cultivated land protection for chinese-style modernization. Econ. Geogr. 2022, 42, 142–150. [Google Scholar]
  7. Feng, Z.; Sun, T.; Yang, Y. Study on the Spatiotemporal Patterns and Contribution Factors of China’s Grain Output Increase during 2003–2013. J. Nat. Resour. 2016, 31, 895–907. [Google Scholar]
  8. Gong, Y.; Zhang, Y. Influence of well-facilitated capital farmland construction policy on grain productivity. J. Huazhong Agric. Univ. 2023, 4, 175–190. [Google Scholar]
  9. Chen, X.; Lin, C.; Hou, X.; Wu, Z.; Yan, G.; Zhu, C. The Impact of Land Consolidation on Arable Land Productivity: A Differentiated View of Soil and Vegetation Productivity. Agric. Ecosyst. Environ. 2022, 326, 107781. [Google Scholar] [CrossRef]
  10. Yang, S.; Bai, Y.; Alatalo, J.M.; Wang, H.; Tong, J.; Liu, G.; Zhang, F.; Chen, J. Spatial-Temporal Pattern of Cultivated Land Productivity Based on Net Primary Productivity and Analysis of Influencing Factors in the Songhua River Basin. Land Degrad. Dev. 2022, 33, 1917–1932. [Google Scholar] [CrossRef]
  11. Han, B.; Jin, X.; Yeting, F.; Chen, H.; Jin, J.; Xu, W.; Ren, J.; Zhou, Y. Trend and Spatial Pattern of Stable Cropland Productivity in China Based on Satellite Observations (2001−2020). Environ. Impact Assess. Rev. 2023, 101, 107136. [Google Scholar] [CrossRef]
  12. Lu, X.; Ke, N.; Kuang, B. Regional differences and influencing factors of China’s grain production capacity. China Land Sci. 2020, 34, 53–62. [Google Scholar]
  13. Niu, Z.; Yan, H.; Liu, F. Decreasing Cropping Intensity Dominated the Negative Trend of Cropland Productivity in Southern China in 2000–2015. Sustainability 2020, 12, 10070. [Google Scholar] [CrossRef]
  14. Liu, F.; Xiao, X.; Qin, Y.; Yan, H.; Huang, J.; Wu, X.; Zhang, Y.; Zou, Z.; Doughty, R.B. Large Spatial Variation and Stagnation of Cropland Gross Primary Production Increases the Challenges of Sustainable Grain Production and Food Security in China. Sci. Total Environ. 2022, 811, 151408. [Google Scholar] [CrossRef]
  15. Wang, F.; Liu, Y.; Kong, X.; Chen, Y.; Pan, J. Spatial and temporal variation of grain production and its influencing factors at the county level in China. Econ. Geogr. 2018, 38, 142–151. [Google Scholar]
  16. Liu, D.; Liu, S.; Wen, X. Spatial-Temporal Evolution of Grain Production Structure in Northeast China. Econ. Geogr. 2019, 39, 163–170. [Google Scholar]
  17. Zhang, Q.; Zhang, F.; Wu, G.; Mai, Q. Spatial Spillover Effects of Grain Production Efficiency in China: Measurement and Scope. J. Clean. Prod. 2021, 278, 121062. [Google Scholar] [CrossRef]
  18. Yang, Q.; Si, X.; Wang, J. The measurement and its distribution dynamic evolution of grain production efficiency in China under the goal of reducing pollution emissions and increasing carbon sink. J. Nat. Resour. 2022, 37, 600–615. [Google Scholar] [CrossRef]
  19. Jiang, H.; Chen, Y.; Liu, Z. Spatiotemporal pattern and influencing factors of grain production resilience in China. Econ. Geogr. 2023, 43, 126–134. [Google Scholar]
  20. Zhang, Q.; Qu, Y.; Zhang, L.; Su, D.; Wei, C. Dynamic evolution and driving effects of carbon emissions from grain production in China. Acta Geogr. Sin. 2023, 78, 2186–2208. [Google Scholar]
  21. Zhao, X.; Liu, J.; Wang, R.; Wang, X. Spatial-temporal coupling relationship between chemical fertilizer application and grain yield in China at city scale. J. Nat. Resour. 2019, 34, 1471–1482. [Google Scholar]
  22. Ge, D.; Long, H.; Zhang, Y.; Tu, S. Pattern and coupling relationship between grain yield and agricultural labor changes at county level in China. Acta Geogr. Sin. 2017, 72, 1063–1077. [Google Scholar]
  23. Fang, Y.; Liu, J. Coupled modes of grain yield and agricultural labor changes and rural development types at county level in Northeast China. Acta Geogr. Sin. 2020, 75, 2241–2255. [Google Scholar]
  24. Xie, K.; Ding, M.; Xin, L.; Chen, L. Spatial-temporal patterns of grain output and its spatial relationship with economic development at the county level in China. Econ. Geogr. 2021, 41, 167–175. [Google Scholar]
  25. Hou, M.; Deng, Y.; Yao, S. Coordinated Relationship between Urbanization and Grain Production in China: Degree Measurement, Spatial Differentiation and Its Factors Detection. J. Clean. Prod. 2022, 331, 129957. [Google Scholar] [CrossRef]
  26. Wang, J.; Zhang, Z.; Liu, Y. Spatial Shifts in Grain Production Increases in China and Implications for Food Security. Land Use Policy 2018, 74, 204–213. [Google Scholar] [CrossRef]
  27. Xu, S.; Wu, J.; Song, W.; Li, Z.; Li, Z.; Kong, F. Spatial-Temporal Changes in Grain Production, Consumption and Driving Mechanism in China. J. Integr. Agric. 2013, 12, 374–385. [Google Scholar] [CrossRef]
  28. Zhi, J.; Cao, X.; Zhang, Z.; Qin, T.; Qu, L.; Qi, L.; Ge, L.; Guo, A.; Wang, X.; Da, C.; et al. Identifying the Determinants of Crop Yields in China since 1952 and Its Policy Implications. Agric. For. Meteorol. 2022, 327, 109216. [Google Scholar] [CrossRef]
  29. Lee, C.-C.; Zeng, M.; Luo, K. How Does Climate Change Affect Food Security? Evidence from China. Environ. Impact Assess. Rev. 2024, 104, 107324. [Google Scholar] [CrossRef]
  30. Zhong, H.; Liu, Z.; Wang, J. Understanding Impacts of Cropland Pattern Dynamics on Grain Production in China: A Integrated Analysis by Fusing Statistical Data and Satellite-Observed Data. J. Environ. Manag. 2022, 313, 114988. [Google Scholar] [CrossRef]
  31. Ge, D.; Long, H.; Zhang, Y.; Ma, L.; Li, T. Farmland Transition and Its Influences on Grain Production in China. Land Use Policy 2018, 70, 94–105. [Google Scholar] [CrossRef]
  32. Guo, A.; Yue, W.; Yang, J.; Xue, B.; Xiao, W.; Li, M.; He, T.; Zhang, M.; Jin, X.; Zhou, Q. Cropland Abandonment in China: Patterns, Drivers, and Implications for Food Security. J. Clean. Prod. 2023, 418, 138154. [Google Scholar] [CrossRef]
  33. Zhang, Q.; Yang, F.; Li, F. The grain production space reconstruction in China since the reform and opening up. J. Nat. Resour. 2021, 36, 1426–1438. [Google Scholar] [CrossRef]
  34. Li, F.; Qin, Z.; Liu, X.; Chen, Z.; Wei, X.; Zhang, Q.; Lei, M. Grain Production Space Reconstruction and Land System Function Tradeoffs in China. Geogr. Sustain. 2021, 2, 22–30. [Google Scholar] [CrossRef]
  35. Chai, J.; Wang, Z.; Yang, J.; Zhang, L. Analysis for Spatial-Temporal Changes of Grain Production and Farmland Resource: Evidence from Hubei Province, Central China. J. Clean. Prod. 2019, 207, 474–482. [Google Scholar] [CrossRef]
  36. Chen, W.; Wang, G.; Cai, W.; Che, X.; Zhou, W.; Zhang, C.; Zeng, J. Spatiotemporal Mismatch of Global Grain Production and Farmland and Its Influencing Factors. Resour. Conserv. Recycl. 2023, 194, 107008. [Google Scholar] [CrossRef]
  37. Jin, G.; Li, Z.; Wang, Z.; Chu, X.; Li, Z. Impact of Land-Use Induced Changes on Agricultural Productivity in the Huang-Huai-Hai River Basin. Phys. Chem. Earth 2015, 79, 86–92. [Google Scholar] [CrossRef]
  38. Niu, Z.; Yan, H.; Huang, M.; Hu, Y.; Chen, J. Agricultural productivity estimation with MODIS-OLI fusion data. J. Nat. Resour. 2016, 31, 875–885. [Google Scholar]
  39. Zhuang, Q.; Wu, S.; Huang, X.; Kong, L.; Yan, Y.; Xiao, H.; Li, Y.; Cai, P. Monitoring the Impacts of Cultivated Land Quality on Crop Production Capacity in Arid Regions. CATENA 2022, 214, 106263. [Google Scholar] [CrossRef]
  40. Rotllan-Puig, X.; Ivits, E.; Cherlet, M. LPDynR: A New Tool to Calculate the Land Productivity Dynamics Indicator. Ecol. Indic. 2021, 133, 108386. [Google Scholar] [CrossRef]
  41. Liu, G.; Wang, X.; Baiocchi, G.; Casazza, M.; Meng, F.; Cai, Y.; Hao, Y.; Wu, F.; Yang, Z. On the Accuracy of Official Chinese Crop Production Data: Evidence from Biophysical Indexes of Net. Proc. Natl. Acad. Sci. USA 2020, 117, 25434–25444. [Google Scholar] [CrossRef] [PubMed]
  42. Li, S.; Ji, Q.; Liang, W.; Fu, B.; Lü, Y.; Yan, J.; Jin, Z.; Wang, Z.; Li, Y. Urbanization Does Not Endanger Food Security: Evidence from China’s Loess Plateau. Sci. Total Environ. 2023, 871, 162053. [Google Scholar] [CrossRef] [PubMed]
  43. Yang, H.; Lu, X. Dynamic evolution and synergistic relationship between grain productivity capacity and vegetation primary productivity in the Middle Reaches of the Yangtze River. Econ. Geogr. 2022, 42, 103–112. [Google Scholar] [CrossRef]
  44. Qiu, F.; Zhang, X.; Yin, P.; Shen, Z. Spatial mismatch and problem type identification of agricultural transformation in resource-based city from the perspective of town scale: A case study of Xuzhou city. Econ. Geogr. 2022, 42, 152–161. [Google Scholar]
  45. Pan, T.; Zhang, C.; Kuang, W.; Luo, G.; Du, G.; DeMaeyer, P.; Yin, Z. A Large-Scale Shift of Cropland Structure Profoundly Affects Grain Production in the Cold Region of China. J. Clean. Prod. 2021, 307, 127300. [Google Scholar] [CrossRef]
  46. Liu, Y.; Liu, X.; Liu, Z. Effects of Climate Change on Paddy Expansion and Potential Adaption Strategies for Sustainable Agriculture Development across Northeast China. Appl. Geogr. 2022, 141, 102667. [Google Scholar] [CrossRef]
  47. Yao, D.; Cao, Y.; Cheng, J.; Lei, M.; Liao, Y.; Wang, L.; Zhao, J.; Kong, X. Spatiotemporal evolution and driving factors of black soil cultivated land within the framework of critical zones on the Earth. Resour. Sci. 2023, 45, 1856–1868. [Google Scholar] [CrossRef]
  48. Li, X.; Shi, Z.; Xing, Z.; Wang, M.; Wang, M. Dynamic Evaluation of Cropland Degradation Risk by Combining Multi-Temporal Remote Sensing and Geographical Data in the Black Soil Region of Jilin Province, China. Appl. Geogr. 2023, 154, 102920. [Google Scholar] [CrossRef]
  49. Wang, J.; Xing, Q.; Tong, Y.; Wang, Z.; Li, B. Establish Governance Systems for Securing Black Soils in China Based on a New Law. Soil Secur. 2023, 13, 100112. [Google Scholar] [CrossRef]
  50. Yang, Z.; Chu, L.; Xiao, Y.; Wang, C.; Tan, W.; Wang, T.; Cai, C. Spatiotemporal changes and driving forces of main grain crop planting types in Northeast China from 2017 to 2021. Resour. Sci. 2023, 45, 966–979. [Google Scholar] [CrossRef]
  51. Xu, Y.; Pei, J.; Li, S.; Zou, H.; Wang, J.; Zhang, J. Main characteristics and utilization countermeasures for black soils in different regions of Northeast China. Chin. J. Soil Sci. 2023, 54, 495–504. [Google Scholar]
  52. Yang, J.; Huang, X. The 30 m Annual Land Cover Dataset and Its Dynamics in China from 1990 to 2019. Earth Syst. Sci. Data 2021, 13, 3907–3925. [Google Scholar] [CrossRef]
  53. Liang, X.; Jin, X.; Xu, X.; Chen, H.; Liu, J.; Yang, X.; Xu, W.; Sun, R.; Han, B.; Zhou, Y. Uncertainty in China’s Food Self-Sufficiency: A Dynamic System Assessment. Sustain. Prod. Consump. 2023, 40, 135–146. [Google Scholar] [CrossRef]
  54. Cui, P.; Chen, T.; Li, Y.; Liu, K.; Zhang, D.; Song, C. Comparison and Assessment of Different Land Cover Datasets on the Cropland in Northeast China. Remote Sens. 2023, 15, 5134. [Google Scholar] [CrossRef]
  55. Peng, S.; Ding, Y.; Liu, W.; Li, Z. 1 Km Monthly Temperature and Precipitation Dataset for China from 1901 to 2017. Earth Syst. Sci. Data 2019, 11, 1931–1946. [Google Scholar] [CrossRef]
  56. Zhang, M.; Tan, S.; Chen, E.; Li, J. Spatio-Temporal Characteristics and Influencing Factors of Land Disputes in China: Do Socio-Economic Factors Matter? Ecol. Indic. 2024, 160, 111938. [Google Scholar] [CrossRef]
  57. Ord, J.K.; Getis, A. Local Spatial Autocorrelation Statistics: Distributional Issues and an Application. Geogr. Anal. 1995, 27, 286–306. [Google Scholar] [CrossRef]
  58. Huang, B.; Wu, B.; Barry, M. Geographically and Temporally Weighted Regression for Modeling Spatio-Temporal Variation in House Prices. Int. J. Geogr. Inf. Sci. 2010, 24, 383–401. [Google Scholar] [CrossRef]
  59. Dong, F.; Zhang, Y.; Zhang, X.; Hu, M.; Gao, Y.; Zhu, J. Exploring Ecological Civilization Performance and Its Determinants in Emerging Industrialized Countries: A New Evaluation System in the Case of China. J. Clean. Prod. 2021, 315, 128051. [Google Scholar] [CrossRef]
  60. Chen, Y.; Tian, W.; Zhou, Q.; Shi, T. Spatiotemporal and Driving Forces of Ecological Carrying Capacity for High-Quality Development of 286 Cities in China. J. Clean. Prod. 2021, 293, 126186. [Google Scholar] [CrossRef]
  61. Peng, M.; Li, C.; Wang, P.; Dai, X. Spatio-Temporal Variation and Future Sustainability of Net Primary Productivity from 2001 to 2021 in Hetao Irrigation District, Inner Mongolia. Agriculture 2024, 14, 613. [Google Scholar] [CrossRef]
  62. Yao, C.; Li, Z.; Yi, X. Driving effects of grain production change and its spatial differences in China. China Popul. Resour. Environ. 2016, 26, 72–81. [Google Scholar]
  63. Huang, D.; Yan, H.; Chi, H.; Geng, X.; Shao, Q. Research on spatiotemporal characteristics of farmland ecosystem NPP in Jianghan Plain from 2000 to 2015. J. Nat. Resour. 2020, 35, 845–856. [Google Scholar]
  64. Su, Y.; Qian, K.; Lin, L.; Wang, K.; Guan, T.; Gan, M. Identifying the Driving Forces of Non-Grain Production Expansion in Rural China and Its Implications for Policies on Cultivated Land Protection. Land Use Policy 2020, 92, 104435. [Google Scholar] [CrossRef]
  65. Tian, J.; Wang, B.; Zhang, C.; Li, W.; Wang, S. Mechanism of Regional Land Use Transition in Underdeveloped Areas of China: A Case Study of Northeast China. Land Use Policy 2020, 94, 104538. [Google Scholar] [CrossRef]
  66. Zhou, L.; Cheng, Y. Spatio-temporal pattern and its driving factors of grain production in Heilongjiang Province. J. Nat. Resour. 2015, 30, 491–501. [Google Scholar]
  67. van Loon, M.P.; Adjei-Nsiah, S.; Descheemaeker, K.; Akotsen-Mensah, C.; van Dijk, M.; Morley, T.; van Ittersum, M.K.; Reidsma, P. Can Yield Variability Be Explained? Integrated Assessment of Maize Yield Gaps across Smallholders in Ghana. Field Crop. Res. 2019, 236, 132–144. [Google Scholar] [CrossRef]
  68. Ha, T.T.V.; Fan, H.; Shuang, L. Climate Change Impact Assessment on Northeast China’s Grain Production. Environ. Sci. Pollut. Res. 2021, 28, 14508–14520. [Google Scholar] [CrossRef]
  69. Salmerón, R.; García, C.B.; García, J. Variance Inflation Factor and Condition Number in Multiple Linear Regression. J. Stat. Comput. Simul. 2018, 88, 2365–2384. [Google Scholar] [CrossRef]
  70. Potapov, P.; Turubanova, S.; Hansen, M.C.; Tyukavina, A.; Zalles, V.; Khan, A.; Song, X.-P.; Pickens, A.; Shen, Q.; Cortez, J. Global Maps of Cropland Extent and Change Show Accelerated Cropland Expansion in the Twenty-First Century. Nat. Food 2022, 3, 19–28. [Google Scholar] [CrossRef]
  71. Arabameri, A.; Yamani, M.; Pradhan, B.; Melesse, A.; Shirani, K.; Tien Bui, D. Novel Ensembles of COPRAS Multi-Criteria Decision-Making with Logistic Regression, Boosted Regression Tree, and Random Forest for Spatial Prediction of Gully Erosion Susceptibility. Sci. Total Environ. 2019, 688, 903–916. [Google Scholar] [CrossRef] [PubMed]
  72. Yang, Z.; Chu, L.; Wang, C.; Pan, Y.; Su, W.; Qin, Y.; Cai, C. What Drives the Spatial Heterogeneity of Cropping Patterns in the Northeast China: The Natural Environment, the Agricultural Economy, or Policy? Sci. Total Environ. 2023, 905, 167810. [Google Scholar] [CrossRef] [PubMed]
  73. Ao, M.; Zhang, X.; Guan, Y. Research and practice of conservation tillage technology in black soil of Northeast China. Bull. Chin. Acad. Sci. 2021, 36, 1203–1215. [Google Scholar]
  74. Zhang, C.; Chen, W.; Ma, J.; Yun, W.; Gao, L.; Wang, H. Analysis on spatial-temporal changes of cultivated land productivity in Jilin Province from 2000 to 2019 based on EVI time series. Trans. Chin. Soc. Agric. Mach. 2022, 53, 158–166. [Google Scholar]
Figure 1. Location of the study area (a), elevation model (b), spatial distribution of cropland (c) and trends in grain production in study area (d). Note: data on China’s grain production in Figure 1d are from the China Statistical Yearbook.
Agronomy 14 02932 g001
Figure 2. Methodological framework.
Agronomy 14 02932 g002
Figure 3. Interannual change trend in grain production and CNPP.
Agronomy 14 02932 g003
Figure 4. Spatiotemporal variation and hotspot pattern of grain production.
Agronomy 14 02932 g004
Figure 5. Spatiotemporal variation and hotspot pattern of CNPP.
Agronomy 14 02932 g005
Figure 6. Migration path of spatial gravity center of grain production and CNPP.
Agronomy 14 02932 g006
Figure 7. Spatial interaction pattern of grain production and CNPP.
Agronomy 14 02932 g007
Figure 8. Total SMI and Gini coefficient.
Agronomy 14 02932 g008
Figure 9. Spatial mismatch of grain production and cropland productivity.
Agronomy 14 02932 g009
Figure 10. Temporal change trend in GTWR regression coefficients.
Agronomy 14 02932 g010
Figure 11. Spatial heterogeneity of influencing factors.
Agronomy 14 02932 g011
Figure 12. Relative importance of each influencing factor. Notes: UrbanR (urbanization rate), PerGDP (per capita GDP), PerCCA (per capita cropland area), GraCA (grain crop area), AgriLab (agricultural labor), FerCon (fertilizer consumption), AvePre (average annual precipitation), and AveTem (average annual temperature).
Agronomy 14 02932 g012
Figure 13. Response relationships of key influencing factors.
Agronomy 14 02932 g013
Figure 14. Statistics of random sample points for CNPP pixels.
Agronomy 14 02932 g014
Figure 15. (a) Annual average of stable CNPP from 2000 to 2020; (b) historical trend of CNPP using T-S and M-K methods; and (c) future sustainability of stable CNPP based on Hurst exponent.
Agronomy 14 02932 g015
Table 1. Indicators system of influencing factors.
TypeVariableUnitVIF
Socioeconomic factorsUrbanization rate%2.403
Per capita GDPyuan/person1.647
Per capita cropland areakm2/person2.475
Agricultural production factorsGrain crop areakm26.778
Agricultural laborperson2.473
Fertilizer consumptiont4.545
Natural factorsAverage annual precipitationmm1.432
Average annual temperature°C1.857
Table 2. The gravity center of grain production and CNPP.
PeriodGrain ProductionCNPP
Distance (km)Direction (°)Distance(km)Direction (°)
2000–200535.73−179.4117.54137.21
2005–201059.7253.5728.1255.43
2010–201510.42111.415.78−106.06
2015–202041.8021.885.8612.44
Table 3. The results of bivariate spatial correlation.
Year20002005201020152020
Moran’s I−0.217−0.212−0.156−0.195−0.154
p-Value0.0030.0040.0240.0090.018
Z-Score−2.860−2.856−2.099−2.558−2.068
Table 4. Cities with positive and negative changes in spatial mismatch index during 2000–2020.
CitySMIChange Direction
20002005201020152020
Jixi−1.17−1.08−0.72−0.690.76Negative → Positive
Shuangyashan−1.64−1.17−0.98−0.810.79Negative → Positive
Daqing−0.020.482.141.890.85Negative → Positive
Heihe−0.86−0.84−0.76−0.430.57Negative → Positive
Jilin1.333.17−0.16−0.07−0.38Positive → Negative
Tieling0.740.30−0.030.340.20Positive → Negative
Chaoyang−1.500.02−0.50−0.87−0.64Negative → Positive → Negative
Table 5. Comparison of model selection.
Model ParametersOLSGWRGTWR
Bandwidth592.9840.1500.140
Residual Squares207.54852.65827.488
Sigma0.5130.371
AICc442.980482.061
R20.8550.9630.981
Table 6. Statistical regression results of GWR and GTWR models.
ModelFactorsMinimumMaximumMeanStandard Deviation
GWRUrbanization rate−5.1524.380−0.2811.637
Per capita GDP−7.6748.602−0.3472.209
Per capita cropland area−7.3725.459−1.1192.935
Grain crop area−6.20825.23810.3656.952
Agricultural labor−6.15713.0961.4954.396
Fertilizer consumption−9.10810.3671.8144.037
Average annual precipitation−9.1592.900−1.6991.615
Average annual temperature−4.5417.5511.0632.056
GTWRUrbanization rate−4.8772.236−0.3711.344
Per capita GDP−4.1851.981−0.9921.202
Per capita cropland area−6.3003.796−0.8702.663
Grain crop area−0.37422.7579.8366.494
Agricultural labor−4.0279.0081.8794.182
Fertilizer consumption−6.4206.0681.2082.972
Average annual precipitation−3.5941.879−1.3470.951
Average annual temperature−2.4345.7971.2861.843
Disclaimer/Publisher’s Note: The statements, opinions and data contained in all publications are solely those of the individual author(s) and contributor(s) and not of MDPI and/or the editor(s). MDPI and/or the editor(s) disclaim responsibility for any injury to people or property resulting from any ideas, methods, instructions or products referred to in the content.

