

Classification and Evaluation of Marginal Land for Potential Cultivation in Northwest China Based on Contiguity and Restrictive Factors


Abstract
1. Introduction
2. Materials and Methods
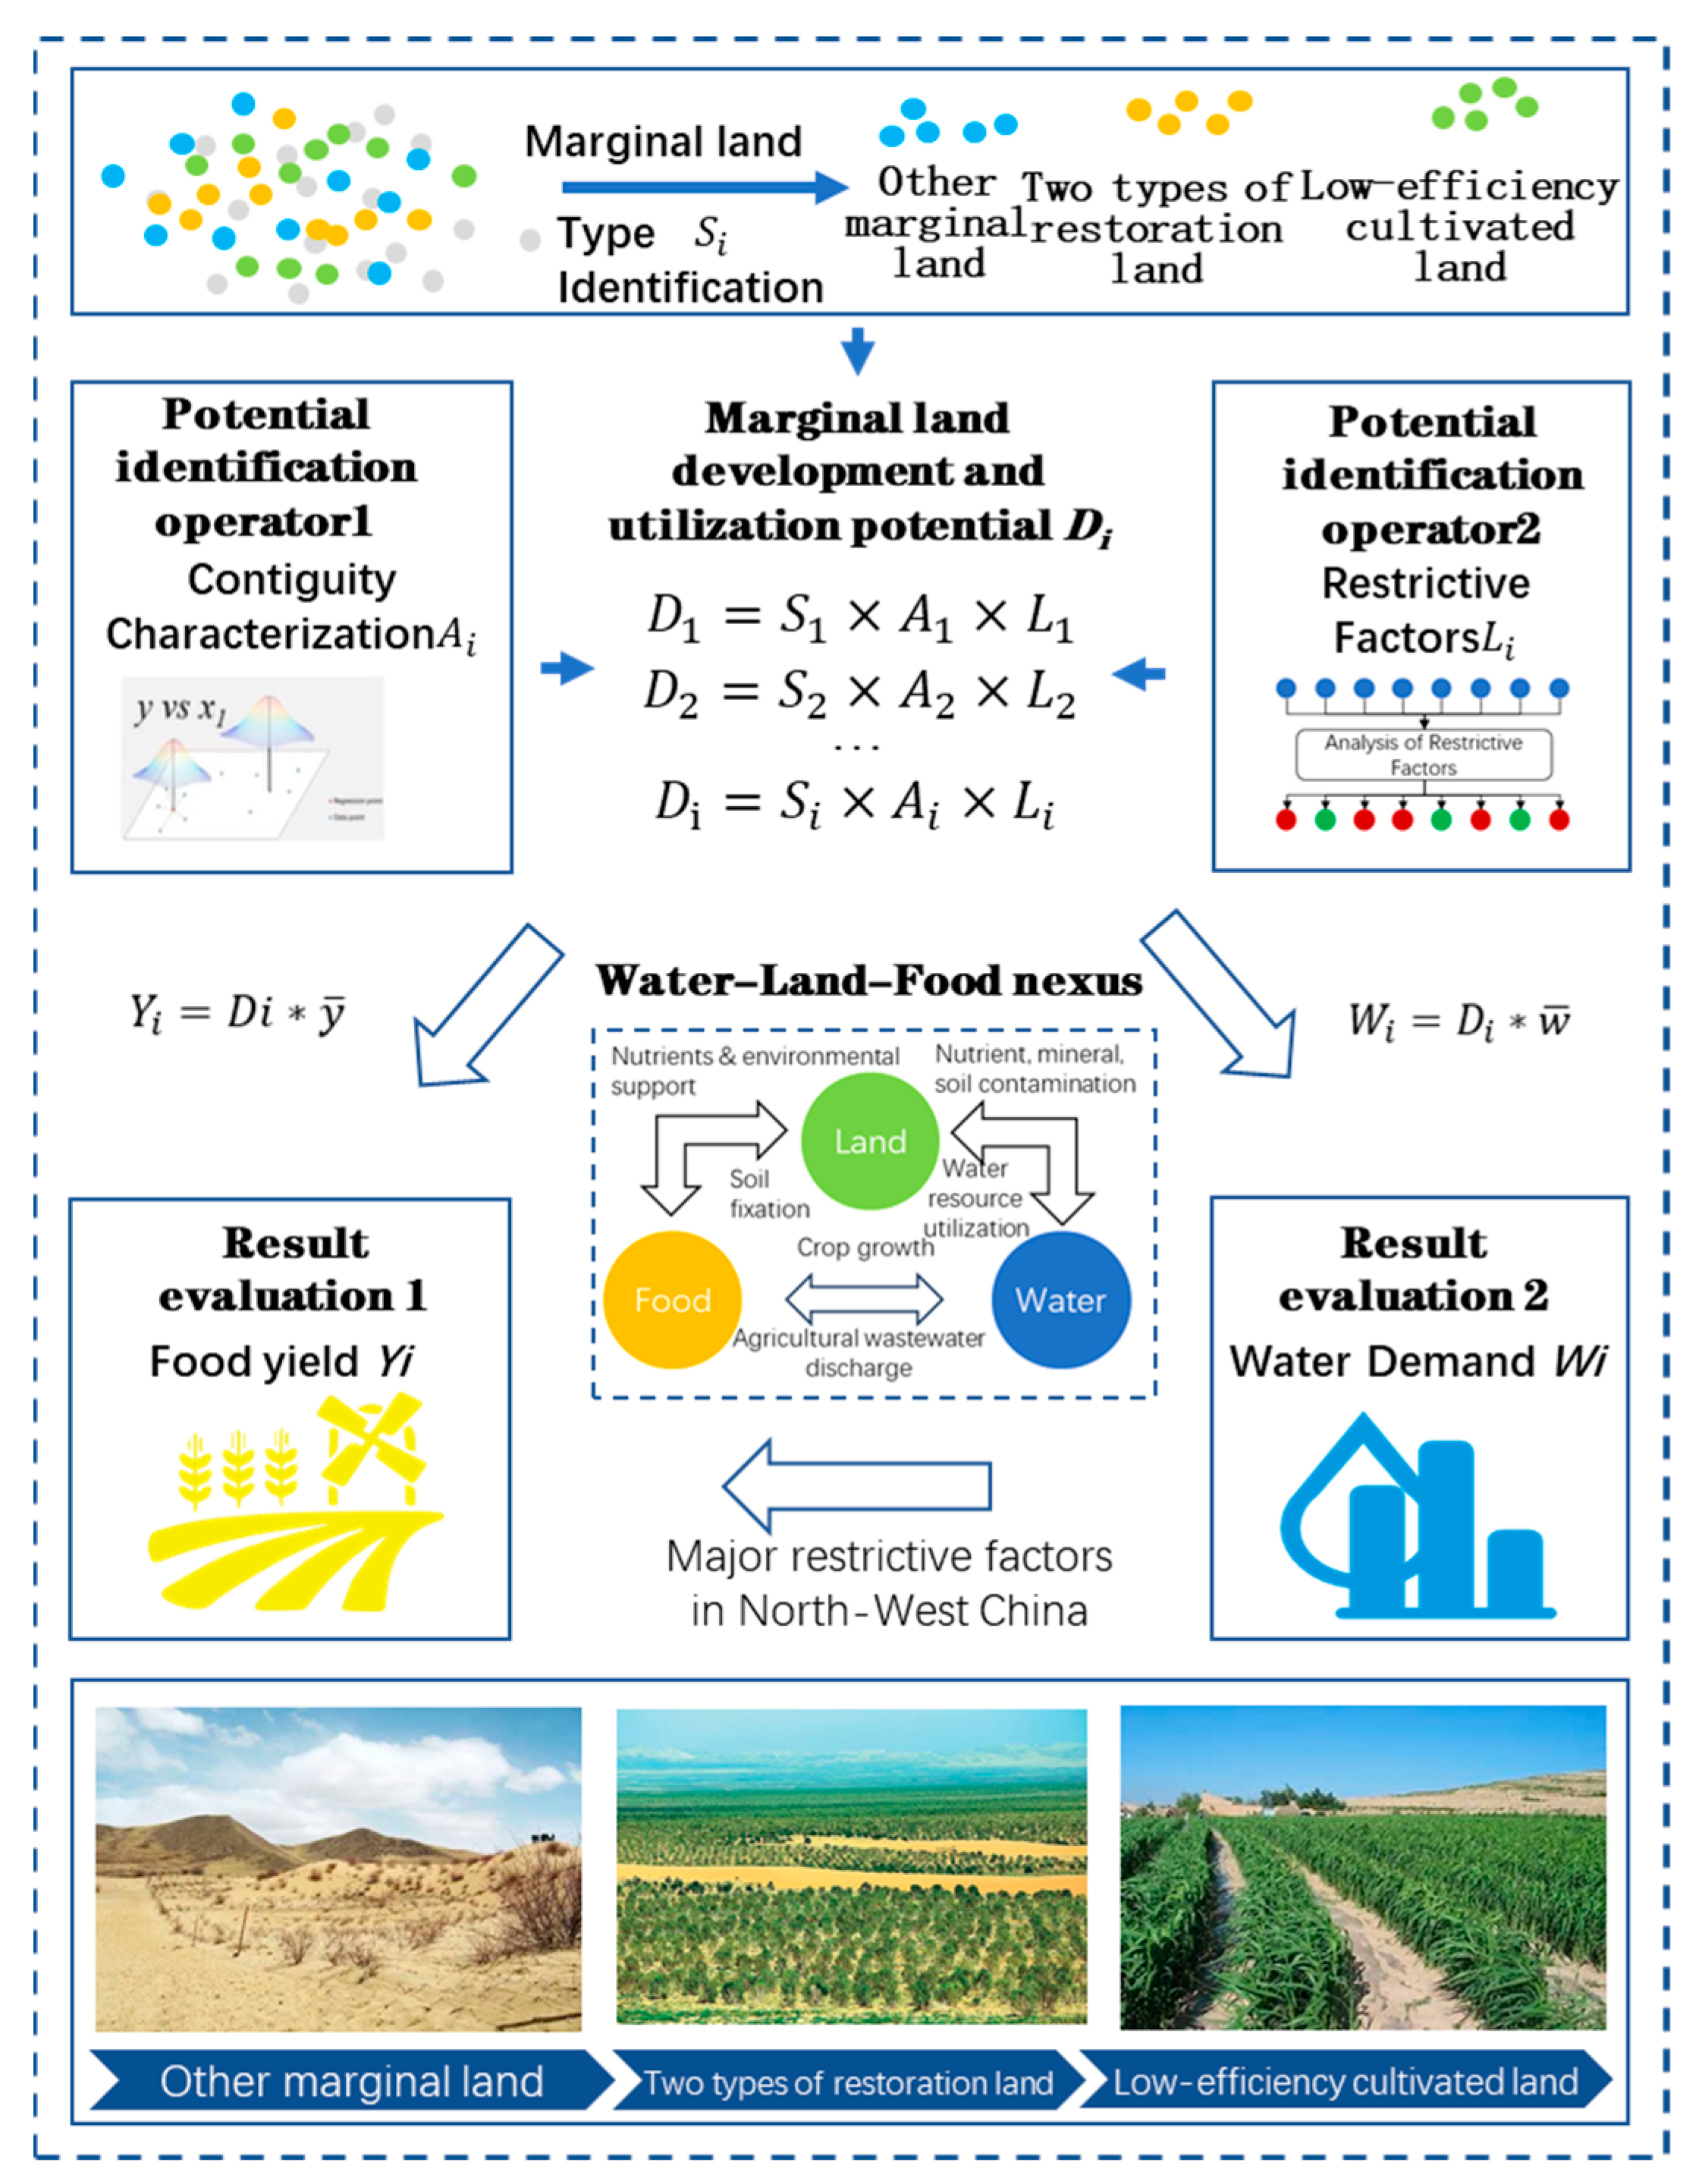
2.1. Methods
2.1.1. Identification of Marginal Land Types
2.1.2. Potential Evaluation Model
Characterization of Contiguity
Analysis of Restriction
Result Evaluation
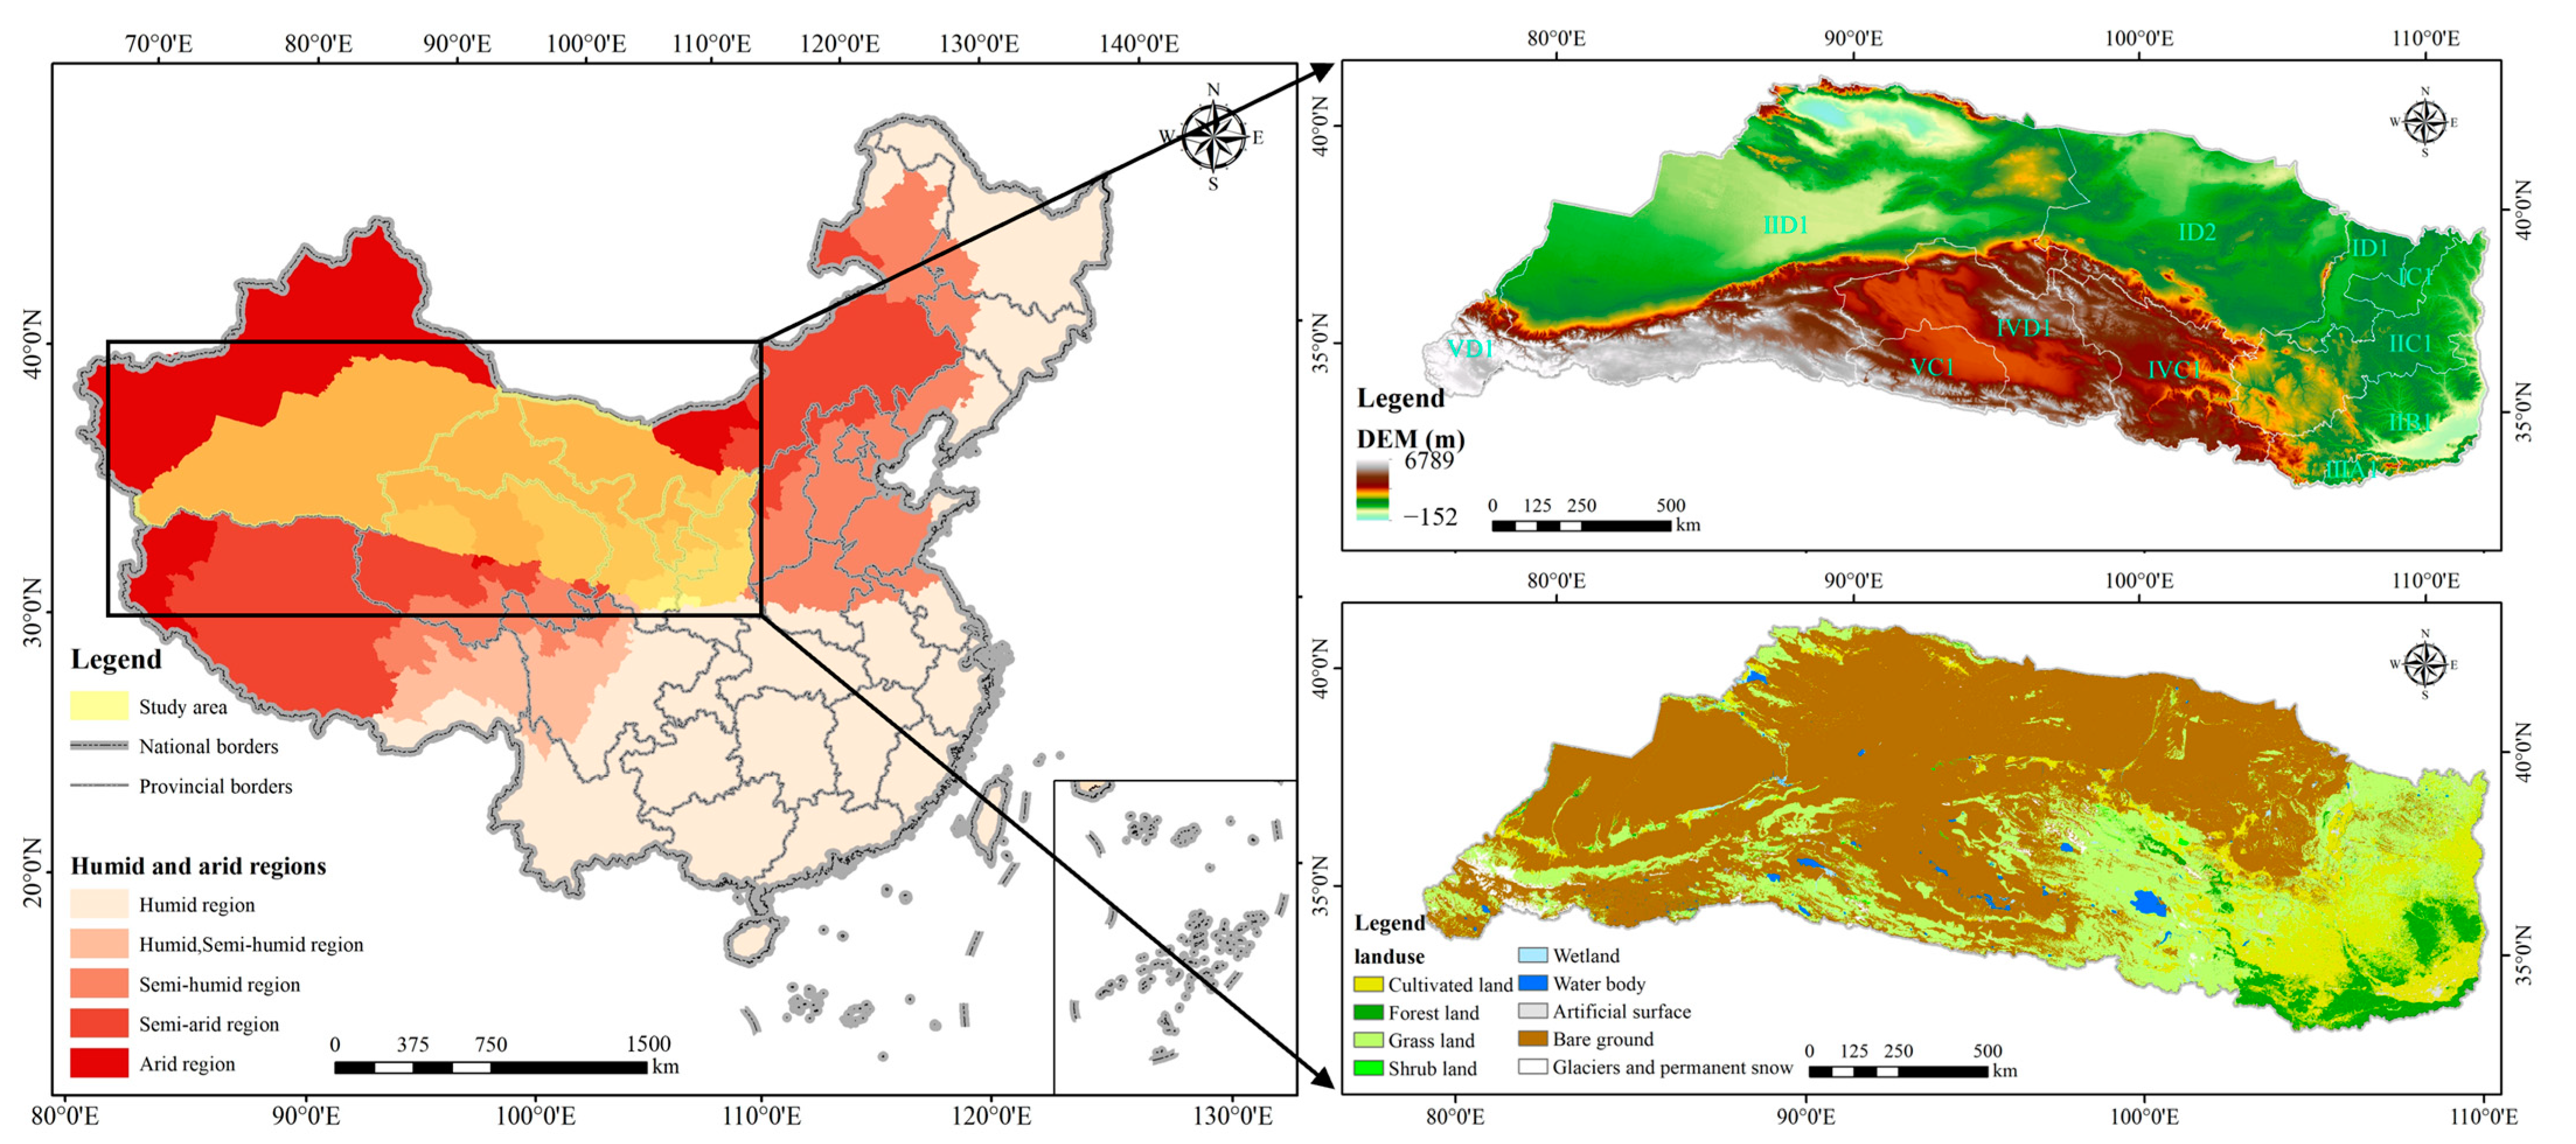
2.2. Study Area
2.3. Data Sources and Processing
2.3.1. Data Sources
2.3.2. Data Processing
3. Results
3.1. Analysis of Marginal Land Type Identification
3.2. Characteristics and Factors of Marginal Land DUP
3.2.1. Analysis of Contiguity Characteristics
3.2.2. Analysis of Restrictive Factors
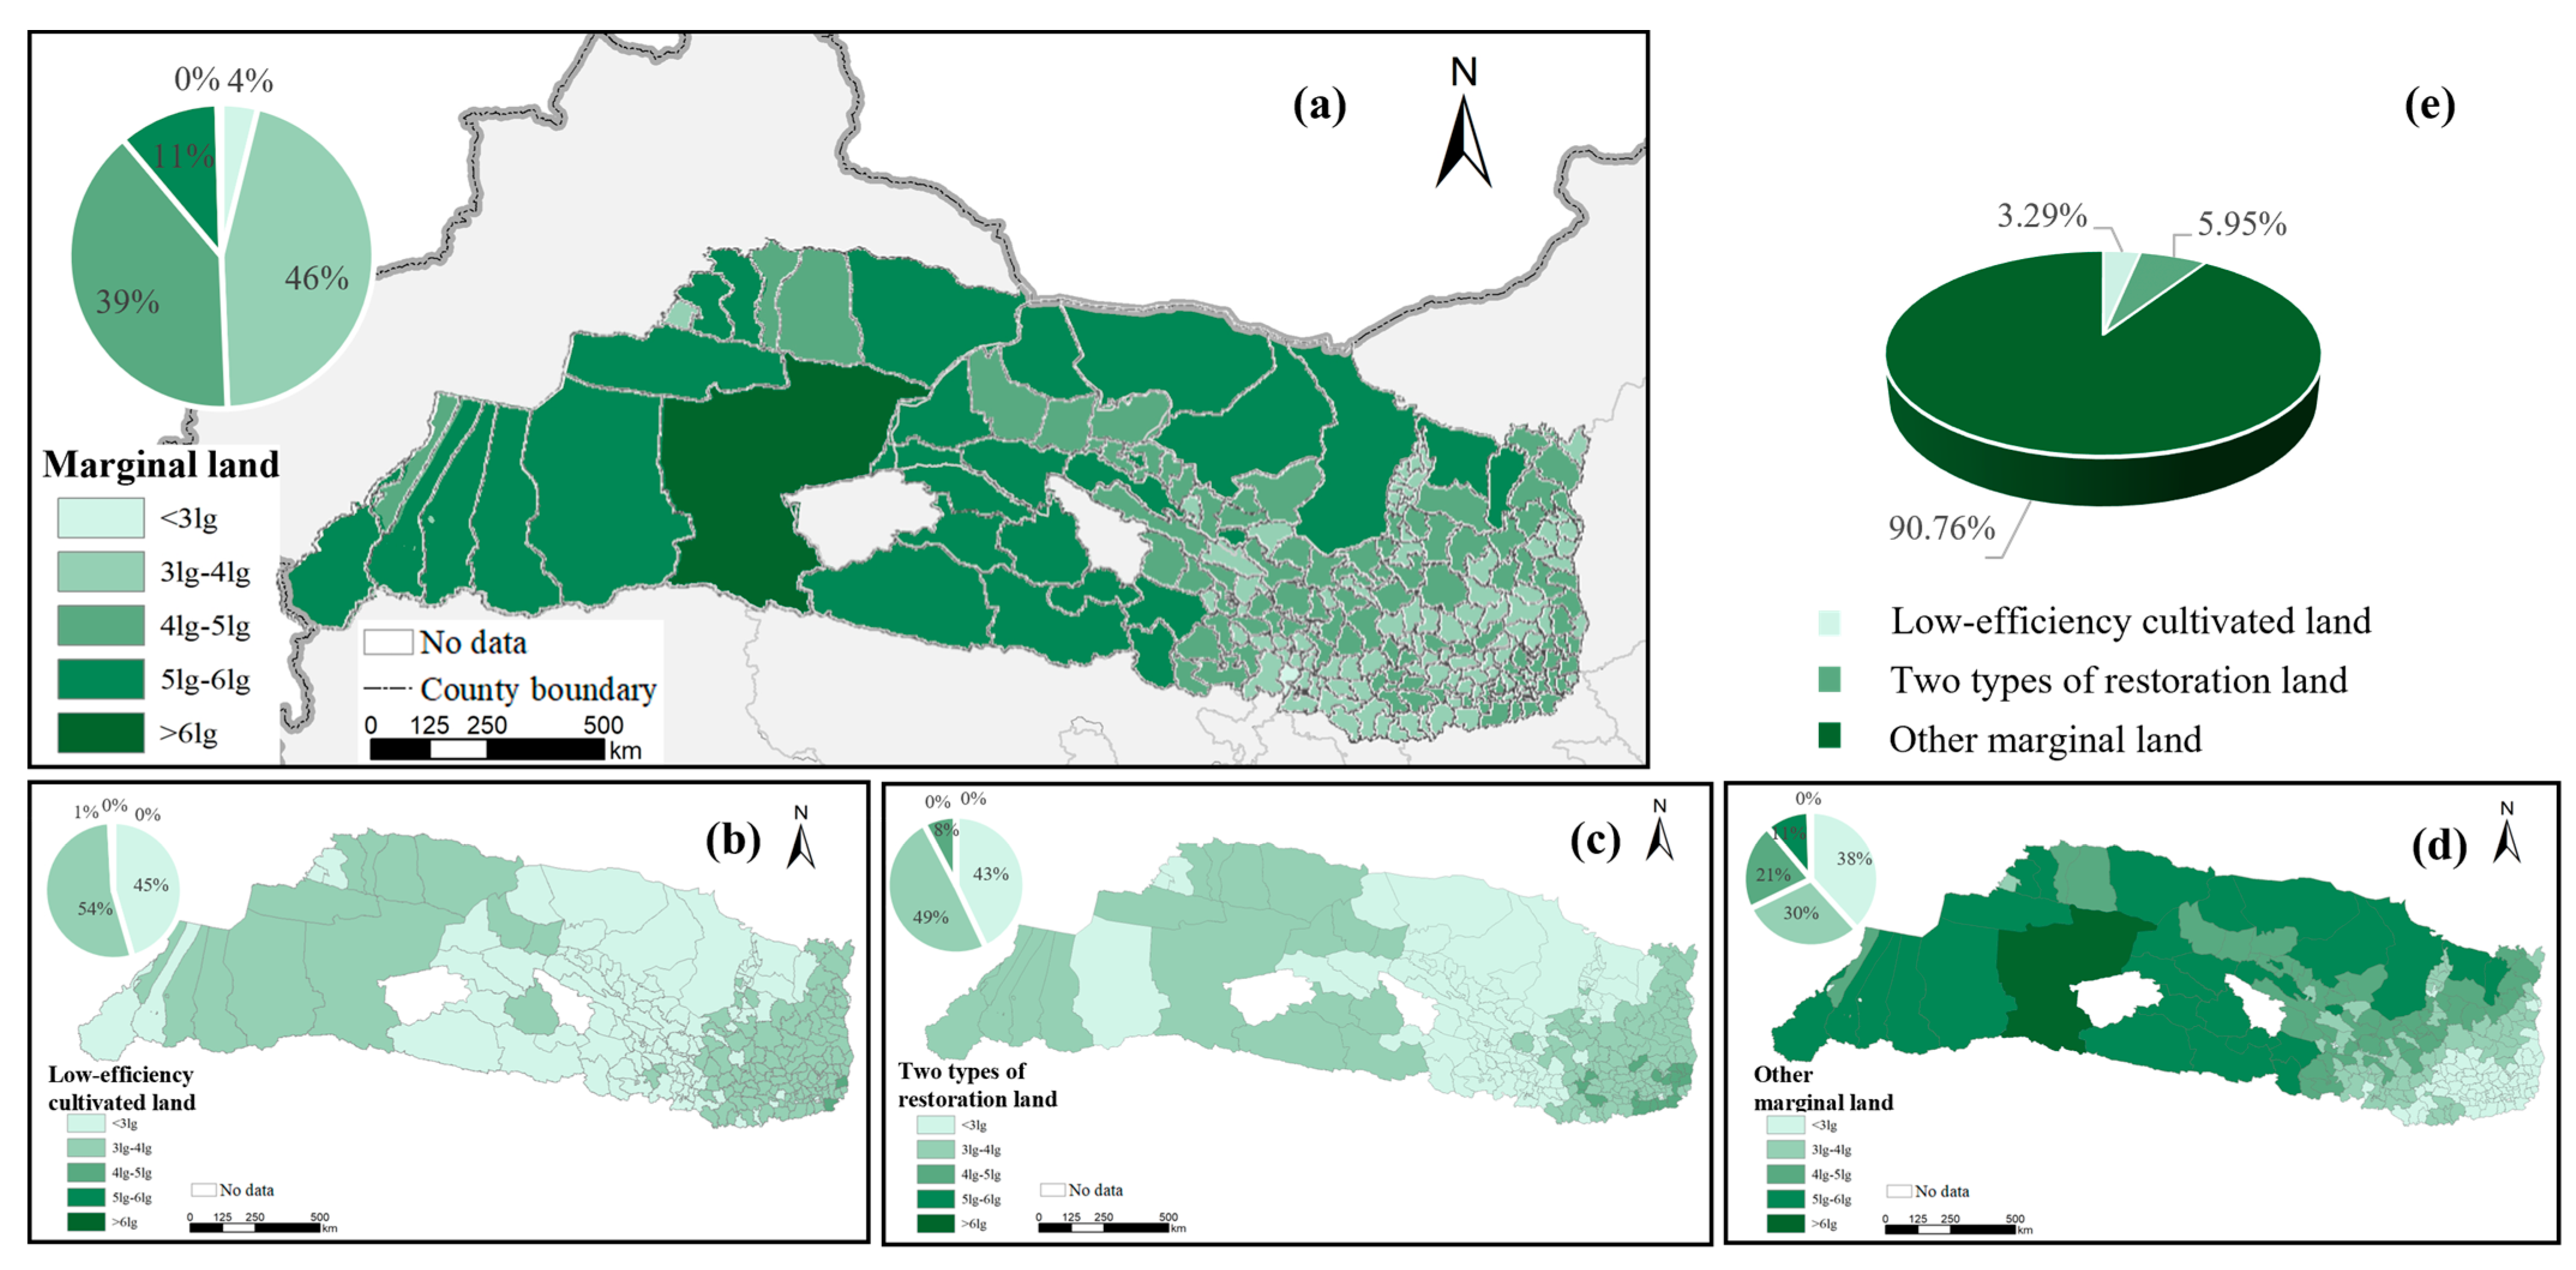
3.3. Analysis of Marginal Land DUP and Results Evaluation
4. Discussion
4.1. Marginal Land Development and Utilization Methods
4.2. Analysis of Marginal Land Development and Utilization Based on Water–Land–Food Framework
4.3. Limitation
5. Conclusions
Author Contributions
Funding
Data Availability Statement
Conflicts of Interest
References
- Chiaka, J.C.; Zhen, L.; Xiao, Y.; Hu, Y.; Wen, X.; Muhirwa, F. Spatial Assessment of Land Suitability Potential for Agriculture in Nigeria. Foods 2024, 13, 568. [Google Scholar] [CrossRef] [PubMed]
- Wang, S.; Wu, H.; Li, J.; Xiao, Q.; Li, J. Assessment of the Effect of the Main Grain-Producing Areas Policy on China’s Food Security. Foods 2024, 13, 654. [Google Scholar] [CrossRef]
- Cao, X.; Sun, B.; Chen, H.; Zhou, J.; Song, X.; Liu, X.; Deng, X.; Li, X.; Zhao, Y.; Zhang, J.; et al. Approaches and research progresses of marginal land productivity expansion and ecological benefit improvement in China. Bull. Chin. Acad. Sci. (Chin. Version) 2020, 36, 336–348. [Google Scholar] [CrossRef]
- Wang, T.; Chi, J. Does the South-to-North Water Diversion Project promote the growth of enterprises above designated size in the water-receiving areas?—Evidence from 31 provincial-level administrative regions in China. PLoS ONE 2024, 19, e0297566. [Google Scholar] [CrossRef] [PubMed]
- Xiang, W.; Tan, M.; Yang, X.; Li, X. The impact of cropland spatial shift on irrigation water use in China. Environ. Impact Assess. Rev. 2022, 97, 106904. [Google Scholar] [CrossRef]
- Zhang, L.; Che, L.; Wang, Z. Where are the critical points of water transfer impact on grain production from the middle route of the south-to-north water diversion project? J. Clean. Prod. 2024, 436, 140465. [Google Scholar] [CrossRef]
- Cavalaglio, G.; Cotana, F.; Nicolini, A.; Coccia, V.; Petrozzi, A.; Formica, A.; Bertini, A. Characterization of Various Biomass Feedstock Suitable for Small-Scale Energy Plants as Preliminary Activity of Biocheaper Project. Sustainability 2020, 12, 6678. [Google Scholar] [CrossRef]
- Ali, S.A.; Tallou, A.; Vivaldi, G.A.; Camposeo, S.; Ferrara, G.; Sanesi, G. Revitalization Potential of Marginal Areas for Sustainable Rural Development in the Puglia Region, Southern Italy: Part I: A Review. Agronomy 2024, 14, 472. [Google Scholar] [CrossRef]
- Strijker, D. Marginal lands in Europe—Causes of decline. Basic Appl. Ecol. 2005, 6, 99–106. [Google Scholar] [CrossRef]
- Milbrandt, A.; Overend, R.P. Assessment of Biomass Resources from Marginal Lands in APEC Economies; United States Department of Energy, Office of Scientific and Technical Information: Oak Ridge, TN, USA, 2009. [Google Scholar] [CrossRef]
- GB/T33469-2016; Cultivated Land Quality Grade. Ministry of Agriculture and Rural Affairs of People’s Republic of China, China Standard Press: Beijing, China, 2016.
- Supplementary Circular on the Adjustment of the Relevant Contents and Requirements of the Third National Land Survey; No. 7. 2019-0407; Ministry of Natural Resources of the People’s Republic of China, Land Survey Office: Beijing, China, 2019.
- Circular of the General Office of the Ministry of Natural Resources on the Survey and Evaluation of Cultivated Land Reserve Resources Across the Country; No. 47. 2021-0702; Ministry of Natural Resources of the People’s Republic of China, Natural Resources Office: Beijing, China, 2021.
- Kuang, W.; Liu, J.; Tian, H.; Shi, H.; Dong, J.; Song, C.; Li, X.; Du, G.; Hou, Y.; Lu, D.; et al. Cropland redistribution to marginal lands undermines environmental sustainability. Natl. Sci. Rev. 2021, 9, nwab091. [Google Scholar] [CrossRef]
- Qaseem, M.F.; Wu, A.-M. Marginal lands for bioenergy in China; An outlook in status, potential and management. GCB Bioenergy 2020, 13, 21–44. [Google Scholar] [CrossRef]
- Mellor, P.; Lord, R.; João, E.; Thomas, R.; Hursthouse, A. Identifying non-agricultural marginal lands as a route to sustainable bioenergy provision—A review and holistic definition. Renew. Sustain. Energy Rev. 2020, 135, 110220. [Google Scholar] [CrossRef]
- Esch, E.; McCann, K.; Kamm, C.; Arce, B.; Carroll, O.; Dolezal, A.; Mazzorato, A.; Noble, D.; Fraser, E.; Fryxell, J.M.; et al. Rising farm costs, marginal land cropping, and ecosystem service markets. Res. Sq. 2021. [Google Scholar] [CrossRef]
- Zhu, L.; Bai, Y.; Zhang, L.; Si, W.; Wang, A.; Weng, C.; Shu, J. Water–Land–Food Nexus for Sustainable Agricultural Development in Main Grain-Producing Areas of North China Plain. Foods 2023, 12, 712. [Google Scholar] [CrossRef]
- Zhang, B.; Hastings, A.; Clifton-Brown, J.C.; Jiang, D.; Faaij, A.P.C. Modeled spatial assessment of biomass productivity and technical potential of Miscanthus × giganteus, Panicum virgatum L., and Jatropha on marginal land in China. GCB Bioenergy 2020, 12, 328–345. [Google Scholar] [CrossRef]
- Scordia, D.; Papazoglou, E.G.; Kotoula, D.; Sanz, M.; Ciria, C.S.; Pérez, J.; Maliarenko, O.; Prysiazhniuk, O.; von Cossel, M.; Greiner, B.E.; et al. Towards identifying industrial crop types and associated agronomies to improve biomass production from marginal lands in Europe. GCB Bioenergy 2022, 14, 710–734. [Google Scholar] [CrossRef]
- Zhao, D.; Yin, F.; Ashraf, T.; Yuan, Z.; Ye, L. Evaluation of Marginal Land Potential and Analysis of Environmental Variables of Jerusalem Artichoke in Shaanxi Province, China. Front. Environ. Sci. 2022, 10, 837947. [Google Scholar] [CrossRef]
- Wei, Y.; Qiu, S.; Zhang, J.Y.; Chen, Q.L.; Chen, L.M.; Tu, T.H.; Dai, T.C. Characteristic of heavy metal contents in agricultural wastes and agricultural risk evaluation. Trans. Chin. Soc. Agric. Eng. 2019, 35, 261–269. [Google Scholar] [CrossRef]
- Akram, H.; Levia, D.F.; Herrick, J.E.; Lydiasari, H.; Schütze, N. Water requirements for oil palm grown on marginal lands: A simulation approach. Agric. Water Manag. 2022, 260, 107292. [Google Scholar] [CrossRef]
- Csikós, N.; Tóth, G. Concepts of agricultural marginal lands and their utilisation: A review. Agric. Syst. 2023, 204, 103560. [Google Scholar] [CrossRef]
- Yang, P.; Zhao, Q.; Cai, X. Machine learning based estimation of land productivity in the contiguous US using biophysical predictors. Environ. Res. Lett. 2020, 15, 074013. [Google Scholar] [CrossRef]
- Kussul, N.; Lavreniuk, M.; Skakun, S.; Shelestov, A. Deep Learning Classification of Land Cover and Crop Types Using Remote Sensing Data. IEEE Geosci. Remote Sens. Lett. 2017, 14, 778–782. [Google Scholar] [CrossRef]
- Wang, K.-L.; Zhang, F.-Q.; Xu, R.-Y.; Miao, Z.; Cheng, Y.-H.; Sun, H.-P. Spatiotemporal pattern evolution and influencing factors of green innovation efficiency: A China’s city level analysis. Ecol. Indic. 2023, 146, 109901. [Google Scholar] [CrossRef]
- Rossi, R.E.; Mulla, D.J.; Journel, A.G.; Franz, E.H. Geostatistical tools for modeling and interpreting ecological spatial dependence. Ecol. Monogr. 1992, 62, 277–314. [Google Scholar] [CrossRef]
- Getis, A.; Ord, J.K. The Analysis of Spatial Association by Use of Distance Statistics. Geogr. Anal. 1992, 24, 189–206. [Google Scholar] [CrossRef]
- Tang, H.; Niu, Z.; Cheng, F.; Niu, J.; Zhang, L.; Guo, M.; Huang, Y. Can We Prevent Irreversible Decline? A Comprehensive Analysis of Natural Conditions and Quality Factor Thresholds of Cultivated Land in China. Land 2023, 12, 1669. [Google Scholar] [CrossRef]
- Song, X.; Song, S.; Li, Z.; Liu, W.; Li, J.; Kang, Y.; Sun, W. Past and future changes in regional crop water requirements in Northwest China. Theor. Appl. Clim. 2018, 137, 2203–2215. [Google Scholar] [CrossRef]
- You, L.; Spoor, M.; Ulimwengu, J.; Zhang, S. Land use change and environmental stress of wheat, rice and corn production in China. China Econ. Rev. 2011, 22, 461–473. [Google Scholar] [CrossRef]
- Wang, Y.; Gao, F.; Gao, G.; Zhao, J.; Wang, X.; Zhang, R. Production and Cultivated Area Variation in Cereal, Rice, Wheat and Maize in China (1998–2016). Agronomy 2019, 9, 222. [Google Scholar] [CrossRef]
- Fei, L.; Meijun, Z.; Jiaqi, S.; Zehui, C.; Xiaoli, W.; Jiuchun, Y. Maize, wheat and rice production potential changes in China under the background of climate change. Agric. Syst. 2020, 182, 102853. [Google Scholar] [CrossRef]
- Ministry of Natural Resources of the People’s Republic of China. China’s Land Ecological Basic Zoning; No.19. 2023-06-20; Natural Resources Office: Beijing, China, 2023. [Google Scholar]
- Dale, V.H.; Kline, K.L.; Wiens, J.; Fargione, J. Biofuels: Implications for Land Use and Biodiversity; Ecological Society of America: Washington, DC, USA, 2010; p. 3. [Google Scholar]
- Shortall, O. “Marginal land” for energy crops: Exploring definitions and embedded assumptions. Energy Policy 2013, 62, 19–27. [Google Scholar] [CrossRef]
- Wells, G.J.; Stuart, N.; Furley, P.A.; Ryan, C.M. Ecosystem service analysis in marginal agricultural lands: A case study in Belize. Ecosyst. Serv. 2018, 32, 70–77. [Google Scholar] [CrossRef]
- Feng, Q.; Chaubey, I.; Her, Y.G.; Cibin, R.; Engel, B.; Volenec, J.; Wang, X. Hydrologic and water quality impacts and biomass production potential on marginal land. Environ. Model. Softw. 2015, 72, 230–238. [Google Scholar] [CrossRef]
- Xu, Y.; Pu, L.; Zhang, R.; Zhu, M.; Zhang, M.; Bu, X.; Xie, X.; Wang, Y. Effects of Agricultural Reclamation on Soil Physicochemical Properties in the Mid-Eastern Coastal Area of China. Land 2021, 10, 142. [Google Scholar] [CrossRef]
- Ishfaq, M.; Akbar, N.; Zulfiqar, U.; Ali, N.; Shah, F.; Anjum, S.A.; Farooq, M. Economic assessment of water-saving irrigation management techniques and continuous flooded irrigation in different rice production systems. Paddy Water Environ. 2022, 20, 37–50. [Google Scholar] [CrossRef]
- Wang, J.; Dong, X.; Zhang, X.; Zhang, X.; Tian, L.; Lou, B.; Liu, X.; Sun, H. Comparing water related indicators and comprehensively evaluating cropping systems and irrigation strategies in the North China Plain for sustainable production. Ecol. Indic. 2023, 147, 110014. [Google Scholar] [CrossRef]
- Li, M.; Zhang, Z.; Liu, D.; Zhang, L.; Li, M.; Khan, M.I.; Li, T.; Cui, S. Optimization of agricultural planting structure in irrigation areas of Heilongjiang province considering the constraints of water resource system resilience. J. Clean. Prod. 2024, 434, 140329. [Google Scholar] [CrossRef]
- Zhou, X.B.; Wang, G.Y.; Yang, L.; Wu, H.Y. Double-Double Row Planting Mode at Deficit Irrigation Regime Increases Winter Wheat Yield and Water Use Efficiency in North China Plain. Agronomy 2020, 10, 1315. [Google Scholar] [CrossRef]
- Li, D.; Xu, E.; Zhang, H. Multiscale and multifunctional analysis of the coupling relationship between land use and desertification. Land Degrad. Dev. 2023, 35, 183–195. [Google Scholar] [CrossRef]
- Gao, W.; Zhou, S.; Yin, X. Spatio-Temporal Evolution Characteristics and Driving Factors of Typical Karst Rocky Desertification Area in the Upper Yangtze River. Sustainability 2024, 16, 2669. [Google Scholar] [CrossRef]
- Xu, J.-W.; Abbas, S.; Xiu, H.-F.; Ma, K.; Pan, Y.-T.; Lan, W.-K.; Mao, Z.-S.; Liu, D. Effects of Different Materials on Desalting and Fertility of Coastal Saline Soil in Zhejiang Province, China. Water Air Soil Pollut. 2023, 234, 407. [Google Scholar] [CrossRef]
- Goswami, S.K.; Kashyap, A.S.; Kumar, R.; Gujjar, R.S.; Singh, A.; Manzar, N. Harnessing Rhizospheric Microbes for Eco-friendly and Sustainable Crop Production in Saline Environments. Curr. Microbiol. 2023, 81, 14. [Google Scholar] [CrossRef] [PubMed]
- Zhou, Y.; Shao, T.; Men, G.; Chen, J.; Li, N.; Gao, X.; Long, X.; Rengel, Z.; Zhu, M. Application of malrstone-based conditioner and plantation of Jerusalem artichoke improved properties of saline-alkaline soil in Inner Mongolia. J. Environ. Manag. 2022, 329, 117083. [Google Scholar] [CrossRef]
- Eastick, R.; Hearnden, M. The role of Germination in the Evaluation of the Potential Weediness of Bt Cotton (Gossypium hirsutum L.) in Tropical Australia; International Cotton Advisory Committee: Washington, DC, USA, 2020; Available online: https://api.semanticscholar.org/CorpusID:232269008 (accessed on 15 October 2024).
- Han, X.; Zhao, Y.; Gao, X.; Jiang, S.; Lin, L.; An, T. Virtual water output intensifies the water scarcity in Northwest China: Current situation, problem analysis and countermeasures. Sci. Total. Environ. 2021, 765, 144276. [Google Scholar] [CrossRef]
- Gopalakrishnan, G.; Negri, M.C.; Snyder, S.W. A Novel Framework to Classify Marginal Land for Sustainable Biomass Feedstock Production. J. Environ. Qual. 2011, 40, 1593–1600. [Google Scholar] [CrossRef]
- Guo, Z.; Zhang, S.; Zhang, L.; Xiang, Y.; Wu, J. A meta-analysis reveals increases in soil organic carbon following the restoration and recovery of croplands in Southwest China. Ecol. Appl. 2024, 34, e2944. [Google Scholar] [CrossRef]
- Chen, M.; Shang, S.; Li, W. Integrated Modeling Approach for Sustainable Land-Water-Food Nexus Management. Agriculture 2020, 10, 104. [Google Scholar] [CrossRef]
- Yao, L.; Li, Y.; Chen, X. A robust water-food-land nexus optimization model for sustainable agricultural development in the Yangtze River Basin. Agric. Water Manag. 2021, 256, 107103. [Google Scholar] [CrossRef]
- Han, S.; Xin, P.; Li, H.; Yang, Y. Evolution of agricultural development and land-water-food nexus in Central Asia. Agric. Water Manag. 2022, 273, 107874. [Google Scholar] [CrossRef]
- Cui, S.; Wu, M.; Huang, X.; Cao, X. Unravelling resources use efficiency and its drivers for water transfer and grain production processes in pumping irrigation system. Sci. Total. Environ. 2021, 818, 151810. [Google Scholar] [CrossRef]
- Rebecca, B.; Raffaele, C.; Francesco, C. Irrigation water economic value and productivity: An econometric estimation for maize grain production in Italy. Agric. Water Manag. 2024, 295, 108757. [Google Scholar]
- Yue, Q.; Zhang, F.; Wang, Y.; Zhang, X.; Guo, P. Fuzzy multi-objective modelling for managing water-food-energy-climate change-land nexus towards sustainability. J. Hydrol. 2020, 596, 125704. [Google Scholar] [CrossRef]


| Primary Region | Temperature Zone | Wet and Dry Region | Secondary Region |
|---|---|---|---|
| Arid northwest region | I. Medium temperate zone | C Semi-arid region | Eastern steppe of Inner Mongolia (I.C1) |
| D Arid region | Desert steppe of the western part of the Ordos and Inner Mongolia Plateau (I.D1) | ||
| Alxa and Hexi Corridor desert area (I.D2) | |||
| II. Warm temperate zone | D Arid region | Tarim Basin desert area (II.D1) | |
| Loess Plateau region | II. Warm temperate zone | B Semi-humid region | Deciduous broad-leaved forest and artificial vegetation area in Fenwei Basin (II.B1) |
| C Semi-arid region | Grassland in the north-central part of the Loess Plateau (II.C1) | ||
| III. Northern subtropics zone | A Humid region | Evergreen and deciduous broad-leaved mixed forest area in Qinba Mountain (III.A1) | |
| Tibetan Plateau region | IV. Plateau temperate zone | C Semi-arid region | Coniferous forest and grassland area of Qingdong Alpine Basin, Qilian (IV.C1) |
| D Arid region | Desert area of Qaidam Basin (IV.D1) | ||
| V. Plateau subarctic zone | C Semi-arid region | Wide valley alpine meadow steppe area of Qingnan Plateau (V.C1) | |
| D Arid region | Alpine desert area of Kunlun Alpine Plateau (V.D1) |
| Categorical Metrics | Indicator Connotation | Indicator Access | Grading and Classification Standards and Codes | ||
|---|---|---|---|---|---|
| 1 | 2 | 3 | |||
| Slope | The degree of steepness of the surface unit to which the cultivated land belongs | Remote sensing-based DEM data | ≤6° | 6~15° | >15° |
| Soil thickness | The sum of the soil layer and the loose parent material layer (cm) | Soil profile survey | ≥100 | 60~100 | <60 |
| Soil texture | Assemblage of mineral particles of different sizes and diameters in cultivated soils | Particle size analysis | Loam | Clay | Sand |
| Soil organic matter content | The amount of organic matter per unit volume of soil (g/kg) | Chemical oxidation or spectroscopy analysis (for example, potassium dichromate oxidation to measure organic carbon) | ≥20 | 10~20 | <10 |
| Soil pH | The degree of acidity and alkalinity of the cultivated soil | pH meter for on-site measurement or laboratory measurement | 6.5~7.5 | 5.5~6.5 or 7.5~8.5 | <5.5 or ≥8.5 |
| Biodiversity | The abundance of biological species | Field survey of soil fauna and microbial diversity sequencing to obtain chao1 index | Abundant | General | Not abundant |
| Low-Efficiency Cultivated Land (LCL) (Virtual) New Cultivated Land | Two Types of Restoration Land (TTRL) New Cultivated Land | Other Marginal Land (OML) New Cultivated Land | Summary | ||||
|---|---|---|---|---|---|---|---|
| Development and utilization potential (DUP) (104 ha) | 43.59 | 78.50 | 1137.08 | 1259.17 | |||
| Current area (104 ha) | 86.60 | 146.18 | 3563.78 | 3796.56 | |||
| DUP/current area (%) | 50.34 | 53.70 | 31.91 | 33.17 | |||
| DUP/current cultivated land (%) | 4.39 | 7.90 | 114.48 | 126.77 | |||
| Crop type | wheat | corn | wheat | corn | wheat | corn | |
| Water demand (108 m3) | 7.26 | 11.21 | 18.00 | 24.22 | 259.35 | 378.68 | 698.72 |
| Liftable yield (104 tons) | 63.58 | 124.54 | 135.55 | 204.82 | 2500.92 | 3201.94 | 6231.35 |
| Liftable/current yield (%) | 5.39 | 4.18 | 11.49 | 6.88 | 211.92 | 107.58 | 149.92 |
Disclaimer/Publisher’s Note: The statements, opinions and data contained in all publications are solely those of the individual author(s) and contributor(s) and not of MDPI and/or the editor(s). MDPI and/or the editor(s) disclaim responsibility for any injury to people or property resulting from any ideas, methods, instructions or products referred to in the content. |
© 2024 by the authors. Licensee MDPI, Basel, Switzerland. This article is an open access article distributed under the terms and conditions of the Creative Commons Attribution (CC BY) license (https://creativecommons.org/licenses/by/4.0/).
Share and Cite
Zhang, A.; Wang, S.; Zhang, Z.; Niu, J.; Guo, M.; Ye, H.; Guo, X.; Su, R.; Tang, H. Classification and Evaluation of Marginal Land for Potential Cultivation in Northwest China Based on Contiguity and Restrictive Factors. Agronomy 2024, 14, 2413. https://doi.org/10.3390/agronomy14102413
Zhang A, Wang S, Zhang Z, Niu J, Guo M, Ye H, Guo X, Su R, Tang H. Classification and Evaluation of Marginal Land for Potential Cultivation in Northwest China Based on Contiguity and Restrictive Factors. Agronomy. 2024; 14(10):2413. https://doi.org/10.3390/agronomy14102413
Chicago/Turabian StyleZhang, Ailin, Sheliang Wang, Zipei Zhang, Jiacheng Niu, Mengyu Guo, Huichun Ye, Xingtao Guo, Ruizhe Su, and Huaizhi Tang. 2024. "Classification and Evaluation of Marginal Land for Potential Cultivation in Northwest China Based on Contiguity and Restrictive Factors" Agronomy 14, no. 10: 2413. https://doi.org/10.3390/agronomy14102413
APA StyleZhang, A., Wang, S., Zhang, Z., Niu, J., Guo, M., Ye, H., Guo, X., Su, R., & Tang, H. (2024). Classification and Evaluation of Marginal Land for Potential Cultivation in Northwest China Based on Contiguity and Restrictive Factors. Agronomy, 14(10), 2413. https://doi.org/10.3390/agronomy14102413