Abstract
Biochar is a potential material for making slow-releasing phosphorus (P) fertilizers for the sake of increasing soil P-use efficiency. The adsorption of phosphorus by pineapple leaf biochar (PB) prepared at different pyrolysis temperatures and its mechanism remain unclear. In order to study the effect of preparation temperature on the structural characteristics of biochar from pineapple leaves and the adsorption of phosphorus by biochar, pineapple leaves were used as raw materials to prepare biochar by restricting oxygen supply at 300 °C, 500 °C, and 700 °C. The structural characteristics and adsorption of phosphorus by pineapple leaf biochar at different temperatures (PB300, PB500, and PB700) were analyzed. The results showed the following: (1) The pore structure of biochar pyrolysis at 300 °C (PB300) did not significantly change, while the surface structure of biochar pyrolysis at 700 °C (PB700) significantly changed, the specific surface area (SBET) increased by 26.91~37.10 times that observed in PB300 and PB500, and the pore wall became thinner. (2) The number of functional groups (C=O) in PB700 decreased, and the relative content of C-H/-CHO in PB500 and PB700 increased by 4.38 times that observed in PB300. (3) The adsorption of phosphorus by biochar was a multi-molecular layer chemisorption, accompanied by single-molecular-layer physical adsorption and intramolecular diffusion. For PB300, both the physical and chemical processes of the adsorption of PO43− by biochar were weakened, and the chemical process was dominated by cationic (Ca2+, Mg2+, Fe3+, and Al3+) adsorption at 500 °C. For PB700, the physical adsorption dominated by pore size structure was the main process, and the physicochemical adsorption at 700 °C was significantly stronger than that observed at 300 °C and 500 °C. These results indicate that biochar prepared at 500 °C can save energy in the preparation process and has excellent physical and chemical structure, which can be used as the basic material for further modification and preparation of biochar phosphate fertilizer.
1. Introduction
Biochar is a solid substance rich in carbon obtained by cracking plant and animal residues at high temperatures and limited oxygen [1]. Crop residues, tree residues, animal excrement, kitchen waste, etc., can be used as raw materials for biochar preparation [2,3,4,5]. It has high chemical stability, is not easily dissolved by water or other solvents, and there are a large number of aromatic carbon rings in the biochar structure [5,6]. Biochar materials are mostly light black, fluffy substances containing carbon, hydrogen, oxygen, nitrogen, and small amounts of minerals and volatile organic compounds [7]. Due to its high carbon content, abundant surface functional groups, developed pore structure, and large specific surface area, biochar has been widely used in soil fertilizer improvement and phosphorus-polluted wastewater remediation [8,9,10,11], carbon sequestration and emission reduction [3], and environmental and medical applications [12,13,14], which cannot only solve the problem of straw waste treatment, but also increase the high-value utilization of agricultural by-products [15,16].
The pineapple (Ananas comosus L.) is one of the most essential fruits in the world and is planted extensively in tropical and sub-tropical regions [17]. Guangdong Province is the main production area of pineapple in China, and its planting area accounts for about 50% of the country’s planting area. A large number of pineapple stem and leaf by-products are produced every year [18,19]. After harvesting and processing, the large quantity of pineapple crowns, cores, and leaves are typically disposed of in landfills or burned in open areas. The latter results in emissions of carbon in the form of gaseous methane (CH4) with combustion by-products (CO2 and CO), including the generation of atmospheric pollutants (NOx) [20]. Pineapple leaf is one of the most abundantly available waste materials and has not been studied as required. Such a huge amount of spent pineapple leaves can be an ideal biochar precursor [21].
The type of raw material and the preparation temperature of biochar will affect its structural characteristics and element content, and thus determine its utilization efficiency [1]. Huang et al. (2014) [22] obtained biochar by the pyrolysis of corn stalks, and observed that, when the pyrolysis temperatures were 300 °C, 500 °C, and 700 °C, respectively, the chemical composition and structure of the prepared biochar showed significant changes; moreover, the content of carbon increased with the rise in pyrolysis temperature, while the content of hydrogen and oxygen decreased.
Tan et al. (2022) [23] used representative tropical agricultural wastes, such as banana stem, pineapple leaf, litchi straw, rice straw, coconut, mushroom residue, and cassava, to prepare biochar at different temperatures. During the pyrolysis process, the basic physicochemical composition of the raw materials changed significantly. Claoston et al. (2014) [24] used empty fruit bunch and rice husk as biomass raw materials to produce biochar by pyrolysis at different temperatures. They found that, as the pyrolysis temperature increased, the pore wall inside of the biochar became thinner, the pore structure became larger, the carbon content increased, aromaticity increased, and the polarity decreased. It can be seen that the physical and chemical properties of biochar are greatly affected by the pyrolysis temperature [25,26,27]. Therefore, studying the effect of the preparation temperature on the physicochemical characteristics of pineapple leaf biochar is the basis of determining its utilization. Because of its special structural and chemical properties, biochar has a certain adsorption and fixation effect on ions, and the adsorption efficiency varies with different types of ions.
In a previous study, we compared and analyzed the structural characteristics of pineapple leaf biochar, banana stalk biochar, bagasse biochar, and coconut bran biochar prepared at different temperatures. The results showed that the specific surface area of banana stem biochar was larger than that of pineapple leaf biochar, while that of pineapple leaf biochar was larger than that of bagasse biochar. However, the specific surface area of coconut bran biochar prepared at 500 °C was greater than that of pineapple leaf and bagasse biochar prepared at 500 °C, and the mesopores and micropores of pineapple leaf biochar prepared at 700 °C were more abundant [5]. Tan et al., (2022) [23] studied the preparation of pineapple leaf biochar, litchi stick biochar, and coconut shell biochar at different temperatures, as well as banana stem biochar, rice straw biochar, cassava stem biochar, and mushroom residue biochar. It was found that C/H and C/N increased with the increase in temperature, C/O decreased significantly with the increase in temperature, and the oxidation degree increased.
Phosphorus mainly exists in the form of phosphate anions (PO43−, H2PO4−, and HPO42−) in water, which is a key factor leading to water eutrophication [28]. In agricultural production, a large number of pesticides and fertilizers are used in the pursuit of yield improvement, which leads to water eutrophication [29,30,31]. Excessive phosphorus in water will lead to algal blooms and anoxia, which will further affect the growth of other aquatic organisms [32]. Water dephosphorization technology includes biological treatment technology using microbial action; chemical precipitation technology, forming insoluble phosphate precipitation through chemical reaction; electrochemical treatment technology, making phosphorus undergo redox reaction through electric current; and physical adsorption technology using specific material surface characteristics to adsorb phosphorus [33,34]. Among them, the adsorption method removes phosphorus simply and easily, has good selectivity and a good phosphate removal effect, and the recovered phosphorus can be reused [35,36].
Biochar has abundant active sites for phosphorus adsorption due to abundant surface groups, a porous structure, and a high content of mineral components [37,38,39]. Functional biochar performs better than unmodified biochar for environmental management, soil remediation, and energy storage [28,40]. For example, biochar obtained from anaerobic digestion of sugar beet tailings was found to be a promising adsorbent to recover phosphorus from water with a maximum adsorption capacity of 0.13 mg/g [41]. Biochar made by pyrolysis sugarcane straw was found to have an adsorption capacity of 17.6 mg/g [15]. Rare metals are proposed to modify biochar for phosphorus adsorption. The maximum adsorption capacity of lanthanum-modified biochar prepared from municipal sludge was found to be 93.91 mg/g [42]. Xu et al. (2019) [43] reported the adsorption capacity to be 36.06 mg P/g using lanthanum-modified biochar.
However, the adsorption effect and process of pineapple leaf biochar prepared under different temperature conditions are still unclear, which greatly limits the application of pineapple leaf biochar in phosphorus-polluted wastewater remediation, soil fertilizer improvement, and slow-release phosphate fertilizer. In this study, pineapple leaf biochar was prepared at three temperatures (300 °C, 500 °C, and 700 °C), and its structural characteristics and adsorption of phosphorus were analyzed. The research results can provide a theoretical basis for carbonization utilization of pineapple leaves and provide directions for further exploration of the resource utilization of pineapple leaves.
2. Materials and Methods
2.1. Preparation of Biochar Materials
Select the pineapple leaf material during the harvest period, rinse it with water, air dry it naturally, and grind it through a 2 mm screen to obtain the raw material for biochar preparation. Then, put an appropriate amount of pineapple leaf material into a ceramic crucible; seal it with tin foil; put it into an energy-saving vacuum tube furnace (SK3-4-10-10-10, Zhuochi, Hangzhou, China) under a 120 mL/min N2 gas flow rate; heat it up to 300 °C, 500 °C, and 700 °C, respectively, at 5 °C/min; and keep it in this state for 2 h, until the reactor temperature cools to room temperature. Take out the biochar and grind it through a 1 mm screen to obtain biochar for testing. Label them PB300, PB500, and PB700.
2.2. Structural Characterization of Biochar Materials in Pineapple Leaves
2.2.1. Element Composition
The elements carbon (C), nitrogen (N), hydrogen (H), oxygen (O), and sulfur (S) were determined using an elemental analyzer (Elementar Vario UNICUBE, Elementar, Langenselbold, Germany). The P content was determined using a sulfuric-acid-digestion spectrophotometer (UV2700, SHIMADZU, Kyoto, Japan). Magnesium (Mg), calcium (Ca), iron (Fe), and aluminum (Al) contents were determined using a nitric-acid-digestion, inductively coupled, plasma mass spectrometer (ICP-MS) (Agilent Technologies 7850, Santa Clara, CA, USA).
2.2.2. Functional Group Structure Analysis
FTIR analyses were used to analyze the functional groups on the surfaces of the biochar. To obtain the observable spectra, the biochar samples were mixed to approximately 1.0 wt% with spectroscopic-grade KBr and ground further with an agate mortar for dilution and homogenization. The spectra were obtained using an FTIR spectrophotometer (SHIMADZU, IRTrace-100, Kyoto, Japan). The FTIR measurements were recorded in the range of 400–4000 cm−1, with a resolution of 2.0. Interferograms of 1024 scans were averaged for each spectrum.
2.2.3. Specific Surface Area Analysis
The BET surface area was determined using N2 sorption analysis at 77.3 K with a Micromeritics ASAP-2420 system (Micromeritics Instruments, Norcross, GA, USA). Biochar samples weighing between 0.1 and 0.3 g were vacuum-degassed at 300 °C for 2 h before analysis. The BET surface area, pore volume, and pore size distribution of the samples were obtained using the automated Micromeritics ASAP-2460 automated software Version 3.01 with the BET (Brunauer, Emmettand Teller) equation.
2.2.4. Scanning Electron Microscopy
The surface morphologies of the biochar samples were observed using scanning electron microscopy (SEM) (Tescan Mira4, Brno, Czech Republic). Prior to the SEM observations, the surfaces of the samples were coated with a thin electric conductive gold film.
2.2.5. Thermogravimetric Analysis
The thermal characterization of biochar was conducted using thermogravimetric (TG) and derivative thermogravimetric (DTG) analyses on a Discovery TGA55 (TA Instruments, Tokyo, Japan). Non-isothermal TG analysis was performed using a Pyris 1 TGA. The analyses were conducted with a 20 cm3 min−1 N2 flow at a heating rate of 10 °C/min from 30 to 800 °C. Approximately 1.5 mg of sample was used for each experiment. The mass loss (TG) and derivative curves (DTG) of the samples were represented as functions of temperature to allow for pyrolysis temperature selection.
2.3. Adsorption Test
2.3.1. Adsorption Capacity
Adsorption capacity test: A total of 0.2 g of pineapple leaf biochar material was added into the solutions containing phosphorus content of 114 mg L−1 and 228 mg L−1, respectively, and the pH value was adjusted to 3 with 1 M hydrochloric acid. After sealing, the phosphorus content in the supernatant was determined by shaking at 200 rpm at 25 °C for 30 min, and the adsorption capacity of phosphorus by the biochar was calculated.
The adsorption capacity (Qe) of phosphorus by the biochar is calculated via the following formula:
Qe = ((C1 − C2) × V)/m
In this equation, Qe denotes the adsorption capacity (mg g−1), C1 represents the initial concentration of PO43− (mg L−1), C2 signifies the consistency of PO43− after adsorption (mg L−1), V corresponds to the volume of the solution (L), and m indicates the mass of the adsorbent material (g).
2.3.2. Adsorption Kinetic Research
The evaluation of adsorption kinetics was conducted using pseudo-second-order, pseudo-first-order, and intra-particle diffusion models, as depicted in Equations (2)–(4).
Pseudo-first-order, nonlinear equation:
In these equations, Qt represents the adsorption quantity at a certain time (mg g−1), Qe denotes the equilibrium adsorption capacity (mg g−1), t denotes the adsorption time (min), and k1 indicates the pseudo-first-order adsorption rate constant (min−1).
Pseudo-second-order, nonlinear equation:
In this equation, k2 (g m g−1 min−1) represents the pseudo-second-order rate constant.
Intra-particle diffusion:
In this equation, kp represents the rate constant relevant to the intra-particle diffusion model (mg g−1 min−1/2). The constant C is associated with the thickness of the boundary layer (mg g−1), and a higher value of C implies a more pronounced influence on the limiting boundary layer.
2.3.3. Adsorption Isotherm Research
This study established a range of phosphorus concentrations at 10, 20, 50, 100, 200, 500, and 1000 mg L−1, and subjected the adsorption samples to a 30 min agitation at 25 °C. The adsorption isotherm was subsequently analyzed, depending on the Langmuir, Freundlich, and Temkin models, as denoted by Equations (5)–(7).
Langmuir:
In this equation, KL is defined as the Langmuir adsorption isotherm constant (L mg−1), Qm represents the utmost monolayer adsorption capacity (mg g−1), Qe (mg g−1) signifies the equilibrium adsorption capacity, and Ce indicates the equilibrium phosphorus concentration (mg L−1).
Freundlich adsorption isotherm:
In the given equation, KF denotes the Freundlich adsorption capacity (mg g−1). The Freundlich equation constant, 1/n (dimensionless), also referred to as the Freundlich adsorption intensity, signifies the reaction intensity between phosphorus and the adsorbent, which varies with the non-uniformity of the adsorbent. A value of 1/n is within the range of 0 and 1. A value within the range of 0.1 to 0.5 implies a higher adsorption intensity, suggesting favorable adsorption conditions.
In the context of the Temkin model, the indirect mutual effects among the adsorbates lead to a linear decline in the enthalpy of adsorption as a function of surface coverage. Consequently, the enthalpy of adsorption reduces linearly with the quantity of adsorbed species.
In this equation, b represents a constant associated with the enthalpy of adsorption (J mol−1), b < 4.2 kJ mol−1. The equilibrium constant, denoted as KT (L mg−1), signifies the maximum binding energy in the context of material analysis and detection.
2.4. Comprehensive Evaluation of Biochar Properties
Principal component analysis was used to select 19 indicators, including mineral element content, a functional group, SBET, SMicro, SMecro, VTot, VMicro, VMecro, DTot, and Qm. After the standardization of each index, principal component analysis was carried out. Two principal components were extracted, according to the principle that the cumulative variance contribution rate was greater than 80%. The principal component scores and comprehensive scores were calculated and sorted to comprehensively evaluate the biochar properties.
2.5. Data Processing
Microsoft Excel 2021 was used for data analysis and processing, and Origin2021 was used for mapping. Multiple comparisons were made with the ANOVA LSD method using SPSS23.0 (p < 0.05).
3. Results
3.1. Basic Properties of Pineapple Leaf Biochar
As shown in Figure 1, the weight loss process of pineapple leaf combustion is divided into three stages; moreover, when the temperature reaches 100 °C, the weight loss of biochar is about 20%. This stage mainly involves the loss of water, and the highest temperature point for weight loss is the trough point of 90 °C. At 100~600 °C, the weight of the biochar continues to decrease, and the weight loss rate at this stage is the highest at 450 °C, mainly due to the pyrolysis and volatilization of hemicellulose, cellulose, and some lignin. At 600~800 °C, we observe mainly the pyrolysis weight loss of lignin with a high stable form, and 730 °C is the temperature point of the rapid decomposition of lignin. Compared with PB300 at 400~800 °C, the weight loss of PB500 and PB700 is relatively slow, indicating that the biochar prepared at a high temperature is more stable.
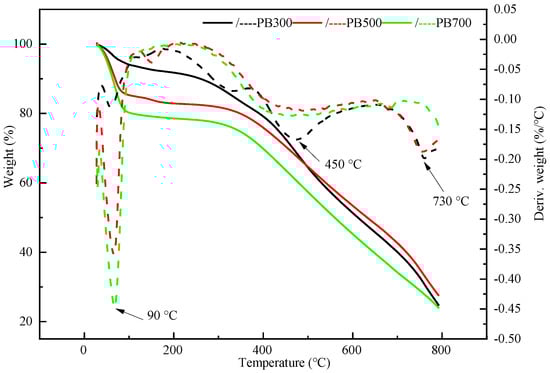
Figure 1.
Derivative thermogravimetric analysis curves of PAL biochar (PB).
The preparation temperature of biochar determines the content of the elements in it, as shown in Table 1. The carbon (C) content increases with the increase in temperature. The reason for this is that the carbonization of organic matter is incomplete at low temperatures, and the organic matter is gradually carbonized at high temperatures. The carbon content of biochar increased from 58.85% (PB300) to 60.12% (PB700). The contents of hydrogen (H), oxygen (O), nitrogen (N), and sulfur (S) decreased gradually with the increase in the biochar preparation temperature. This is mainly because substances decompose at high temperatures, more chemical bonds break, and H, O, N, and S release volatilization. With the gradual increase in biochar preparation temperature, the mineral elements phosphorus (P), magnesium (Mg), calcium (Ca), iron (Fe), and aluminum (Al) are enriched, and their contents also showed an increasing trend. The total content of the tested elements showed the opposite trend, indicating that the higher the temperature of biochar preparation, the greater the element volatilization.

Table 1.
Chemical characteristics of biochar at different pyrolysis temperatures.
C/H reflects the aromaticity of the biochar. With a higher (O+N)/C value, the polarity of the biochar is strong. As can be seen from Table 1, C/H increased from 14.06 to 30.05 with the increase in preparation temperature, mainly because high temperatures gradually decompose and volatilize unstable compounds containing hydrogen in the material, resulting in an increase in the relative carbon content of the biochar. Therefore, the pineapple leaf biochar prepared at a high temperature has strong aromatics. With the increase in pyrolysis temperature, the (O+N)/C ratio decreased from 0.36 (PB300) to 0.26 (PB500, PB700), indicating that the oxygen and nitrogen contents of the pineapple leaf biochar decreased, its polarity decreased, and its hydrophobicity increased. In general, the pineapple leaf biochar prepared at high temperatures has a higher carbon content, a lower polarity, stronger aromatics, and better hydrophobicity. There was a significant negative correlation between C/O and cation exchange capacity, and the C/O ratio increased with the increase in preparation temperature, indicating that the cation adsorption capacity of the pineapple leaf biochar prepared at high temperatures (500 °C and 700 °C) was lower than that prepared at 300 °C. The preparation temperature gradually increased from 300 °C to 500 °C, and the raw materials of the biochar underwent a violent pyrolysis process, resulting in a significant decrease in the (O+N)/C of the biochar and a significant increase in H/C and O/C. The pyrolysis of the biochar gradually increased from 500 °C to 700 °C, and the change in element content was relatively small.
3.2. Surface Functional Groups of Pineapple Leaf Biochar
The changes in the relative content of the functional group structure of the PB material with temperature are shown in Table 2 (the FTIR spectra was shown in Figure S1), and the types and quantities of functional groups change greatly with temperature. The number of functional groups in the biochar prepared at 700 °C decreased significantly. The absorption peak at 1057 cm−1 is the characteristic peak of C-O-C vibration, and this functional group has the strongest vibration in the biochar prepared at 500 °C. The obvious change in absorption peak at 1160~1057 cm−1 indicates that cellulose, hemicellulose, and some lignin decompose obviously during the pyrolysis process above 500 °C. The absorption peak observed at 1301 cm−1 is the characteristic peak of C-H/-CH3, and the functional group also increased significantly as the preparation temperature increased from 300 °C to 500 °C. The organic structural components containing C=O functional groups decomposed with the increase in temperature. In addition, C-H vibration at 2856 cm−1 and H-O vibration at 3400 cm−1 can also be obviously observed in the biochar prepared at 300 °C. With the increase in preparation temperature, the H-O functional groups gradually decomposed. In particular, the H-O functional groups of PB700 decreased significantly. This is mainly because substances decompose more violently at higher temperatures.
Table 2.
Relative content of functional groups of PB at different pyrolysis temperatures.
The infrared characteristic peaks were integrated, and the results are shown in Table 2. With the increase in temperature, the functional groups gradually decomposed and volatilized. In the biochar prepared at 300 °C, the number of C=C functional groups (1613 cm−1) with 31.31% was the highest, followed by C-H/-CH3 (27.32%), while the number of H-O (5.76%) was the lowest. When biochar was prepared at 500 °C and 700 °C, the H-O functional group completely decomposed. For PB500, the order of the functional groups’ relative content is as follows: C-H/-CHO (52.21%) > C-H/-CH3 (25.90%) > C-O-C (11.96%) > C=O (9.92%). In PB700, the functional groups were mainly C-H/-CHO (48.69%) and C-O-C (42.34%).
3.3. Pore Structure of Pineapple Leaf Biochar
Figure 2 shows the morphological and structural characteristics of pineapple leaf biochar prepared at different temperatures. It can be seen from the figure that there are obvious differences in the pore size of the biochar prepared at different temperatures. The biochar prepared at 300 °C (Figure 2a) showed a certain pore structure, but still retained the structural characteristics of the raw material, and the pore wall did not change significantly. A greater pore diameter can be observed in the pore wall of the biochar prepared at 500 °C (Figure 2b), indicating that, at this temperature, the chemical bonds in the pineapple leaves are broken, substances volatilize, and new pore structures are formed. The pore wall of the biochar prepared at 300 °C and 500 °C is harder and smoother and is more determined by the nature of the raw materials. However, at the preparation temperature of 700 °C, the surface structure of the biochar material (Figure 2c) changes significantly, and the pore wall became thinner, looser, and lighter, mainly because more substances decompose and volatilize at the higher temperature, and the biochar is restructured.
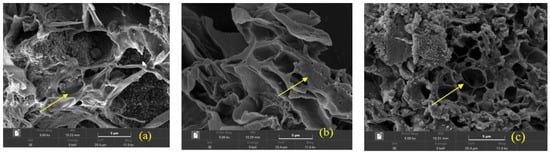
Figure 2.
SEM images of surface pore size structure of biochar ((a) PB300; (b) PB500; (c) PB700).
According to the N2 adsorption and desorption curve of biochar material shown in Figure 3a–d, it can be observed that the N2 adsorption and desorption curve of biochar material conforms to the characteristics of the IV isothermal adsorption curve. The adsorption capacities of the biochar prepared at 300 °C and 500 °C are similar, as shown in Figure 3a,b, but the adsorption capacity of the biochar prepared at 700 °C increases significantly (Figure 3c), mainly because the specific surface area of biochar prepared at high temperatures is larger. In addition, the adsorption and desorption curve of the biochar prepared at 700 °C was not closed, and the desorption curve gradually approached the Y axis, indicating that there were slit-structure pores in the biochar prepared at this temperature. It can be seen that the pore size of the biochar prepared at a high temperature not only increased, but also diversified in pore morphology. It can be seen from Figure 3d that the pore structures of the biochar prepared at different temperatures mainly consist of micropores and mesoporous below 50 nm. The pore structure of the biochar prepared at 700 °C and 500 °C is mainly distributed in the range of 0~5 nm, and the pore structure of the biochar prepared at 300 °C is mainly distributed in about 15 nm.
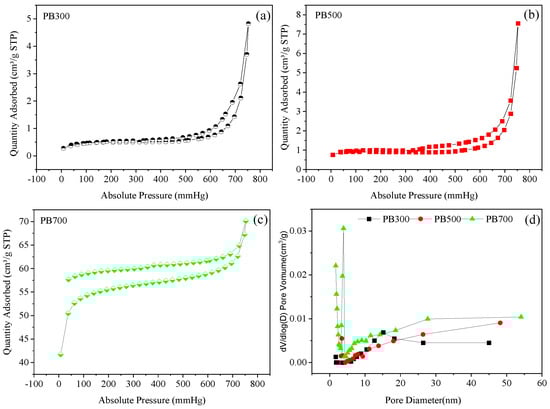
Figure 3.
Nitrogen physisorb isotherm (a–c) and pore size distribution (d) of biochar.
The pore structure characteristics of the biochar materials prepared at different temperatures are shown in Table 3. With the increase in preparation temperature, the specific surface area of the biochar materials showed an increasing trend. When the preparation temperature reached 700 °C, the specific surface area of the obtained biochar increased significantly, compared with the biochar prepared at 300 °C and 500 °C, and the specific surface area increased by about 37.10 times and 26.91 times, respectively. This further shows that more pore structures are formed by decomposition and volatilization at high temperatures. The pore volume also increased with the increase in preparation temperature. At high temperatures, the micropore area and volume of biochar are larger than the mesoporous area and volume. With the increase in preparation temperature, the pore diameter decreased from 7.01 nm to 1.80 nm, indicating that the newly formed pore structure mainly comprises small micropores.
Table 3.
Pore structure characteristics of biochar materials prepared at different temperatures.
3.4. Analysis of Phosphorus Adsorption Capacity of Pineapple Leaf Biochar Material
The adsorption capacity of biochar of phosphate is shown in Figure 4. With the increase in preparation temperature, the adsorption capacity of phosphorus by the biochar increased gradually, and the adsorption capacity of phosphorus was stronger in the high-concentration phosphorus solution. In the potassium dihydrogen phosphate solution with a phosphorus content of 114 mg L−1, the adsorption capacity of the biochar prepared at 500 °C was 1.41 times higher than that prepared at 300 °C, and the adsorption capacity of the biochar prepared at 700 °C was 1.22 times higher than that prepared at 500 °C and 1.71 times higher than that prepared at 300 °C. In the solution of potassium dihydrogen phosphate containing 228 mg L−1 of phosphorus, the adsorption capacity of the biochar was affected by its preparation temperature. When the biochar was prepared at 300 °C and 500 °C, their adsorption capacity of phosphorus was similar, and there was no significant difference. However, when the preparation temperature of the biochar was increased to 700 °C, its adsorption capacity of phosphorus significantly enhanced, reaching 7.45 mg g−1, which is about 1.21 times that of the adsorption capacity of the biochar prepared at 300 °C and 500 °C, indicating that high temperature treatment can improve the adsorption performance of biochar. It can be seen that the pineapple leaf biochar prepared at high temperatures has a stronger adsorption capacity of phosphorus.
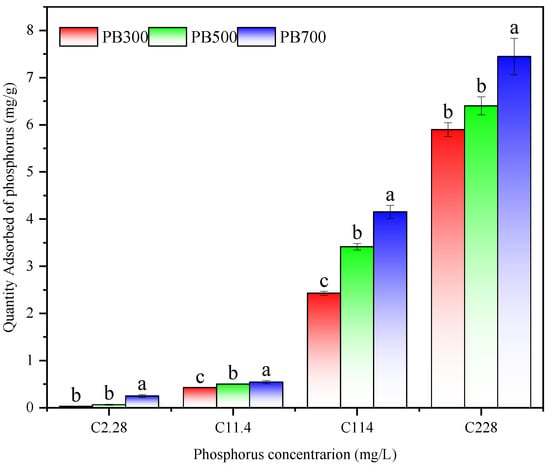
Figure 4.
Adsorption capacity of phosphorus by biochar materials (n = 3, different lowercase letters indicate a significant difference (p < 0.05) among treatments.).
3.5. Kinetic Model Analysis of Adsorption of Phosphorus by Biochar of Pineapple Leaves
As shown in Figure 5, the phosphorus adsorption of PB700, PB500, and PB300 biochar is divided into two stages: fast and slow. The adsorption equilibrium was reached at 90 min, and the adsorption saturation was PB700 > PB500 > PB300. Fast adsorption rapidly occupies the site due to the high phosphate concentration, while slow adsorption slows down due to the decreasing concentration and site saturation until adsorption and desorption are in equilibrium.
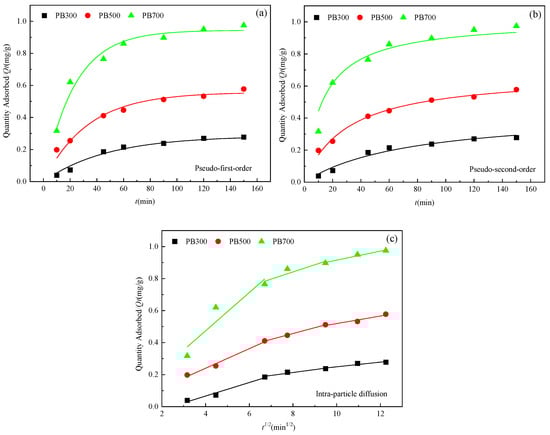
Figure 5.
Fitting curves of the kinetic model of adsorption phosphorus by three biochar types ((a) Pseudo-first-order, (b) Pseudo-second-order, (c) Intra-particle diffusion).
In order to further explore the mechanism of adsorption of phosphorus by biochar from pineapple leaves, an intra-particle diffusion model was analyzed (Figure 5c). In the initial stage, the active sites on the biochar surface are occupied rapidly, mainly by ion surface diffusion. Then, when the second stage begins, the adsorption site on the surface of the biochar is saturated, and phosphorus begins to slowly enter the internal region of the biochar and be captured by the internal adsorption site. The adsorption rate at this stage is slow, mainly because it is closely related to the pore structure and pore size of the biochar (mainly for mesoporous diffusion). In the third stage, the adsorption sites on the biochar are basically occupied, the adsorption rate is slower, and the main stage is micropore diffusion. On the surface of PB700, the medium pores and micropores increased, and the adsorption process mainly comprised micropore filling.
The in-particle diffusion model fits into a straight line without passing through the origin, indicating that in-particle diffusion is not the only rate-limiting factor when the biochar adsorbs phosphate.
The pseudo-first-order kinetic model, pseudo-second-order kinetic model, and intra-particle diffusion model parameters were obtained. It was found that the R2 values of PB300 and PB700 were higher and more consistent with the pseudo-first-order kinetic model, indicating that the adsorption of phosphorus by the biochar was closely related to the adsorption site, while PB500 was more consistent with the pseudo-second-order kinetic model (Table 4).
Table 4.
Fitting parameters of adsorption phosphorus kinetic models for three biochar types.
3.6. Isothermal Model Analysis of Adsorption Phosphorus by Pineapple Leaf Biochar
The Langmuir model, Freundlich model, and Temkin model were used to fit the adsorption of phosphorus by three kinds of biochar. The results are shown in Figure 6, and the relevant parameters are shown in Table 5.
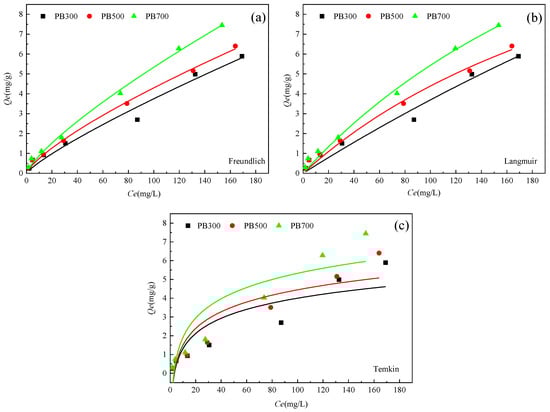
Figure 6.
Fitting curves of phosphorus adsorption isotherm models for three biochar types ((a) Freundlich, (b) Langmuir, (c) Temkin).
Table 5.
Fitting curve parameters of adsorption phosphorus isotherm models for three biochar types.
As shown in Figure 6, in the range of adsorption equilibrium mass concentration of 5~200 mg L−1, the adsorption capacity of the three kinds of biochar for phosphorus in solutions increases with the increase in concentration, showing the characteristics of chemisorption. In the initial stage, with the increase in phosphorus concentration, the amount of phosphorus in the solution per unit volume increases, which increases the interaction chance between phosphorus and the adsorption site on the surface of the biochar, resulting in a rapid increase in adsorption capacity. However, when the concentration of phosphorus continues to rise to a certain level, the available adsorption sites on the surface of the biochar are gradually saturated with phosphorus, resulting in a slowing down of the adsorption process. Finally, the system reaches a dynamic equilibrium state, in which the adsorption capacity of the biochar to phosphate reaches the maximum and does not change significantly with the change in external phosphate concentration.
The correlation coefficients (R2) of the Langmuir model and the Freundlich model were 0.96536, 0.98863, and 0.98996; and 0.9719, 0.99629, and 0.99526, respectively. However, the correlation coefficient R2 of the Langmuir model was smaller than that of the Freundlich model. The results of the two models diverged slightly for PB700, which could be attributed to the additional complexity in chemical interactions at high temperatures. The adsorption of phosphorus by pineapple leaf biochar is more suitably described by the Freundlich isothermal model, which indicates that the adsorption of phosphorus by pineapple leaf biochar is mainly multi-layer adsorption, and its uneven and developed pore structure contributes to the formation of multi-layer adsorption of phosphorus on its surface. In the Freundlich model, when 1/n is between 0 and 1, the adsorption reaction occurs easily. It can be seen from Table 5 that the 1/n of the three biochar types was 0.83298, 0.75967 and 0.78006, respectively, indicating that the adsorption process of phosphorus by the three biochar types occurred easily. KF was less than 1 (for PB300, PB500, and PB700, KF was 0.08, 0.13, and 0.15, respectively), indicating that the adsorption of phosphorus by the biochar at different temperatures mainly comprised multi-molecular layer chemisorption.
3.7. Principal Component Analysis and Correlation Analysis
Principal component analysis and the comprehensive evaluation of the biochar properties were carried out for each factor (Table 6 and Figure 7). The results indicate that the first principal component explained 74.5% of the total variability, and the second principal component explained 13.0% of the total variability. In the first principal component, PB700 was significantly different from PB300 and PB500, and the positive contribution factors of the first principal component were mainly pore structure characteristics (SBET, VTot, et al.), Ca2+, Mg2+, Fe3+, and Al3+ content, and C-H/-CHO and C-O functional groups. The comprehensive scores of various biochar properties were PB700 > PB500 > PB300 (Table 6).
Table 6.
Comprehensive evaluation of the biochar properties.
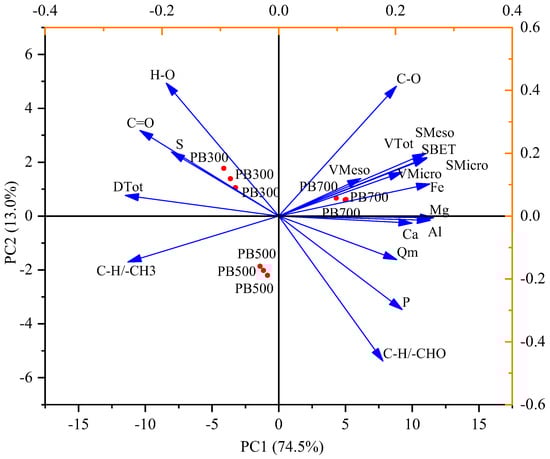
Figure 7.
Principal component analysis of the functional groups, elemental content, and surface pore structure.
According to the correlation heat map analysis shown in Figure 8, when the phosphorus content was 114 mg L−1 and 228 mg L−1, the adsorption of phosphate by the biochar was mainly positively correlated with the Ca2+, Mg2+, and Al3+ cation contents in the biochar, the specific surface area, and pore volume of the biochar material. There was a significant negative correlation with functional groups CH/-CH3, C=O, and H-O and pore diameter. It can be seen that the adsorption of phosphate by the pineapple leaf biochar prepared at 300 °C and 500 °C was mainly chemical adsorption and functional adsorption, respectivley, while the adsorption of phosphate by the pineapple leaf biochar prepared at 700 °C had not only pore structure contribution, but also cationic Ca2+, Mg2+, and Al3+.
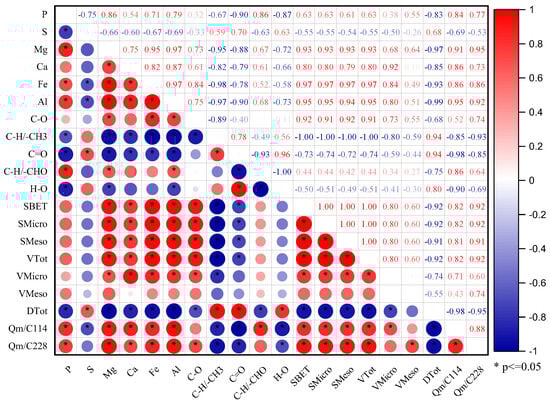
Figure 8.
Heat map analysis of the correlation between the factors.
4. Discussion
4.1. Effect of Preparation Temperature on Biochar Content in Pineapple Leaves
With the increase in biochar preparation temperature, the carbon (C) content gradually increased, mainly because the carbonization of organic matter was incomplete at low temperatures, and the carbonization of organic matter increased more thoroughly with the increase in temperature [5,44]. The content of hydrogen (H), oxygen (O), nitrogen (N), and sulfur (S) gradually decreased, mainly because more chemical bonds are broken at high temperatures, releasing more volatile substances. During the preparation of biochar, with the increase in reaction temperature, mineral elements, such as phosphorus (P), magnesium (Mg), calcium (Ca), iron (Fe), and aluminum (Al), originally present in the raw material, will gradually accumulate. This is because the high temperature promotes the decomposition of organic matter in the raw material, making it easier for these elements to be released from the complex organic structure and then be enriched in the remaining solid matter [45,46,47]. Compared with pineapple leaf, the magnesium in the pineapple leaf biochar was further enriched [48]. Calcium and magnesium were also employed to improve the phosphorus adsorption of the biochar [49]. For example, calcium-rich crab shell biochar increased phosphorus removal from 26% to over 90% [50].
However, although the content of a single element increased, because more elements were volatilized at high temperatures, the total content of these elements actually decreased with the increase in the preparation temperature. The N/C ratio of the biochar decreased with the increase in pyrolysis temperature, which is consistent with the research results of Claoston et al. (2014) [24] and Pariyar et al. (2020) [51]. In this experiment, when the pyrolysis temperature was 500 °C, the C content of the biochar from pineapple leaves was significantly higher than that observed at 300 °C; in addition, the C content was basically unchanged after the pyrolysis temperature exceeded 500 °C, mainly because the hemicellulose, cellulose, and lignin in the raw materials are mainly decomposed at 200~500 °C, and the pyrolysis temperature was higher than 500 °C. Hemicellulose, cellulose, and lignin decomposed, wherein cellulose and lignin degraded into difficult-to-degrade aromatic structures [52]. The pH of the biochar increased with increasing temperatures, because the acidic substances formed during pyrolysis gradually volatilized at high temperatures, resulting in reduced acidity and increased pH. Secondly, the pyrolysis temperature increased, and the precipitation of Ca2+, Mg2+, K+, and other base ions was also an important reason for the increase in pH [26].
4.2. Effect of Preparation Temperature on the Surface Structure of Biochar of Pineapple Leaves
The physical and chemical properties of biochar are affected by the pyrolysis temperature and raw materials [1]. The pore size structure of biochar prepared at different temperatures is significantly different. As the pyrolysis temperature increases, the specific surface area and pore volume of biochar increase significantly [52]. The structural characteristics of the raw materials of the biochar prepared at 300 °C were still maintained, and the pore size structure did not change significantly. The biochar prepared at 500 °C had more pore structures than the biochar prepared at 300 °C. As the pyrolysis temperature increases, more volatile components in the raw material are removed, creating more space, resulting in significant changes in the surface structure of the biochar; in addition, its specific surface area increases, the pore wall becomes thinner and looser, and the overall mass becomes lower. With the increase in preparation temperature, the specific surface area and porosity of the biochar increase with the increase in temperature [53]. As the temperature increases, the pore structure in the material becomes simpler, the porosity decreases, and, therefore, the surface area per unit volume increases. The isotherms of PB700 did not close, due to the capillary condensation phenomenon that occurs at low pressure, as some micropores and minor mesopores exit [1,54].
The number of functional groups in the biochar prepared at 700 °C decreased significantly. The absorption peak observed at 1301 cm−1 was the characteristic peak of C-H/-CH3, and the functional group also increased significantly as the preparation temperature increased from 300 °C to 500 °C, indicating that a high pyrolysis temperature was conducive to increased C-H/CHO functional groups. For PB700, C=O and H-O disappeared, which indicated that, at high temperatures, more functional groups decompose, and C-H/CHO was a relatively stable functional group. The organic structural components containing C-O-C and C-H/CHO functional groups were decomposed, and the functional group structure was fractured and destroyed [55].
4.3. Adsorption Mechanism of Phosphorus by Pineapple Leaf Biochar
The adsorption of phosphorus by biochar involves a variety of mechanisms. Biochar has various adsorption mechanisms for phosphorus, including ion exchange and ligand exchange [28,56]. The abundant functional groups on the surface of the biochar can produce hydrogen bonds, complexation, and other chemisorption effects on the phosphate radical group [57].
We classified the quantifiable indices in this paper into the following categories: element composition, pore structure, and functional group composition. Principal component analysis (PCA) and heat map analysis were used to cluster the various indicators and describe the correlations between them (Figure 7 and Figure 8). Positively correlated variables were grouped together, while negatively correlated variables were positioned on opposite sides of the plot origin. C-O, C-H/-CHO functional groups, Ca, Mg, Fe, Al, and SBET, and pore volume formed one cluster and played a major role in Qm. This indicated that the content of the mineral elements and the pore structure of the biochar determined the adsorption capacity of phosphorus by the biochar [16,41,50]. Shin et al. (2020) [16] prepared Mg-loaded biochar from ground coffee waste. After studying its adsorption properties for phosphorus, they found that its adsorption mechanism for phosphorus mainly included functional group action and complex precipitation. Xu et al. (2022) [43] used canna to prepare biochar at different temperatures, studied the phosphorus adsorption process of the canna biochar, and found that the phosphorus adsorption process of biochar at 700 °C included surface adsorption, intra-particle diffusion, and external liquid film diffusion. Calcium-rich crab shell biochar increased phosphorus removal from 26% to over 90% [50]. The results of phosphorus adsorption from different studies are listed in Table 6. Surface area, surface electrostatic attraction, and cation (the precipitation process) were the main factors controlling phosphorus adsorption. However, the relative content of C=O, H-O, and C-H/-CH3 functional groups decreased gradually with the decomposition of the substances. This phenomenon leads to the formation of new products or void structures [5], which indirectly affects the adsorption capacity of biochar for phosphorus. There was a significant positive correlation between Ca, Mg, Fe, Al, SBET, pore volume, and adsorption capacity (R2 > 0.71*). The results are similar to those outlined in other studies [15,58,59,60]. These results have indicated that pore structure and cation content of PB were the main factors impacting adsorption capacity.
The pineapple leaf biochar prepared at 700 °C had a large specific surface area, rich pore structure, and abundant surface functions, which provide the structural and functional basis for its adsorption of phosphate [18,61]. Visible peaks at 3400, 2856, 1613, 1301, and 1057 cm−1 indicated that a large number of original organic residues was present. The peak at 3400 cm−1 ascribed to -OH group and C=O group (1613 cm−1) decreased (or disappeared) at higher temperatures, which indicated that the functional groups did not play a key role in the phosphorus adsorption process. The change in adsorption capacity was mainly due to the change in cation and specific surface area (Table 7).
Table 7.
Adsorption performance of phosphorus by biochar-based adsorbents.
The C/H of the biochar prepared at the three temperatures was higher, which indicates that the degree of aromatization of the biochar was higher, more organic carbon was retained during the pyrolysis process of the biochar, and more adsorption sites were available, which is conducive to the adsorption of phosphate [43].
The process of the adsorption of phosphorus by PB was affected by both physical adsorption and chemisorption mechanisms (Figure 9). With the increase in temperature, the pore structure increases gradually, mineral elements accumulate, and the adsorption degree of phosphorus increases gradually [61]. This phenomenon shows that the adsorption mechanism of phosphorus by biochar prepared at high temperatures is mainly the contribution of pore size structure and the role of cation. The results of related studies also show that the adsorption capacity of Ca2+- and Mg2+ (MgO)-modified biochar of phosphate was greatly improved [15,64,65]. It can be seen that Ca2+ and Mg2+ (MgO) have a strong adsorption effect on phosphorus. The precipitation adsorption of such cations may hinder the internal diffusion of phosphate and affect the adsorption rate, resulting in the in-particle diffusion model not passing through the origin. According to the correlation coefficients (R2) of the pseudo-first-order kinetic model and the pseudo-second-order kinetic model, the different types of PB have different adsorption effects on phosphate. Specifically, the R2 values of the PB300 and PB500 biochar in the pseudo-second-order kinetic model were higher than those observed in the pseudo-first-order kinetic model, which indicates that they are more inclined to chemisorption [66]. In contrast, PB700 had a higher R2 value under the pseudo-first-order kinetic model, which means that it mainly relies on physical adsorption.
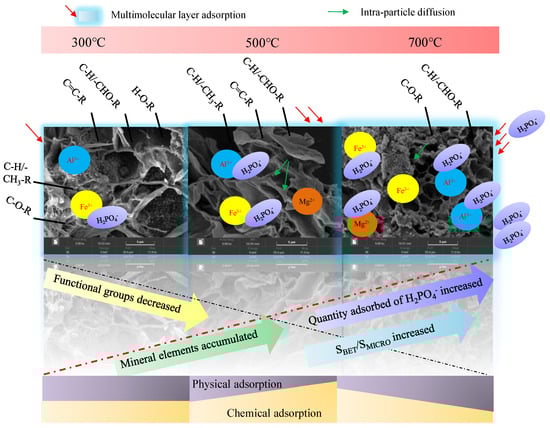
Figure 9.
Adsorption process and mechanism of phosphorus by PB prepared at different temperatures (Note: The main form of phosphorus in solution with pH = 3 is H2PO4− in this study).
The adsorption of phosphorus by biochar is more consistent with the Freundlich model, which can describe the adsorption process more accurately than the Langmuir model, indicating that the adsorption of phosphorus by PB is mainly multi-molecular layer, while the adsorption of a single molecular layer plays an auxiliary role [66,67]. The intramolecular diffusion model refers to the transfer process of an adsorbent from a liquid phase to a solid phase, and the adsorption rate is mainly controlled by the diffusion of molecules inside of the adsorbent, which helps to better reveal the diffusion mechanism of the adsorbent inside of the adsorbent [43]. In summary, the adsorption of phosphorus by PB prepared at different temperatures involves multiple layers and is affected by many factors. Multi-molecular-layer chemisorption is the main one, while the single-molecular-layer physical adsorption plays an auxiliary role, and, at the same time, it is accompanied by intra-granular diffusion.
5. Conclusions
With the increase in pyrolysis temperature, the carbon content of pineapple leaf biochar increased, while the nitrogen, hydrogen, and oxygen contents decreased correspondingly, and the mineral element content gradually increased. The aromatics of the biochar increased, while its hydrophilic and polar properties decreased. The pore structure of the biochar prepared at 300 °C and 500 °C was not developed, and the pore wall was thicker. When the pyrolysis temperature was increased to 700 °C, the pore structure of the biochar increased. Compared with the surface area of the biochar prepared at 300 °C and 500 °C, the specific surface area of the biochar prepared at 700 °C increased 65.05 and 119.26 times, respectively, and the increase was mainly due to the increase in micropore specific surface area. The preparation of the pineapple leaf biochar at 700 °C enhanced its ability to adsorb phosphorus, due to its large specific surface area and high cation (Ca2+, Mg2+, Fe3+, and Al3+) content, and the process of the adsorption of phosphorus by the biochar was mainly multi-molecular-layer chemisorption, supplemented by single-molecular-layer physical adsorption, and accompanied by intramolecular diffusion. In follow-up research, it is necessary to continue to study the adsorption of phosphorus by Mg-, Ca-, and Fe-modified biochar, which may have exciting results.
Supplementary Materials
The following supporting information can be downloaded at: https://www.mdpi.com/article/10.3390/agronomy14122923/s1, Figure S1: FTIR spectra of pineapple leaf biochars at at different pyrolysis temperatures.
Author Contributions
Conceptualization, S.S.; Data curation, S.L. and Y.L.; Funding acquisition, H.M.; Methodology, S.S., S.L. and Y.L.; Software, S.L. and Y.L.; Supervision, S.S.; Visualization, S.S.; Writing—original draft, S.S.; Writing—review and editing, S.S., W.S. and H.M. All authors have read and agreed to the published version of the manuscript.
Funding
This work was supported by Key R&D Program Projects in Guangdong Province (2023B0202010027) and the Central Public-Interest Scientific Institution Basal Research Fund (1630062022004, 1630062024013), the Chinese Academy of Tropical Agricultural Sciences for Science and Technology Innovation Team of the National Tropical Agricultural Science Center (CATASCXTD202303), and the Hainan Provincial Natural Science Foundation of China (322MS119).
Data Availability Statement
Data will be made available on request.
Conflicts of Interest
The authors declare that they have no known competing financial interests or personal relationships that could have appeared to influence the work reported in this paper.
References
- Cong, P.; Song, S.; Song, W.; Dong, J.; Zheng, X. Biochars prepared from biogas residues: Temperature is a crucial factor that determines their physicochemical properties. Biomass Convers. Biorefinery 2024, 14, 12843–12856. [Google Scholar] [CrossRef]
- Lu, L.; Yu, W.; Wang, Y.; Zhang, K.; Zhu, X.; Zhang, Y.; Wu, Y.; Ullah, H.; Xiao, X.; Chen, B. Application of biochar-based materials in environmental remediation: From multi-level structures to specific devices. Biochar 2020, 2, 1–31. [Google Scholar] [CrossRef]
- Zhang, Y.; Wang, J.; Feng, Y. The effects of biochar addition on soil physicochemical properties: A review. Catena 2021, 202, 105284. [Google Scholar] [CrossRef]
- Zheng, X.; Dong, J.; Zhang, W.; Xiang, J.; Yin, X.; Yin, X.; Han, L. Biogas residue biochar shifted bacterial community, mineralization, and molecular structure of organic carbon in a sandy loam Alfisol. GCB Bioenergy 2021, 13, 838–848. [Google Scholar] [CrossRef]
- Song, S.H.; Cong, P.; Wang, C.; Li, P.W.; Liu, S.R.; He, Z.Y.; Zhou, C.; Liu, Y.H.; Yang, Z.M. Properties of biochar obtained from tropical crop wastes under different pyrolysis temperatures and its application on acidic soil. Agronomy 2023, 13, 921. [Google Scholar] [CrossRef]
- Wang, S.; Ai, S.; Nzediegwu, C.; Kwak, J.H.; Islam, M.S.; Li, Y.; Chang, S.X. Carboxyl and hydroxyl groups enhance ammonium adsorption capacity of iron (III) chloride and hydrochloric acid modified biochars. Bioresour. Technol. 2020, 309, 123390. [Google Scholar] [CrossRef]
- Stefaniuk, M.; Oleszczuk, P. Characterization of biochars produced from residues from biogas production. J. Anal. Appl. Pyrolysis 2015, 115, 157–165. [Google Scholar] [CrossRef]
- Jung, K.W.; Hwang, M.J.; Ahn, K.H.; Ok, Y.S. Kinetic study on phosphate removal from aqueous solution by biochar derived from peanut shell as renewable adsorptive media. Int. J. Environ. Sci. Technol. 2015, 12, 3363–3372. [Google Scholar] [CrossRef]
- Cui, X.; Dai, X.; Khan, K.Y.; Li, T.; Yang, X.; He, Z. Removal of phosphate fromaqueous solution using magnesium-alginate/chitosan modified biochar microspheres derived from Thalia dealbata. Bioresour. Technol. 2016, 218, 1123–1132. [Google Scholar] [CrossRef]
- Takaya, C.A.; Fletcher, L.A.; Singh, S.; Anyikude, K.U.; Ross, A.B. Phosphate and ammonium sorption capacity of biochar and hydrochar from different wastes. Chemosphere 2016, 145, 518–527. [Google Scholar] [CrossRef]
- Scaria, J.; Nidheesh, P.V.; Kumar, M.S. Synthesis and applications of various bimetallic nanomaterials in water and wastewater treatment. J. Environ. Manag. 2020, 259, 110011. [Google Scholar] [CrossRef] [PubMed]
- Zhang, H.; Ji, Q.; Lai, L.; Yao, G.; Lai, B. Degradation of p-nitrophenol (PNP) in aqueous solution by mFe/Cu-air-PS system. Chin. Chem. Lett. 2019, 30, 1129–1132. [Google Scholar] [CrossRef]
- Sharma, G.; Gupta, V.K.; Agarwal, S.; Bhogal, S.; Naushad, M.; Kumar, A.; Stadler, F.J. Fabrication and characterization of trimetallic nano-photocatalyst for remediation of ampicillin antibiotic. J. Mol. Liq. 2018, 260, 342–350. [Google Scholar] [CrossRef]
- Hosny, M.; Fawzy, M.; Eltaweil, A.S. Phytofabrication of bimetallic silver-copper/biochar nanocomposite for environmental and medical applications. J. Environ. Manag. 2022, 316, 115238. [Google Scholar] [CrossRef] [PubMed]
- Novais, S.V.; Zenero, M.D.O.; Barreto, M.S.C.; Montes, C.R.; Cerri, C.E.P. Phosphorus removal from eutrophic water using modified biochar. Sci. Total Environ. 2018, 633, 825–835. [Google Scholar] [CrossRef]
- Shin, H.; Tiwari, D.; Kim, D.J. Phosphate adsorption/desorption kinetics and P bioavailability of Mg-biochar from ground coffee waste. J. Water Process Eng. 2020, 37, 101484. [Google Scholar] [CrossRef]
- Shamsudin, R.; Daud, W.R.W.; Takrif, M.S.; Hassan, O. Physico-mechanical properties of the Josapine pineapple fruits. Pertanika J. Sci. Technol. 2009, 17, 117–123. [Google Scholar]
- Gopomath, A.; Divyapriya, G.; Srivaatava, V.; Laiju, A.R.; Nidheesh, P.V.; Kumar, M.S. Conversion of sewage sludge into biochar: A potential resource in water and wastewater treatment. Environ. Res. 2021, 194, 110656. [Google Scholar] [CrossRef]
- Hemung, B.O.; Sompholkrang, M.; Wongchai, A.; Chanshotikul, N.; Ueasin, N. A study of the potential of by-products from pineapple processing in Thailand. Int. J. Health Sci. 2022, 6, 12605–12615. [Google Scholar] [CrossRef]
- Srikhaow, A.; Win, E.E.; Amornsakchai, T.; Kiatsiriroat, T.; Kajitvichyanukul, P.; Smith, S.M. Biochar derived from pineapple leaf non-fibrous materials and its adsorption capability for pesticides. ACS Omega 2023, 8, 26147–26157. [Google Scholar] [CrossRef]
- Iamsaard, K.; Weng, C.H.; Yen, L.T.; Tzeng, J.H.; Poonpakdee, C.; Lin, Y.T. Adsorption of metal on pineapple leaf biochar: Key affecting factors, mechanism identification, and regeneration evaluation. Bioresour. Technol. 2022, 344, 126131. [Google Scholar] [CrossRef] [PubMed]
- Huang, H.; Wang, Y.X.; Tang, J.C.; Zhu, W.Y. Properties of maize stalk biochar produced under different pyrolysis temperatures and its sorption capability to naphthalene. Environ. Sci. 2014, 35, 1884–1890. (In Chinese) [Google Scholar]
- Tan, H.D.; Zhang, X.Y.; Wu, C.Y.; Zhao, S.Q. Distribution and ecotoxicological risk of polycyclic aromatic hy-drocarbons in biochar prepared from tropical agricultural wastes. Chin. J. Trop. Crops 2022, 43, 1516–1526. (In Chinese) [Google Scholar]
- Claoston, N.; Samsuri, A.W.; Ahmad Husni, M.H.; Mohd Amran, M.S. Effects of pyrolysis temperature on the physicochemical properties of empty fruit bunch and rice husk biochars. Waste Manag. Res. 2014, 32, 331–339. [Google Scholar] [CrossRef]
- Biswas, B.; Pandey, N.; Bisht, Y.; Singh, R.; Kumar, J.; Bhaskar, T. Pyrolysis of agricultural biomass residues: Comparative study of corn cob, wheat straw, rice straw and rice husk. Bioresour. Technol. 2017, 237, 57–63. [Google Scholar] [CrossRef]
- Ma, Q.; Song, W.; Wang, R.; Zou, J.; Yang, R.; Zhang, S. Physicochemical properties of biochar derived from anaerobically digested dairy manure. Waste Manag. 2018, 79, 729–734. [Google Scholar] [CrossRef]
- Tomczyk, A.; Sokołowska, Z.; Boguta, P. Biochar physicochemical properties: Pyrolysis temperature and feedstock kind effects. Rev. Environ. Sci. Bio/Technol. 2020, 19, 191–215. [Google Scholar] [CrossRef]
- Yao, Y.; Gao, B.; Chen, J.; Yang, L. Engineered biochar reclaiming phosphate from aqueous solutions: Mechanisms and potential application as a slow-release fertilizer. Environ. Sci. Technol. 2013, 47, 8700–8708. [Google Scholar] [CrossRef]
- Penn, C.J.; Warren, J.G. Investigating phosphorus sorption onto kaolinite using isothermal titration calorimetry. Soil Sci. Soc. Am. J. 2009, 73, 560–568. [Google Scholar] [CrossRef]
- Liu, B.; Gai, S.; Lan, Y.; Cheng, K.; Yang, F. Metal-based adsorbents for water eutrophication remediation: A review of performances and mechanisms. Environ. Res. 2022, 212, 113353. [Google Scholar] [CrossRef]
- Sun, C.; Wang, S.; Wang, H.; Hu, X.; Yang, F.; Tang, M.; Zhang, M.; Zhong, J. Internal nitrogen and phosphorus loading in a seasonally stratified reservoir: Implications for eutrophication management of deep-water ecosystems. J. Environ. Manag. 2022, 319, 115681. [Google Scholar] [CrossRef] [PubMed]
- Vasseghian, Y.; Nadagouda, M.M.; Aminabhavi, T.M. Biochar-enhanced bioremediation of eutrophic waters impacted by algal blooms. J. Environ. Manag. 2024, 367, 122044. [Google Scholar] [CrossRef] [PubMed]
- Ren, Y.; Zheng, W.; Duan, X.; Goswami, N.; Liu, Y. Recent advances in electrochemical removal and recovery of phosphorus from water: A review. Environ. Funct. Mater. 2022, 1, 10–20. [Google Scholar] [CrossRef]
- Zhang, C.; Guisasola, A.; Baeza, J.A. A review on the integration of mainstream P-recovery strategies with enhanced biological phosphorus removal. Water Res. 2022, 212, 118102. [Google Scholar] [CrossRef] [PubMed]
- Liu, X.; Shen, F.; Qi, X. Adsorption recovery of phosphate from aqueous solution by CaO-biochar composites prepared from eggshell and rice straw. Sci. Total Environ. 2019, 666, 694–702. [Google Scholar] [CrossRef]
- Che, N.; Qu, J.; Wang, J.; Liu, N.; Li, C.; Liu, Y. Adsorption of phosphate onto agricultural waste biochars with ferrite/manganese modified-ball-milled treatment and its reuse in saline soil. Sci. Total Environ. 2024, 915, 169841. [Google Scholar] [CrossRef]
- Wang, J.; Wang, S. Preparation, modification and environmental application of biochar: A review. J. Clean. Prod. 2019, 227, 1002–1022. [Google Scholar] [CrossRef]
- Mohan, D.; Sarswat, A.; Ok, Y.S.; Pittman, C.U., Jr. Organic and inorganic contaminants removal from water with biochar, a renewable, low cost and sustainable adsorbent—A critical review. Bioresour. Technol. 2014, 160, 191–202. [Google Scholar] [CrossRef]
- Wang, H.; Xu, J.; Sheng, L. Preparation of straw biochar and application of constructed wetland in China: A review. J. Clean. Prod. 2020, 273, 123131. [Google Scholar] [CrossRef]
- Jiao, Y.; Li, D.; Wang, M.; Gong, T.; Sun, M.; Yang, T. A scientometric review of biochar preparation research from 2006 to 2019. Biochar 2021, 3, 283–298. [Google Scholar] [CrossRef]
- Yao, Y.; Gao, B.; Inyang, M.; Zimmerman, A.R.; Cao, X.; Pullammanappallil, P.; Yang, L. Removal of phosphate from aqueous solution by biochar derived from anaerobically digested sugar beet tailings. J. Hazard. Mater. 2011, 190, 501–507. [Google Scholar] [CrossRef] [PubMed]
- Li, J.; Li, B.; Huang, H.; Zhao, N.; Zhang, M.; Cao, L. Investigation into lanthanum-coated biochar obtained from urban dewatered sewage sludge for enhanced phosphate adsorption. Sci. Total Environ. 2020, 714, 136839. [Google Scholar] [CrossRef] [PubMed]
- Xu, Q.; Chen, Z.; Wu, Z.; Xu, F.; Yang, D.; He, Q.; Li, G.; Chen, Y. Novel lanthanum doped biochars derived from lignocellulosic wastes for efficient phosphate removal and regeneration. Bioresour. Technol. 2019, 289, 121600. [Google Scholar] [CrossRef] [PubMed]
- Tripathi, M.; Sahu, J.N.; Ganesan, P. Effect of process parameters on production of biochar from biomass waste through pyrolysis: A review. Renew. Sustain. Energy Rev. 2016, 55, 467–481. [Google Scholar] [CrossRef]
- Saletnik, B.; Bajcar, M.; Zaguła, G.; Czernicka, M.; Puchalski, C. Impact of the biomass pyrolysis parameters on the quality of biocarbon obtained from rape straw, rye straw and willow chips. Econtechmod Int. Q. J. Econ. Technol. Model. Process. 2016, 5, 129–134. [Google Scholar]
- Domingues, R.R.; Trugilho, P.F.; Silva, C.A.; de Melo, I.C.N.A.; Melo, L.C.A.; Magriotis, Z.M.; Sa’nchez-Monedero, M.A. Properties of biochar derived from wood and high-nutrient biomasses with the aim of agronomic and environmental benefits. PLoS ONE 2017, 12, 0176884. [Google Scholar] [CrossRef]
- Zama, E.F.; Zhu, Y.G.; Reid, B.J.; Sun, G.X. The role of biochar properties in i-nfluencing the sorption and desorption of Pb(II), Cd(II), and As(III) in aqueous solution. J. Clean. Prod. 2017, 148, 127–136. [Google Scholar] [CrossRef]
- Bohari, N.; Mohidin, H.; Idris, J.; Andou, Y.; Man, S.; Saidan, H.; Mahdian, S. Nutritional characteristics of biochar from pineapple leaf residue and sago waste. Pertanika J. Soc. Sci. Humanit. 2020, 28, 273–286. [Google Scholar]
- Luo, D.; Wang, L.; Nan, H.; Cao, Y.; Wang, H.; Kumar, T.V.; Wang, C. Phosphorus adsorption by functionalized biochar: A review. Environ. Chem. Lett. 2023, 21, 497–524. [Google Scholar] [CrossRef]
- Dai, L.; Tan, F.; Li, H.; Zhu, N.; He, M.; Zhu, Q.; Hu, G.; Wang, L.; Zhao, J. Calcium-rich biochar from the pyrolysis of crab shell for phosphorus removal. J. Environ. Manag. 2017, 198, 70–74. [Google Scholar] [CrossRef]
- Pariyar, P.; Kumari, K.; Jain, M.K.; Jadhao, P.S. Evaluation of change in biochar properties derived from different feedstock and pyrolysis temperature for environmental and agricultural application. Sci. Total Environ. 2020, 713, 136433. [Google Scholar] [CrossRef]
- Li, J.; Li, Y.; Wu, Y.; Zheng, M. A comparison of biochars from lignin, cellulose and wood as the sorbent to an aromatic pollutant. J. Hazard. Mater. 2014, 280, 450–457. [Google Scholar] [CrossRef]
- Ghodszad, L.; Reyhanitabar, A.; Maghsoodi, M.R.; Lajayer, B.A.; Chang, S.X. Biochar affects the fate of phosphorus in soil and water: A critical review. Chemosphere 2021, 283, 131176. [Google Scholar] [CrossRef]
- Xia, D.; Tan, F.; Zhang, C.; Jiang, X.; Chen, Z.; Li, H.; Zheng, Y.; Li, Q.; Wang, Y. ZnCl2 -activated biochar from biogas residue facilitates aqueous As (III) removal. Appl. Surf. Sci. 2016, 377, 361–369. [Google Scholar] [CrossRef]
- Ilango, A.; Lefebvre, O. Characterizing properties of biochar produced from simulated human feces and its potential applications. J. Environ. Qual. 2016, 45, 734–742. [Google Scholar] [CrossRef]
- Padilla, J.T.; Watts, D.W.; Novak, J.M.; Cerven, V.; Ippolito, J.A.; Szogi, A.A.; Johnson, M.G. Magnesium activation affects the properties and phosphate sorption capacity of poultry litter biochar. Biochar 2023, 5, 64. [Google Scholar] [CrossRef]
- Hu, R.; Xiao, J.; Wang, T.; Chen, G.; Chen, L.; Tian, X. Engineering of phosphate-functionalized biochars with highly developed surface area and porosity for efficient and selective extraction of uranium. Chem. Eng. J. 2020, 379, 122388. [Google Scholar] [CrossRef]
- Chen, B.; Chen, Z.; Lv, S. A novel magnetic biochar efficiently sorbs organic pollutants and phosphate. Bioresour. Technol. 2011, 102, 716–723. [Google Scholar] [CrossRef]
- Fang, L.; Li, J.S.; Donatello, S.; Cheeseman, C.R.; Poon, C.S.; Tsang, D.C. Use of Mg/Ca modified biochars to take up phosphorus from acid-extract of incinerated sewage sludge ash (ISSA) for fertilizer application. J. Clean. Prod. 2020, 244, 118853. [Google Scholar] [CrossRef]
- Antunes, E.; Jacob, M.V.; Brodie, G.; Schneider, P.A. Isotherms, kinetics and mechanism analysis of phosphorus recovery from aqueous solution by calcium-rich biochar produced from biosolids via microwave pyrolysis. J. Environ. Chem. Eng. 2018, 6, 395–403. [Google Scholar] [CrossRef]
- Ahmad, M.; Lee, S.S.; Dou, X.; Mohan, D.; Sung, J.K.; Yang, J.E.; Ok, Y.S. Effects of pyrolysis temperature on soybean stover-and peanut shell-derived biochar properties and TCE adsorption in water. Bioresour. Technol. 2012, 118, 536–544. [Google Scholar] [CrossRef] [PubMed]
- Dai, L.; Wu, B.; Tan, F.; He, M.; Wang, W.; Qin, H.; Tang, X.; Zhu, Q.; Pan, K.; Hu, Q. Engineered hydrochar composites for phosphorus removal/recovery: Lanthanum doped hydrochar prepared by hydrothermal carbonization of lanthanum pretreated rice straw. Bioresour. Technol. 2014, 161, 327–332. [Google Scholar] [CrossRef] [PubMed]
- Li, R.; Wang, J.J.; Zhou, B.; Awasthi, M.K.; Ali, A.; Zhang, Z.; Lahori, A.H.; Mahar, A. Recovery of phosphate from aqueous solution by magnesium oxide decorated magnetic biochar and its potential as phosphate-based fertilizer substitute. Bioresour. Technol. 2016, 215, 209–214. [Google Scholar] [CrossRef] [PubMed]
- Oginni, O.; Yakaboylu, G.A.; Singh, K.; Sabolsky, E.M.; Unal-Tosun, G.; Jaisi, D.; Khanal, S.; Shah, A. Phosphorus adsorption behaviors of MgO modified biochars derived from waste woody biomass resources. J. Environ. Chem. Eng. 2020, 8, 103723. [Google Scholar] [CrossRef]
- Liu, Y.; Wang, S.; Huo, J.; Zhang, X.; Wen, H.; Zhang, D.; Zhao, Y.; Kang, D.; Guo, W.; Ngo, H.H. Adsorption recovery of phosphorus in contaminated water by calcium modified biochar derived from spent coffee grounds. Sci. Total Environ. 2024, 909, 168426. [Google Scholar] [CrossRef]
- Lalley, J.; Han, C.; Li, X.; Dionysiou, D.D.; Nadagouda, M.N. Phosphate adsorption using modified iron oxide-based sorbents in lake water: Kinetics, equilibrium, and column tests. Chem. Eng. J. 2016, 284, 1386–1396. [Google Scholar] [CrossRef]
- Karunanithi, R.; Ok, Y.S.; Dharmarajan, R.; Ahmad, M.; Seshadri, B.; Bolan, N.; Naidu, R. Sorption, kinetics and thermodynamics of phosphate sorption onto soybean stover derived biochar. Environ. Technol. Innov. 2017, 8, 113–125. [Google Scholar] [CrossRef]
Disclaimer/Publisher’s Note: The statements, opinions and data contained in all publications are solely those of the individual author(s) and contributor(s) and not of MDPI and/or the editor(s). MDPI and/or the editor(s) disclaim responsibility for any injury to people or property resulting from any ideas, methods, instructions or products referred to in the content. |
© 2024 by the authors. Licensee MDPI, Basel, Switzerland. This article is an open access article distributed under the terms and conditions of the Creative Commons Attribution (CC BY) license (https://creativecommons.org/licenses/by/4.0/).