Article

HHS-RT-DETR: A Method for the Detection of Citrus Greening Disease

1
Mechanical and Electrical Engineering College, Yunnan Agricultural University , Kunming 650201, China
2
International Joint Laboratory of Intelligent Crop Production in Yunnan Province, Kunming 650201, China
*
Author to whom correspondence should be addressed.
Agronomy 2024, 14(12), 2900; https://doi.org/10.3390/agronomy14122900
Submission received: 25 October 2024 / Revised: 27 November 2024 / Accepted: 2 December 2024 / Published: 4 December 2024
(This article belongs to the Section Precision and Digital Agriculture)

Abstract

:
Background: Given the severe economic burden that citrus greening disease imposes on fruit farmers and related industries, rapid and accurate disease detection is particularly crucial. This not only effectively curbs the spread of the disease, but also significantly reduces reliance on manual detection within extensive citrus planting areas. Objective: In response to this challenge, and to address the issues posed by resource-constrained platforms and complex backgrounds, this paper designs and proposes a novel method for the recognition and localization of citrus greening disease, named the HHS-RT-DETR model. The goal of this model is to achieve precise detection and localization of the disease while maintaining efficiency. Methods: Based on the RT-DETR-r18 model, the following improvements are made: the HS-FPN (high-level screening-feature pyramid network) is used to improve the feature fusion and feature selection part of the RT-DETR model, and the filtered feature information is merged with the high-level features by filtering out the low-level features, so as to enhance the feature selection ability and multi-level feature fusion ability of the model. In the feature fusion and feature selection sections, the HWD (hybrid wavelet-directional filter banks) downsampling operator is introduced to prevent the loss of effective information in the channel and reduce the computational complexity of the model. Through using the ShapeIoU loss function to enable the model to focus on the shape and scale of the bounding box itself, the prediction of the bounding box of the model will be more accurate. Conclusions and Results: This study has successfully developed an improved HHS-RT-DETR model which exhibits efficiency and accuracy on resource-constrained platforms and offers significant advantages for the automatic detection of citrus greening disease. Experimental results show that the improved model, when compared to the RT-DETR-r18 baseline model, has achieved significant improvements in several key performance metrics: the precision increased by 7.9%, the frame rate increased by 4 frames per second (f/s), the recall rose by 9.9%, and the average accuracy also increased by 7.5%, while the number of model parameters reduced by 0.137 × 10 7 . Moreover, the improved model has demonstrated outstanding robustness in detecting occluded leaves within complex backgrounds. This provides strong technical support for the early detection and timely control of citrus greening disease. Additionally, the improved model has showcased advanced detection capabilities on the PASCAL VOC dataset. Discussions: Future research plans include expanding the dataset to encompass a broader range of citrus species and different stages of citrus greening disease. In addition, the plans involve incorporating leaf images under various lighting conditions and different weather scenarios to enhance the model’s generalization capabilities, ensuring the accurate localization and identification of citrus greening disease in diverse complex environments. Lastly, the integration of the improved model into an unmanned aerial vehicle (UAV) system is envisioned to enable the real-time, regional-level precise localization of citrus greening disease.

1. Introduction

Greening (huanglongbing) is the most serious disease of citrus that limits production in the subtropical and tropical citrus-producing areas of the world [1]. Before its identification, the disease was known by a variety of names: yellow shoot (huanglongbing) in China; likubin (decline) in Taiwan; dieback in India; leaf mottle in the Philippines; vein phloem degeneration in Indonesia; and yellow branch, blotchy mottle, or greening in South Africa. As it became clear that all these diseases were similar, the term “greening” was widely adopted [2]. The disease is caused by three phloem-limited bacteria: “Candidatus Liberibacter asiaticus” (CLas), “C. Liberibacter africanus” (CLaf), and “C. Liberibacter americanus” (CLam) [1,3]. CLas and CLam are predominantly transmitted by the Asian citrus psyllid (ACP; Diaphorina citri Kuwayama), whereas CLaf is transmitted by the African citrus psyllid Trioza erytreae Del Guercio [4]. Agricultural scientists have been working hard to develop a cure for the disease and create a strong resistant citrus germplasm, but so far, no significant results have been achieved [5]. Because the initial symptoms of citrus greening disease are not obvious, on-site diagnosis is difficult. Therefore, the automatic identification of citrus huanglongbing is of great significance for the prevention and control of citrus greening disease [6].
With the rapid development of science and technology, using new information technology with citrus informatization and scientific planting to detect citrus greening disease is an inevitable trend, aiming to make corresponding judgments and prevent citrus diseases in time, and improve citrus yield [7].
At present, popular convolutional neural networks include Fast RCNN, YOLOseries, SSD, EfficientDet, Faster RCNN, RCNN, and Cascade RCNN, which have been widely used in crop disease identification, pest and disease identification, and fruit identification in smart agriculture [8,9,10,11,12,13,14,15,16,17,18,19,20,21].
In recent years, many researchers have achieved certain research results in the field of citrus greening disease identification [22,23,24,25,26,27,28,29]. However, these studies still have not yet gone beyond the theoretical scope and cannot be directly applied to practical scenarios in complex contexts. The main challenges include the presence of multiple interfering factors, such as weeds, healthy leaves, overlapping leaves, and other diseased leaves in a complex background, which makes it difficult for existing models to detect leaves and areas of citrus greening disease accurately and efficiently. In addition, the shape and scale of citrus greening disease leaves are different, and some citrus greening disease leaves are easy to be occluded, so it is easy to miss detection during the detection process. These challenges pose great difficulties in the detection of citrus greening disease.
In 2023, the RT-DETR model introduced by Baidu’s PaddlePaddle team demonstrated exceptional performance after undergoing 100 rounds of meticulous training, surpassing the YOLO series models [30]. Particularly in dealing with complex background scenes, the RT-DETR model showed a significant advantage in the precision of small object detection over the YOLO series, reflecting its leading position and technical superiority in the field of object detection. In order to achieve efficient and accurate detection of citrus greening disease in complex backgrounds, this paper uses the lightweight RT-DETR-r18 model proposed by the Baidu’s PaddlePaddle team in 2023 as the benchmark model, and carries out in-depth optimization and improvement. In the improved HHS-RT-DETR model, using HS-FPN to improve the Neck network part of the RT-DETR model, the feature selection ability and multi-level feature fusion ability of the model are improved by screening low-level features and fusing them with high-level features [31]. At the same time, due to the introduction of HS-FPN, the improved model shows strong adaptability, which can adapt to the feature maps of different scales, so as to realize the detection of targets at different scales. Secondly, in order to prevent the loss of effective information in channel propagation and reduce the computational complexity of the model, the HWD downsampling operator is introduced into the RT-DETR model [32]. Finally, the ShapeIoU loss function was used to make the model pay more attention to the shape and scale of the bounding box, which further improved the accuracy of the model’s prediction in the bounding box and provided technical support for the detection of citrus greening disease [33].
The main contributions of this paper are as follows:
  • Model innovation: This paper proposes an improved HHS-RT-DETR model. The model incorporates an adaptive mechanism that effectively handles feature maps of varying sizes, achieving more precise and efficient object detection, particularly for objects of different scales. This enhancement grants the model greater robustness and accuracy when dealing with complex scenes.
  • Resource optimization: The HHS-RT-DETR model presented in this paper maintains high detection performance while significantly reducing the number of parameters and increasing detection speed. These optimizations make the model particularly suitable for deployment on resource-constrained platforms, such as mobile devices and embedded systems. The research findings of this paper provide important technical support and references for these platforms, contributing to the advancement of real-time object detection technology in edge computing environments.

2. Experimental Materials

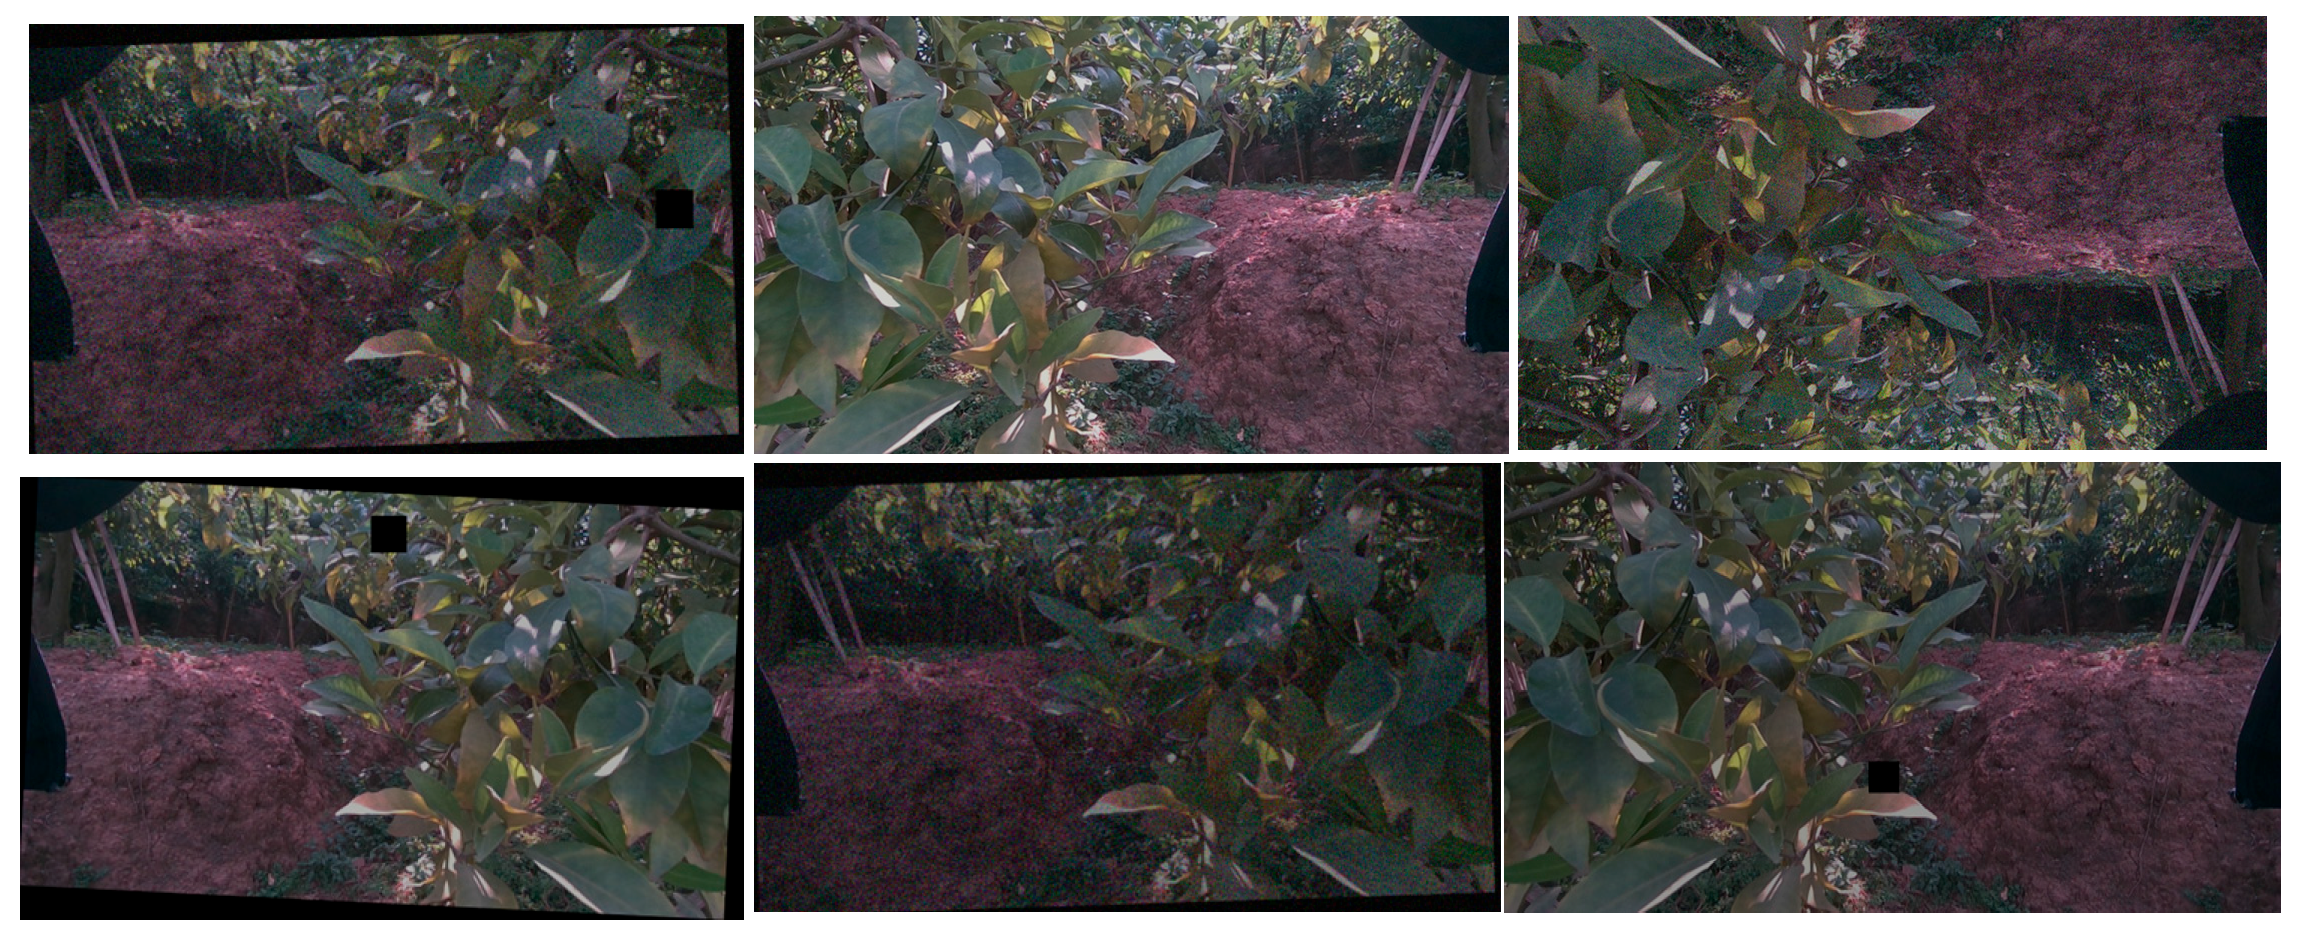
2.1. Data Collection

The main data collection locations were the Balang Mountain (Golden Land), the Xiabalang Group, Man Village, Mosha Town, Xinping Yi Dai Autonomous County, the Dang Independent Group, Rode Village, Mosha Town, Xinping Yi Dai Autonomous County, the Xiadug Desert, the Nanbang Community, Gasa Town, and Xinping Yi Dai Autonomous County. The data collection period was the fruit setting period of citrus fruit trees. Intel D455 cameras(produced by Intel Corporation, Santa Clara, CA, USA) were selected for manual acquisition and collected three types of images with citrus greening disease, including rock sugar orange greening, wokan orange greening, and grapefruit greening. A total of 1200 complex background and simple background images were collected, and some of the collected images are shown in Figure 1. The structure of the greening dataset used is shown in Table 1.

2.2. Dataset Production and Operation Environment

Firstly, the dataset was rigorously cleaned, and all unclear images were removed. Secondly, in order to further improve the generalization ability and data diversity of the model, the dataset was rotated, flipped, adjusted and cropped, and finally expanded to 5000 images. Finally, this study’s dataset annotation strategy combines leaf-level and regional-level annotation methods, aiming to enable drones to accurately identify and locate the distribution of citrus Huanglongbing over extensive areas. This approach effectively reduces the labor burden on fruit farmers when searching for diseased regions, while also enhancing detection efficiency and accuracy. The dataset used in this paper is divided into a training set, a validation set, and a test set according to the ratio of 7:2:1. The annotation work is done using the labelimg (1.8.6). By selecting an image, the data augmentation effect can be illustrated, as shown in Figure 2. The operating environment used is shown in Table 2.

3. Research Methodology

Due to its low parameter quantity and lighter weight compared to other RT-DETR versions, the RT-DETR-r18 model was chosen as the benchmark model. At the same time, because the RT-DETR model is a new type of real-time end-to-end object detector, and due to its characteristics of not relying on post-processing, it fully meets the needs of practical applications. The RT-DETR model is mainly composed of three parts: Backbone, Neck and Head, in which Backbone is responsible for feature extraction of input images, Neck is responsible for the selection and fusion of feature information, and Head is mainly responsible for predicting results.

3.1. HHS-RT-DETR Model Design
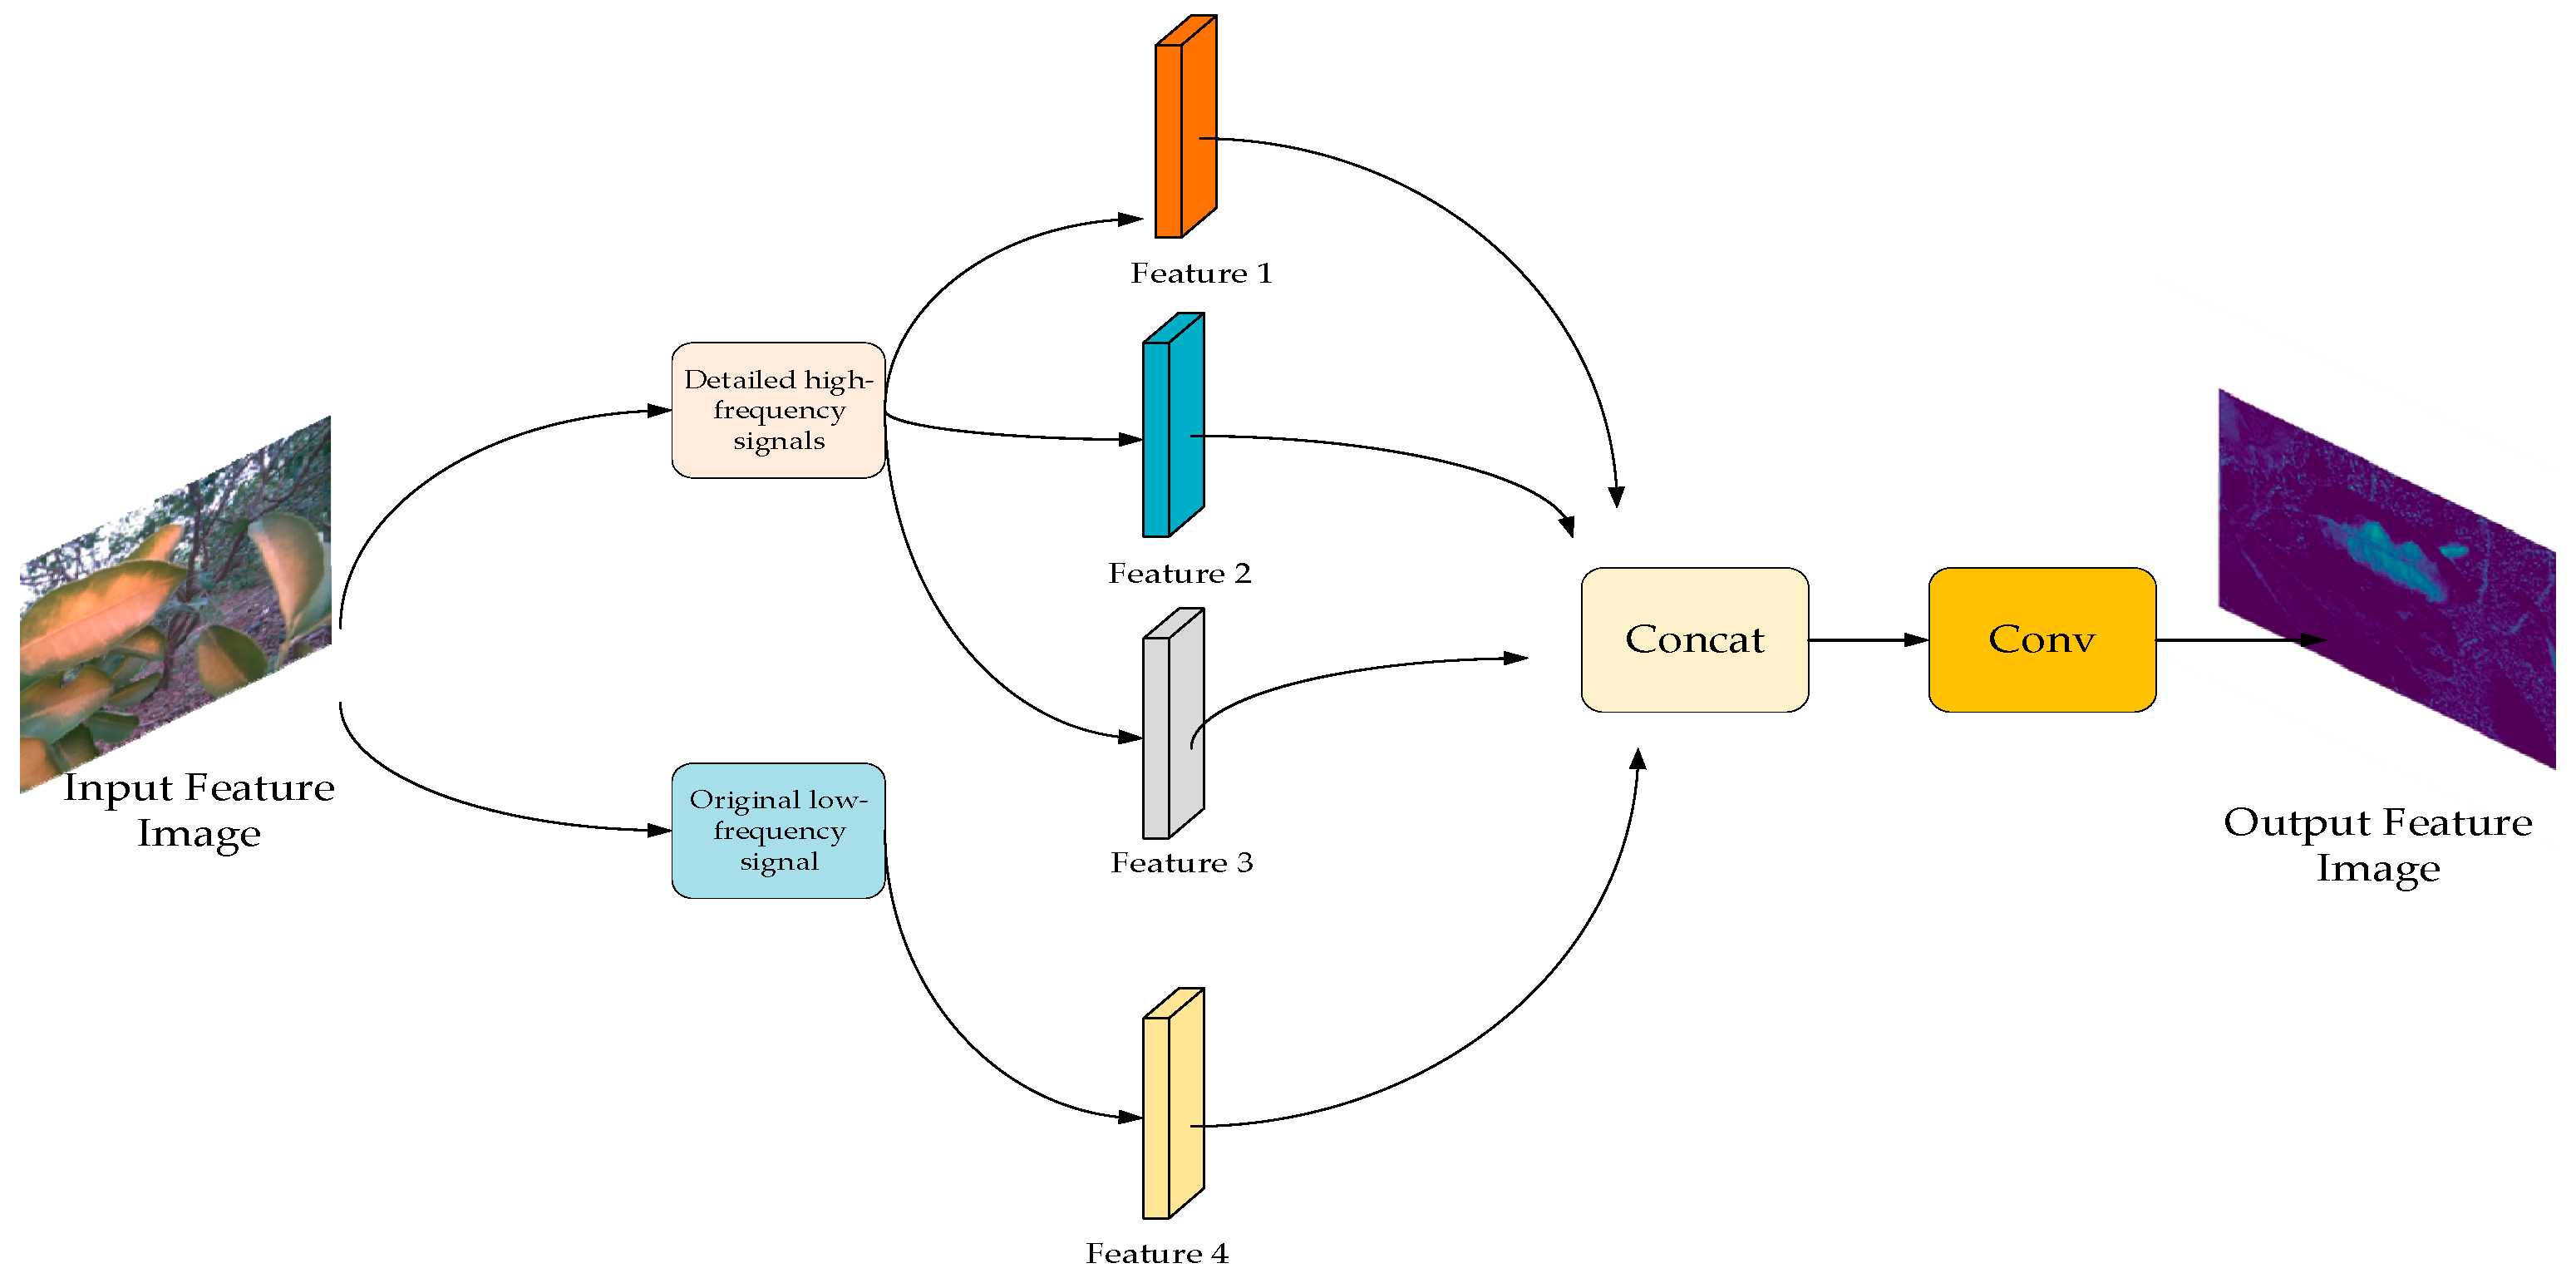
As illustrated in Figure 3, the HHS-RT-DETR model incorporates the feature selection and feature fusion strategies of the HS-FPN network model into its Neck section. In this paper, the feature extraction and feature fusion strategies of the HS-FPN network are introduced into the Neck part of the RT-DETR model, which improves the detection ability of the RT-DETR model for targets at different scales. In addition, the HWD downsampling operator is introduced into the model, which further enhances the detection performance of the model for targets of different scales and occluding blades. A detailed model architecture can be found in Appendix A.

3.2. HS-FPN Network

HS-FPN is a network model structure designed to solve the inherent multi-scale challenges covering dense and small target datasets [31]. The basic principle of the HS-FPN network model is mainly divided into two components: feature extraction and feature fusion.
Firstly, the feature selection module filters the feature maps which have different scales, then enters f i n R C × H × W for the feature size maps, where C represents the number of channels, H represents the height of the feature map, and W represents the width of the feature map. This feature map is combined after maximum and average pooling, respectively. Lastly, the weight value of each channel was determined by the Sigmoid activation function, and finally, the channel weight was obtained, with an output size of f o u t R C × 1 × 1 . The feature selection module is shown in Figure 4.
Through the selective feature fusion mechanism, the high-level feature information and low-level feature information in the feature map are fused together. This fusion generates a wealth of semantic information, which enhances the detection ability of the model. As shown in Figure 5, there is an input high-level feature f h i g h R C × H × W and an input low-scale feature f l o w R C × H × W 1 . Firstly, the high-level features are extended by a transpose matrix with size of 2 and kernel size of 3 × 3, and the extended size is f h i g h ^ R C × 2 H × 2 W , and then the f a t t R C × 2 H 1 × 2 W 1 is obtained by sampling from bilinear interpolation. The high-level features are converted into attention weights through the channel attention (CA) feature selection module to filter out the low-scale features. Finally, the low-scale features are fused with the high-level features, and the output size is f o u t R C × H 1 × W 1 .
The process of feature fusion and feature selection can be illustrated by the following formula:
f a t t = B L ( T r a n s p o s e C o n v ( f h i g h ) )
f o u t = f l o w × C A ( f a t t ) + f a t t

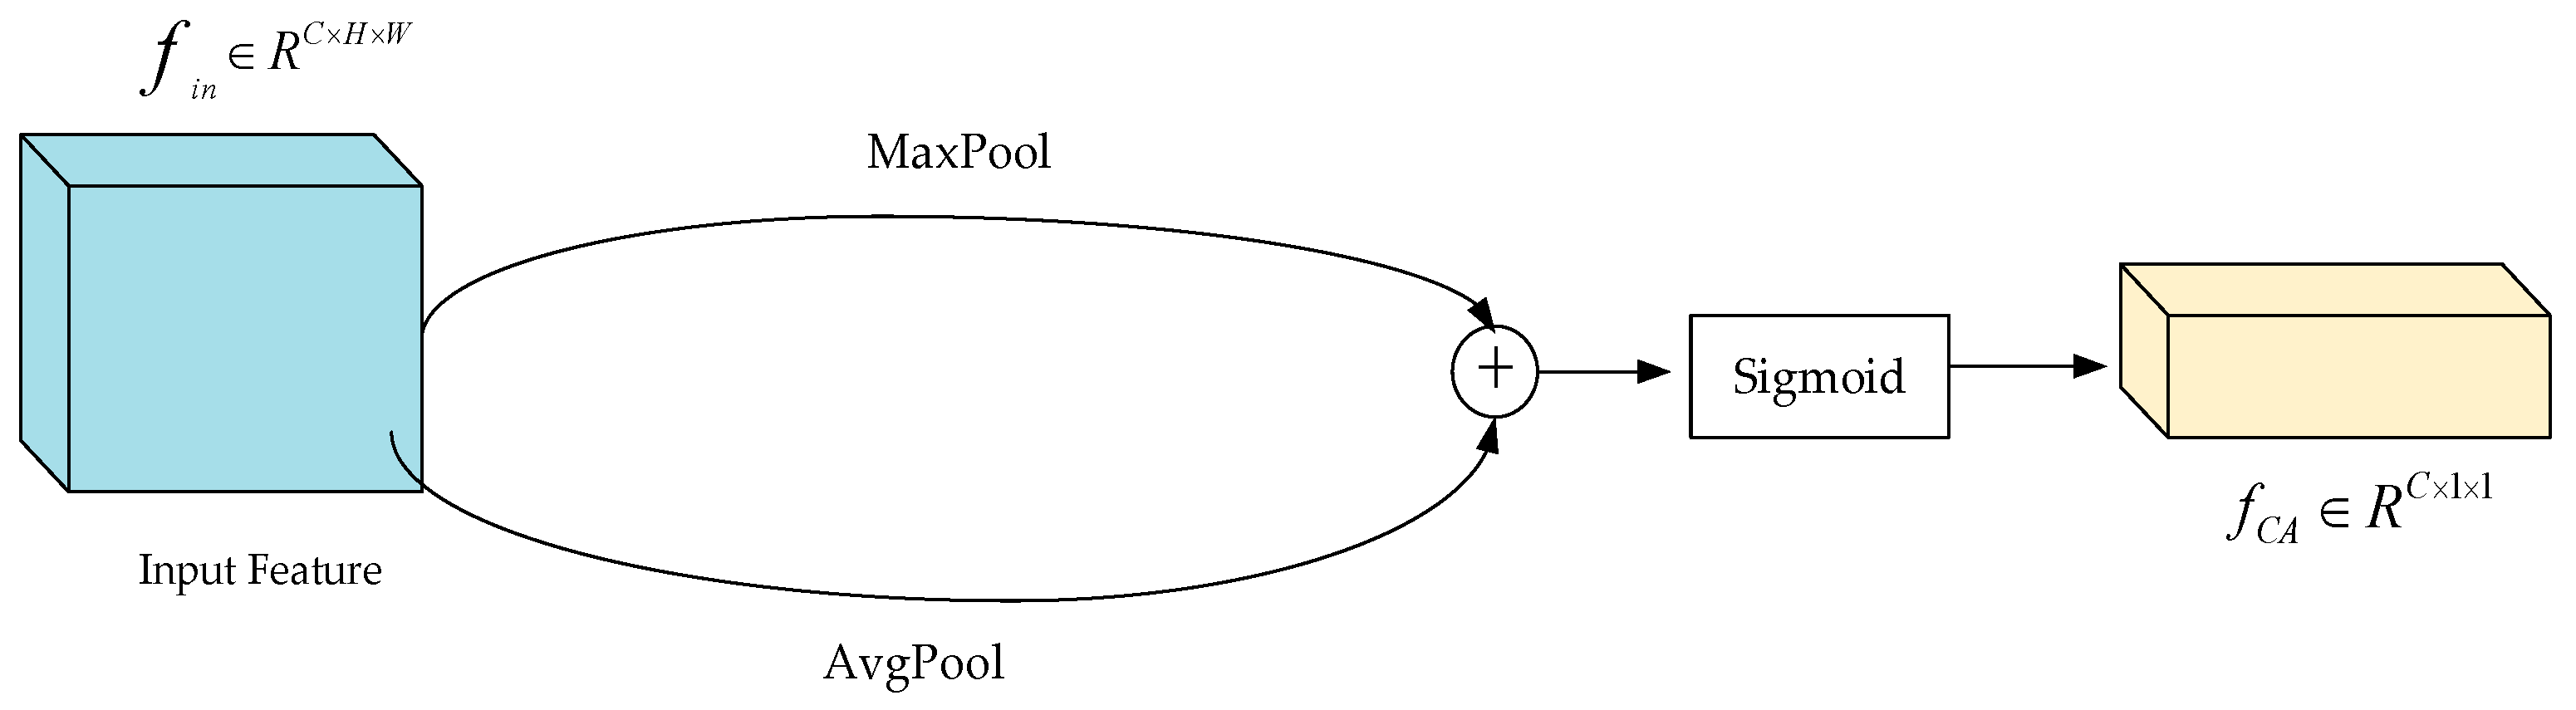
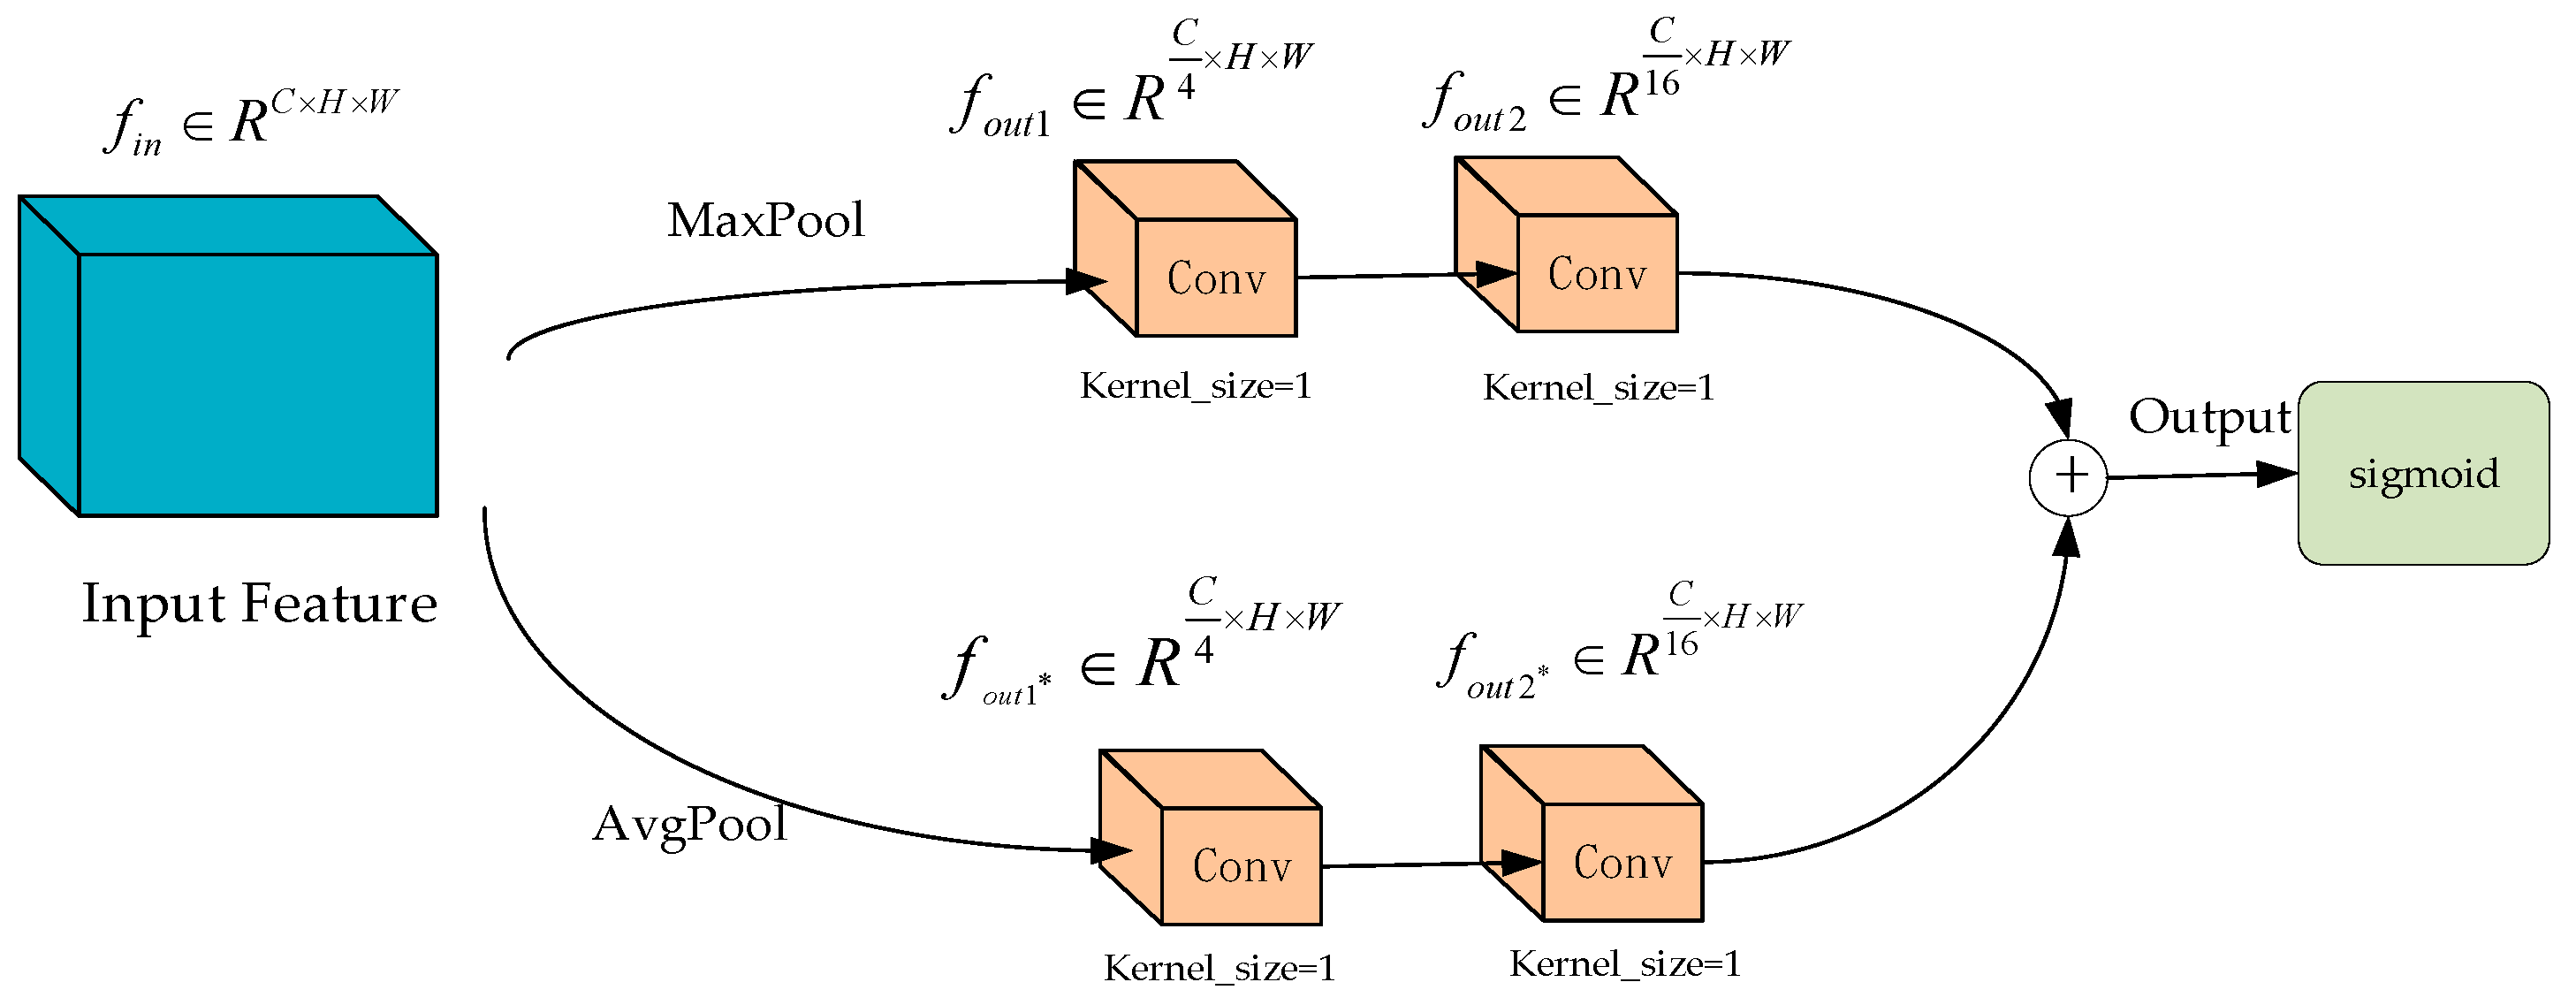
3.3. ChannelAttention_SFPN Network Module

In addition to the modifications made to the Neck network structure of the HHS-RT-DETR model, the ChannelAttention_HSFPN module plays a crucial role. As illustrated in Figure 6, this module integrates the feature fusion and selection advantages of the HSFPN architecture, enhancing the RT-DETR model’s adaptive capability to different scale features. This integration significantly improves the model’s performance in detecting small objects, thereby enhancing the overall detection accuracy across various object sizes.
As shown in Figure 7, within the feature selection module of the ChannelAttention_HSFPN network, the input feature maps are first passed through two channels: one for max pooling and another for average pooling. Each of these channels contains two convolutional layers with 1 × 1 kernels for processing the feature maps. The processed outputs from these feature maps are then combined, followed by the application of a Sigmoid activation function to determine the weight values for each channel.
By comparing Figure 7 with Figure 4, it can be observed that the feature selection mechanism of the HS-FPN network and the feature selection module of the ChannelAttention_HSFPN network maintain a high degree of structural consistency. Both employ sophisticated feature weighting strategies to enhance the effectiveness of feature fusion.
In the feature fusion module of the ChannelAttention_HSFPN network, as illustrated in Figure 8, the network utilizes feature maps at two different scales: the low-level feature map (rich in details) and the high-level feature map (abstract in semantics). Initially, the high-level feature map is filtered through the feature selection module to generate a set of weights. Subsequently, these weights are multiplied with the low-level feature map, achieving a profound fusion of the two. The resulting feature matrix maintains the same dimensions as the low-level feature map.
By comparing Figure 8 with Figure 5, it can be observed that the feature fusion mechanism of the HS-FPN network and the feature fusion module of the ChannelAttention_HSFPN network share similar structures and fusion strategies, both enhancing the representational power of the feature maps through dynamic weight adjustment.
The ChannelAttention_HSFPN network module combines the feature selection and feature fusion characteristics of the HS-FPN model to further improve detection accuracy and efficiency. The Neck network is typically used for information transmission and fusion between feature maps at different scales, enabling the network to better handle objects of various sizes and to enhance the accuracy of object localization and classification. By integrating the features of HS-FPN, RT-DETR can maintain real-time performance while improving the model’s ability to detect objects in complex scenes and small-scale objects.

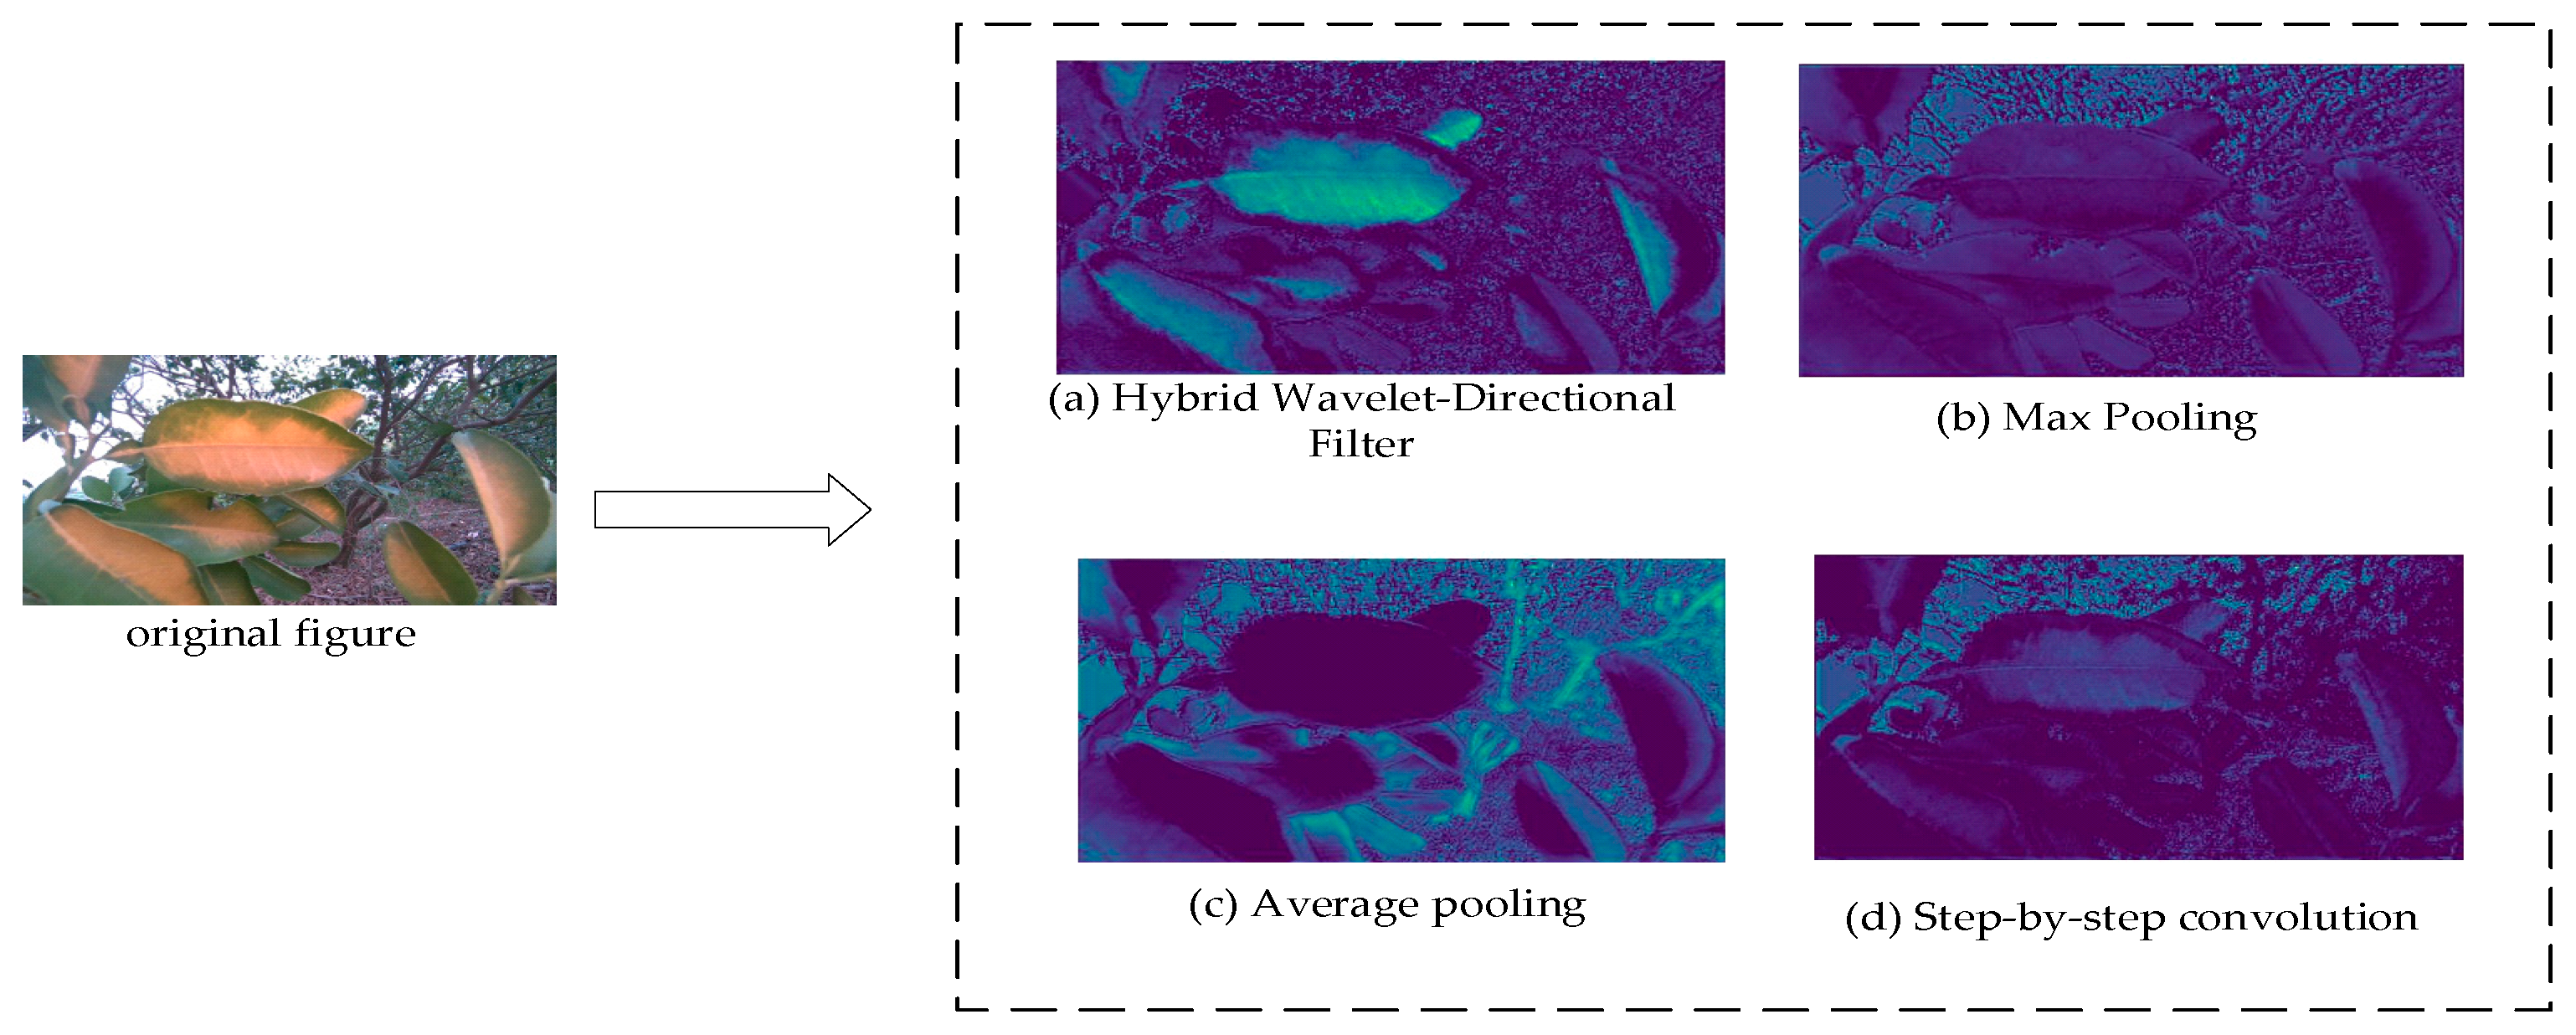
3.4. HWD Downsampling Operator

Deep convolutional neural networks (DCNN) usually use downsampling methods such as maximum pooling, average pooling, and step-step convolution, but these methods often cause the loss of contextual feature information while reducing the computational complexity of the model, making it difficult to accurately capture the target. Although there are many methods dedicated to dealing with feature information loss, such as multiscale, a priori guidance, and multimodal strategies, these methods still have limitations in reducing the loss of model context information [32].
The HWD filter is a frequency domain-based filter that enhances specific features of the input image by selectively preserving certain band-pass frequencies. Although the HWD filter itself does not amplify the image, it can increase the contrast of the lesioned areas through frequency selection, making the output image visually brighter than the input image. This enhancement helps the model to better identify the lesioned regions.
The HWD downsampling module adopts a wavelet-based signal processing method, which can decompose the signal into two parts: high frequency and low frequency, so as to reduce the computational cost and complexity of the model and reduce the loss of context information. As shown in Figure 9, the HWD module first divides the signal into a detailed high-frequency signal and a raw low-frequency signal by means of a discrete wavelet transform. Then, selecting a high-frequency component from each of the three different directions to construct a new feature map. The original low-frequency signal feature map is stitched with the three feature maps of the high-frequency signal, and finally, the feature map is output after convolution operation.

3.5. ShapeIoU Loss Function

Bounding box regression loss is of great significance in object detection, and the common bounding box regression loss functions are IoU, CIoU, GIoU, and SIoU. Existing bounding box regression methods usually consider the geometric relationship between the GT box and the prediction box and use the relative position and shape of the bounding box to calculate the loss, ignoring the influence of intrinsic attributes such as the shape and scale of the bounding box on bounding box regression [33]. In order to improve the ability of the model for occluding targets and other positive samples that are more difficult to detect, the ShapeIoU bounding box regression loss function is used in the paper to deal with the detection tasks of greening in challenging environments, such as occlusion and complex backgrounds.
The formula for defining the ShapeIoU total regression loss function is as follows.
L S h a p e I o U = 1 I o U + d i s t a n c e s h a p e + 0.5 × s h a p e
where, d i s t a n c e s h a p e —the similarity between the shape of the GT box and the prediction box.
  • IoU—the traditional regression loss function.
  • s h a p e —the cost function of the shape of the GT box and the predicted box.

3.6. Model Training and Model Evaluation Indicators

The improved HHS-RT-DETR model was trained, and the training rounds, input image size, Batchsize, Mixup, and scaling factor in the ShapeIoU regression loss function were set to 100 rounds, 640 × 640, 4, 0.5, 0.5, respectively. And the optimizer was selected as AdamW.
In this paper, precision (P), recall (R), F1-score, mean average precision (mAP), and model parameters are selected as model evaluation indicators [34,35,36,37]. Table 3 shows the formula definitions. At the same time, the FPS value is selected as the evaluation index of the model detection speed.
The variables in the table have the following meanings:
  • TP: True positive, predicted to be a positive sample, actual positive sample.
  • FP: False positive, predicted to be a positive sample, actual negative sample.
  • FN: False negative, predicted as a negative sample, actual positive sample.
  • TN: True negative, predicted to be a negative sample, actual negative sample.
In the object detection system, the priority of performance parameters from high to low is the mAP value, F1 value, precision and recall. This is because the F1-score and mAP take into account both precision and recall, which can eliminate the influence of a single evaluation on the outcome [37]. In addition, the number of parameters determines the computational complexity of the model, and the smaller the value, the lower the computational complexity of the model.

4. Results and Discussion

4.1. Ablation Experiments

Based on the in-depth optimization and improvement of the RT-DETR-r18 model, this paper proposes an improved model, which divides the extended dataset into a training set, a test set, and a validation set for training. The ablation experiments of the improved model are shown in Table 4.
From Table 4 of the ablation experiments, it can be observed that after the feature selection and feature fusion of the HS-FPN network model were partially integrated into the RT-DETR model, the accuracy of the HS-FPN network model increased by 3.4 percentage points, the recall rate increased by 1.4 percentage points, the average accuracy value increased by 1.6 percentage points, and the number of parameters decreased by 0.176 × 10 7 .
On the basis of the improved HS-FPN model, the HWD operator is further introduced. The experimental results show that the introduction of the HWD operator increases the accuracy by 4.5 percentage points, the recall rate by 8.5 percentage points, and the average accuracy by 5.9 percentage points. This fully proves that the HWD module can better reduce the loss of contextual effective information and improve the feature selection and fusion ability of the network model. Although the FPS frame rate decreased slightly after the introduction of the HWD operator, the impact is almost negligible from the perspective of comprehensive evaluation indicators.
In order to verify the performance of the HHS-RT-DETR model in the detection of greening in complex backgrounds, two challenging test images were selected, and by comparing the detection results of the original model in Figure 10a and the detection results of the improved model in Figure 10b, it can be clearly observed that the improved model shows good performance in identifying targets with occluded leaves and low attention.
In order to verify the ability of the HWD downsampling operator in reducing the loss of contextual valid information in the network layer, this paper selects three commonly used methods, namely average pooling, maximum pooling and step-step convolution, to compare with the HWD downsampling operator. Observing the experimental results in Figure 11, it can be seen that the HWD module performs better than the other three methods in retaining valid information in context.

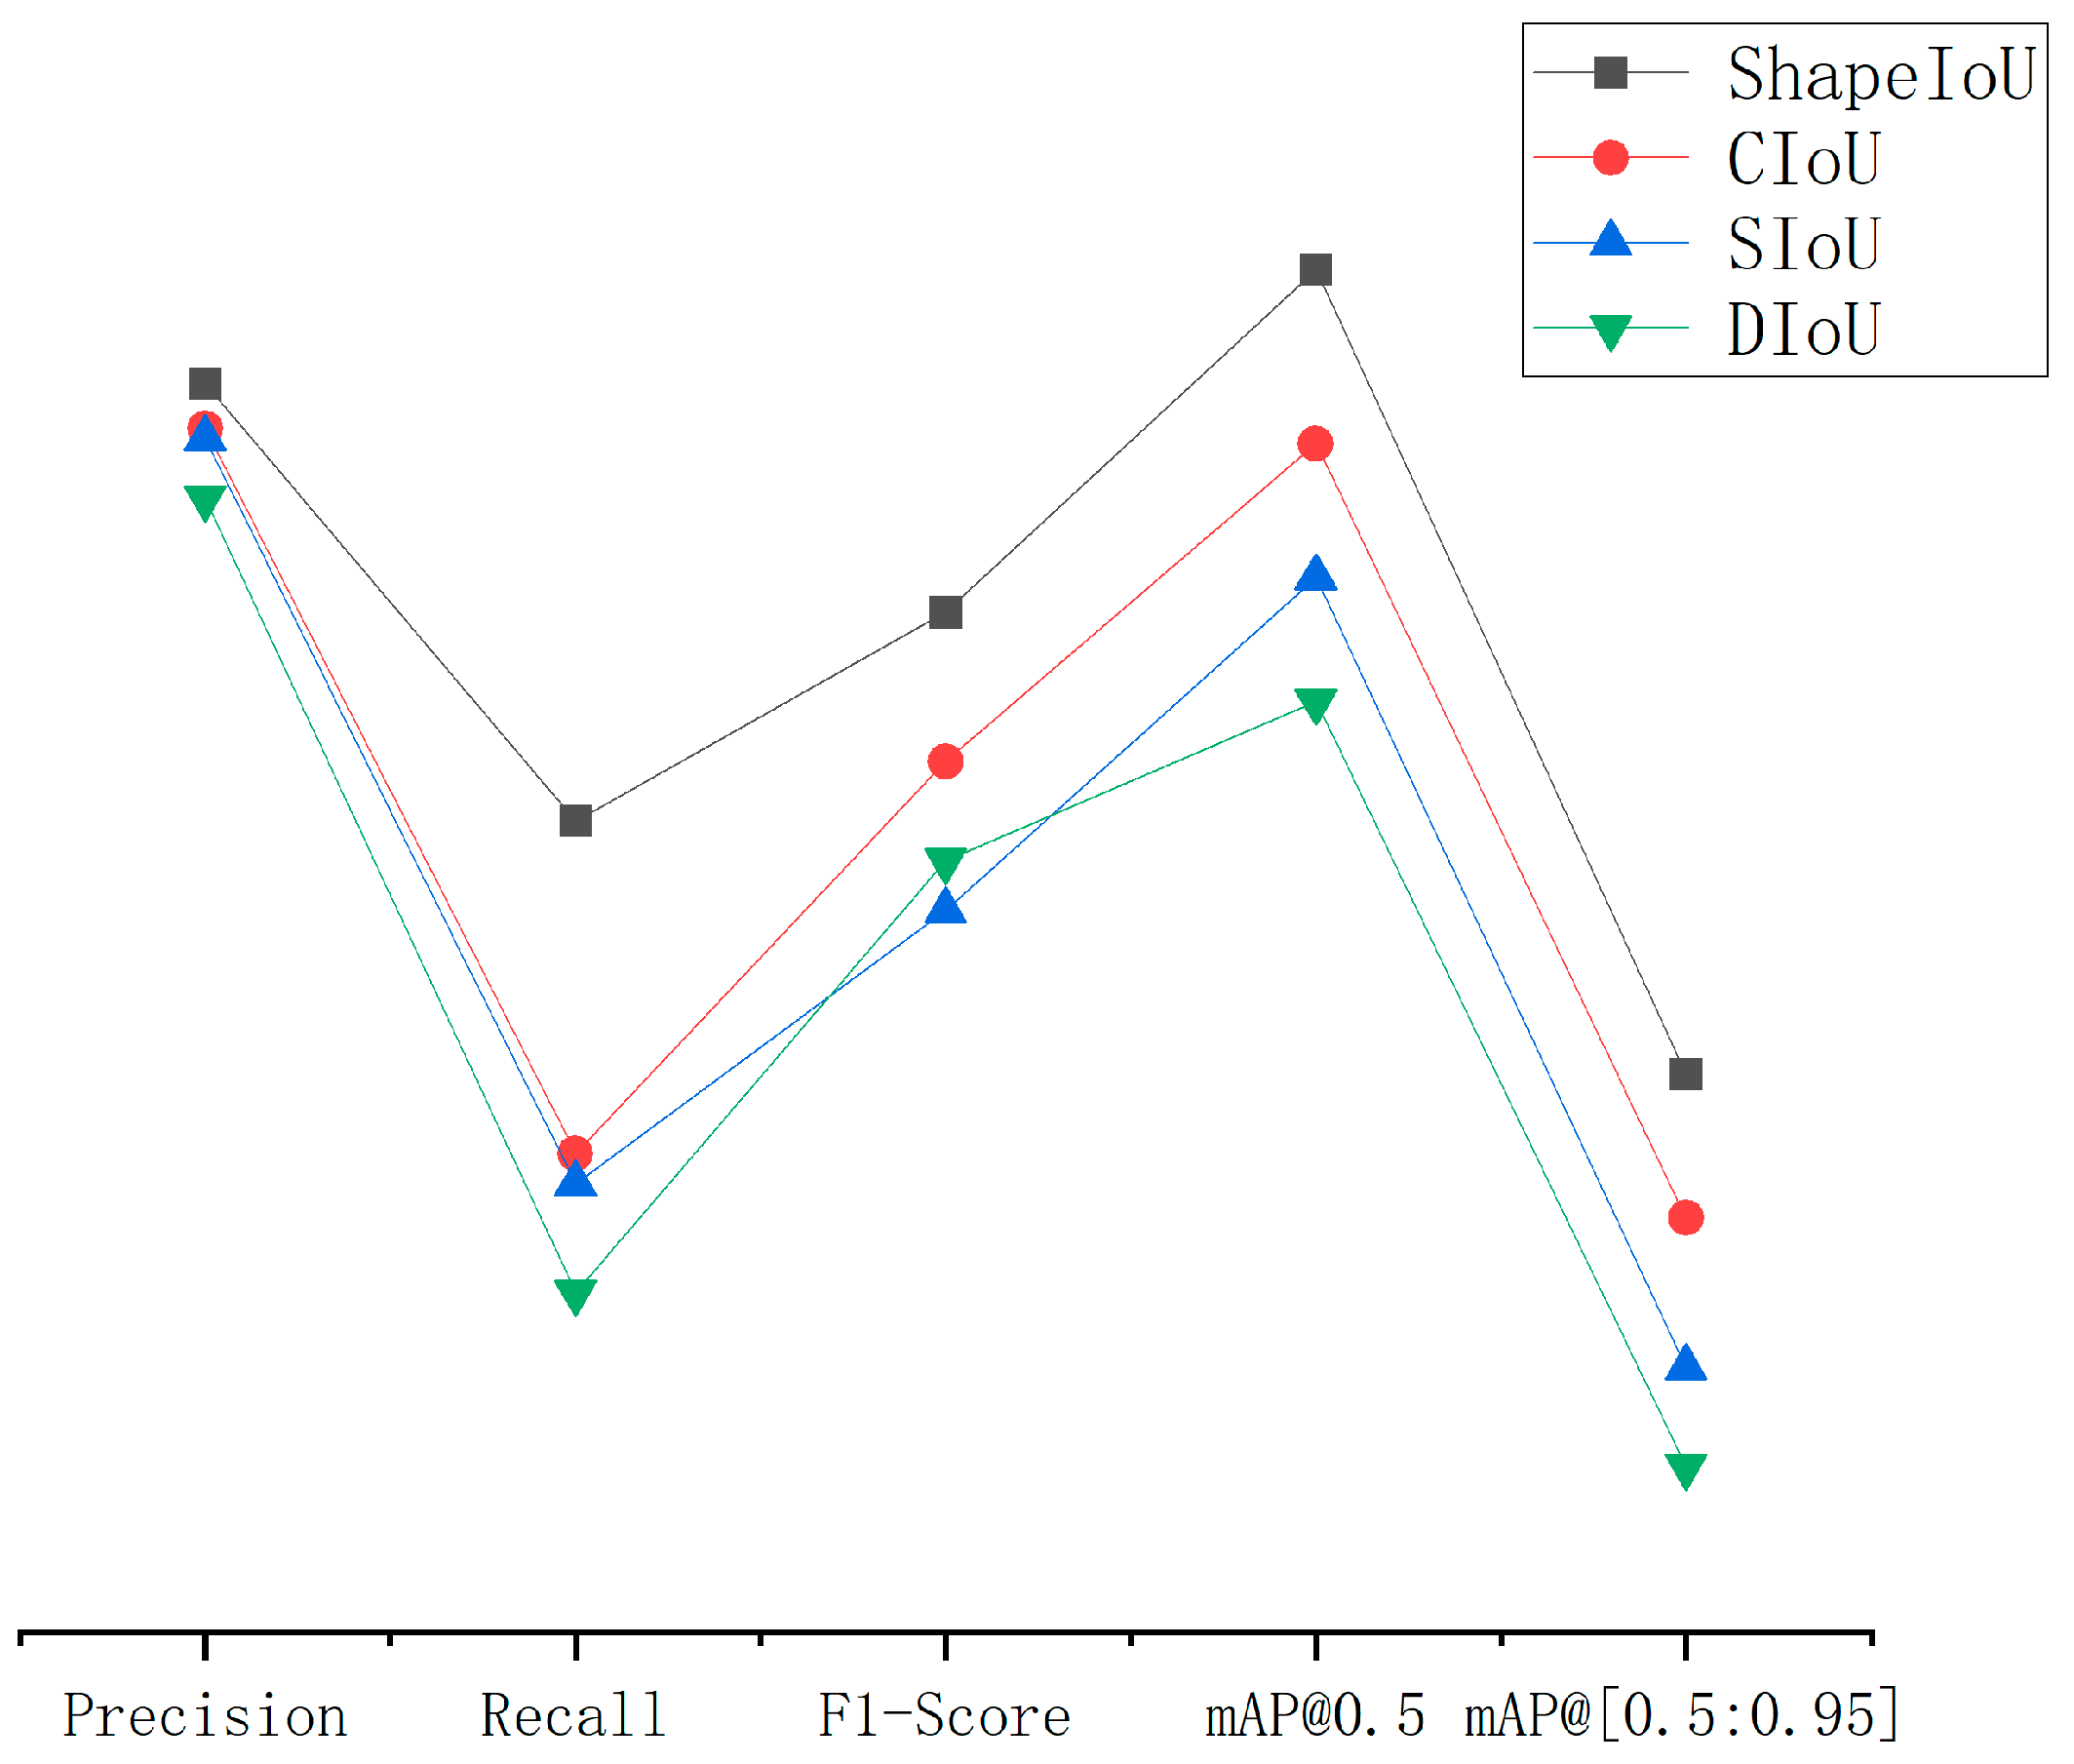
4.2. Comparison of Different Loss Functions

Based on the RT-DETR model, the ShapeIoU, CIoU, SIoU, and DIoU loss functions are used to compare with each other, and the experimental results are shown in Table 5. By observing Table 4, the introduction of ShapeIoU greatly improves the overall performance of the model. Compared with other common loss functions, the m A P 0.5 and m A P 0.5 : 0.95 in ShapeIoU loss function is increased by 3.5~8.7 percentage points and 2.9~7.9 percentage points, respectively. By observing Figure 12, we can intuitively observe the performance improvement brought by ShapeIoU to the improved model, which further verifies the effectiveness of the improved model.

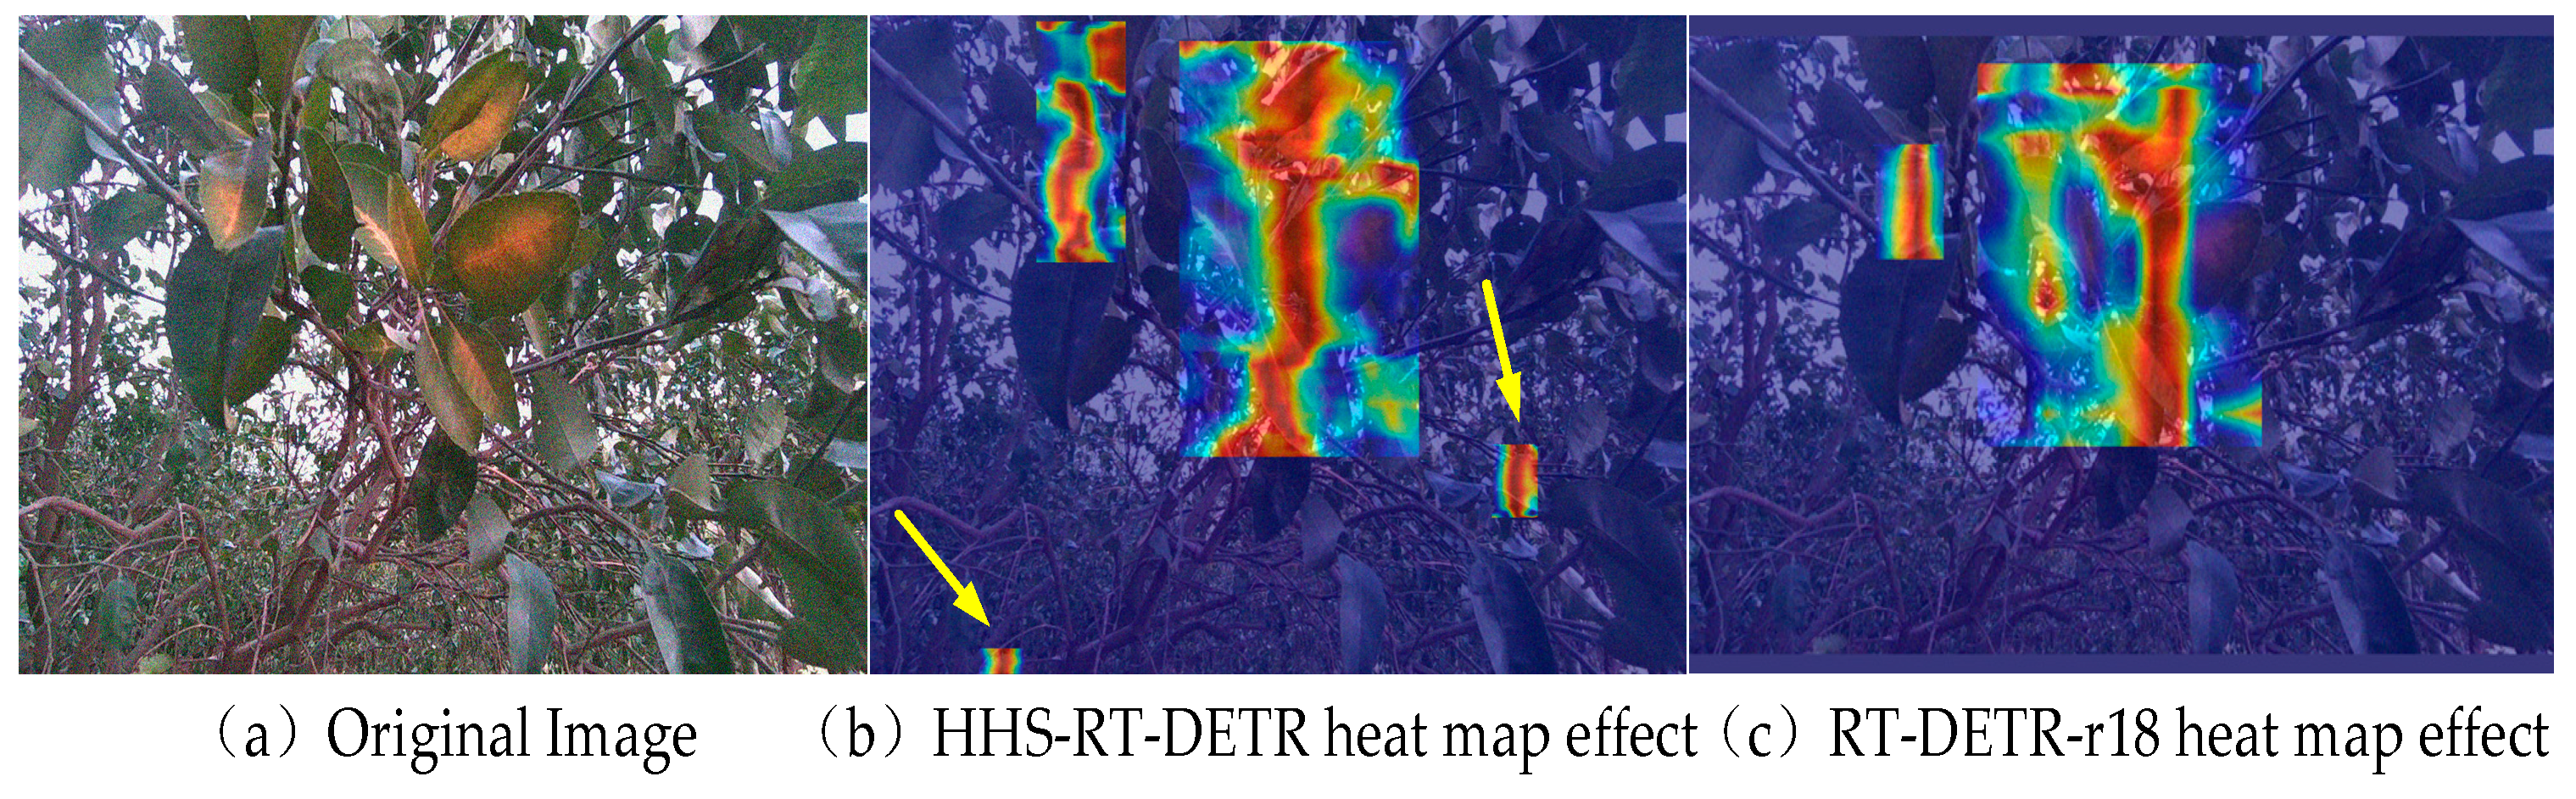
4.3. Analysis of Global Contextual Information Utilization Ability

GradCAM (gradient-weighted class activation mapping) is a tool used to visualize the decision-making process of deep learning models. It highlights the image regions that the model pays the most attention to when making classification decisions, thereby aiding in the understanding of how the model classifies input data [38]. It is primarily used to observe the distribution of regions that the model focuses on, thus providing a better understanding of the model’s decision-making process.
By applying GradCAM to generate detection heatmaps, one can more intuitively observe the model’s ability to utilize global contextual information in its classifications. In order to be more convinced of the effectiveness of HS-FPN and HWD in enhancing the feature fusion and feature selection capabilities of the original model, a challenging image was selected for testing, as shown in Figure 13a. By comparing Figure 13b,c, it can be observed that the improved model is better than the benchmark model in terms of using global contextual information. The improved model can not only accurately pay attention to the area where the citrus greening disease is located, but also effectively use the global context information to make the model effectively detect the occluding blades and targets with low attention, which further verifies the effectiveness of the improved model in detecting citrus greening disease in complex backgrounds.

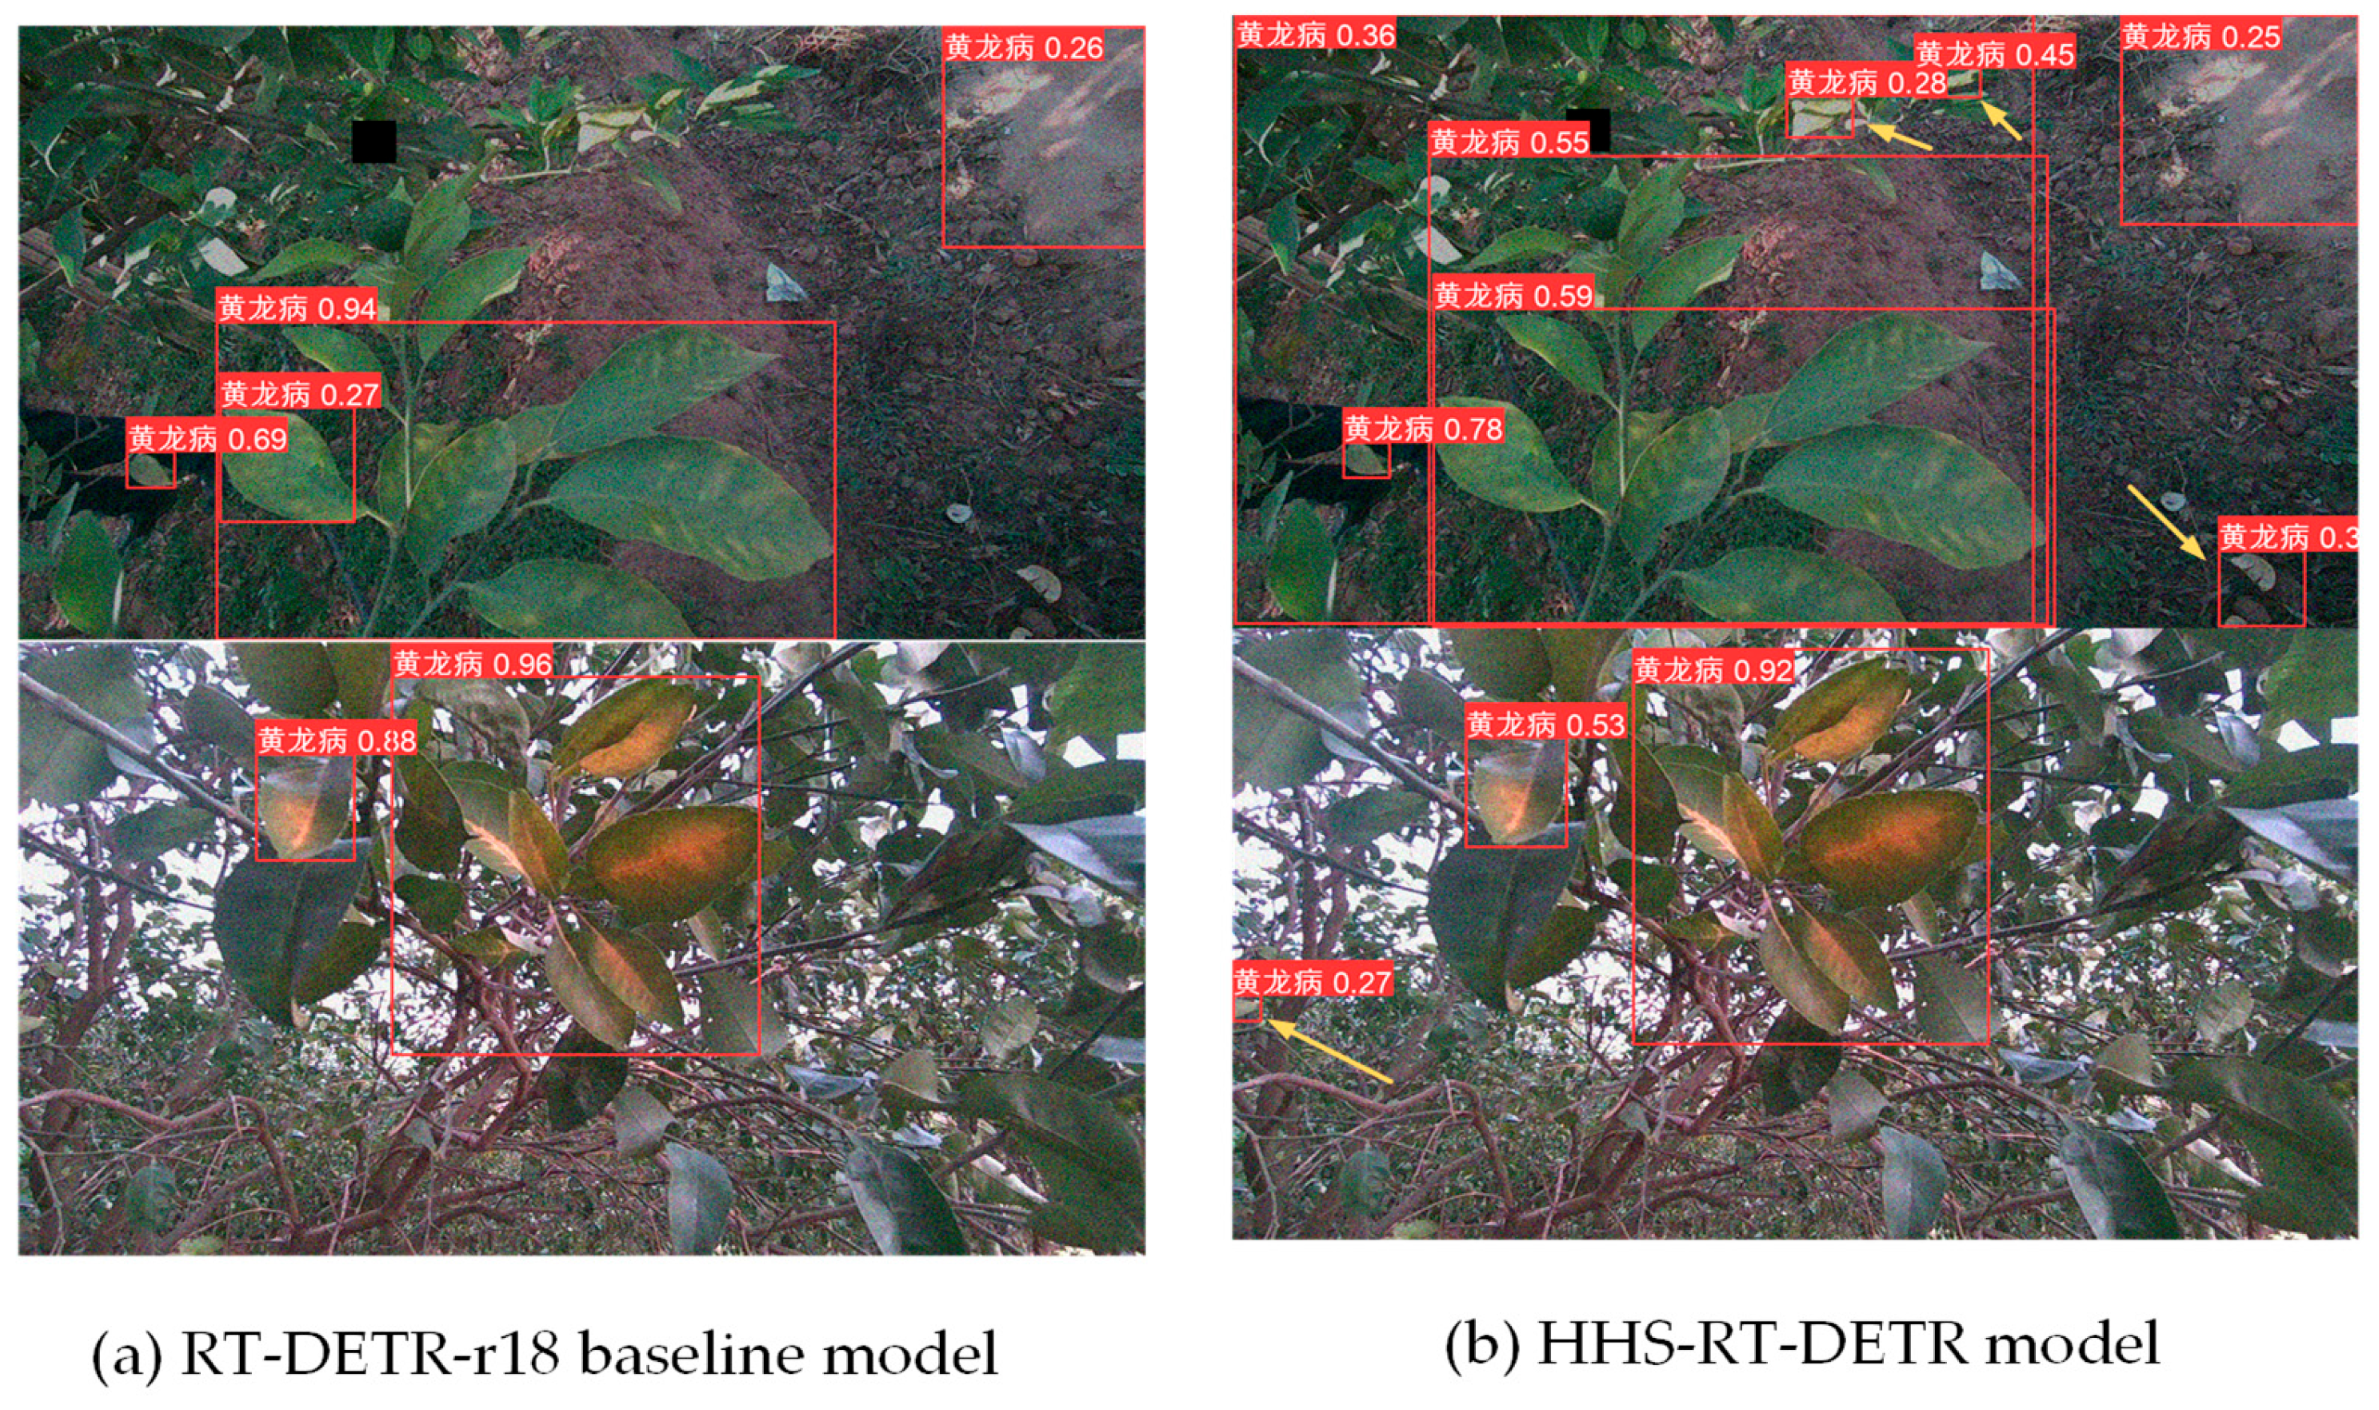
4.4. Comparison of Different Models

In order to evaluate the comprehensive performance of the improved HHS-RT-DETR model, this paper compares it with the mainstream models YOLO v5s, YOLO v5m, YOLO v8n, YOLO v6s, and the RT-DETR-r18 benchmark model. As can be seen from Table 6, the average accuracy of the RT-DETR-r18 model, YOLO v5m, YOLO v5s, YOLO v8n and YOLO v6s models has the smallest difference, but the average accuracy value of YOLO v5s is the largest, which indicates that the comprehensive performance of the YOLO v5s model is better than that of the above models. The average accuracy of the HHS-RT-DETR model is the closest to that of the YOLO v5s model, but the average accuracy of the HHS-RT-DETR model is eight percentage points higher than that of the YOLO v5s model. In addition, from the average accuracy value and other indicators, all the evaluation indexes of the improved model are higher than those of other models, which indicates that the performance of the improved HHS-RT-DETR model is better than other models. At the same time, the number of parameters of the improved HHS-RT-DETR model is the lowest compared with other mainstream detection models, which further proves that the improved HHS-RT-DETR model has the lowest computational complexity and computational cost.
Although the HHS-RT-DETR model has a higher number of parameters compared to the YOLO series models, the baseline RT-DETR-r18 model demonstrates a more significant advantage in detecting small-sized objects in natural backgrounds. Therefore, this paper opts to use the RT-DETR-r18 model as the foundation for a series of optimizations and improvements, with the aim of further enhancing the model’s detection capabilities across different scales of objects, particularly focusing on those small targets that are often overlooked, thereby achieving a more comprehensive and precise detection performance.
By observing Figure 14, it can be found that the average accuracy value of the HHS-RT-DETR model is the highest, and the average accuracy curve of the model training is smoother than other mainstream models, which proves the following points.
  • In the training process of the improved model, the parameter update is more stable, which means that the training process of the model is also more stable, and the convergence speed is faster.
  • The improved model has stronger generalization ability in the test set.
  • Compared with other models, the improved model is not sensitive to changes in data distribution, indicating that the improved model is more stable when dealing with other different distribution data.

4.5. Experimental Comparison of Public Datasets

To further validate the performance and capabilities of the improved model on public datasets, this paper conducts experiments using the public PASCAL VOC dataset and compares it with other mainstream models. In the training process of the PASCAL VOC dataset, the same parameter configuration used for the citrus greening disease dataset is applied. Notably, the training process for the greening dataset employed a Mixup data augmentation strategy, which significantly increased the training difficulty. Subsequently, to fully demonstrate the significant advantage of the proposed HHS-RT-DETR model in terms of training efficiency, all models were uniformly set to train for 100 epochs, allowing for a more intuitive demonstration of the HHS-RT-DETR’s exceptional performance during training. Finally, although the YOLO series models have not yet reached their peak in terms of accuracy and mean average precision (mAP) on the PASCAL VOC dataset, and there is still potential for improvement, this paper opts for evaluation after 100 epochs of training. The purpose of this approach is to clearly showcase the prominent performance of the HHS-RT-DETR model during the training phase, without seeking the potential performance improvements of the YOLO series models that might be achieved with additional training epochs.
The experimental results of each model after 100 rounds of training are shown in Table 7, from which it can be clearly observed that the HHS-RT-DETR model is 3.5~19.1 percentage points and 2.8~16.4 percentage points higher than other models in m A P 0.5 and m A P 0.5 : 0.95 , respectively. Considering all the evaluation indicators, the performance of the improved model is better than that of other models, which proves the effectiveness of the improved model. At the same time, the experimental verification of the public dataset further proves the excellent performance of the HHS-RT-DETR model.

5. Conclusions

To address the issue of high labor loss in extensive citrus planting areas, this study has developed a method named the HHS-RT-DETR model, which is capable of accurately identifying and locating citrus greening disease at the regional level. Even in complex natural environments, this model can effectively detect areas affected by citrus greening disease, including small diseased leaves that are difficult to detect with the naked eye. Experimental results indicate that the HHS-RT-DETR model achieved precision, recall, F1 score, and mean average precision (mAP) percentage scores of 90.5%, 83.7%, 83.0%, and 78.5%, respectively. Additionally, the improved method has demonstrated outstanding robustness when dealing with the detection of occluded leaves in complex backgrounds. Moreover, the model’s parameter count is at a level that suggests the HHS-RT-DETR model is more suitable for resource-constrained edge devices compared to the RT-DETR-r18.
Despite these significant achievements, the study still needs to address the impact of varying light intensities on the detection of citrus greening disease. To this end, future research plans include the following points:
  • Expanding the dataset to include a wider variety of citrus trees and different stages of citrus greening disease to enhance the model’s recognition capabilities.
  • Incorporating leaf images under various lighting conditions and different weather scenarios to improve the model’s generalization performance in diverse environments.
  • Deploying the mature detection model to drones and other edge devices to enable real-time monitoring and precise control of citrus greening disease.
In summary, the HHS-RT-DETR model provides a potent technical tool for the effective detection and control of citrus greening disease. Through the aforementioned optimization measures, we anticipate further enhancing the practicality and reliability of the model, thereby providing solid technical support for the healthy development of the citrus industry. A detailed model architecture and parameters of the HHS-RT-DETR model can be found in Appendix A. The source code will also be uploaded to facilitate reproduction.

Supplementary Materials

The following supporting information can be downloaded at: https://www.mdpi.com/article/10.3390/agronomy14122900/s1.

Author Contributions

Software: Y.H.; Methodology: Y.H. and J.S.; Validation: Y.H.; Formal analysis: Y.H.; Data curation: Y.H.; Writing–original draft: Y.H.; Visualization: Y.H.; Project administration: Y.H.; Writing–review & editing: Z.H. and L.Y.; Investigation: L.Y., Z.H., X.Y. and Y.Z.; Validation: J.S., Z.H., W.L., X.Y. and Y.Z.; Data curation: X.Y. and Y.Z.; Resources: W.L., X.Y. and Y.Z.; Supervision: L.Y., W.L. and J.S.; Conceptualization: L.Y.; Funding acquisition: L.Y. All authors have read and agreed to the published version of the manuscript.

Funding

National Natural Science Foundation of China (32160420); Yunnan Provincial Major Science and Technology Project (202202AE09002103); Yunnan Provincial Agriculture and Forestry Joint Special Project (202301BD070001-172).

Institutional Review Board Statement

Not applicable for studies not involving humans or animals.

Informed Consent Statement

Not applicable for studies not involving humans or animals.

Data Availability Statement

The dataset provided in this article is not easy to obtain, as it is part of ongoing research and requires further use, making it inconvenient to disclose. However, a portion of the dataset can be made available (Supplementary Materials).

Acknowledgments

Gratitude is extended for the financial support and sponsorship from the National Natural Science Foundation of China (32160420), the Yunnan Provincial Major Science and Technology Project (202202AE09002103), and the Yunnan Provincial Agriculture and Forestry Joint Special Project (202301BD070001-172). Additionally, appreciation is expressed to the teachers and fellow students for their assistance throughout the research and development process.

Conflicts of Interest

The authors declare no conflicts of interest.

Appendix A

# Parameters
nc: 1
scales:
# [depth, width, max_channels]
l: [1.00, 1.00, 1024]
backbone:
# [from, repeats, module, args]
- [−1, 1, ConvNormLayer, [32, 3, 2, None, False, ‘relu’]] # 0-P1/2
- [−1, 1, ConvNormLayer, [32, 3, 1, None, False, ‘relu’]] # 1
- [−1, 1, ConvNormLayer, [64, 3, 1, None, False, ‘relu’]] # 2
- [-1, 1, nn.MaxPool2d, [3, 2, 1]] # 3-P2/4
# [ch_out, block_type, block_nums, stage_num, act, variant]
- [−1, 1, Blocks, [64, BasicBlock, 2, 2, ‘relu’]] # 4
- [−1, 1, Blocks, [128, BasicBlock, 2, 3, ‘relu’]] # 5-P3/8
- [−1, 1, Blocks, [256, BasicBlock, 2, 4, ‘relu’]] # 6-P4/16
- [−1, 1, Blocks, [512, BasicBlock, 2, 5, ‘relu’]] # 7-P5/32
head:
- [−1, 1, Conv, [256, 1, 1, None, 1, 1, False]] # 8 input_proj.2
- [−1, 1, AIFI, [1024, 8]] # 9
- [−1, 1, HWD, [256]] # 10, Y5, lateral_convs.0
- [−1, 1, ChannelAttention_HSFPN, []] # 11
- [−1, 1, nn.Conv2d, [256, 1]] # 12
- [−1, 1, nn.ConvTranspose2d, [256, 3, 2, 1, 1]] # 13
- [6, 1, ChannelAttention_HSFPN, []] # 14
- [−1, 1, HWD, [256]] # 15
- [13, 1, ChannelAttention_HSFPN, [4, False]] # 16
- [[−1, −2], 1, Multiply, []] # 17
- [[−1, 13], 1, Add, []] # 18
- [−1, 3, RepC3, [256, 0.5]] # 19 P4/16
- [13, 1, nn.ConvTranspose2d, [256, 3, 2, 1, 1, 16]] # 20
- [5, 1, ChannelAttention_HSFPN, []] # 21
- [−1, 1, HWD, [256]] # 22
- [20, 1, ChannelAttention_HSFPN, [4, False]] # 23
- [[−1, −2], 1, Multiply, []] # 24
- [[−1, 20], 1, Add, []] # 25
- [−1, 3, RepC3, [256, 0.5]] # 26 P3/8
- [[26, 19, 12], 1, RTDETRDecoder, [nc, 256, 300, 4, 8, 3]] # Detect (P3, P4, P5)

References

  1. Gottwald, T.R. Current epidemiological understanding of citrus huanglongbing. Annu. Rev. Phytopathol. 2010, 48, 119–139. [Google Scholar] [CrossRef] [PubMed]
  2. Da Graca, J. Citrus greening disease. Annu. Rev. Phytopathol. 1991, 29, 9–136. [Google Scholar] [CrossRef]
  3. Bové, J.M. Huanglongbing: A destructive, newly-emerging, century-old disease of citrus. J. Plant Pathol. 2006, 7–37. [Google Scholar]
  4. Wang, X.; Lei, T.; Zhou, C. Occurrence and Control of Citrus Huanglongbing. Mod. Agrochem. 2023, 22, 13–16+21. [Google Scholar]
  5. Huang, S.; Huang, P.; Zhou, X.; Hu, Y. Research Progress on Comprehensive Prevention and Control Technologies for Huanglongbing. Sci. Technol. Inf. 2023, 21, 166–169. [Google Scholar] [CrossRef]
  6. Huang, F.; Cui, Y.; Song, X.; Peng, A.; Ling, J.; Chen, X. The influences of citrus huanglongbing on phyllosphere microbiome. J. Plant Prot. 2023, 50, 1150–1160. [Google Scholar] [CrossRef]
  7. Zeng, W.; Cheng, Y.; Hu, G.; Bao, W.; Liang, D. Detection of Citrus Huanglongbing in Nature Background by SMS and Two-way Feature Fusion. Trans. Chin. Soc. Agric. Mach. 2022, 53, 280–287. [Google Scholar]
  8. Sommer, L.; Schmidt, N.; Schumann, A.; Beyerer, J. Search area reduction fast-RCNN for fast vehicle detection in large aerial imagery. In Proceedings of the 2018 25th IEEE International Conference on Image Processing (ICIP), Athens, Greece, 7–10 October 2018; pp. 3054–3058. [Google Scholar]
  9. Redmon, J.; Farhadi, A. YOLO9000: Better, Faster, Stronger. In Proceedings of the 2017 IEEE Conference on Computer Vision and Pattern Recognition (CVPR), Honolulu, HI, USA, 21–26 July 2017; IEEE: Piscataway, NJ, USA; pp. 6517–6525. [Google Scholar]
  10. Sun, H.; Xu, H.; Liu, B.; He, D.; He, J.; Zhang, H.; Geng, N. MEAN-SSD: A novel real-time detector for apple leaf diseases using improved light-weight convolutional neural networks. Comput. Electron. Agric. 2021, 189, 106379. [Google Scholar] [CrossRef]
  11. Srikanth, A.; Srinivasan, A.; Indrajit, H.; Venkateswaran, N. Contactless Object Identification Algorithm for the Visually Impaired using EfficientDet. In Proceedings of the 2021 Sixth International Conference on Wireless Communications, Signal Processing and Networking (WiSPNET), Chennai, India, 25–27 March 2021. [Google Scholar]
  12. Chen, X.; Gupta, A. An Implementation of Faster RCNN with Study for Region Sampling. arXiv 2017, arXiv:1702.02138. [Google Scholar]
  13. Dong, C.; Zhang, K.; Xie, Z.; Shi, C. An improved cascade RCNN detection method for key components and defects of transmission lines. IET Gener. Transm. Distrib. 2023, 17, 4277–4292. [Google Scholar] [CrossRef]
  14. Cai, Z.; Vasconcelos, N. Cascade R-CNN: Delving into High Quality Object Detection. In Proceedings of the 2018 IEEE/CVF Conference on Computer Vision and Pattern Recognition, Salt Lake City, UT, USA, 18–23 June 2018. [Google Scholar]
  15. Li, W.; Wei, J.; Wang, Y.; Chen, J.; Luo, H. Detection of citrus pests and diseases based on improved YOLOv5. J. Nanjing Agric. Univ. 2024, 47, 1000–1008. [Google Scholar]
  16. Zheng, Y.; Chen, R.; Yang, C.; Zou, T. Improved YOLOv5s based identification of pests and diseases in citrus. J. Huazhong Agric. Univ. 2024, 43, 134–143. [Google Scholar] [CrossRef]
  17. Wang, M.; Zhang, H.; Fan, J.; Chen, B.; Yun, T. Detection and identification of tomato diseases and pests based on deep learning networks. J. China Agric. Univ. 2023, 28, 165–181. [Google Scholar]
  18. Lan, Y.; Zhu, Z.; Deng, X.; Lian, B.; Huang, J.; Huang, Z.; Hu, J. Monitoring and classification of citrus Huanglongbing based on UAV hyperspectral remote sensing. Trans. Chin. Soc. Agric. Eng. 2019, 35, 92–100. [Google Scholar]
  19. Hu, J. Application of PCA method on pest information detection of electronic nose. In Proceedings of the 2006 IEEE International Conference on Information Acquisition, Veihai, China, 20–23 August 2006; pp. 1465–1468. [Google Scholar]
  20. Kuzuhara, H.; Takimoto, H.; Sato, Y.; Kanagawa, A. Insect pest detection and identification method based on deep learning for realizing a pest control system. In Proceedings of the 2020 59th Annual conference of the society of instrument and control engineers of Japan (SICE), Chiang Mai, Thailand, 23–26 September 2020; pp. 709–714. [Google Scholar]
  21. Mohamed, A.M.; Muthu, K.M.; Navin, R.; Pughazendi, N. Multiclass pest detection and classification based on deep learning using convolution neural networks. Int. J. Res. Appl. Sci. Eng. Technol. 2020, 8, 1469–1473. [Google Scholar]
  22. He, C. Rapid Detection Citrus HLB by Developing a Handheld Device Based on Spectral Imaging Technology. Master’s Thesis, Fujian Agriculture and Forestry University, Fuzhou, China, 2022. [Google Scholar]
  23. Dai, Z. Research on Citrus Huanglongbing Diagnosis System Based on Edge Computing. Master’s Thesis, South China Agricultural University, Guangzhou, China, 2022. [Google Scholar]
  24. Lian, B. Research on Online Diagnostic Technology and System of Citrus Huanglongbing Based on MobileNet. Master’s Thesis, South China Agricultural University, Guangzhou, China, 2019. [Google Scholar]
  25. Liu, Y.; Xiao, H.; Sun, X.; Zhu, D.; Han, R.; Ye, L.; Wang, J.; Ma, K. Spectral feature selection and discriminant model building for citrus leaf Huanglongbing. Trans. Chin. Soc. Agric. Eng. 2018, 34, 180–187. [Google Scholar]
  26. Deng, Q. Rapid Nondestructive Detection of Citrus Greening (HLB) Using Hyperspectral Imaging Technology. Master’s Thesis, South China Agricultural University, Guangzhou, China, 2016. [Google Scholar]
  27. Bové, J.; Chau, N.M.; Trung, H.M.; Bourdeaut, J.; Garnier, M. Huanglongbing (greening) in Vietnam: Detection of Liberobacter asiaticum by DNA-hybridization with probe in 2.6 and PCR-amplification of 16S ribosomal DNA. In International Organization of Citrus Virologists Conference Proceedings (1957–2010); International Organization of Citrus Virologists (IOCV): Riverside, CA, USA, 1996. [Google Scholar]
  28. Weng, H.; Liu, Y.; Captoline, I.; Li, X.; Ye, D.; Wu, R. Citrus Huanglongbing detection based on polyphasic chlorophyll a fluorescence coupled with machine learning and model transfer in two citrus cultivars. Comput. Electron. Agric. 2021, 187, 106289. [Google Scholar] [CrossRef]
  29. He, C.; Li, X.; Liu, Y.; Yang, B.; Wu, Z.; Tan, S.; Ye, D.; Weng, H. Combining multicolor fluorescence imaging with multispectral reflectance imaging for rapid citrus Huanglongbing detection based on lightweight convolutional neural network using a handheld device. Comput. Electron. Agric. 2022, 194, 106808. [Google Scholar] [CrossRef]
  30. Zhao, Y.; Lv, W.; Xu, S.; Wei, J.; Wang, G.; Dang, Q.; Liu, Y.; Chen, J. Detrs beat yolos on real-time object detection. In Proceedings of the IEEE/CVF Conference on Computer Vision and Pattern Recognition, Seattle, WA, USA, 16–22 June 2024; pp. 16965–16974. [Google Scholar]
  31. Chen, Y.; Zhang, C.; Chen, B.; Huang, Y.; Sun, Y.; Wang, C.; Fu, X.; Dai, Y.; Qin, F.; Peng, Y. Accurate leukocyte detection based on deformable-DETR and multi-level feature fusion for aiding diagnosis of blood diseases. Comput. Biol. Med. 2024, 170, 107917. [Google Scholar] [CrossRef]
  32. Xu, G.; Liao, W.; Zhang, X.; Li, C.; He, X.; Wu, X. Haar wavelet downsampling: A simple but effective downsampling module for semantic segmentation. Pattern Recognit. 2023, 143, 109819. [Google Scholar] [CrossRef]
  33. Zhang, H.; Zhang, S. Shape-iou: More accurate metric considering bounding box shape and scale. arXiv 2023, arXiv:2312.17663. [Google Scholar]
  34. Pan, S.J.; Yang, Q. A survey on transfer learning. IEEE Trans. Knowl. Data Eng. 2009, 22, 1345–1359. [Google Scholar] [CrossRef]
  35. He, B.; Zhang, Y.; Gong, J.; Fu, G.; Zhao, Y.; Wu, R. Fast recognition of tomato fruit in greenhouse at night based on improved YOLO v5. Trans. Chin. Soc. Agric. Mach. 2022, 53, 201–208. [Google Scholar]
  36. Ma, H.; Dong, K.; Wang, Y.; Wei, S.; Huang, W.; Gou, J. Lightweight Plant Recognition Model Based on Improved YOLO v5s. Trans. Chin. Soc. Agric. Mach. 2023, 54, 267–276. [Google Scholar]
  37. Zhou, W.; Niu, Y.-Z.; Wang, Y.-W.; Li, D. Rice pests and diseases identification method based on improved YOLOv4-GhostNet. Jiangsu J. Agric. Sci. 2022, 38, 685–695. [Google Scholar]
  38. Selvaraju, R.R.; Cogswell, M.; Das, A.; Vedantam, R.; Parikh, D.; Batra, D. Grad-cam: Visual explanations from deep networks via gradient-based localization. In Proceedings of the IEEE International Conference on Computer Vision, Venice, Italy, 22–29 October 2017; pp. 618–626. [Google Scholar]
Figure 1. Images of selected greening datasets (images of rock sugar oranges, Wokan oranges, and grapefruits in natural and simple backgrounds).
Agronomy 14 02900 g001
Figure 2. Partial results of dataset expansion.
Agronomy 14 02900 g002
Figure 3. HHS-RT-DETR model structure (the structural diagram of the improved model).
Agronomy 14 02900 g003
Figure 4. Structure of feature selection module (feature selection network structure in HS-FPN network).
Agronomy 14 02900 g004
Figure 5. Structure of SPFF feature fusion module (feature fusion network structure in HS-FPN network).
Agronomy 14 02900 g005
Figure 6. ChannelAttention_HSFPN structure.
Agronomy 14 02900 g006
Figure 7. Feature selection module (feature selection network module in ChannelAttention-HSFPN network).
Agronomy 14 02900 g007
Figure 8. Feature fusion module (feature fusion network module in ChannelAttention-HSFPN network).
Agronomy 14 02900 g008
Figure 9. HWD module structure.
Agronomy 14 02900 g009
Figure 10. Comparison of detection effect between the RT-DETR-r18 model and HS-RT-DETR model. (a) on the left presents the detection results of the original RT-DETR-r18 model, while figure (b) on the right displays the outcomes of the enhanced HHS-RT-DETR model. A comparison between the two figures reveals that the area indicated by the yellow arrow was not detected by the original model, but it has been successfully identified in the improved model.
Agronomy 14 02900 g010
Figure 11. HWD module compared with other modules to reduce the loss of context information (comparison of HWD downsampling method with max pooling, average pooling, and strided convolution methods).
Agronomy 14 02900 g011
Figure 12. Comparison curves of different loss functions.
Agronomy 14 02900 g012
Figure 13. Comparison of the thermal map effect between the original model and the improved model ((a) is the original image, (b) is the heatmap of object detection from the HHS-RT-DETR model, and (c) is the heatmap of object detection from the RT-DETR-r18 benchmark model).
Agronomy 14 02900 g013
Figure 14. Comparison curves of different models.
Agronomy 14 02900 g014
Table 1. Structure of greening dataset (the table contains the collection time and three types of citrus diseases, namely rock sugar orange, mandarin, grapefruit).
Citrus CategoryNumber of Complex Background ImagesNumber of Simple Background ImagesCollection Time
Ice-sugar orange greening2002009:00 a.m.~11:00 a.m.,
15:00 p.m.~17:00 p.m.
Wokan orange greening2002008:30 a.m.~10:00 a.m.,
16:00 p.m.~17:25 p.m.
Grapefruit greening2002009:00 a.m.~11:20 a.m.,
14:00 p.m.~16:00 p.m.
Table 2. Experimental environment configuration.
Experimental EnvironmentExperimental Configuration
CPUAMD Ryzen 9 5900X 12-Core Processor
GPURTX 3090 24G
Operating systemUbuntu 22.04
Experimental toolsPycharm 2021.1.3 + python 3.8.16 + Pytorch 1.13.1
Cuda11.7
Table 3. Definition of each index formula.
Evaluation IndicatorsEvaluation Formula
P (Precision) T P T P + F P
R (Recall) T P T P + F N
F1-score 2 × R × P R + P
Accuracy T P + T N T P + T N + F N + T F
AP (Average precision) 0 1 P ( R ) d R
mAP (Mean average precision) i = 1 N A P i N
Table 4. Comparison of model improvement results.
BaselineHS-FPNHWDP (%)R (%)mAP (%)Params (107)FPS (Frame/s)
RT-DETR-r18××82.673.884.92.00868
RT-DETR-r18×86.075.286.51.83273
RT-DETR-r1890.583.792.41.87172
Table 5. Comparison results of different loss functions.
BaselineShapeIoUCIoUSIoUDIoUP(%)R(%) F 1 - Score ( % ) m A P 0.5
(%)
m A P 0.5 : 0.95
(%)
RT-DETR-r18×××82.673.878.084.968.7
RT-DETR-r18×××81.767.175.081.465.8
RT-DETR-r18×××81.566.572.078.762.8
RT-DETR-r18×××80.364.373.076.260.8
Table 6. Comparison of different models.
MethodP (%)R (%)F1-Score (%) m A P 0.5
(%)
m A P 0.5 : 0.95
(%)
Params (106)
YOLO v5m85.375.780.385.869.82.11
YOLO v5s86.876.281.086.970.52.50
YOLO v8n89.783.082.092.365.73.01
YOLO v6s82.669.576.083.367.54.23
RT-DETR-r1882.673.8278.084.968.720.08
HHS-RT-DETR90.583.783.092.478.518.71
Table 7. Network model performance.
MethodP (%)R (%)F1-Score (%) m A P 0.5 (%) m A P 0.5 : 0.95
YOLO v5m40.538.538.034.221.6
YOLO v5s42.039.139.035.622.0
YOLO v8n53.246.448.047.030.6
YOLO v6s38.435.935.032.721.8
RT-DETR-r1856.647.751.048.335.2
HHS-RT-DETR58.948.953.051.838.0
Disclaimer/Publisher’s Note: The statements, opinions and data contained in all publications are solely those of the individual author(s) and contributor(s) and not of MDPI and/or the editor(s). MDPI and/or the editor(s) disclaim responsibility for any injury to people or property resulting from any ideas, methods, instructions or products referred to in the content.

