Article

Isotopic Signatures and Fluxes of N2O Emitted from Soybean Plants and Soil During the Main Growth Period of Soybeans

1
Shandong Provincial Key Laboratory of Water and Soil Conservation and Environmental Protection, College of Resources and Environment, Linyi University, Linyi 276000, China
2
College of Medicine, Linyi University, Linyi 276000, China
3
Institute of Applied Ecology, Chinese Academy of Sciences, Shenyang 110016, China
4
Department of Biological and Environmental Sciences, Troy University, Troy, AL 36082, USA
*
Authors to whom correspondence should be addressed.
Agronomy 2024, 14(12), 2875; https://doi.org/10.3390/agronomy14122875
Submission received: 30 October 2024 / Revised: 21 November 2024 / Accepted: 2 December 2024 / Published: 3 December 2024

Abstract

:
Soil microorganisms have long been recognized as primary producers of biogenic N2O in terrestrial ecosystems. Terrestrial plants can contribute to N2O emissions by transporting N2O produced in soils, and there is also evidence that plants may serve as direct producers of N2O. However, to date, direct evidence for N2O production by plants remains limited. To exclude N2O emissions resulting from soil-to-plant transport, this study conducted incubation experiments using cut soybean branches and leaves (cSBF) and intact soil cores under an N2O-free air background. The natural isotopic signatures (δ15N and δ18O) and fluxes of N2O produced by cSBF and soil were compared across different soybean growth stages over two growing seasons. The observed δ15N and δ18O values of N2O from soil ranged from −26.7‰ to −5.3‰ and −24.1‰ to 22.8‰, respectively. In contrast, the values for N2O produced from cSBF ranged from −4.7‰ to 33.1‰ and from 23.7‰ to 88.8‰, respectively. Notably, N2O emitted from plants exhibited significantly higher δ15N and δ18O values than soil-derived N2O (p < 0.05). These findings indicate that the pathways and mechanisms of N2O production and emission in soybean plants differ from those mediated by soil microorganisms and nitrogen transport processes. Additionally, a significantly higher amount of N2O emission was observed during early growth stages compared to late growth stages (p < 0.01), suggesting that plant N2O production may be associated with elevated water content and oxygen-limited conditions within plant cells. In addition to the N2O uptake by plants observed in some literature, the positive relationship between δ15N values and N2O fluxes suggests that N2O could be consumed in plant cells (p < 0.01), with a high consumption rate often associated with a high production rate. The results of this study provide compelling evidence that plants may represent an overlooked source of N2O in terrestrial ecosystems.

1. Introduction

Nitrous oxide is a potent greenhouse gas that contributes to global climate change and the depletion of stratospheric ozone [1]. This trace gas has a global warming potential 298 times greater than that of CO2 and a long turnover time of 114 years. Consequently, N2O is estimated to account for approximately 6% of projected global warming. Currently, the atmospheric concentration of N2O has reached 322 parts per billion (ppb) and is rising at a rate of approximately 0.25% annually [2]. However, significant uncertainties remain in the global N2O budget [3], primarily due to substantial spatial and temporal variations in the biogenic N2O in-/out-flux. Historically, the known inputs (i.e., sources) of atmospheric N2O have been lower than the known outputs (i.e., sinks) [4,5,6,7,8], indicating that either the known input fluxes have been underestimated or unidentified sources may exist.
Biogenic N2O production has traditionally been attributed solely to microbial nitrogen transformations, specifically nitrification, nitrifier-denitrification, and denitrification processes. However, an increasing number of studies suggest that plants can emit N2O independently [9,10,11,12,13,14]. N2O production from soybean foliage has been documented during in vivo nitrate reductase assays [8]. Some studies have reported N2O emissions from bacteria-free or nearly bacteria-free plant samples, such as soybean, wheat, and maize [9,10,11,12]. Moreover, it has been found that N2O emission rates vary among different plant types, parts, and growth stages [10,15,16]. Utilizing 15N-labeled nitrate as a tracer, Smart and Bloom [11] indicated that N2O can be formed by enzymatic activities within plant foliage. Hakata et al. [12] found 15N-labeled N2O emissions from the tested 16 plant taxa when cultured aseptically in a 15N-labeled nitrate medium and concluded that the conversion of nitrate to N2O is common in plants. Lenhart et al. [13] were the first to report isotopic signatures (δ15N, δ18O, δ15Nsp, and δ15Nsp:15N site preference) of N2O emitted from plants, as well as the N2O emission rates of 32 plant species from 22 different families measured under controlled laboratory conditions. Timilsina et al. [14] determined the δ15Nsp values of N2O emitted from rubber plants (Ficus elastica) under field conditions and suggested that mitochondria may be the sites of N2O formation in plant cells. These findings challenge the view that plants merely serve as a medium for transporting soil-produced N2O into the atmosphere. Most previous studies have suggested that plants can transport soil-derived N2O through plant pore spaces (aerenchyma) [17,18,19,20,21] or fluid systems, particularly through the transpiration process (for non-aerenchymous species), subsequently releasing it into the atmosphere. It is assumed that N2O emissions through the transpiration stream may be a common phenomenon among all plants [22,23].
The role of plants in N2O emissions from terrestrial ecosystems primarily involves the transport of soil-derived N2O. Plants have not been regarded as a major source of N2O in the global N2O budget due to the lack of robust evidence for plant-emitted N2O. Thus far, the underlying mechanisms of N2O emissions from plants remain poorly understood, leading to uncertainties regarding their contribution to the global N2O budget. Additionally, most previous studies related to plant N2O emissions that utilized stable isotope techniques have primarily focused on 15N-enriched nitrogen sources [11,12]. However, few have examined the natural 15N isotopic signatures of N2O emitted from plants [13,14]. We hypothesized that the natural isotopic compositions of N2O emitted from soil microbes and plants may differ, based on recent studies suggesting that the enzymes responsible for N2O production in plants differ from those in soil microorganisms [24,25]. Therefore, we determined the natural isotopic compositions and fluxes of N2O emitted from soil microbes and plants in a soil–soybean system over the time series of soybean growth. The primary objectives of this study were to distinguish the sources of N2O (from soil or plants) using natural isotopic signatures and to characterize the patterns of N2O emissions from soil and plants across different growth stages.

2. Materials and Methods

2.1. Soybean Cultivation

A soybean cultivar (Glycine max (L.) Merr. Tiefeng 29) was planted in three plots (each measuring 2 m × 4 m) during the spring of two consecutive years at the Shenyang Experimental Station of Ecology (41°31′ N, 123°24′ E), China. To capture the primary growth stages of soybeans, planting was conducted on multiple dates: 29 April, 1 July, and 2 August in 2019, as well as 14 May and 6 July in 2020. The soil was classified as aquic brown soil (silty loam Hapli-Udic Cambosols according to Chinese Soil Taxonomy), with physical and chemical properties that included 214 g kg−1 sand, 465 g kg−1 silt, 321 g kg−1 clay, 16.17 g kg−1 organic carbon, 0.76 g kg−1 total nitrogen, 1.25 g cm−3 bulk density, and a pH of 6.4 (1:2.5 water). Urea (60 kg N ha−1), calcium superphosphate, and potassium chloride (N:P2O₅:K2O = 2:1:1) were applied to the plots at sowing time, following one side of the ribbings, while soybean seeds were sown in the ribbings at a depth of approximately 6 cm.

2.2. N2O Emissions from Soybean Plants and from Soil

The above-ground parts of the soybean were harvested at different growth stages (Table 1), namely seedling (sd), branching (br), flowering (fl), pod-setting (ps), grain-filling (gf), and maturing (mt), during the morning hours (10:00–11:00 a.m.), and were immediately transported to the laboratory. The clipped soybean branches and foliage (abbreviated as cSBF) were thoroughly washed with tap water and air-dried for approximately 0.5 h. A moderate amount of the air-dried fresh soybean plants (200 g for seedlings, 300 g for pod-setting, and 500 g for flowering, grain-filling, and maturing, respectively) was placed into 6.0 L flint glass bottles. The bottles were sealed immediately with airtight rubber stoppers and clamps. The background N2O concentration in the headspace of the bottles was eliminated through successive vacuuming and flushing with N2O-free air. All bottles were incubated under indoor conditions with a photosynthetic photon flux density of less than 36 μmol/m2/s during the day, followed by darkness at night. Incubation times were controlled for 40–48 h to allow for N2O accumulation. Consequently, the N2O emission rates for cSBF were determined by calculating the difference in N2O concentration between the beginning and end of incubation. Intact soil cores (0–10 cm) were simultaneously collected using stainless steel cutting rings (6 cm i.d.). Six soil cores (approximately 2 kg in total) were placed in a 6.0 L flint glass bottle and incubated under the same conditions as those for the soybean plants. At the end of the incubation, a gas sample (500 mL) was collected once using a gas-tight syringe from the headspace of the 6.00 L bottles. All treatments were conducted in triplicate, with the soybean plants or soil samples collected from each plot serving as one replicate in the incubation experiment. The flux values and isotopic signatures are presented as the mean of the three replicates.

2.3. Gas Samples Analysis

The N2O concentrations were determined using a gas chromatograph (Agilent 7890D, Agilent Technologies, Inc., Santa Clara, CA, USA) equipped with an electron capture detector (ECD). The oven and ECD temperatures were maintained at 55 °C and 330 °C, respectively.
The δ15N and δ18O values of N2O were analyzed using a continuous flow technique coupled with a Finnigan isotope ratio mass spectrometer (Thermo Finnigan DELTA plus XP, Dreieich, Germany). The N2O working standard (WS) gas was injected into the iron resource 10 times before measuring each sample gas, and the δ15N values of N2O in the gas samples were obtained relative to the N2O working standard. The WS gas used in this study was commercially available N2O stored in an 80 L steel cylinder, with a purity exceeding 99.999% (Tokyo, Japan). The N2O WS gas was calibrated against an original standard gas (δ15NAir = −0.32‰; δ18OSMOW = −8.23‰) from SHOKO Co., Ltd. (Tokyo, Japan), with δ15NAir and δ18OSMOW values of 7.31‰ and 38.46‰, respectively. The δ15N-N2O and δ18O-N2O in the gas samples were calibrated against the δ15NAir and δ18OSMOW of the WS gas, respectively; that is, δ15N relative to N2 in the air and δ18O relative to Vienna-SMOW.

2.4. Calculation Methods and Statistics

Nitrous oxide emission rates from soybean were calculated based on the N2O emissions during incubation and the biomass of clipped soybean plants. Generally, soil depths of 0–20 cm (plough layer) primarily contribute to soil N2O emissions in dryland agricultural soils. According to previous studies, the N2O emission flux obtained in this study (at a soil depth of 0–10 cm) was multiplied by a factor of 2.5, representing the average field soil N2O emission flux throughout the entire soybean growth season. Since the N2O flux and δ15N and δ18O values significantly differed among soybean growth stages, the averages of δ15N and δ18O of N2O were weighted by N2O flux and soybean growth stages over the two seasons. The isotopic values of N2O were calculated as follows:
δsample = [(Rsample/Rstandard) − 1] × 1000
R = 15N/14N or 18O/16O
All statistical analyses were conducted using SPSS version 19.0 for Windows. Prior to statistical analysis, the homogeneity of variances was assessed using Levene’s test, and logarithmic transformations were applied to the data where necessary. Differences in N2O fluxes and the δ15N and δ18O values of N2O emitted by soybean plants and soil on the same sampling date were analyzed using a T-test. Differences in N2O fluxes and δ15N and δ18O values among sampling dates were evaluated using one-way ANOVA followed by Duncan’s multiple comparison test. A p-value of <0.05 and <0.01 were considered statistically significant and highly significant, respectively. Figures were constructed using Origin 2018 (OriginLab, Northampton, MA, USA).

3. Results

3.1. N2O Emission Rates

In our incubation experiment, the N2O emission rates from clipped soybean branches and foliage (cSBF) varied significantly across the growing seasons (Table 1). At the seedling, branching, and flowering stages, N2O emission rates from cSBF ranged from 40.6 to 252.9 ng N2O g−1 dw h−1 in 2019 and from 31.9 to 138.0 ng N2O g−1 dw h−1 in 2020. These figures were three orders of magnitude higher than those recorded during the pod-setting, grain-filling, and maturity stages (less than 1.31 ng N2O g−1 dw h−1) (p < 0.01) (Table 1). In contrast, soil N2O emission rates fluctuated within a relatively narrower range (between 1.6 and 55.8 μg N2O m−2 h−1) (Table 1).
We attempted to extrapolate the N2O emissions from the incubation measurements to equivalent field fluxes (Table 1). Comparative results indicated that soybean plants emitted N2O fluxes that were comparable to, or even higher than, those from the soil during the seedling, branching, and flowering stages.

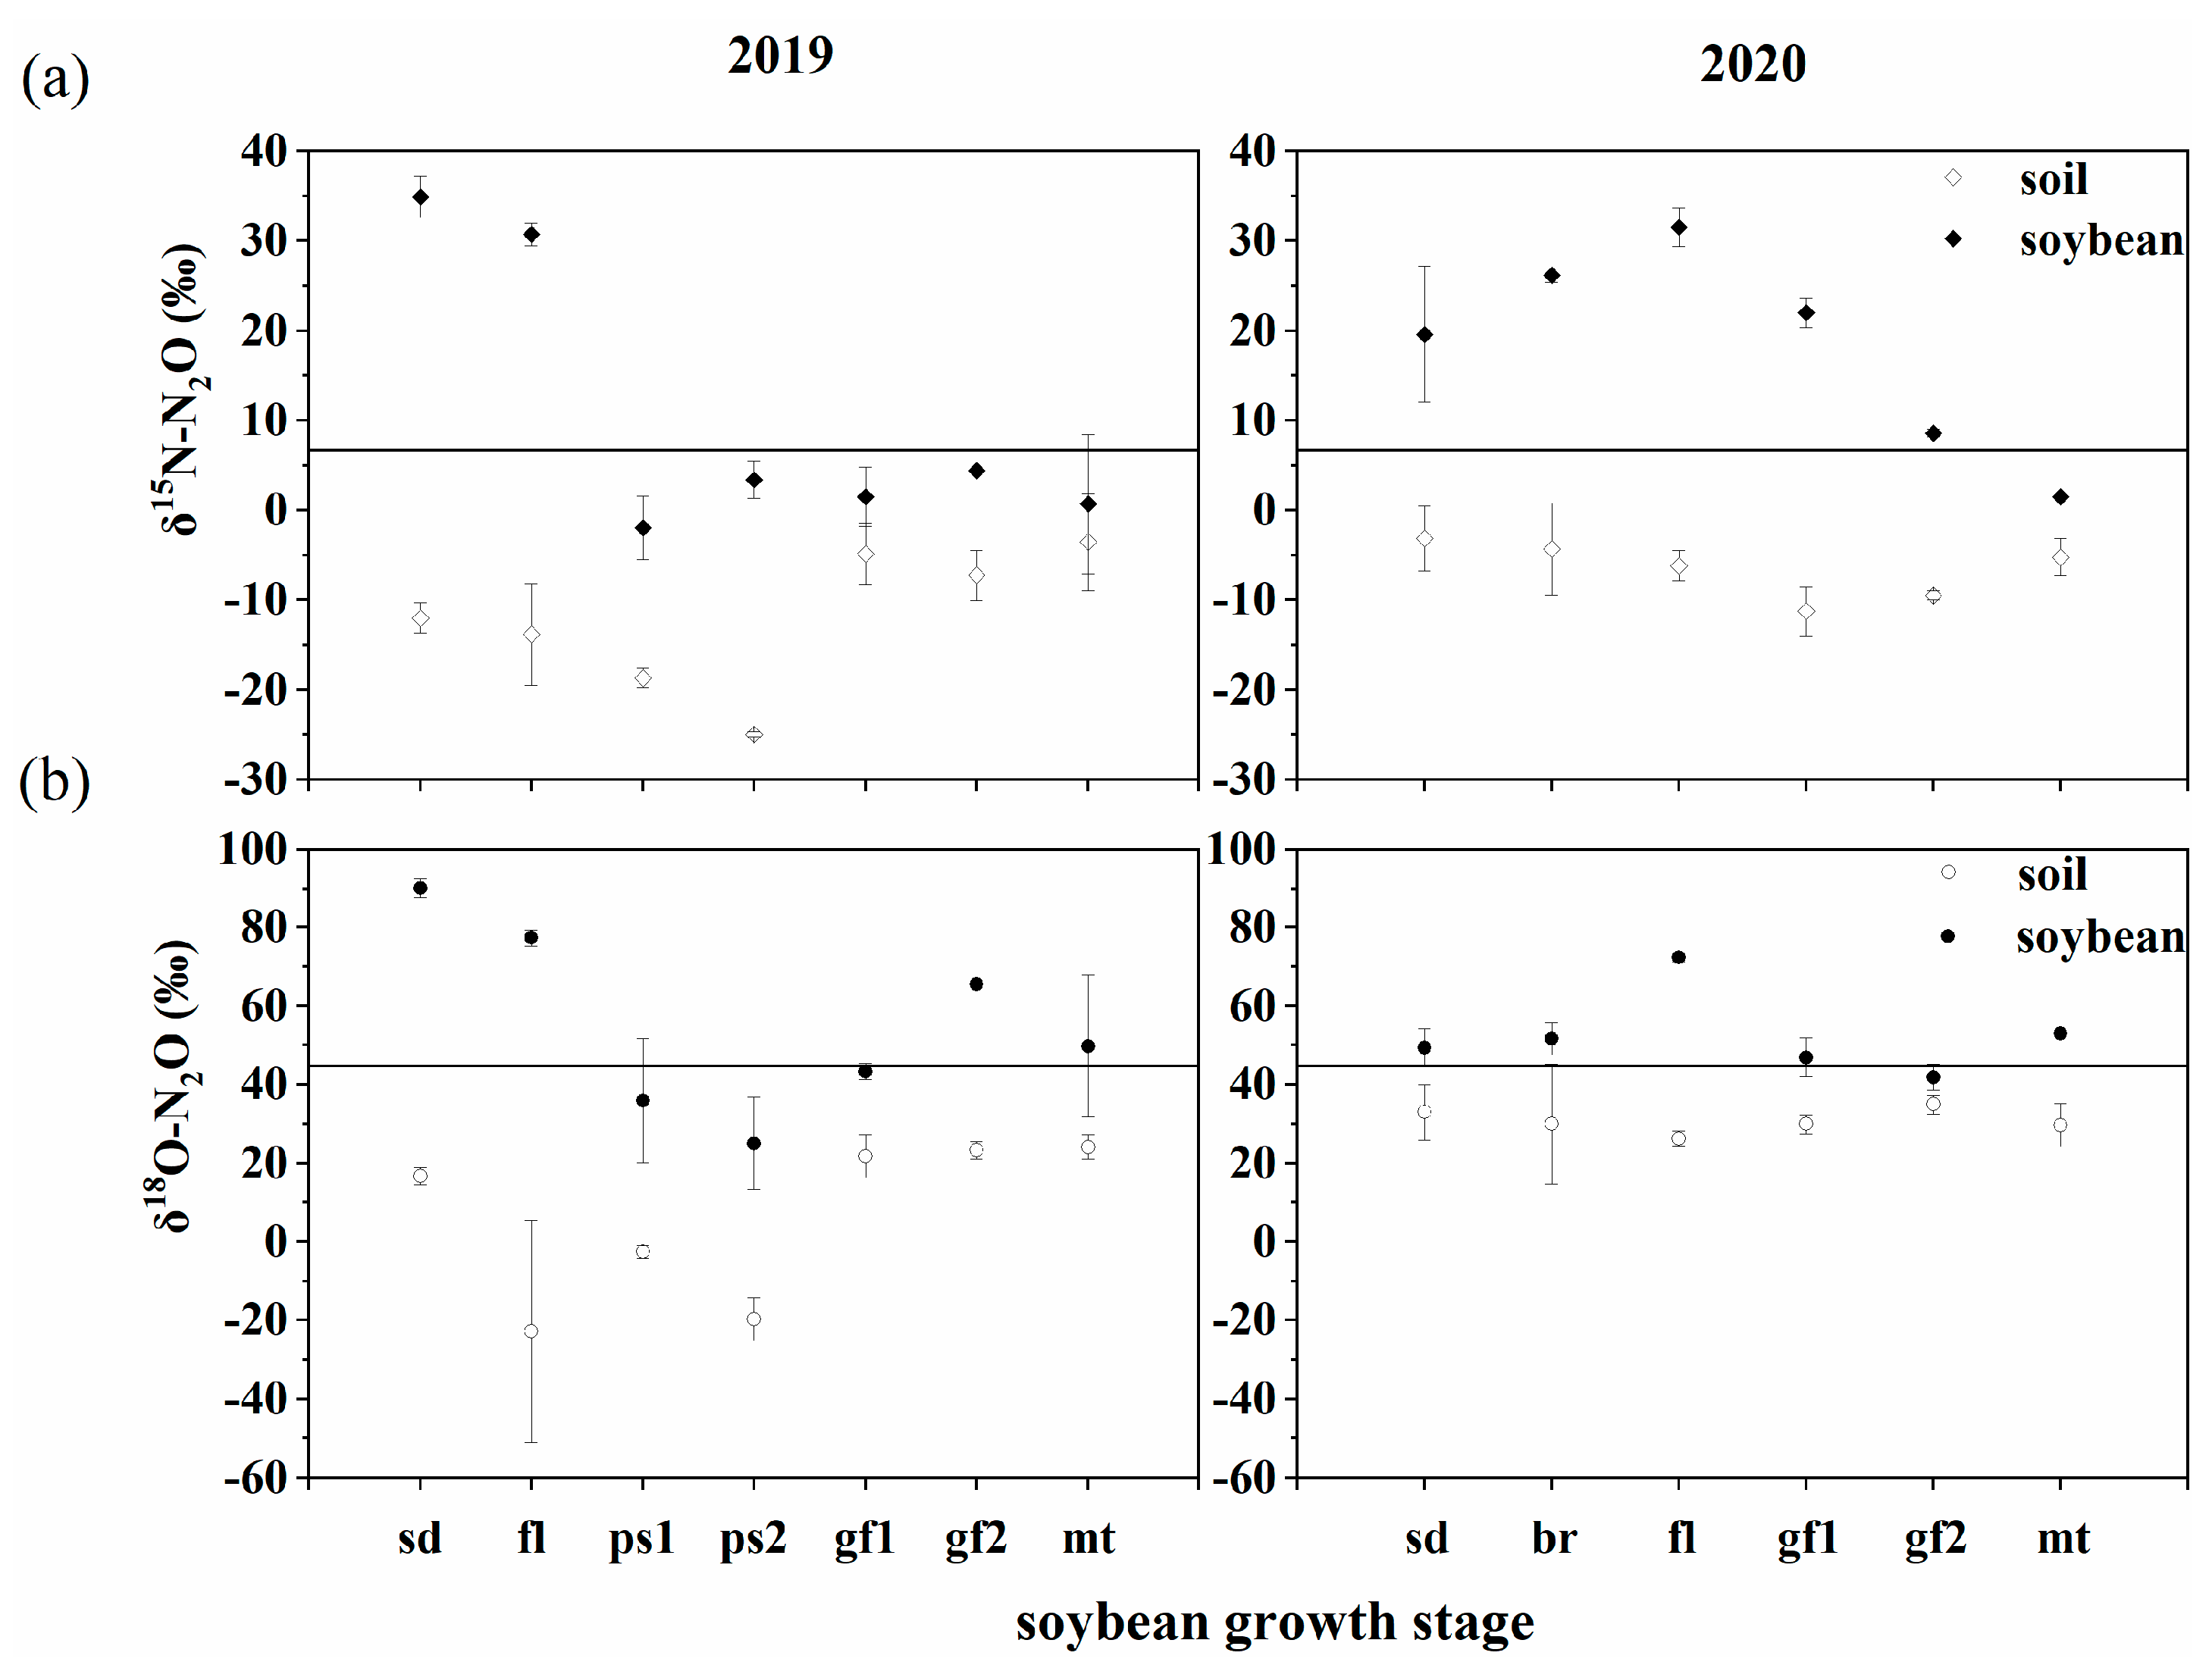
3.2. δ15N and δ18O Signatures of N2O Emitted from Soil and Soybean
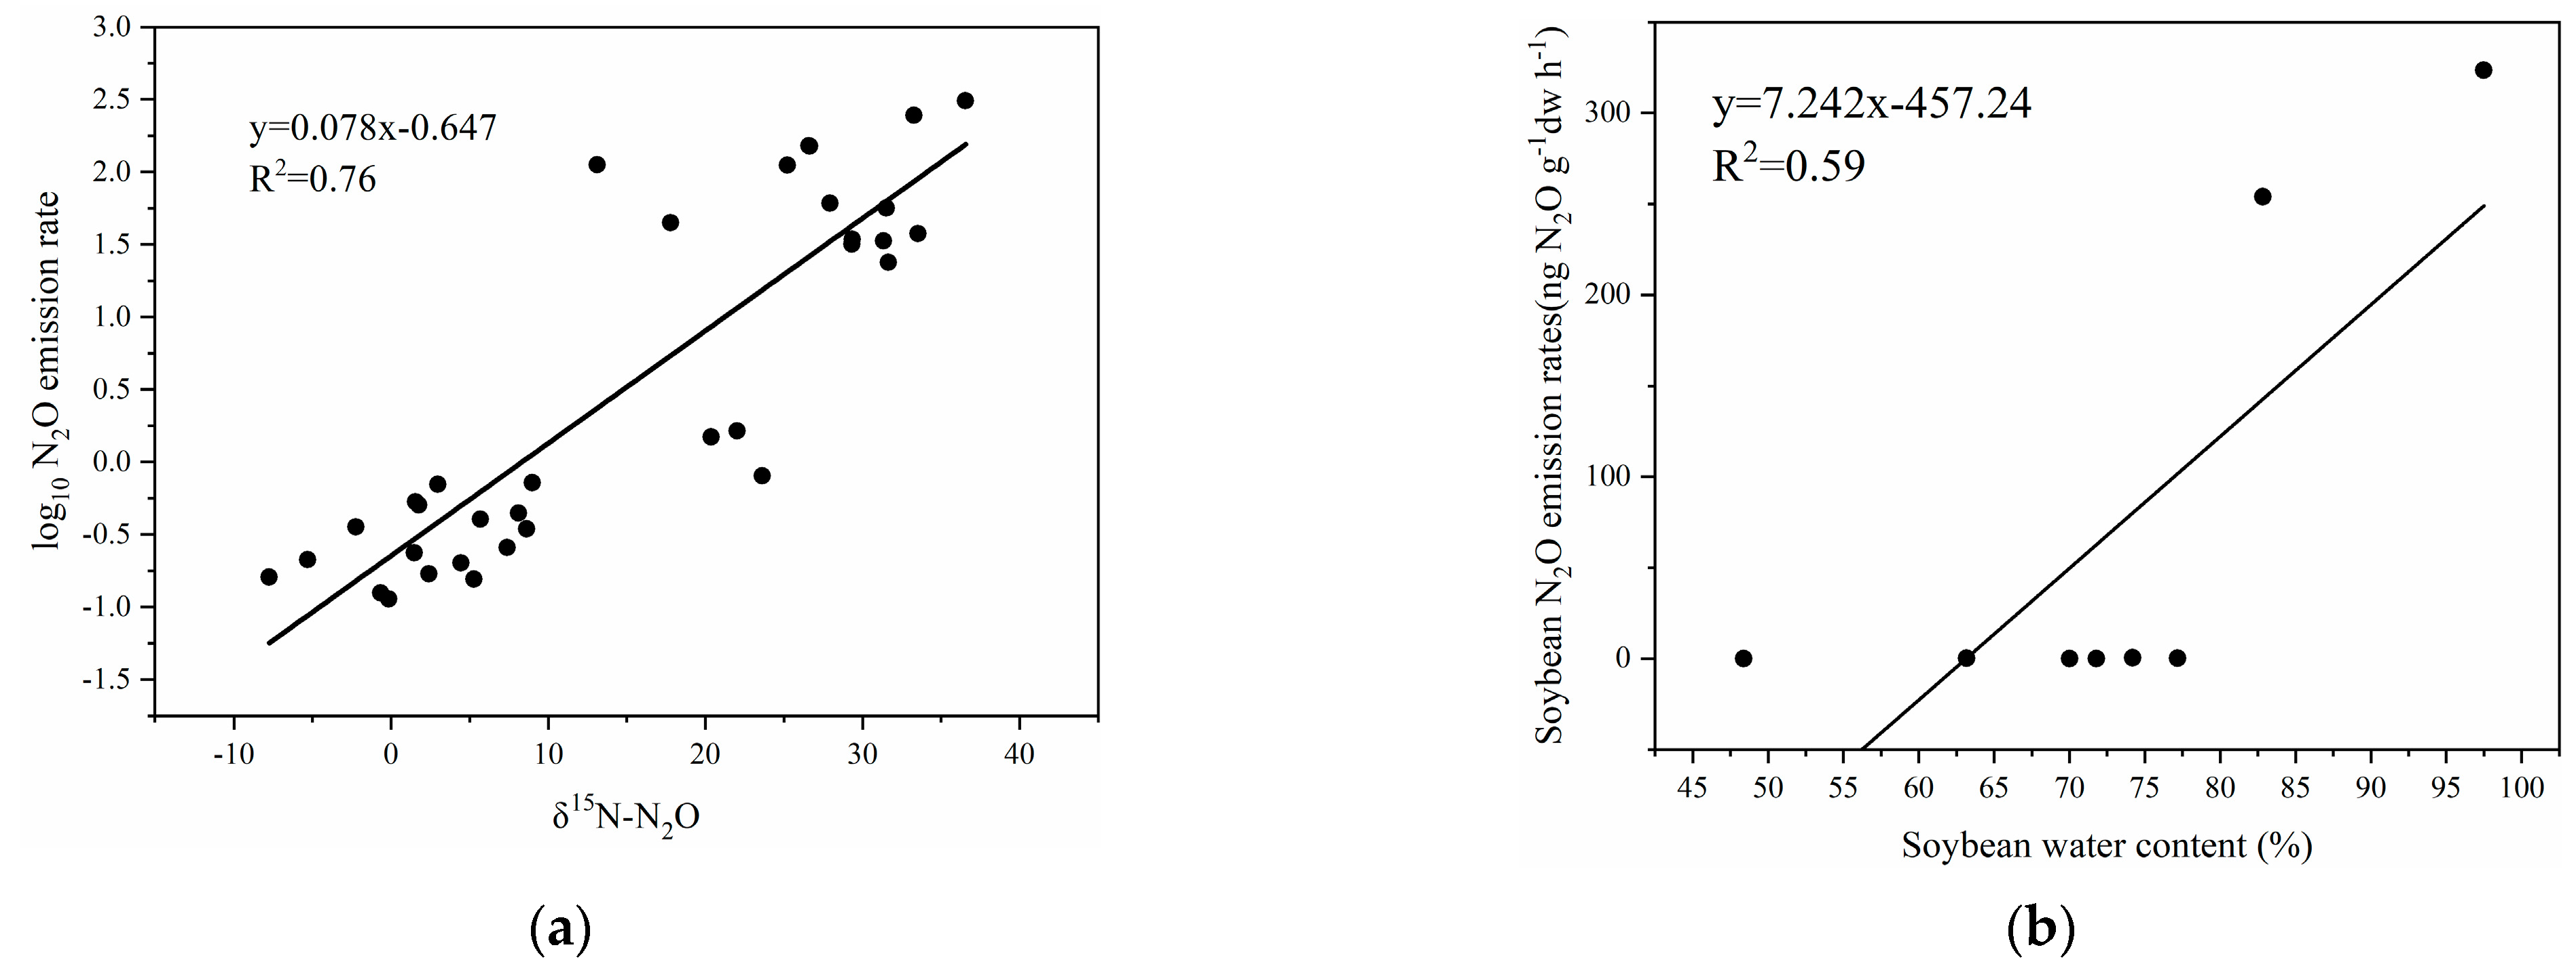
The δ15N values of N2O emitted from cSBF ranged from −4.7‰ to 33.1‰, while those emitted from the soil ranged from −26.7‰ to −5.3‰. The mean δ15N values of N2O emitted from plants and soil were significantly different (p < 0.01) (Figure 1a). Similarly, the δ18O values of N2O emitted from cSBF and soil were significantly different (p < 0.01); they ranged from 23.7‰ to 88.8‰ for plants and from −24.1‰ to 22.8‰ for soil (Figure 1b). Moreover, significant positive relationships were observed between the δ15N values of N2O emitted from cSBF and its emission rates (p < 0.01) (Figure 2a), and between the N2O emission rates from cSBF and their water contents (p < 0.05) (Figure 2b).

4. Discussion

4.1. Possible Processes of N2O Production by Plants

The significant difference in δ15N values of N2O emitted from plants and soil in this study suggests that the N2O emitted from plants is produced within plant cells rather than in the soil and subsequently emitted through the transpiration process [22,23]. It has been reported that soil N2O emissions derive from several processes, such as nitrification, denitrification, nitrifier denitrification, and fungal denitrification. Although there are overlapping ranges of isotopic signatures of N2O produced by these processes, the final emitted soil N2O has a δ15N range between −24 and −1‰ [26]. The δ15N of soil-derived N2O observed in our study is consistent with this range, while all δ15N values of plant-derived N2O are clearly distinct from it and different from those reported for microbial and chemical production [27,28,29]. The 15N-enriched N2O observed from soybean (Figure 1) suggests that this N2O is unlikely to have originated from microbial pathways.
Recent studies on potential pathways of N2O production in plants suggest that plants possess denitrifying abilities similar to those of soil microorganisms, and the enzymes involved in N2O production differ between them, leading to variations in δ15N fractionation during N2O formation [24,25]. Based on incubation with 15N-labeled nitrate, Smart and Bloom [11] observed N2O emissions from wheat leaves; however, no N2O emission was detected when ammonium (NH4+) was supplied, confirming the denitrifying abilities of plants, which are similar to those of soil microorganisms. Furthermore, plant N2O may be formed in hypoxic or anoxic mitochondria and is influenced by nitrate (NO3) concentration [24,30,31]. Hypoxic environmental stress caused by high plant water content may trigger significant nitrous oxide emissions, as emission rates during the seedling (sd), branching (br), and flowering (fl) growth stages of soybean were observed to be two to three orders of magnitude higher than those during other stages (p < 0.01); these three stages correspond to high soybean water content (>80%, water weight/fresh weight of cSBF). On one hand, increasing water content reduces the amount of oxygen absorbed by cells, gradually exacerbating cellular oxygen limitation. On the other hand, within a certain range, the respiration rate of cells is directly proportional to their water content. High water content can result in excessive oxygen consumption due to elevated respiration rates, further intensifying cellular oxygen limitation. Therefore, we propose that plant N2O emissions may be associated with hypoxic stress resulting from high water content in plant cells. The positive correlation between soybean N2O emission rates and soybean water content across all growth stages partly supports this proposal (p < 0.05) (Figure 2b).
What is the underlying mechanism of plant-produced N2O, and why is it enriched in δ15N compared to N2O from microbial processes? Based on previous studies, the pathway of plant N2O formation is proposed to occur in the mitochondria via the NO3–NO2–NO–N2O pathway under oxygen-limited conditions [24,25,32]. Nitric oxide (NO) is produced in the mitochondria to help plants cope with various environmental stresses, such as hypoxic stress [33]. However, high levels of hypoxia-induced NO in cells can lead to DNA fragmentation and cell death [33]. Therefore, it is essential to eliminate excessive NO formed under oxygen-limited conditions to protect cells from NO toxicity. Mitochondria have been reported to scavenge exogenous NO [34,35,36,37]. Consequently, N2O formation in the mitochondria through the reduction of NO may serve as a strategy to protect cells and mitochondrial components from excessive NO produced under oxygen-limited conditions. N2O uptake by plants has been observed in some studies, indicating that plants can metabolize N2O [14,38]. However, there is currently no clear evidence that plant cells can reduce N2O to N2. A significantly positive correlation was found between the logarithm of plant-emitted N2O fluxes and their δ15N values (r2 = 0.76, p < 0.01) (Figure 2a), suggesting that plants may be capable of reducing N2O to N2. In some eukaryotes, CcO might reduce NO to N2O, and N2O consumption by eukaryotes might also occur at the site of CcO, as this enzyme evolved from the last two enzymes of denitrification, NOR and N2OR [39,40]. Thus, the rate of plant N2O emissions depends on processes that control N2O production and consumption, which may be regulated by O2 concentration in plant cells. As plants lack sophisticated systems for transporting O2 [41], high water content during earlier growth stages may lead to hypoxia and anoxia, favoring the denitrification pathway and resulting in higher rates of N2O production and consumption. Increased N2O consumption may lead to higher δ15N values in residual N2O emitted by plants during these earlier growth stages. However, N2 emissions from plants have not been tested in this study. 15N-labeled N2 emissions were observed from wheat crops supplied with 15N-labeled NO2 [42], suggesting that the reduction of N2O to N2 in plant cells occurs under certain conditions. Further research focusing on N2 emissions and related enzymes at the molecular level is needed to confirm this pathway of N2O production and consumption in plants. Elucidating the mechanisms of N2O consumption by plants and identifying the conditions and factors influencing this process could offer valuable insights for mitigating N2O emissions through plant-based strategies.

4.2. Plant N2O Fluxes in the Plant–Soil System

The flux of plant N2O emissions can help estimate the role of plants in the plant–soil system. The N2O flux from clipped soybean branches and foliage in this study was lower than the emission rate of 841.7 (ranging from 250.0 to 3079.2) ng N2O g−1 dw h−1 from intact soybean plants reported in a previous study [16]. This may be attributed to the absence of N2O emissions from soybean roots, which have been proposed as ideal sites for N2O production due to their frequent occurrence in anaerobic or hypoxic conditions and their ability to absorb high concentrations of NO3 [25]. We observed substantial N2O emissions during the earlier growth stages of soybean, and these fluxes are comparable to, or even higher than, those from the soil at the same stages when considering equivalent field fluxes. Previous studies have also reported plant N2O emissions based on experimental and field investigations. The contribution of plants to N2O emissions has been reported to range from 8.1% to 91.9% (N2O emitted from plant/total N2O emission) in temperate forests, grasslands, and paddy ecosystems [13,14,18,21]. These results highlight the important role plants play in N2O emissions from the plant–soil ecosystem and further research on detecting N2O emissions from plants is essential to provide robust evidence for estimating their contribution to N2O emissions across various ecosystems. Currently, N2O emissions from plants arise from both the transport of N2O from the soil and the products of plant cell metabolism, which are regulated by the growth stage and the oxygen concentration within plant cells. There is strong spatial and temporal variability in N2O emissions from plants. The dominant N2O emission processes may differ in plants growing in humid areas compared to those in arid regions. In the future, further investigations into isotopic signatures and the fluxes of N2O emitted from different plant species under varying climatic conditions are needed to confirm that plants are a natural source of N2O.
Biological nitrogen fixation is a cornerstone of the nitrogen cycle and plays a vital role in maintaining the nitrogen balance within ecosystems. However, excessive nitrogen fertilization not only increases soil N2O emissions by providing substantial NO3 as a precursor for plant N2O production but also disrupts the symbiotic association between leguminous plants (e.g., soybean) and rhizobia, ultimately inhibiting plant growth [43]. Inoculating compatible legume cultivars with effective rhizobial strains capable of reducing N2O presents a promising strategy to decrease reliance on chemical fertilizers and mitigate N2O emissions in agricultural systems.

5. Conclusions

This study revealed that the natural isotopic signatures (δ15N and δ18O) and fluxes of N2O emitted from soybean plants exhibit a pattern influenced by growth stages. These isotopic characteristics and fluxes differ significantly from those of soil-emitted N2O, indicating distinct pathways and mechanisms of N2O production in plants and soil. Furthermore, plants demonstrate the capacity to consume N2O, with water content and oxygen availability within plant cells playing a crucial role in regulating N2O flux. Further research to quantify the dual isotopic signatures and fluxes of N2O, along with molecular-based studies, would provide clearer insights into the mechanisms of N2O production and consumption processes in plant cells.

Author Contributions

Conceptualization, Z.X., H.X. and G.C.; methodology, Z.X.; software, Z.X.; validation, Z.X. and X.Y.; formal analysis, Z.X.; investigation, Z.X. and X.Y.; resources, Z.X. and H.X.; data curation, G.C.; writing—original draft preparation, Z.X.; writing—review and editing, H.X., G.C. and K.Y.; visualization, Z.X. and X.Y.; supervision, H.X.; project administration, Z.X. and H.X.; funding acquisition, Z.X., H.X. and X.Y. All authors have read and agreed to the published version of the manuscript.

Funding

This research was funded by the National Natural Science Foundation of China (No. 31770531, 31400427).

Data Availability Statement

The original contributions presented in this study are included in the article. Further inquiries can be directed to the corresponding authors.

Acknowledgments

We wish to thank Bo Li, Xuejun Ma, and Shuang Kong for their technical assistance.

Conflicts of Interest

The authors declare no conflicts of interest.

References

  1. Chipperfield, M. Atmospheric science: Nitrous oxide delays ozone recovery. Nat. Geosci. 2009, 2, 742–743. [Google Scholar] [CrossRef]
  2. Solomon, S.; Qin, D.; Manning, M.; Chen, Z.; Marquis, M. IPCC 2007: Climate Change 2007: The Physical Science Basis. In Contribution of Working Group I to the Fourth Assessment Report of the Intergovernmental Panel on Climate Change; Cambridge University Press: Cambridge, UK, 2007; pp. 95–123. [Google Scholar]
  3. Davidson, E.A.; Kanter, D. Inventories and scenarios of nitrous oxide emissions. Environ. Res. Lett. 2014, 9, 105012. [Google Scholar] [CrossRef]
  4. Mosier, A.; Kroeze, C.; Nevison, C.; Oenema, O.; Cleemput, O.V. Closing the Global N2O Budget: Nitrous Oxide Emissions through the Agricultural Nitrogen Cycle. Nutr. Cycl. Agroecosys. 1998, 52, 225–248. [Google Scholar] [CrossRef]
  5. Naqvi, S.W.A.; Yoshinari, T.; Jayakumar, D.A.; Altabet, M.A.; Narvekar, P.V.; Devol, A.H.; Brandes, J.A.; Codispoti, L.A. Budgetary and biogeochemical implications of N2O isotope signatures in the Arabian Sea. Nature 1998, 394, 462–464. [Google Scholar] [CrossRef]
  6. Bouwman, A.F.; Van der Hoek, K.W.; Olivier, J.G.J. Uncertainties in the global source distribution of nitrous oxide [Review]. J. Geophys. Res. Atmos. 1995, 100, 2785–2800. [Google Scholar] [CrossRef]
  7. Houghton, J.T.; Callander, B.A.; Varney, S.K. The Supplementary Report to the IPCC Scientific Assessment; Cambridge University Press: Cambridge, UK, 1992. [Google Scholar]
  8. IPCC. Contributions of Working Group I to the Fourth Assessment Report of the Intergovernmental Panel on Climate Change; Cambridge University Press: Cambridge, UK; New York, NY, USA, 2013. [Google Scholar]
  9. Harper, J.E. Evolution of Nitrogen Oxide(s) during In Vivo Nitrate Reductase Assay of Soybean Leaves. Plant Physiol. 1981, 68, 1488–1493. [Google Scholar] [CrossRef]
  10. Chen, G.X.; Shang, S.H.; Yu, K.W. Investigation on the emission of nitrous oxide by plant. Chin. J. Appl. Ecol. 1990, 1, 94–96. [Google Scholar]
  11. Smart, D.R.; Bloom, A.J. Wheat leaves emit nitrous oxide during nitrate assimilation. Proc. Natl. Acad. Sci. USA 2001, 98, 7875–7878. [Google Scholar] [CrossRef]
  12. Hakata, M.; Takahashi, M.; Zumft, W.; Sakamoto, A.; Morikawa, H. Conversion of the Nitrate Nitrogen and Nitrogen Dioxide to Nitrous Oxides in Plants. Acta Biotechnol. 2003, 23, 249–257. [Google Scholar] [CrossRef]
  13. Lenhart, K.; Behrendt, T.; Greiner, S.; Steinkamp, J.; Well, R.; Giesemann, A.; Keppler, F. Nitrous oxide effluxes from plants as a potentially important source to the atmosphere. New Phytol. 2018, 221, 1398–1408. [Google Scholar] [CrossRef]
  14. Timilsina, A.; Oenema, O.; Luo, J.F.; Wang, Y.Y.; Hu, C.S. Plants are a natural source of nitrous oxide even in field conditions as explained by 15N site preference. Sci. Total Environ. 2021, 805, 150262. [Google Scholar] [CrossRef] [PubMed]
  15. Huang, G.H.; Chen, G.X.; Xu, H.; Wu, J. Investigation on emission of nitrous oxide by aseptic soybean plant. J. Integr. Plant Biol. 1992, 34, 835. [Google Scholar]
  16. Li, N.; Chen, G.X. N2O emission by plants and influence of fertilization. Chin. J. Appl. Ecol. 1993, 4, 295–298. [Google Scholar]
  17. Mosier, A.R.; Mohanty, S.K.; Bhadrachalam, A.; Chakravorti, S.P. Evolution of dinitrogen and nitrous oxide from the soil to the atmosphere through rice plants. Biol. Fert. Soils 1990, 9, 61–67. [Google Scholar] [CrossRef]
  18. Yu, K.W.; Wang, Z.P.; Chen, G.X. Nitrous oxide and methane transport through rice plants. Biol. Fert. Soils 1997, 24, 341–343. [Google Scholar] [CrossRef]
  19. Rusch, H.; Rennenberg, H. Black alder (Alnus Glutinosa (L.) Gaertn.) trees mediate methane and nitrous oxide emission from the soil to the atmosphere. Plant Soil 1998, 201, 1–7. [Google Scholar] [CrossRef]
  20. Bowatte, S.; Newton, P.C.D.; Theobald, P.; Brock, S.; Hunt, C.; Lieffering, M.; Sevier, S.; Gebbie, S.; Luo, D.W. Emissions of nitrous oxide from the leaves of grasses. Plant Soil 2014, 374, 275–283. [Google Scholar] [CrossRef]
  21. Wen, Y.; Corre, M.D.; Rachow, C.; Chen, L.; Veldkamp, E. Nitrous oxide emissions from stems of alder, beech and spruce in a temperate forest. Plant Soil 2017, 20, 423–434. [Google Scholar] [CrossRef]
  22. Chang, C.; Janzen, H.H.; Nakonechny, E.M.; Cho, C.M. Nitrous Oxide Emission through Plants. Soil Sci. Soc. Am. J. 1998, 62, 35–38. [Google Scholar] [CrossRef]
  23. Pihlatie, M.; Ambus, P.; Rinne, J.; Pilegaard, K.; Vesala, T. Plant-mediated nitrous oxide emissions from beech (Fagus sylvatica) leaves. New Phytol. 2005, 168, 93–98. [Google Scholar] [CrossRef]
  24. Timilsina, A.; Bizimana, F.; Pandey, B.; Yadav, R.K.P.; Dong, W.X.; Hu, C.S. Nitrous Oxide Emissions from Paddies: Understanding the Role of Rice Plants. Plants 2020, 9, 180. [Google Scholar] [CrossRef] [PubMed]
  25. Timilsina, A.; Zhang, C.; Pandey, B.; Bizimana, F.; Hu, C.S. Potential Pathway of Nitrous Oxide Formation in Plants. Front. Plant Sci. 2020, 11, 1177. [Google Scholar] [CrossRef] [PubMed]
  26. Boutton, T.; Yamasaki, S. Mass Spectrometry of Soils; Marcel Dekker: New York, NY, USA, 1996; pp. 177–204. [Google Scholar]
  27. Toyoda, S.; Yoshida, N.; Koba, K. Isotopocule analysis of biologically produced nitrous oxide in various environments. Mass Spectrom. Rev. 2015, 36, 135–160. [Google Scholar] [CrossRef] [PubMed]
  28. Lewicka-Szczebak, D.; Dyckmans, J.; Kaiser, J.; Marca, A.; Augustin, J.; Well, R. Oxygen isotope fractionation during N2O production by soil denitrification. Biogeosciences 2016, 13, 1129–1144. [Google Scholar] [CrossRef]
  29. Wei, J.; Amelung, W.; Lehndorff, E.; Schloter, M.; Vereecken, H.; Brüggemann, N. N2O and NOx emissions by reactions of nitrite with soil organic matter of a Norway spruce forest. Biogeochemistry 2017, 132, 325–342. [Google Scholar] [CrossRef]
  30. Samuelson, M.E.; Ohlen, E.; Lind, M.; Larsson, C.M. Nitrate regulation of nitrate uptake and nitrate reductase expression in barley grown at different nitrate:ammonium ratios at constant relative nitrogen addition rate. Physiol. Plantarum 1995, 94, 254–260. [Google Scholar] [CrossRef]
  31. Saravitz, C.H.; Devienne-Barret, F.; Raper, C.D.; Chaillou, S.; Lamaze, T. Nitrate uptake rate by soyabean and wheat plants determined by external nitrate concentration and. Int. J. Plant Sci. 1998, 159, 305–312. [Google Scholar] [CrossRef]
  32. Cooper, C.E. Nitric oxide and cytochrome oxidase: Substrate, inhibitor or effector? Trends Biochem. Sci. 2002, 27, 33–39. [Google Scholar] [CrossRef]
  33. Wany, A.; Kumari, A.; Gupta, K.J. Nitric oxide is essential for the development of aerenchyma in wheat roots under hypoxic stress. Plant Cell Environ. 2017, 40, 3002–3017. [Google Scholar] [CrossRef]
  34. Gupta, K.J.; Stoimenova, M.; Kaiser, W.M. In higher plants, only root mitochondria, but not leaf mitochondria reduce nitrite to NO, In Vitro and In Situ. J. Exp. Bot. 2005, 56, 2601–2609. [Google Scholar] [CrossRef]
  35. de Oliveira, H.C.; Wulff, A.; Saviani, E.E.; Salgado, L. Nitric oxide degradation by potato tuber mitochondria: Evidence for the involvement of external NAD(P)H dehydrogenases. Biochim. Biophys. Acta 2008, 1777, 470–476. [Google Scholar] [CrossRef] [PubMed]
  36. Wulff, A.; Oliveira, H.C.; Saviani, E.E.; Salgado, L. Nitrite reduction and superoxide-dependent nitric oxide degradation by Arabidopsis mitochondria: Influence of external NAD(P)H dehydrogenases and alternative oxidase in the control of nitric oxide levels. Nitric Oxide 2009, 21, 132–139. [Google Scholar] [CrossRef] [PubMed]
  37. Gupta, K.J.; Kaiser, W.M. Production and Scavenging of Nitric Oxide by Barley Root Mitochondria. Plant Cell Physiol. 2010, 51, 576–584. [Google Scholar] [CrossRef]
  38. Machacova, K.; Borak, L.; Agyei, T.; Schindler, T.; Soosaar, K.; Mander, U.; Ah-Peng, C. Trees as net sinks for methane (CH4) and nitrous oxide (N2O) in the lowland tropical rain forest on volcanic Reunion Island. New Phytol. 2021, 229, 1983–1994. [Google Scholar] [CrossRef]
  39. Kadenbach, B.; Stroh, A.; Hüther, F.J.; Reimann, A.; Steverding, D. Evolutionary aspects of cytochromec oxidase. J. Bioenerg. Biomembr. 1991, 23, 321–334. [Google Scholar] [CrossRef]
  40. Machacova, K.; Maier, M.; Svobodova, K.; Lang, F.; Urban, O. Cryptogamic stem covers may contribute to nitrous oxide consumption by mature beech trees. Sci. Rep. 2017, 7, 13243. [Google Scholar] [CrossRef]
  41. Voesenek, L.A.; Sasidharan, R.; Visser, E.J.; Bailey-Serres, J. Flooding stress signaling through perturbations in oxygen, ethylene, nitric oxide and light. New Phytol. 2015, 209, 39–43. [Google Scholar] [CrossRef]
  42. Vanecko, S.; Varner, J.E. Studies on Nitrite Metabolism in Higher Plants. Plant Physiol. 1955, 30, 388–390. [Google Scholar] [CrossRef]
  43. Abd-Alla, M.H.; Al-Amri, S.M.; El-Enany, A.-W.E. Enhancing rhizobium–legume symbiosis and reducing nitrogen fertilizer use are potential options for mitigating climate change. Agriculture 2023, 13, 2092. [Google Scholar] [CrossRef]
Figure 1. Isotopic signature of 15N (a) and 18O (b) in N2O emitted from soybean plant (solid diamonds and circles) and from soil (open diamonds and circles) during two growing seasons. The horizontal lines presented the atmospheric levels of δ15N- and δ18O-N2O.
Agronomy 14 02875 g001
Figure 2. (a) Correlation between the logarithm of N2O emission from soybean plant and their δ15N-N2O values (n = 34). (b) Correlation between the N2O emission rates from soybean plant and their water contents (n = 8).
Agronomy 14 02875 g002
Table 1. Comparison of N2O emission rates from soybean plants and from soil in two growing seasons *.
YearSampling Date (DAS)Growth StagecSBF N2O Emission Rate
ng N2O g−1 dw h−1
Estimated Field N2O Flux from Plant 1
μg N2O m−2 h−1
Soil N2O Emission Rate
μg N2O m−2 h−1
Estimated Field N2O Flux from Soil 2
μg N2O m−2 h−1
201957 IIIseedling (sd)252.9 ± 53.581.9 ± 17.31.6 ± 0.24.0 ± 0.6
76 Iflowering (fl)40.6 ± 13.715.3 ± 5.210.1 ± 4.625.2 ± 11.6
88 Ipod-setting (ps1)0.4 ± 0.20.2 ± 0.13.5 ± 0.88.8 ± 2.0
102 Ipod-setting (ps2)0.5 ± 0.20.3 ± 0.11.8 ± 0.24.5 ± 0.6
125 Igrain-filling (gf1)0.1 ± 0.00.1 ± 0.05.2 ± 3.313.1 ± 8.2
139 Igrain-filling (gf2)0.3 ± 0.10.2 ± 0.03.4 ± 0.98.4 ± 2.3
103 IImaturating (mt)0.2 ± 0.10.2 ± 0.110.8 ± 8.527.0 ± 21.3
202035 IVseedling (sd)72.5 ± 35.214.5 ± 7.15.1 ± 1.812.8 ± 4.5
52 IVbranching (br)138.0 ± 22.835.0 ± 5.88.2 ± 2.120.5 ± 5.2
66 IVflowering (fl)31.9 ± 7.39.6 ± 2.24.9 ± 0.712.2 ± 1.7
99 IVgrain-filling (gf1)2.5 ± 1.71.2 ± 0.855.8 ± 12.6139.5 ± 31.5
115 IVgrain-filling (gf2)0.5 ± 0.20.4 ±0.236.6 ± 6.491.6 ± 15.9
133 Vmaturating (mt)0.2 ± 0.10.2 ± 0.113.8 ± 3.934.6 ± 9.7
* Values presented are means ± standard deviations of three replicates. I, II, III, IV, V represent soybeans sown on 29 April, 1 July, and 2 August in 2019, and 14 May and 6 July in 2020, respectively. DAS stands for “days after sowing”. 1 Field N2O flux from the plant was obtained by multiplying plant N2O emission rate in incubation and dry biomass per square meter in the field. This calculation method did not consider the contribution of plant roots to N2O emission. 2 Field N2O flux from soil was calculated by multiplying soil N2O emission rate in incubation and a correction coefficient of 2.5.
Disclaimer/Publisher’s Note: The statements, opinions and data contained in all publications are solely those of the individual author(s) and contributor(s) and not of MDPI and/or the editor(s). MDPI and/or the editor(s) disclaim responsibility for any injury to people or property resulting from any ideas, methods, instructions or products referred to in the content.

