Article

Impact of Reduced Nitrogen Inputs on Soil Organic Carbon and Nutrient Dynamics in Arable Soil, Northern Thailand: Short-Term Evaluation

by
Suphathida Aumtong
1,*,
Phatchanuch Foungyen
1,
Kanokorn Kanchai
1,
Thoranin Chuephudee
2,
Chakrit Chotamonsak
3,4 and
Duangnapha Lapyai
5
1
Soil Science Program, Faculty of Agricultural Production, Maejo University, Chiang Mai 50290, Thailand
2
Business Administration, Maejo University, Chiang Mai 50290, Thailand
3
Department of Geography, Faculty of Social Sciences, Chiang Mai University, Chiang Mai 50200, Thailand
4
Environmental Science Research Center, Faculty of Science, Chiang Mai University, Chiang Mai 50200, Thailand
5
Office of Research Administration, Chiang Mai University, Chiang Mai 50200, Thailand
*
Author to whom correspondence should be addressed.
Agronomy 2024, 14(11), 2587; https://doi.org/10.3390/agronomy14112587
Submission received: 6 September 2024 / Revised: 6 October 2024 / Accepted: 30 October 2024 / Published: 1 November 2024
(This article belongs to the Section Soil and Plant Nutrition)

Abstract

:
Based on a soil analysis of individual crops, lower nitrogen (N) inputs may affect soil fertility and the soil’s capacity for carbon sequestration. This study investigates the changes in soil nitrogen levels, the amounts of labile and recalcitrant carbon fractions, and their relationship to soil organic carbon (SOC) over the course of a single crop season. We conducted this study on seven crops in the provinces of Chiang Mai, Lamphun, and Lampang in northern Thailand, from February 2022 to December 2023. The farmer plots, which included litchi, mango, banana, maize, cabbage, garlic, and paddy rice, underwent three nitrogen addition treatments: high-nitrogen fertilizer (FP), reduced-nitrogen fertilizer informed via soil analysis (FS), and fertilizer absence (FZ). Soil samples were collected from a depth of 0 to 30 cm following the harvest of each crop. Subsequently, we utilized these samples to distinguish between labile and recalcitrant carbon fractions and assessed the impact of reduction through a one-way ANOVA. This study indicated a reduced availability of nitrogen, with the recalcitrant carbon fractions being the fine fraction (FF) and less labile carbon (LLB_C). The labile organic carbon fraction, referred to as LB_C, exhibited no change in FP treatment, in contrast to the non-fine fraction (NFF) and permanganate-oxidizable carbon (POXC). Our concern was to reduce the quantity of synthetic nitrogen fertilizer to achieve a lower level of soil organic carbon (SOC) and decreased nitrogen availability. These findings underscore the importance of considering N management when assessing soil carbon dynamics in agricultural soils, and, in future work, we should therefore model the optimal N input for crop yield, soil fertility, and soil carbon storage.

1. Introduction

Climate change may increase food demand by 30% to 62% [1] as a result of population growth and rising per capita consumption [2]. Thailand’s Climate Change Master Plan (CCMP) outlines its national climate change response, aiming for carbon neutrality by 2065. The Agriculture Strategic Plan on Climate Change (ASPCC) aligns with the CCMP, providing a sector-specific input to the National Adaptation Plan (NAP). Thailand’s updated Nationally Determined Contribution (NDC) to the UNFCCC in October 2020 identifies “safeguarding food security” and “promoting sustainable agriculture” as core strategies to address climate change impacts. The updated NDC emphasizes enhanced adaptation and aims for better integration into national planning processes. Thailand is also enhancing resilience through early warning systems, improving adaptive capacity, and building farmer capabilities [3]. The FAO predicts a 50% increase in synthetic nitrogen fertilizer consumption by 2050, which could escalate greenhouse gas emissions from agricultural soils, potentially ‘threatening’ the Paris Agreement’s goal to limit global warming to 1.5 °C or less [4]. Soil left unfertilized for a long duration store less soil organic carbon (SOC) and has reduced levels of essential elements like nitrogen, phosphorus, and potassium [5,6]. Indeed, unfertilized soils have reduced nutrient usage efficiency, physical features, and carbon sequestration capability [7,8], and their uneven carbon-to-nitrogen ratios negatively affect soil microbial activity and nutrient mineralization [7]. In order to feed the world’s expanding population, synthetic fertilizers dramatically increase agricultural yields [9]. In order to increase crop yields and ensure global food security, nitrogen fertilizer is crucial, which boosts farmers’ profits all over the globe [10].
Synthetic fertilizers play a crucial role in crop production and food security, but their excessive or imbalanced use can escalate production costs and contribute to environmental pollution [11]. Synthetic nitrogen fertilizers, which significantly contribute to high fertilizer application rates, especially in vegetables and fruits, have a disproportionately large impact [12]. The chemical composition of fertilizers and soil conditions also contribute to CO2 emissions [13], and farmers’ increasing use of fertilizer is resulting in an excess of nitrogen in soil [14]. Studies have shown that fertilizers contribute to nutrient dispersion in the environment [15,16,17], leading to soil pollution, reduced fertility, and increased susceptibility to plant diseases [18]. To mitigate the impacts of climate change through synthetic fertilizer management, reducing nitrogen usage and increasing carbon storage is crucial to lowering greenhouse gas emissions from site-specific nutrient management (SSNM). In Thailand, India, and China, intensive cash crop farmers typically apply excessive nitrogen doses, underscoring the potential for nitrogen reduction through practices such as nutrient efficiency (NE) via SSNM [11]. Optimal nitrogen fertilizer application at 225 kg N ha−1 is essential for achieving high grain yields and enhancing carbon sequestration in rice cultivation [19]. Nitrogen management is crucial for sustainable agriculture, food security, and environmental protection, and improving nitrogen use efficiency (NUE) can enhance crop productivity and reduce environmental impacts [20]. Agronomic management practices and high-throughput technologies can significantly improve NUE, reducing intensive nitrogen applications [21]. When used with fertilizers for nitrogen, phosphorus, and potassium, fertilizer may help plants store more SOC. This impact has been seen in a wide variety of crops [22]. Fertilizer at the proper quantities may increase soil organic carbon and soil total carbon reserves rather than providing too much nitrogen. Accordingly, obtaining the maximum C stored in the soil requires careful nitrogen management [23].
Accordingly, a previous study demonstrated that a N addition increased both labile (e.g., particulate organic carbon, POC) and non-labile (e.g., mineral-associated organic carbon, MAOC) SOC fractions, though the extent varies [24]. The authors examined the chemical process [19] that affects the availability of nutrients connected with labile carbon fractions by measuring labile and stable carbon fractions in a number of different ways. Small amounts of nitrogen additions raise the activity of labile C-degradation genes and enzymes, which cause more CO2 to be released and labile carbon to be broken down more quickly [25,26]. This decrease in microbial activity and respiration rates reduces labile carbon content in soil, causing soil acidification and altering microbial community composition. Reducing nitrogen application can also cause soil acidification, which reduces bacterial biomass and affects the stability of the labile carbon pool [27,28]. For this study, it is crucial to utilize the fine carbon fraction (FF) in soil, as it is a stable carbon fraction associated with fine particles such as silt and clay [29,30], and it stabilizes organic carbon, influences soil fertility, and enhances carbon storage capacity [31,32,33]. When nitrogen is added, mineral-associated organic matter slowly changes into fine particulate organic matter (POM), and the carbon content of fine POM changes in response to nitrogen additions [34]. Adding nitrogen raises SOC in fine soil fractions, such as free light fractions and mineral-associated fractions, which facilitates the overall build-up of SOC [35]. Conversely, the carbon content in the FF influences the reduction in N additions.
The availability of labile carbon supports the mineralization or priming of soil organic matter (SOM), with soils differing in the extent to which labile C stimulates priming [36]. The availability of nutrients also plays a significant role in this process; NO3 accelerates organic matter decomposition, while NH4+ has distinct effects [37]. Adding nitrate lowers soil enzyme activities, but adding ammonium can increase these activities, affecting the soil organic carbon (SOC) stability [38]. Ammonium-based fertilization reduces mineralization and nitrification rates, which are positively correlated with SOC and total nitrogen concentration [39]. Labile carbon and phosphorus significantly impact soil organic carbon (SOC) [40]; indeed, labile C, like glucose, has a priming effect that makes SOC minerals form more quickly [34,35], and this property is especially true in the subsoil. P, on the other hand, accelerates SOC mineralization by making microbes work harder [41,42]. Labile C and P can have a significant effect on SOC mineralization [43,44], and P can encourage mineralization in tropical forest soils, while N can prevent priming [45]. K fertilization can significantly increase carbon sequestration in cropland soils, benefiting both corn and wheat production [46].
This study investigated how N fertilization affects the soil analyses of cash crops by comparing typical farmer practices, as well as the different types of soil carbon, including labile and stable soil carbon. Our study also examined the availability of plant nutrients and presented the ratio of labile carbon to the final impacted soil carbon in arable soil. We hypothesized that a decreased amount of the synthesis fertilizer by an SSNM recommendation would not impact nitrogen availability and would not lead to any impacts in soil organic carbon (SOC). The goal of this study was to evaluate how the proposed SSNM’s reduction in nitrogen addition leads to changes in soil carbon fraction content and SOC in arable soil.
Understanding how organic carbon fraction content changes with reduced nitrogen fertilizer is critical for managing soil health, optimizing crop production, and mitigating climate change through, for example, carbon storage in soil. These revisions provide a more precise focus and structure for this study.

2. Materials and Methods

This experiment was conducted between February 2022 and December 2023. The experimental plots were located in Chiang Mai, Lamphun, and Lampang provinces in upper Northern Thailand. First, by interviewing the plot experiment’s owner, we gathered information about individual plots’ soil practices. The experimental plots included seven crops: litchi (Litchi chinensis L.) (20 years old), mango (Mangifera indica) (20 years old), banana (Musa sapientum) (2, 3, and 5 years old), maize (Zea mays), cabbage (Brassica oleracea) (20 years old), garlic (Allium sativum) (41 and 17 years old), and paddy rice (Oryza sativa) (36 years old). Their land-use age ranged from 3 to 41 years old, and before the new crop season, most farmers left straw and stubble on the field and plowed it. Small machinery was regularly used to perform tillage, roughly twice before planting. After crop harvesting, the crop residues remained in the fields until the new crop season. This study investigated how the synthetic fertilizer suggestions from a soil analysis replaced the way farmers used to fertilize crops during a single season, which caused the N levels in the experiment plots to drop.
We initially conducted a random sampling of the soil from the designated farmer plot to assess the soil organic matter, available phosphorus, and exchangeable potassium for fertilizer recommendations from the Department of Agriculture. Subsequently, the designated plot experiment only compared the nitrogen levels resulting from farmers’ nitrogen inputs, which were above the nitrogen levels from SSNM. We applied all management techniques, such as soil preparation, planting time, irrigation, and pest and weed control, to the three treatments on a single plot simultaneously and equally often. For every single crop, we used three plants for each individual treatment, started all the practices at the same time, and performed the same farmer practices, except for fertilizer input. The soil analysis values determined the nitrogen application, but the chosen plots showed lower nitrogen levels. We ignored using a farmer’s plot if its N application fell lower than the soil analysis recommendation and established control plots of identical dimensions in the same location.
Treatment Allocation: This experiment included three different fertilizer application patterns, namely, the following: (1) applying fertilizer in accordance with recommendations based on soil analysis results (FS), (2) applying fertilizer in accordance with farmers’ practices (FP), and (3) applying no fertilizer at all (FZ), all of which were replicated three times. The number of soil samples for each plot treatment was then 42, and the total number of soil samples for all treatments was 126. These experiments were applied to individual crops, as mentioned earlier, and we therefore applied three different amounts of synthetic fertilizer to a single crop in this experiment. The lone crop was planted, managed, and harvested in a typical amount of time, alongside farmer practices. Additional management procedures, such as pesticide treatment and irrigation, were completed in compliance with customary practices in the area. We emphasized and compared N additions via farmer practices (FPs) and N recommendations based on soil analysis (FS) and found that FS practices decreased the amounts of N added. Therefore, in this study, we extracted the amounts of P2O5 and K2O from our treatments, but we also determined the amounts of P2O5 and K2O for each individual crop (Table 1). We set up the experiment utilizing farmer plots with sampled individual plots before applying fertilization treatments. At the same time, in addition to farmer practices (FPs), we planted our own maize, cabbage, garlic, and paddy rice for FS. In the meantime, we experimented with the farmer’s plants for litchi, mango, and banana, but we adjusted the synthetic fertilizer dosage for FS based on soil analysis. We conducted this study using three treatments and three replications, all within the same plot (owned by the same individual), and, then, we applied the same treatments to more than two to four plots (owners) of the same type of plant. A gathering and summary of the owner’s plot interview determines the type of fertilizer used for FP. The interviews with individual plot owners provided information on fertilization practices, such as the type of synthetic fertilizer, timing, and quantity of application. We then converted these data into amounts of N, P2O5, and K2O per crop (Table 1). The fertilization recommendation via soil analysis in Thailand is as follows: Based on the soil test results, specific fertilizer formulas can be recommended, including the choice between organic and inorganic fertilizers. For specific recommendations, it is advisable to consult local agricultural extension services or conduct soil testing through certified laboratories to obtain tailored advice based on current soil conditions and crop requirements. Farmers can also determine the timing and method of application to maximize nutrient uptake by crops [47]. According to FS treatment recommendations, this fertilizer formula is normally used because it can provide complete N, P2O5, and K2O in accordance with the SSNM concept. This research identifies the kinds of synthetic fertilizers often used in SSNM and FS treatment: urea functions as a nitrogen supply, diammonium phosphate (DAP) supplies both nitrogen and phosphorus, and potassium chloride, referred to as muriate of potash, acts as the potassium source (Table 1).

2.1. Soil Sampling and Property Analysis

After harvesting each crop, we obtained soil samples that were indicative of replication. At soil depths of 0–30 cm, an auger was used to drill the soil from a few representative samples. We then brought the soil samples back for air drying and screening, preparing them for chemical and physical examination, and we stored the freshly separated soils at 4 °C until analysis. Due to the absence of fresh soil samples from FZ, the results for phosphorus by malachite green and nitrate (NO3) could not be obtained.

2.2. Methodology for of Soil Carbon Fraction Pools

Total organic carbon (TOC): the amount of total organic carbon (TOC) in the soil by sieving 2 mm of dry soil mixed with H2SO4 and K2Cr2O7, heating it to 130 °C for 30 min, and then letting the mixture sit overnight [48]. We then used the FeSO4 solution to titrate it, following the process described in [49].
Carbon in the fine fraction (FF, < 0.4 mm) in soil: The soil samples were air dried, crushed, and separated from plant material using a 2 mm sieve. Large pieces of coarse material were removed, and the dry sieving/winnowing procedure was used to remove light fraction organic material. The residual organic matter in the soil post-process, together with carbon, was designated as fine-fraction soil organic matter (FF < 0.4 mm), believed to contribute to the more stable, slowly decomposing pool of soil organic matter [50]. Dry soil (FF < 0.4 mm) of individual samples was then mixed with H2SO4 and K2Cr2O7, heated to 130 °C for 30 min, and allowed to sit overnight [43]. We then used the FeSO4 solution for titration, following the instructions in [44].
The P malachite green method as P(M): We used the malachite method to extract a solution to determine its P content. To determine the phosphorus content in fresh soil, we mixed a solution of sulfuric acid and ammonium molybdate tetrahydrate with a solution of green malachite green and polyvinyl alcohol. We then measured the absorbance at a wavelength of 630 nm after 30 min [51] using a spectrophotometer with double beam light sources (Thermo spectronic genesys 20, Waltham, MA, USA).
The Bray (II) method as P (B) in soil is as follows: The Bray method involves using a solution of 0.1 M HCl and 0.03 M NH4F to extract phosphorus from the soil, and the extraction time in this study was 60 s. Adequate levels of ammonium, molybdate, boric acid and ascorbic acid then developed a blue color for the P concentration [52], examined via an 880 nm spectrophotometer (Thermo spectronic genesys 20, USA).
NH4+ and NO3 in soil: We analyzed the dried and fresh soil samples for NH4+ and NO3 content. We then determined the amounts of NH4+ and NO3 using established procedures and spectrophotometers set at 520 nm and 420 nm, respectively [53]. An easy way to measure NH4+ is by looking at the color that forms when ammonium, a chlorine source, and a slightly acidic mixture of Na salicylate react; i.e., Na-nitroprusside intensifies the green hue [54]. We extracted NO3 from soil samples using potassium sulfate at a concentration of 0.5 M. The soil’s NO3 underwent a reaction with salicylic acid and concentrated sulfonic acid. We determined the NH4+ and NO3 using a spectrophotometer (Thermo spectronic genesys 20, USA).
The permanganate-oxidizable carbon (POXC): We modified the Weil et al. [55] method to extract the permanganate-oxidizable carbon (POXC), also known as active carbon, and then tested it. In a 50 mL centrifuge tube, we placed 3 g of air-dried soil and passed it through a 0.5 mm sieve with 20 mL of 0.02 M KMnO4. We vigorously shook the tubes for 30 min at a rate of 120 revolutions per minute using a reciprocation shaker (HERMEL, Gosheim, Germany) and then left them to facilitate the progression of the oxidation process and the setting of particulate matter via centrifuge (HERMEL Z 206 A, Germany) for 5 min. Afterwards, we transferred 0.1 mL of the sample solution from the tube to another tube containing 9.9 mL of demineralized water to stop the reaction. We used the spectrophotometer (Cecil Aurius Series CE 2021, Peterborough, UK) to measure each sample’s absorbance at 550 nm and calculated the POXC (mg kg−1 soil) accordingly.
POXC = [0.02 (mol L−1) − (a+ b Abs)] × (9000 mg C mol−1) × (0.02 L solution Wt−1(kg))
The KMnO4 solution, starting at 0.02 mol L−1, oxidizes nine thousand milligrams of carbon, reducing Mn7+ to Mn4+, with soil used in the reaction measured in kilograms (kg).
Passive_C = TOC-active carbon (POXC) (g kg−1)
Different concentrations of H2SO4 were used to chemically oxidize carbon fractions for carbon fractionation methods.
To obtain the oxidizable carbon fractions, we adjusted the method used by [56]. Using potassium dichromate to oxidize organic materials in an acidic solution, we determined C [57,58]. We did not need to heat the solution from the outside, and we employed various concentrations of H2SO4 [58]. The dichromate concentration did not change, although the H2SO4 concentration increased to its maximum of 6 and 9 mol L−1, which, according to Chan et al. [56], represents 6 N and 9 N H2SO4, respectively. According to Equations (3) and (4), these ratios represent extremely labile carbon fractions (LB_C) and less labile carbon fractions (LLB_C). The amount of organic carbon that was oxidized at each concentration was split into three parts, each with a different susceptibility level: Lastly, we subtracted the total of Equations (3) (LB_C) and (4) (LLB_C) from the TOC pool in Equation (5) to obtain the non-labile C pool.
LB_C (very labile C fraction) = organic C oxidizable under 6 N H2SO4
LLB_C (less labile C) = 9 N − 6 N H2SO4 oxidizable C
RC_C (recalcitrant C) is equal to TOC-(LB_C+LLB_C) oxidizable carbon
Exchangeable K+: We added dried soil samples using 1 N NH4AOC pH 7. After one hour of shaking and filtering, we measured the soil aliquot using an atomic adsorption spectrophotometer (SavantAA GBC, Keysborough, VIC, Australia).

2.3. Calculations and Data Analysis

We performed statistical analyses using Excel 2019 and JASP Version 4, using a one-way analysis of variance (ANOVA) to determine how different fertilization methods affected nutrients, carbon fractions, and the ratio of labile C fraction to nutrient. We used the LLB_C (mg kg−1)/nutrient (mg kg−1) ratio (without unit). To determine the effect size for carbon fractions, we used eta-squared (ƞ2): The one-way ANOVA statistic shows how well nutrients, carbon fractions, and the ratio of labile fraction to nutrient content account for all fertilizer practices. We compared the results to both the Tukey HSD method and the reported format of homogenous groups and then presented the average and standard error for the evaluation of the results. To create the graphs, the differences in the heatmaps were considered significant at p < 0.05, <0.01, and <0.001. JASP Version 4 also calculated and displayed the heatmap of Spearman’s rho correlation coefficient in the matrix.

3. Results

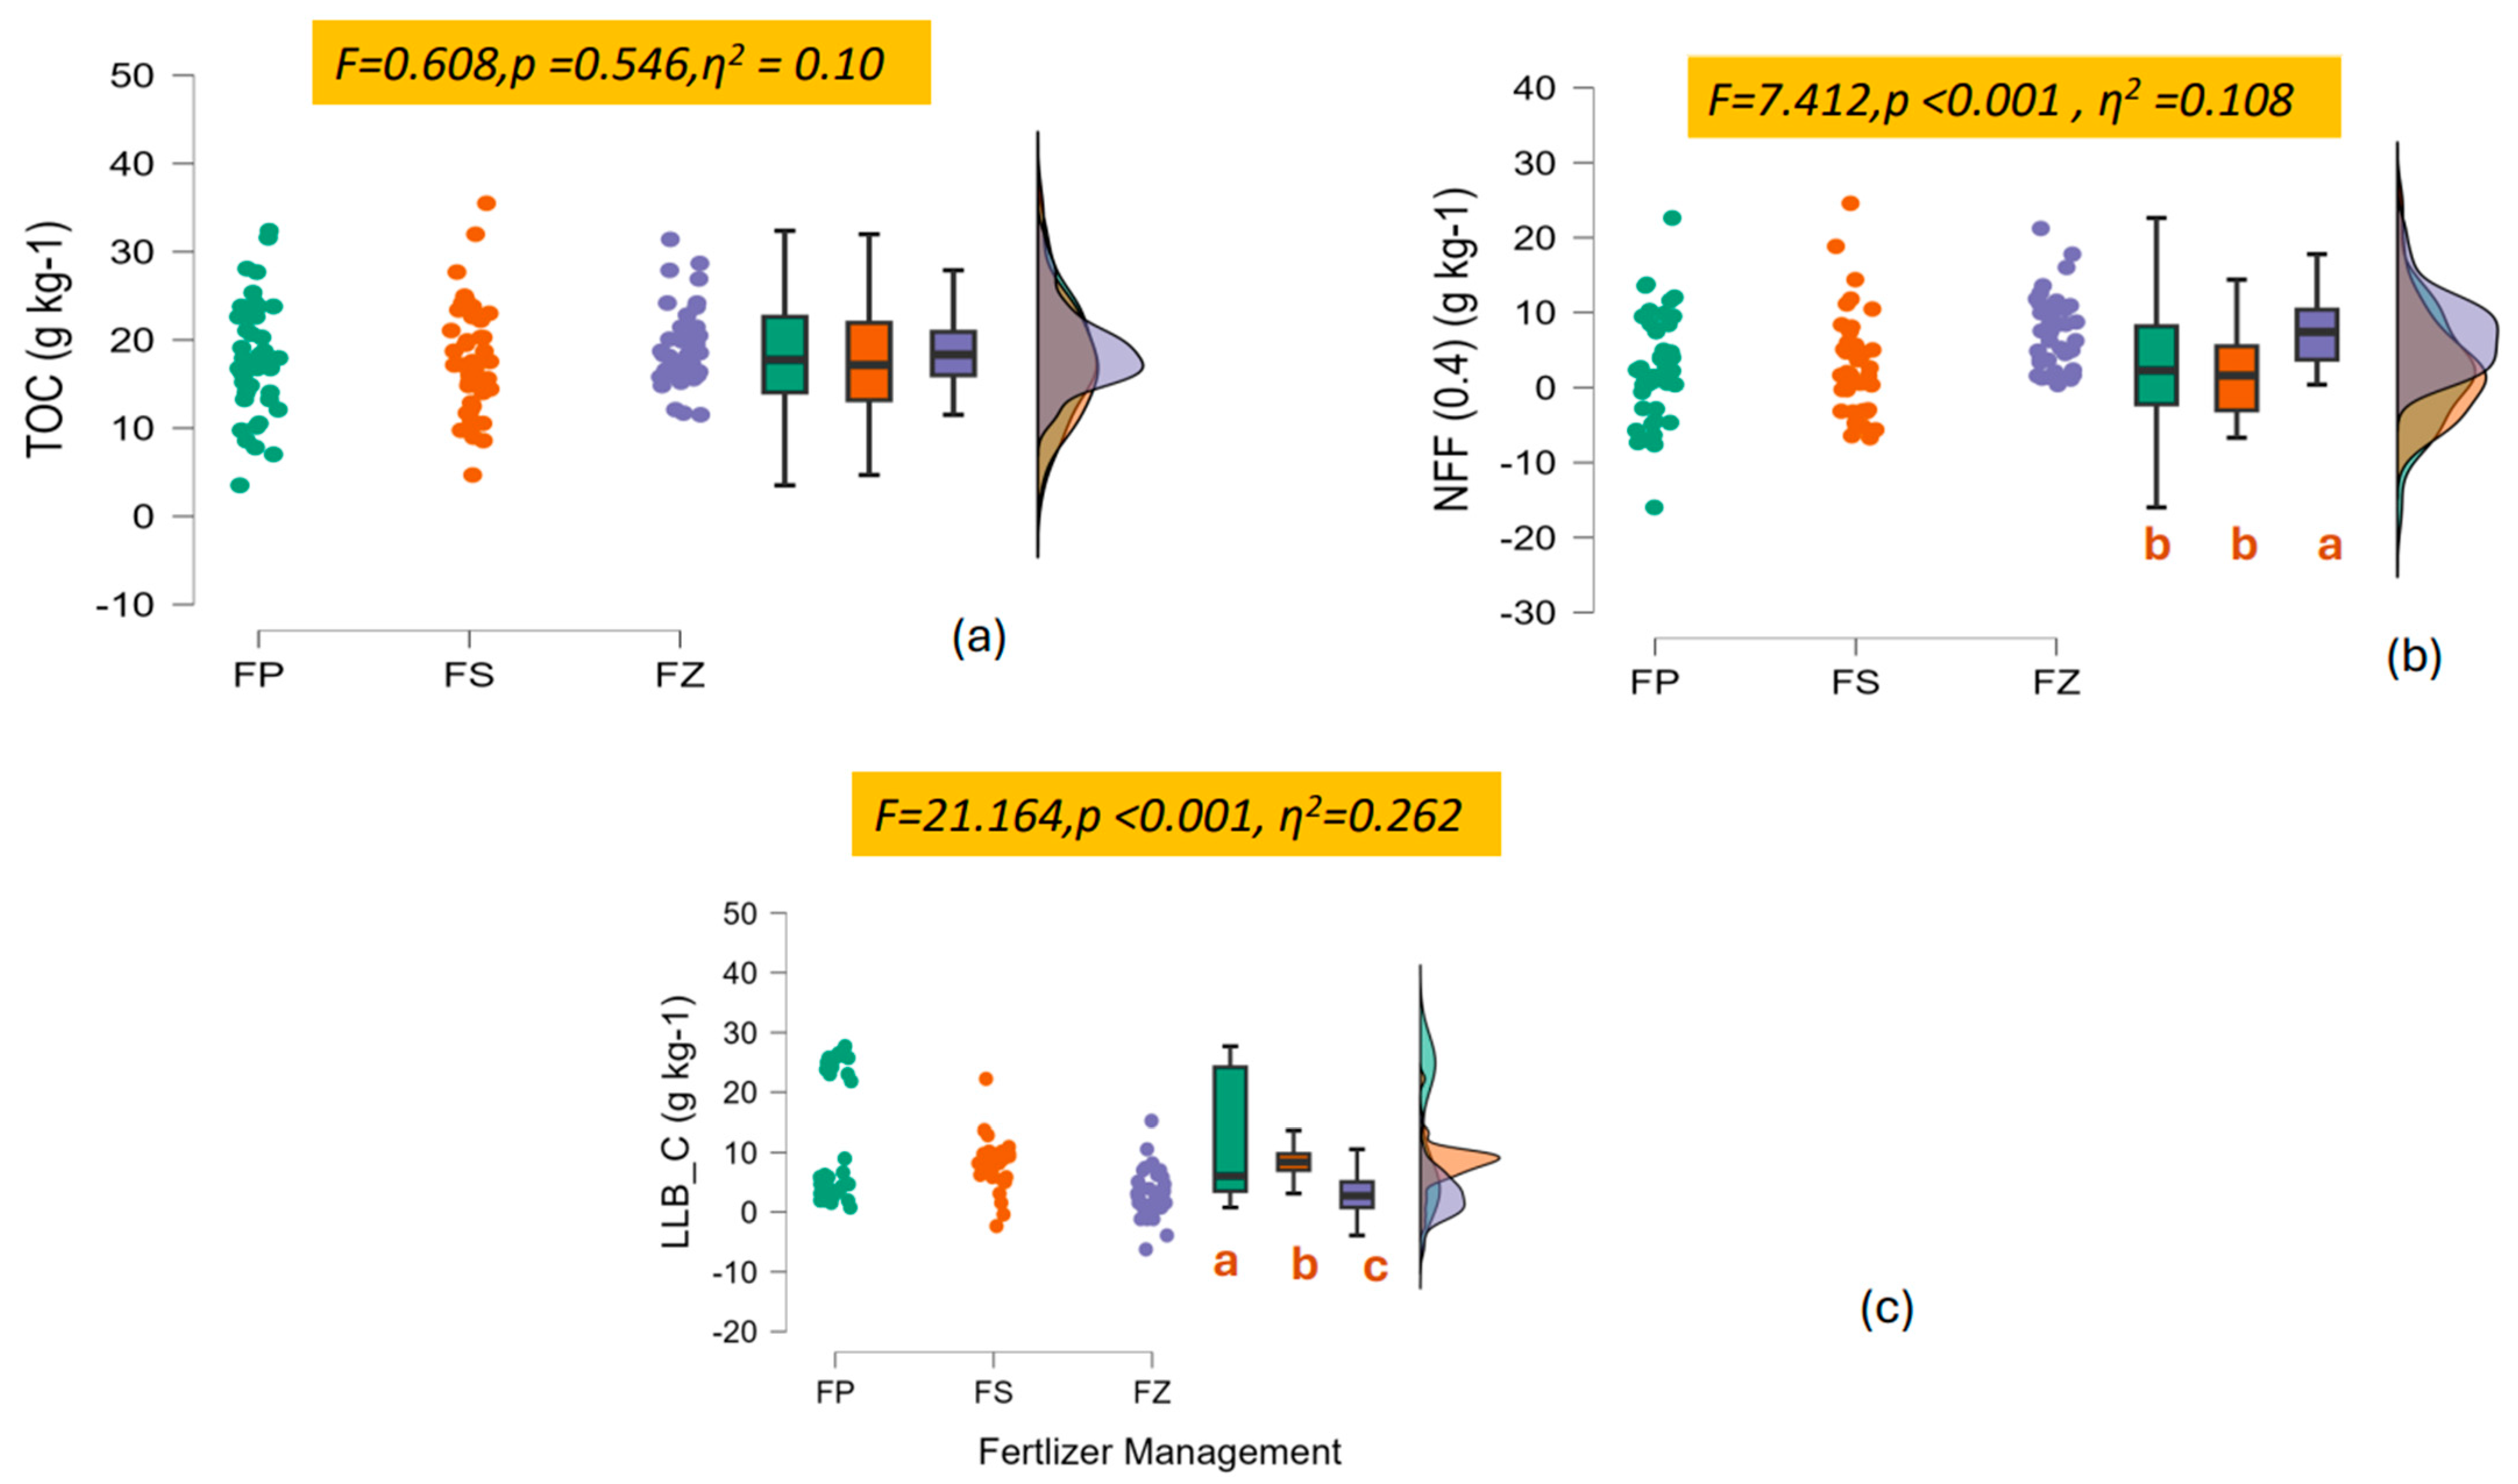
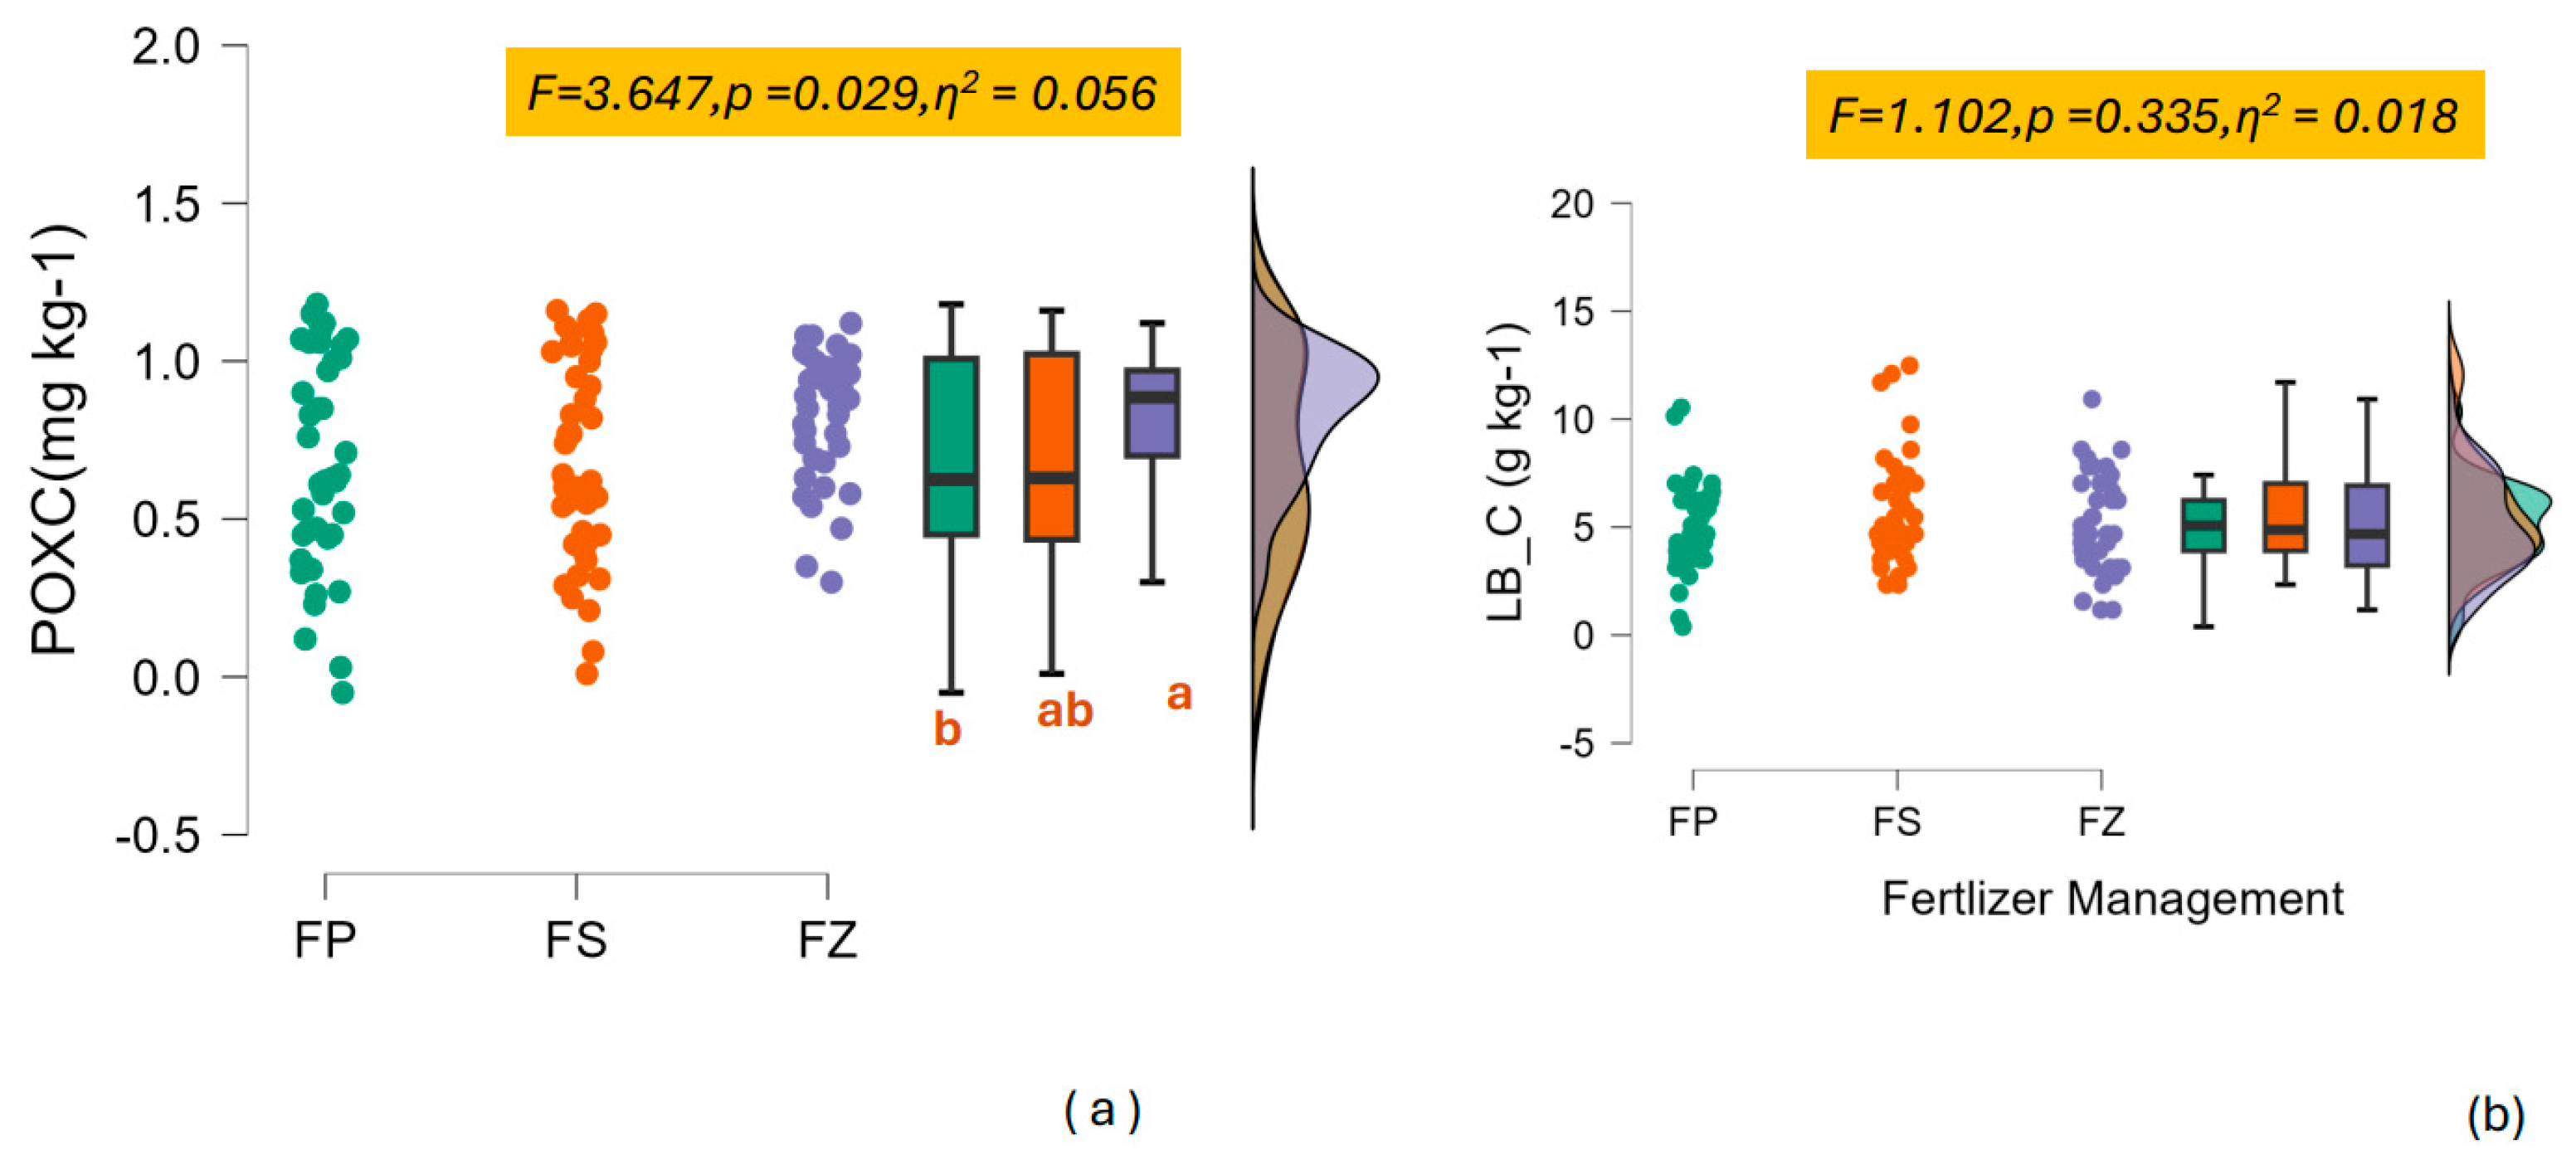
3.1. The Decrease in N Addition Impacts the Carbon Fractions

Our study on the effects of a nitrogen (N) dose reduction on carbon fractions revealed the following significant findings. TOC: There were FP (18.042 ± 1.007 g kg−1), FS (17.717 ± 0.98 g kg−1), and FZ (19.064 ± 0.68 g kg−1) values that did not differ significantly (F = 0.608, p = 0.546, ƞ2 = 0.100) (Figure 1a). However, in the FS variant, the TOC showed a decreasing trend. NFF: A statistically significant difference was observed, showing that FP (2.609 ± 1.124 g kg−1), FS (2.686 ± 1.046 g kg−1), and FZ (7.29 ± 0.742 g kg−1) significantly affect changes in this fraction (Figure 1b). LLB_C under FP, FS, and FZ consistently showed values of 12.889 ± 1.639, 8.153 ± 0.582, and 2.930 ± 0.606 g kg−1, respectively (Figure 1c). In this research, the carbon fractions, especially the reduced LLB_C, decreased very quickly in long-term arable soils that were switched to reduced nitrogen (FS and FZ).
There was a statistically significant difference in POXC, and FP, FS, and FZ treatments exhibited values of 0.676 ± 0.052, 0.688 ± 0.050, and 0.832 ± 0.031 mg kg−1, respectively (Figure 2a). Instead, LB_C did not change significantly, which means that reducing the nitrogen dose does not have a significant impact on this faction (FP = 5.107 ± 0.315, FS = 5.683 ± 0.391, and FZ = 4.986 ± 0.354 g kg−1) (Figure 2b). Therefore, in this study, the labile carbon fractions, especially the increase in POXC content, might change very quickly in long-term arable soils that were switched to no additional nitrogen fertilizer (i.e., FZ). However, LB_C did not change.
For RC_C, there was a statistically significant difference between FP (0.046 ± 1.942 g kg−1), FS (3.883 ± 0.744 g kg−1), and FZ (11.225 ± 0.673 g kg−1) values (Figure 3a). Meanwhile, for the FF, there was a statistically significant difference between the FP (15.434 ± 0.729 g kg−1), FS (15.031 ± 0.655 g kg−1), and FZ (11.774 ± 0.621 g kg−1) values (Figure 3b). We did not find any statistically significant differences in passive carbon between FP (18.041 ± 1.007 g kg−1), FS (17.716 ± 0.979 g kg−1), and FZ (18.096 ± 0.680 g kg−1) values (Figure 3c). This finding suggests that decreasing the N addition causes FF, and particularly FZ, to drop.
For the labile carbon fraction, the NFF increased by 7 and 13% in FS and FZ treatment, respectively. In FS and FZ treatment, respectively, the POXC content grew by 2 and 23%. LB_C and LLB_C in FS treatment decreased by 2 and 37%, respectively, compared to the mean of FP, while the LLB_C dramatically decreased by 77% in FZ. In this study, the reduced N addition resulted in a decrease in FF, LLB_C, and LB_C, and we can rank the effect size in the following order: FF > LLB_C > LB_C. However, POXC (Figure 2) and NFF (Figure 1) increased in this order: POXC > NFF. Figure 3 ranks the effect size as FF > passive_C, but it excludes RC_C. These findings show the amount of N reduction that needs to be considered, along with the different responses of stable carbon fractions, especially the FF, compared to other carbon fractions, such as labile carbon fractions (LLB_C).

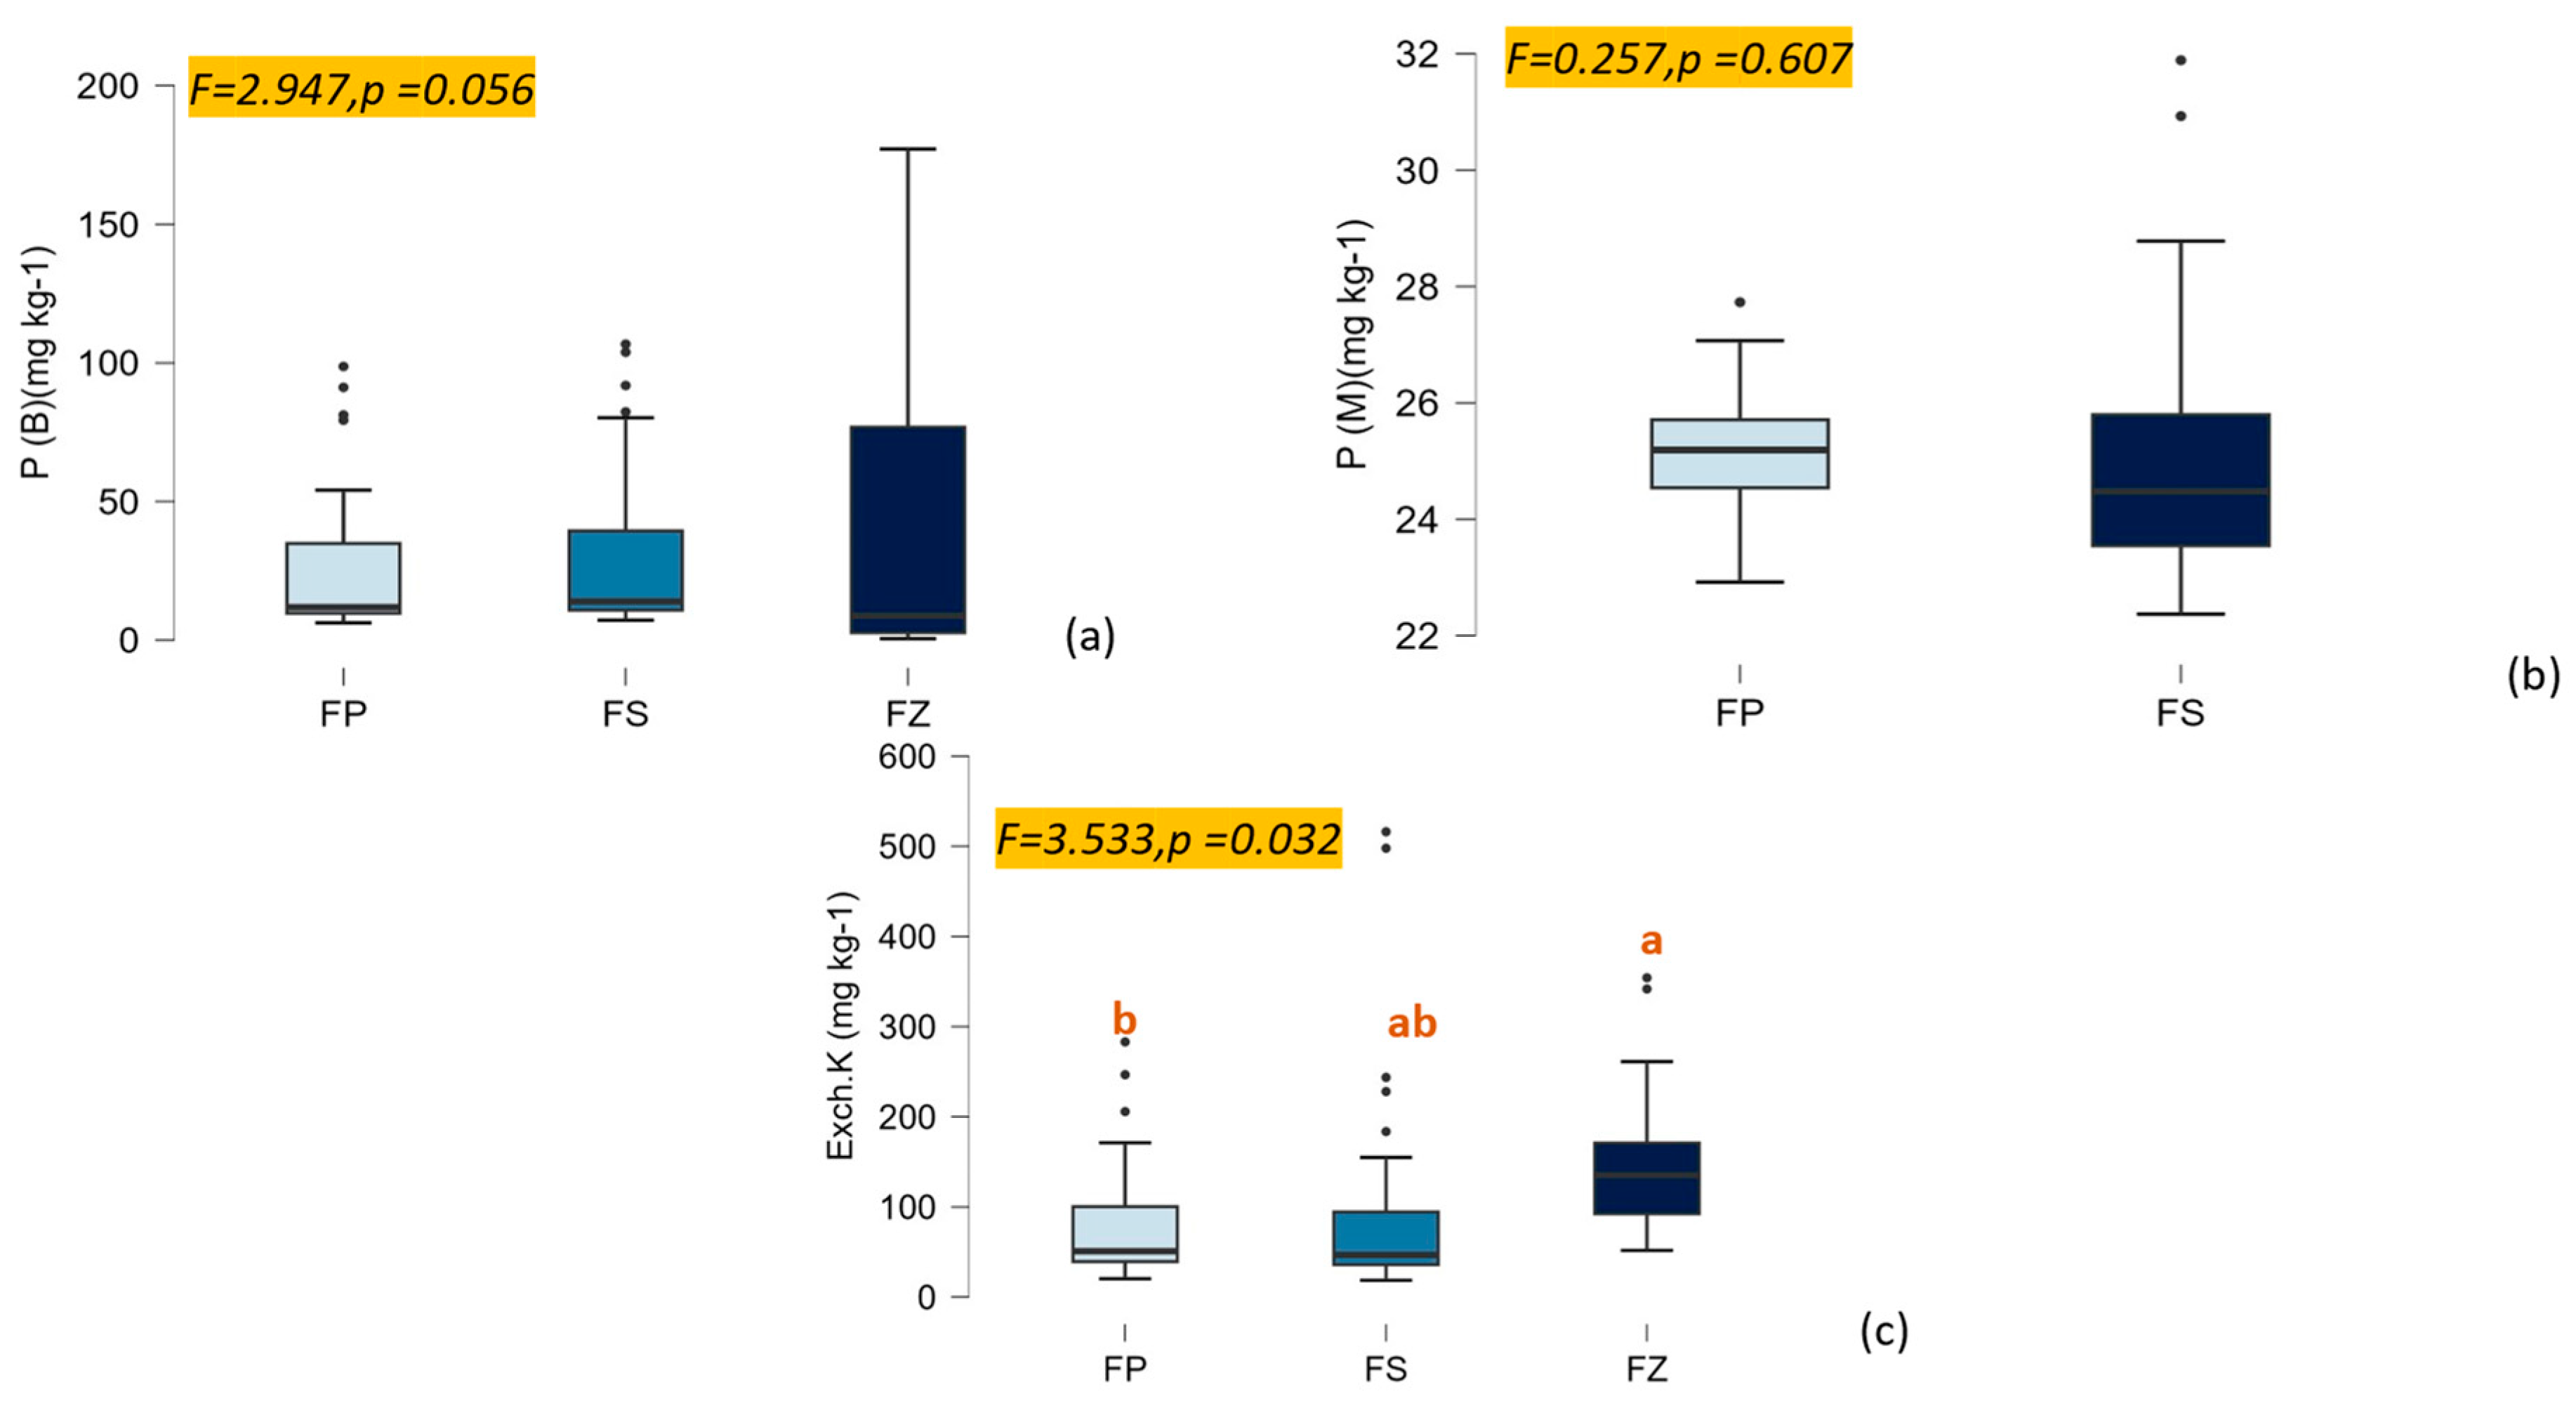
3.2. The Decrease in N Addition Impacts the Availability of NPK in Soil

Phosphorus content was determined via the Bray II Method (P(B)): There was not a statistically significant difference in phosphorus (P) content, but the value is close to suggesting a possible effect. FZ (44.142 ± 8.167 mg kg−1) had a higher average than FP (25.238 ± 3.81 mg kg−1) and FS (29.619 ± 8.167 mg kg−1) (Figure 4a).
Phosphorus content was determined via the Malachite Method (P(M)): We did not find any statistically important differences between FP (25.392 ± 0.409 mg kg−1) and FS (25.101 ± 0.342 mg kg−1) (Figure 4b), which means that it is not clear how factor adjustments change P(M) levels in this sample (Figure 4b).
The exchangeable potassium (Exch. K): It was found that fertilizer practices had a statistically important effect on the amounts of Exch. K. The K content in FP and FS treatment variants had the lowest averages (96.133 ± 17.669 and 89.361 ± 16.784 mg kg−1), respectively, while FZ had the highest value (142.197 ± 10.387 mg kg−1). This difference suggests that N fertilization may have an effect on the changes in Exch. K levels (Figure 4c). Therefore, the pattern of N additions in long-term arable soils that were switched to reduced nitrogen fertilization had a significant effect on Exch. K but not on P content.
Ammonium in dried soil (NH4+_DS): An important difference was found in the amounts of NH4+-N in dried soil. The results for FP, FS, and FZ were 147.681 ± 7.881, 108.042 ± 4.944, and 77.390 ± 9.381 mg NH4+-N kg−1, respectively. In FP treatment, the average amount of NH4+-N was the highest (Figure 5a).
NH4+-N in soil (NH4+_FS): The amounts of NH4+_FS found were very different according to the N fertilizer management of the experiments, with the variant FP (145.525 ± 6.397 mg kg−1) having the highest average compared to FS (138.146 ± 9.678 mg kg−1) and FZ (77.39 ± 9.381 mg kg −1) (Figure 5b). Nitrate from dried soil (NO3_DS): The amounts of nitrate in dried soil (NO3−_DS) were not statistically different between the variants FP (36.577 ± 3.563 mg kg−1), FS (37.280 ± 4.655 mg kg−1), and FZ (42.181 ± 3.164 mg kg−1) (Figure 5c). This finding means that the fertilizer methods that were investigated do not impact the amounts of NO3_DS. Nitrate–Nitrogen in fresh soil (NO3_FS): Statistically significant changes were also observed, with the average FZ (42.198 ± 3.164 mg kg−1) as the lowest, differing markedly from FS (113.198 ± 13.972 mg kg−1) and FP (82.747 ± 4.492 mg kg−1) treatments (Figure 5d). In long-term arable soils that were switched to reduced nitrogen fertilization, the pattern of N additions had a significant effect on the availability of NH4+_DS, NH4+_FS, and NO3_FS, but not on NO3_DS. This finding enables us to draw some conclusions about the reduced NH4+ and NO3, the higher K, and the fact that it did not affect the availability of P in the reduced N additions, such as variants FS and FZ compared to FP.

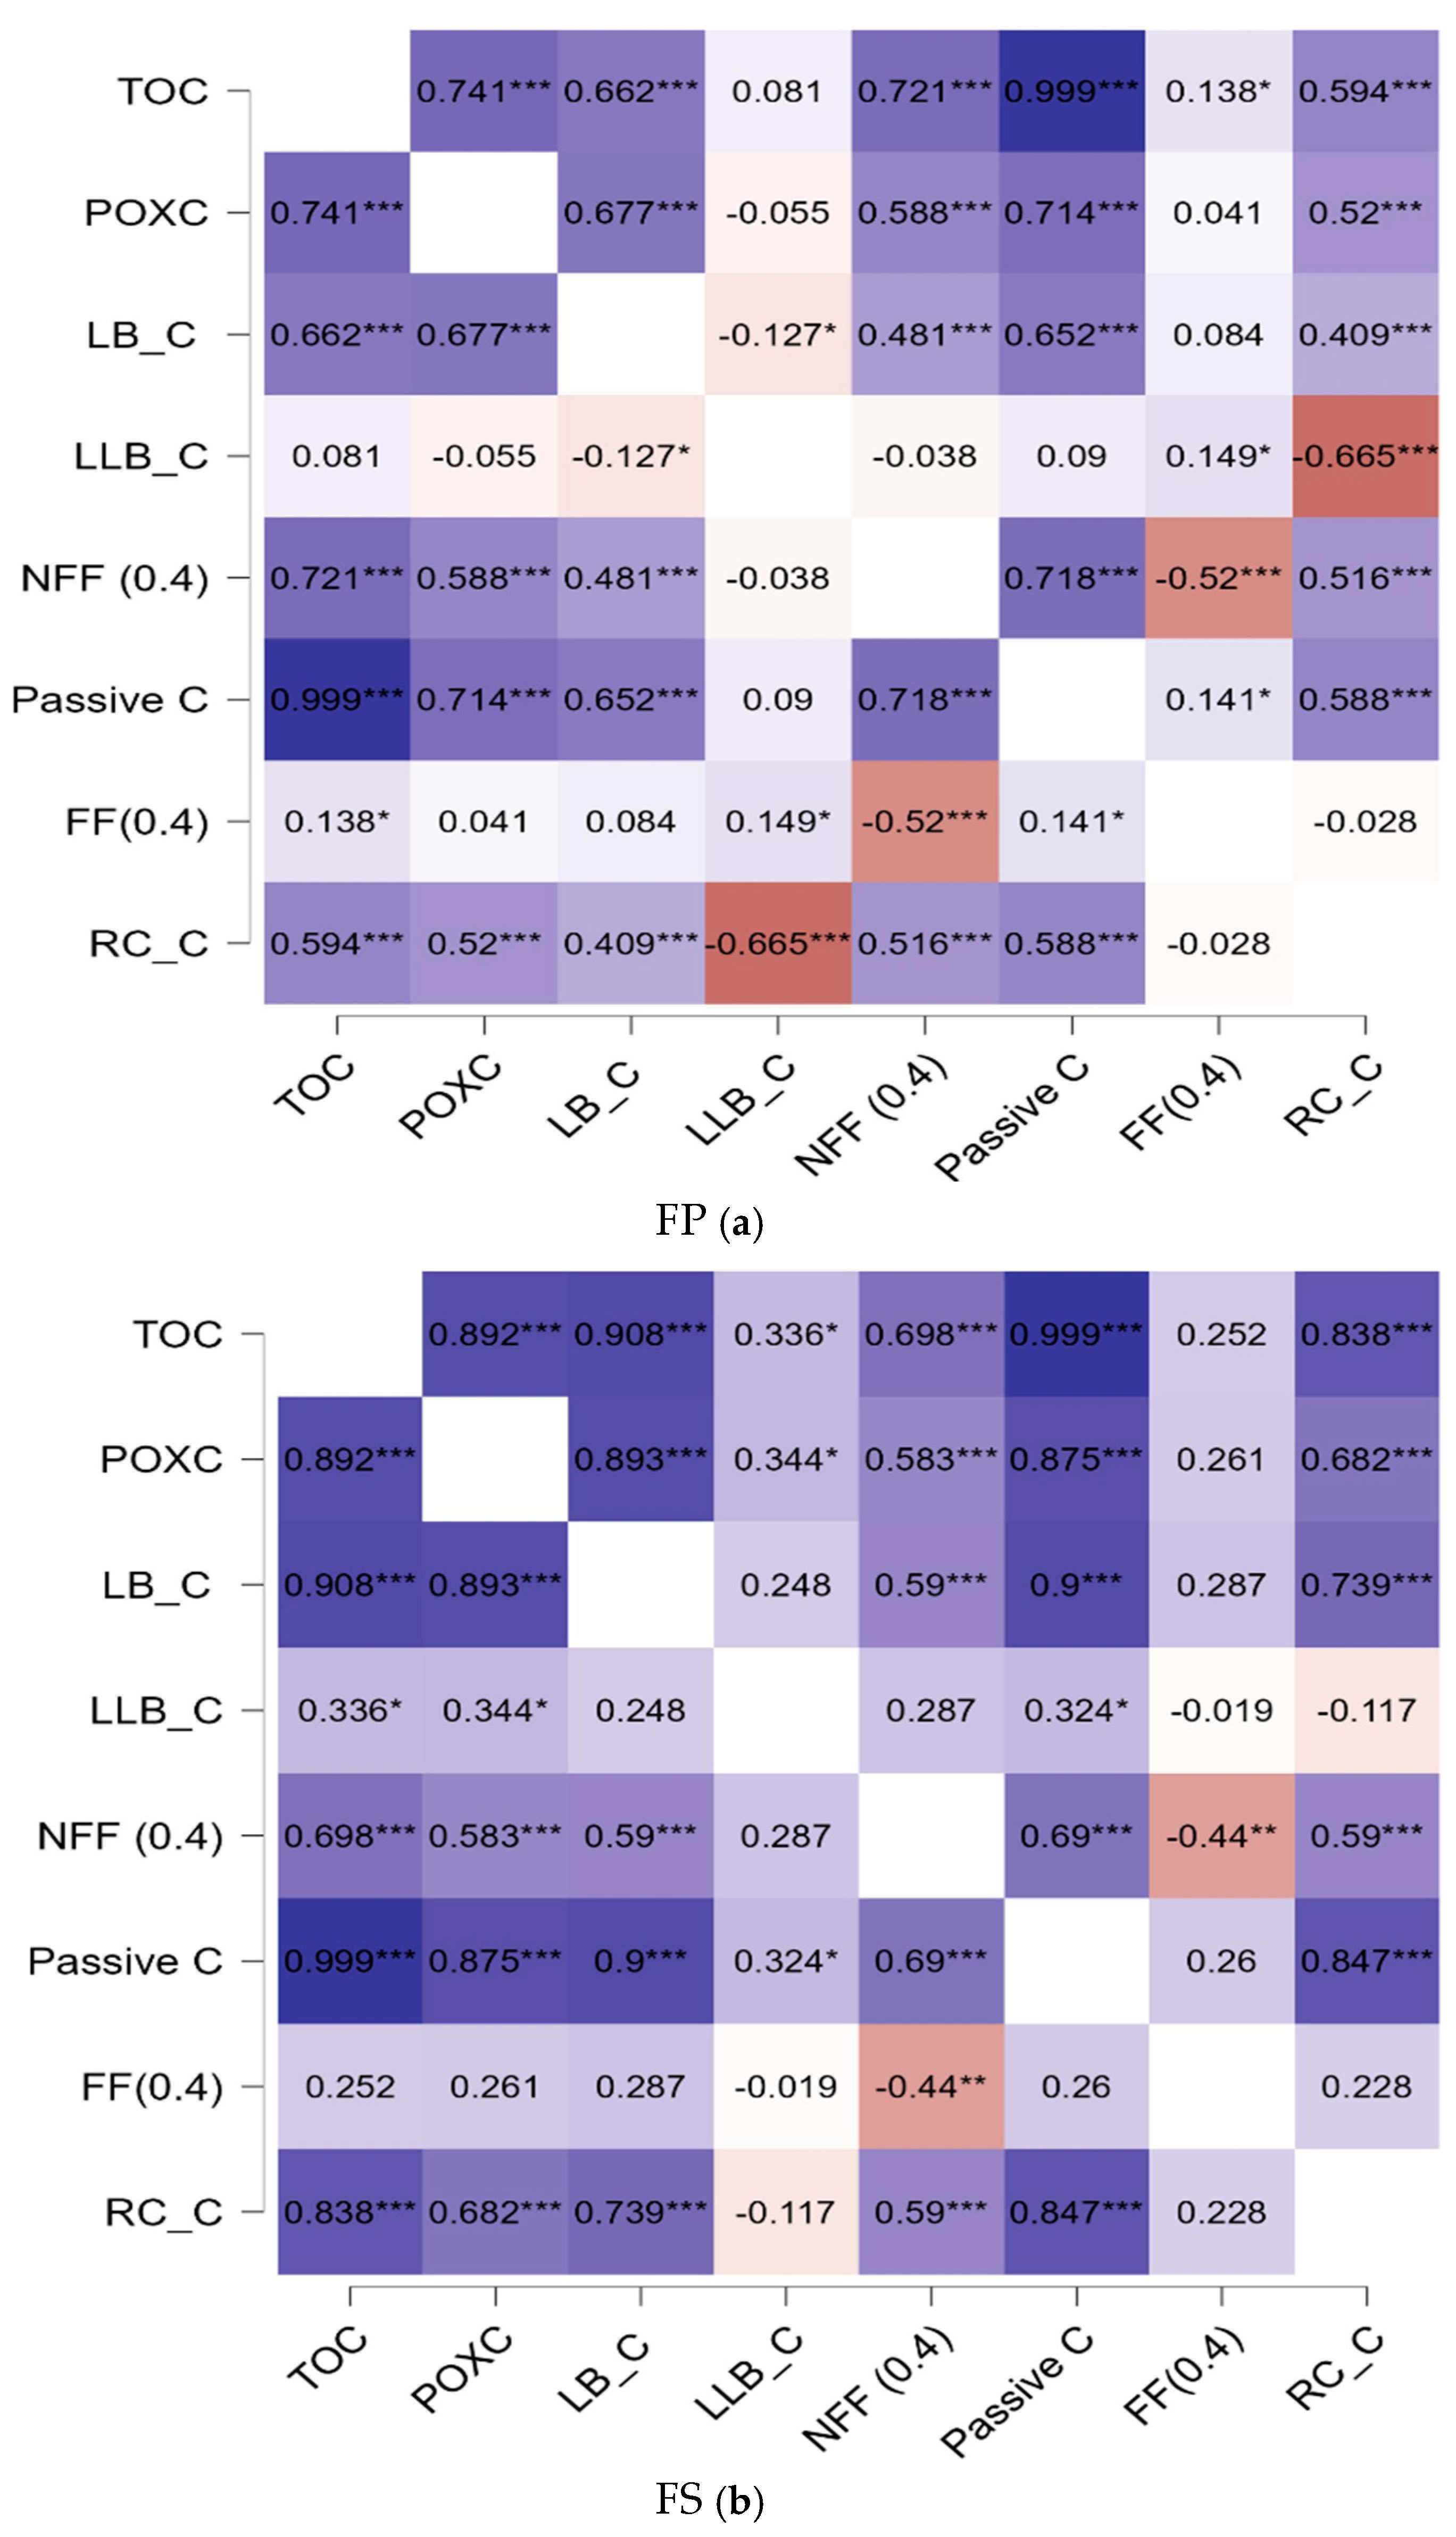
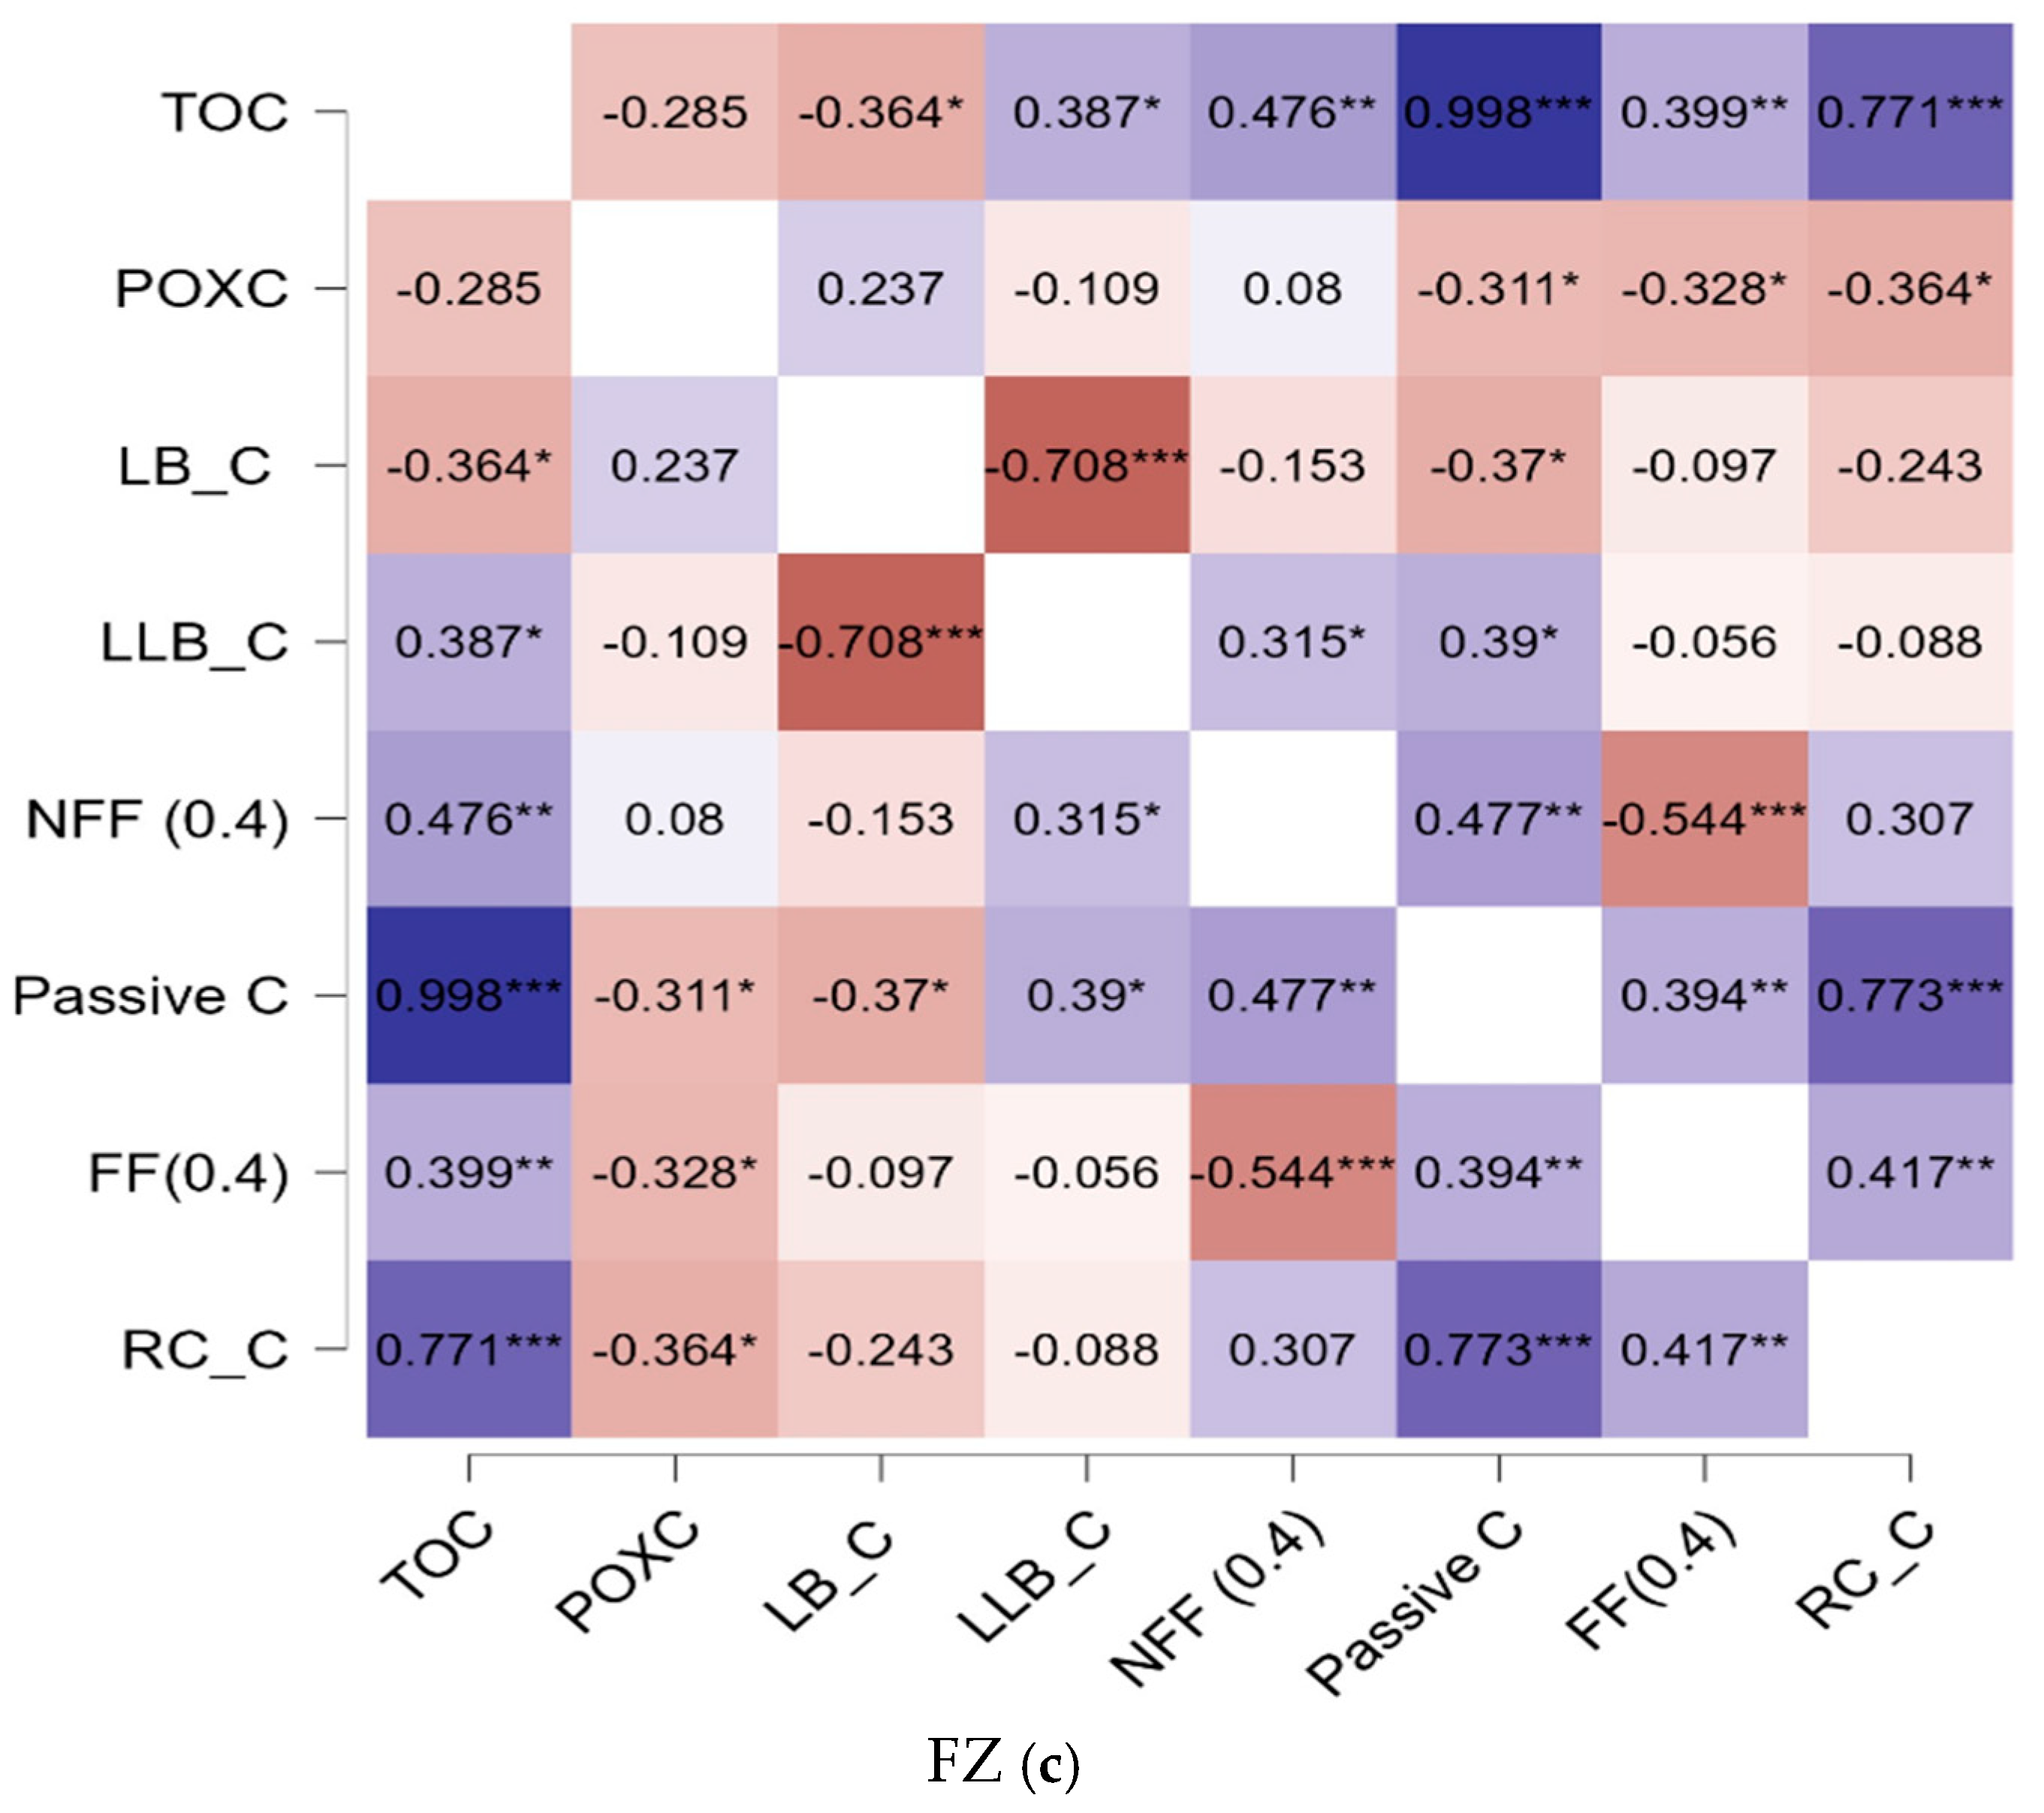
3.3. Relationships Exist Between Carbon Fractions and the Effects of Reducing N in Synthetic Fertilizer on the Dynamics of Soil Carbon

Spearman‘s rho correlation coefficient: We discovered that the independent factors FF (0.038, p = 0.05 *), LB_C (0.662, p = 0.001 ***), Passive C (0.999, p = 0.001 ***), NFF (0.721, p = 0.01 **), RC_C (0.594, p = 0.001 ***), and POXC (0.741, p = 0.001 ***) all had a significantly positive relationship with TOC (dependent variable) for FP. For FS, the dependent factors FF (0.252, ns), LB_C (0.908, p = 0.001 ***), Passive C (0.999, p = 0.001 ***), NFF (0.698, p = 0.001 ***), RC_C (0.838, p = 0.001 ***), POXC (0.892, p = 0.001 ***), and LLB_C (0.336, p = 0.05 *) exhibited a positive relationship with TOC (dependent variable) (Figure 6b). For FZ, LB_C (-0.364, p = 0.05 *), NFF (0.476, p = 0.01 **), FF (0.399, p = 0.01 **), Passive C (0.998, p = 0.001 ***), RC_C (0.771, p = 0.001 ***), and POXC (-0.285, p = ns) were positively correlated with TOC (independent variable) (Figure 6c). An increase in reduced nitrogen inputs, specifically FS and FZ, demonstrated a positive correlation with soil carbon fractions—namely, LLB_C and FF—in relation to TOC, whereas POXC and LB_C exhibited a negative correlation with TOC. LLB_C and the FF in FS and FZ treatment exhibited a downward trend, while an increase in POXC,LB_C correlated with a reduction in TOC content.
Therefore, this study examined the impact of reducing nitrogen in synthetic fertilizer on carbon fractions. The results showed a positive relationship between the non-fine fraction (NFF) and TOC across all fertilization groups (FP, FS, and FZ). This study also found a similar pattern for fine fraction carbon (FF), with increased TOC leading to increased carbon intensity in FP and FS treatment. This study also found a strong link between labile carbon (LB_C) and TOC, with FP and FS showing the most noticeable changes.

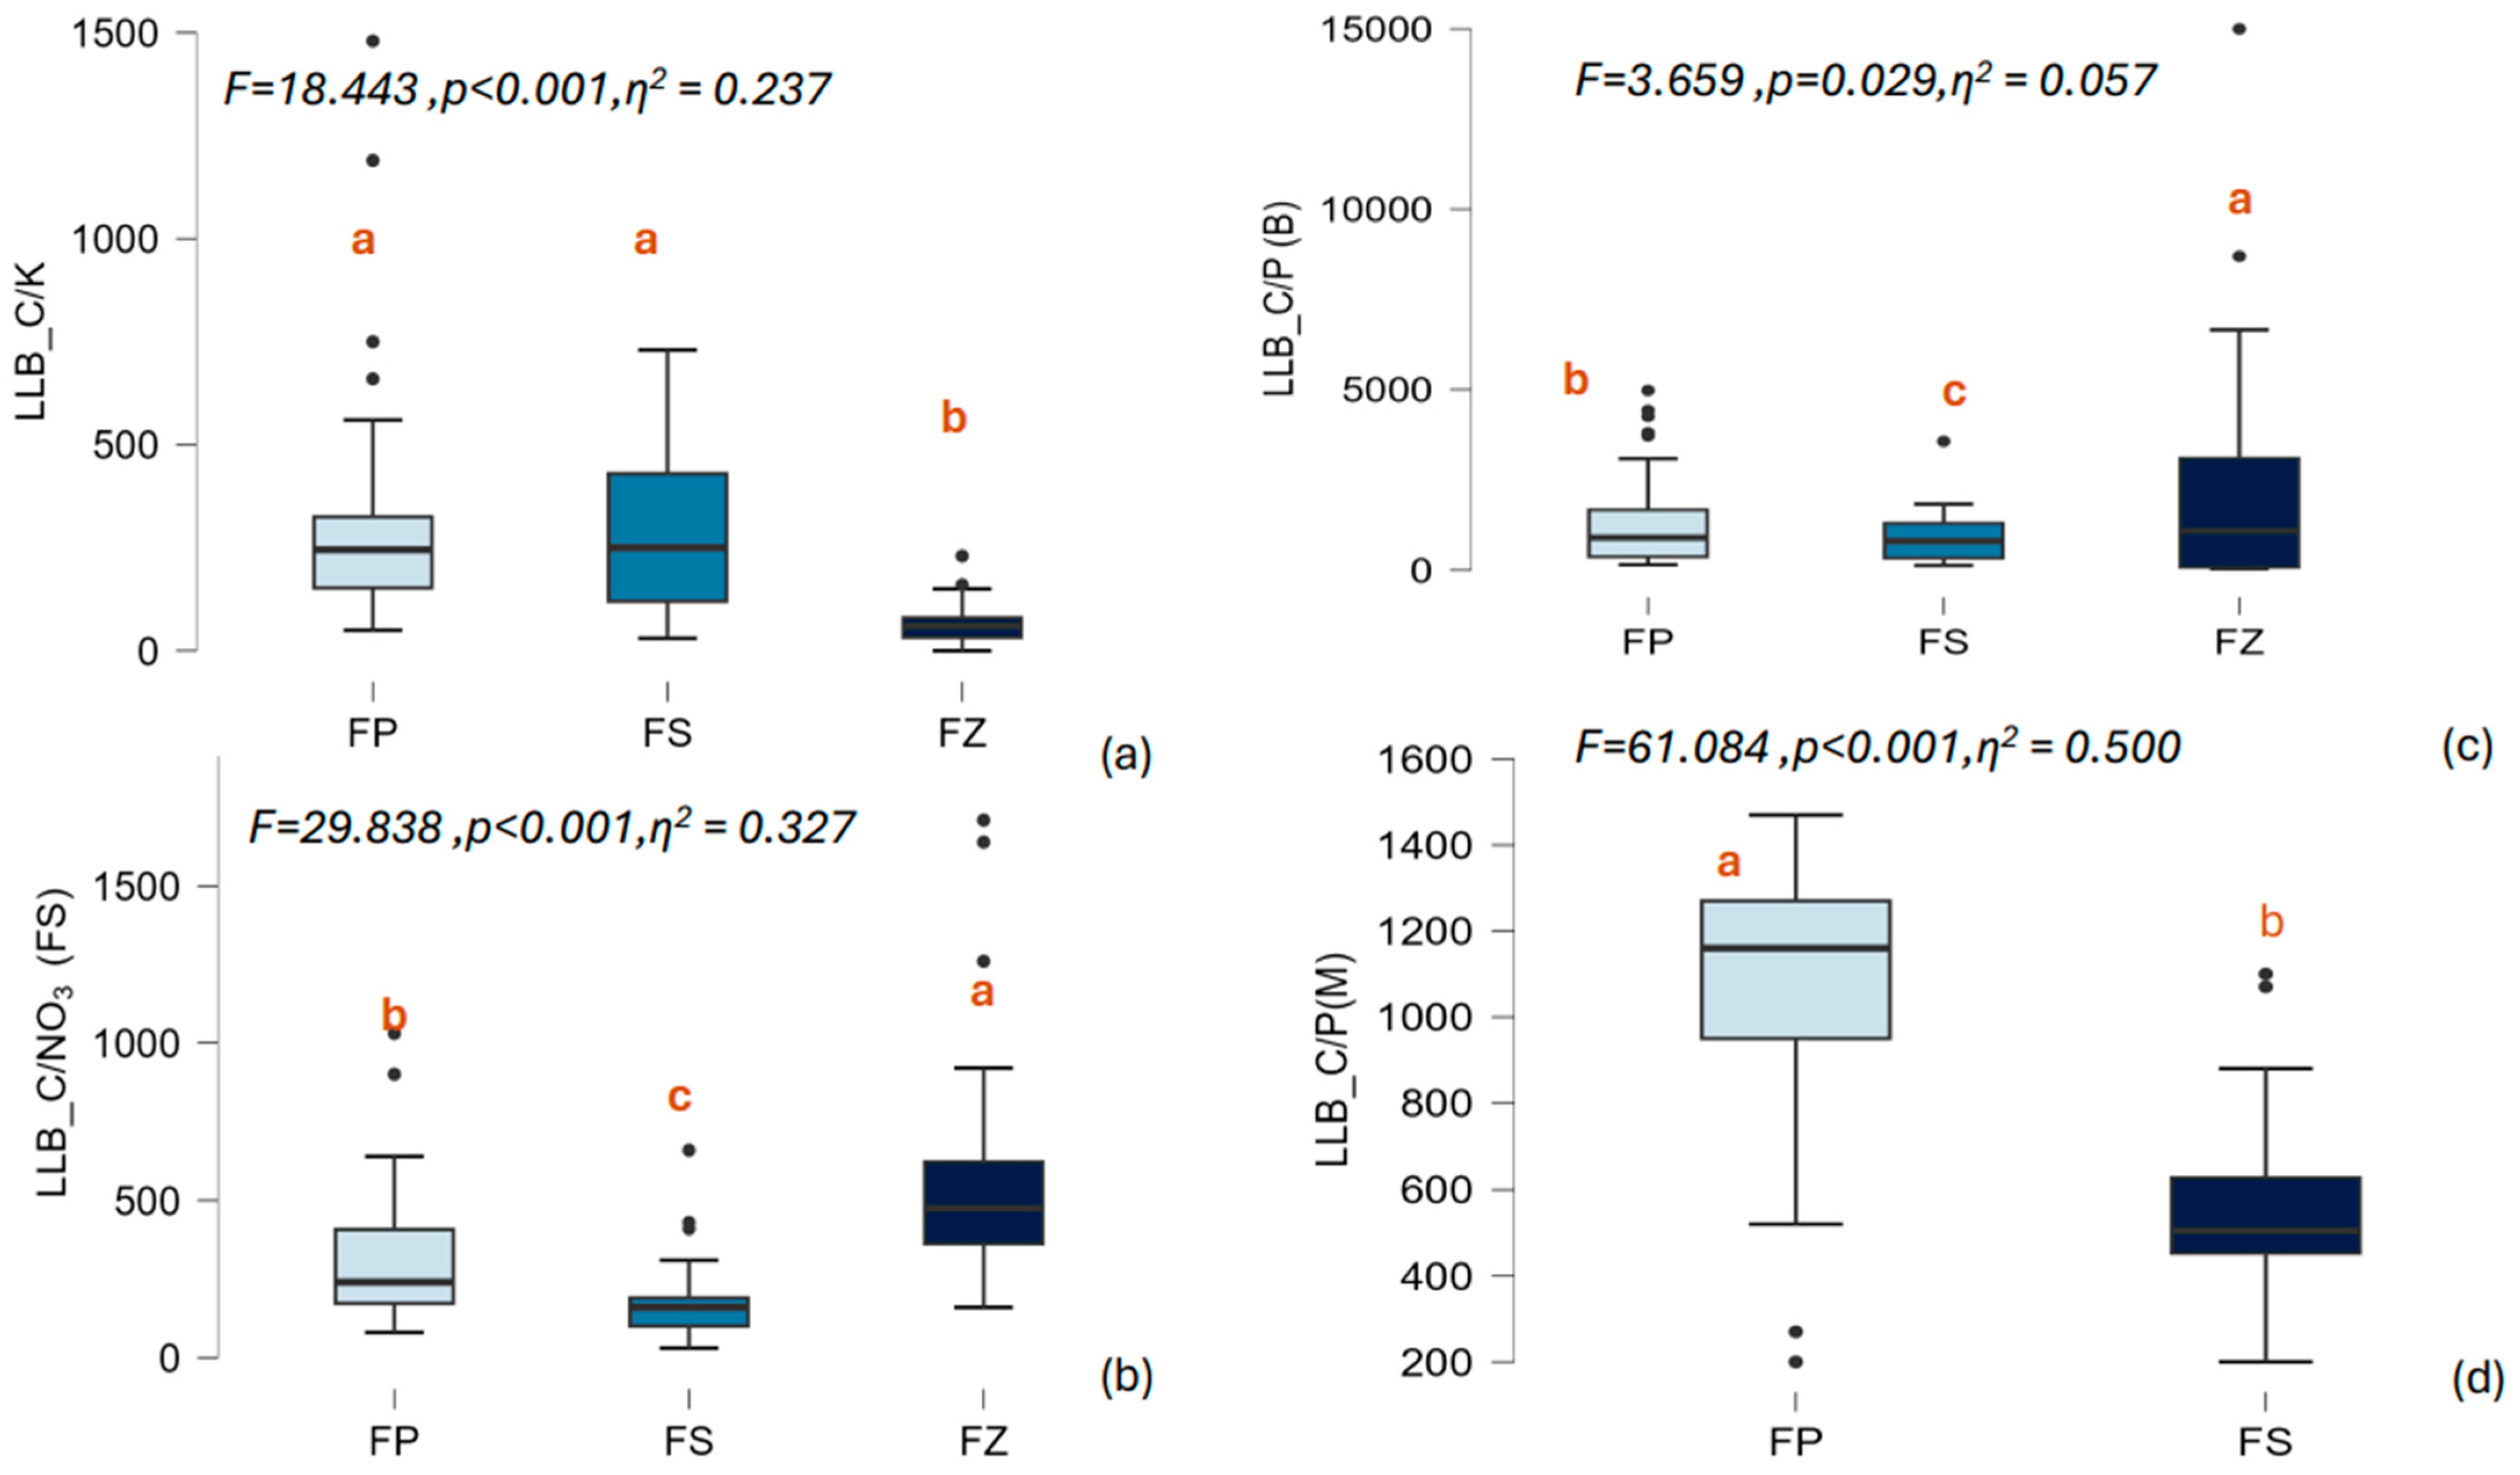
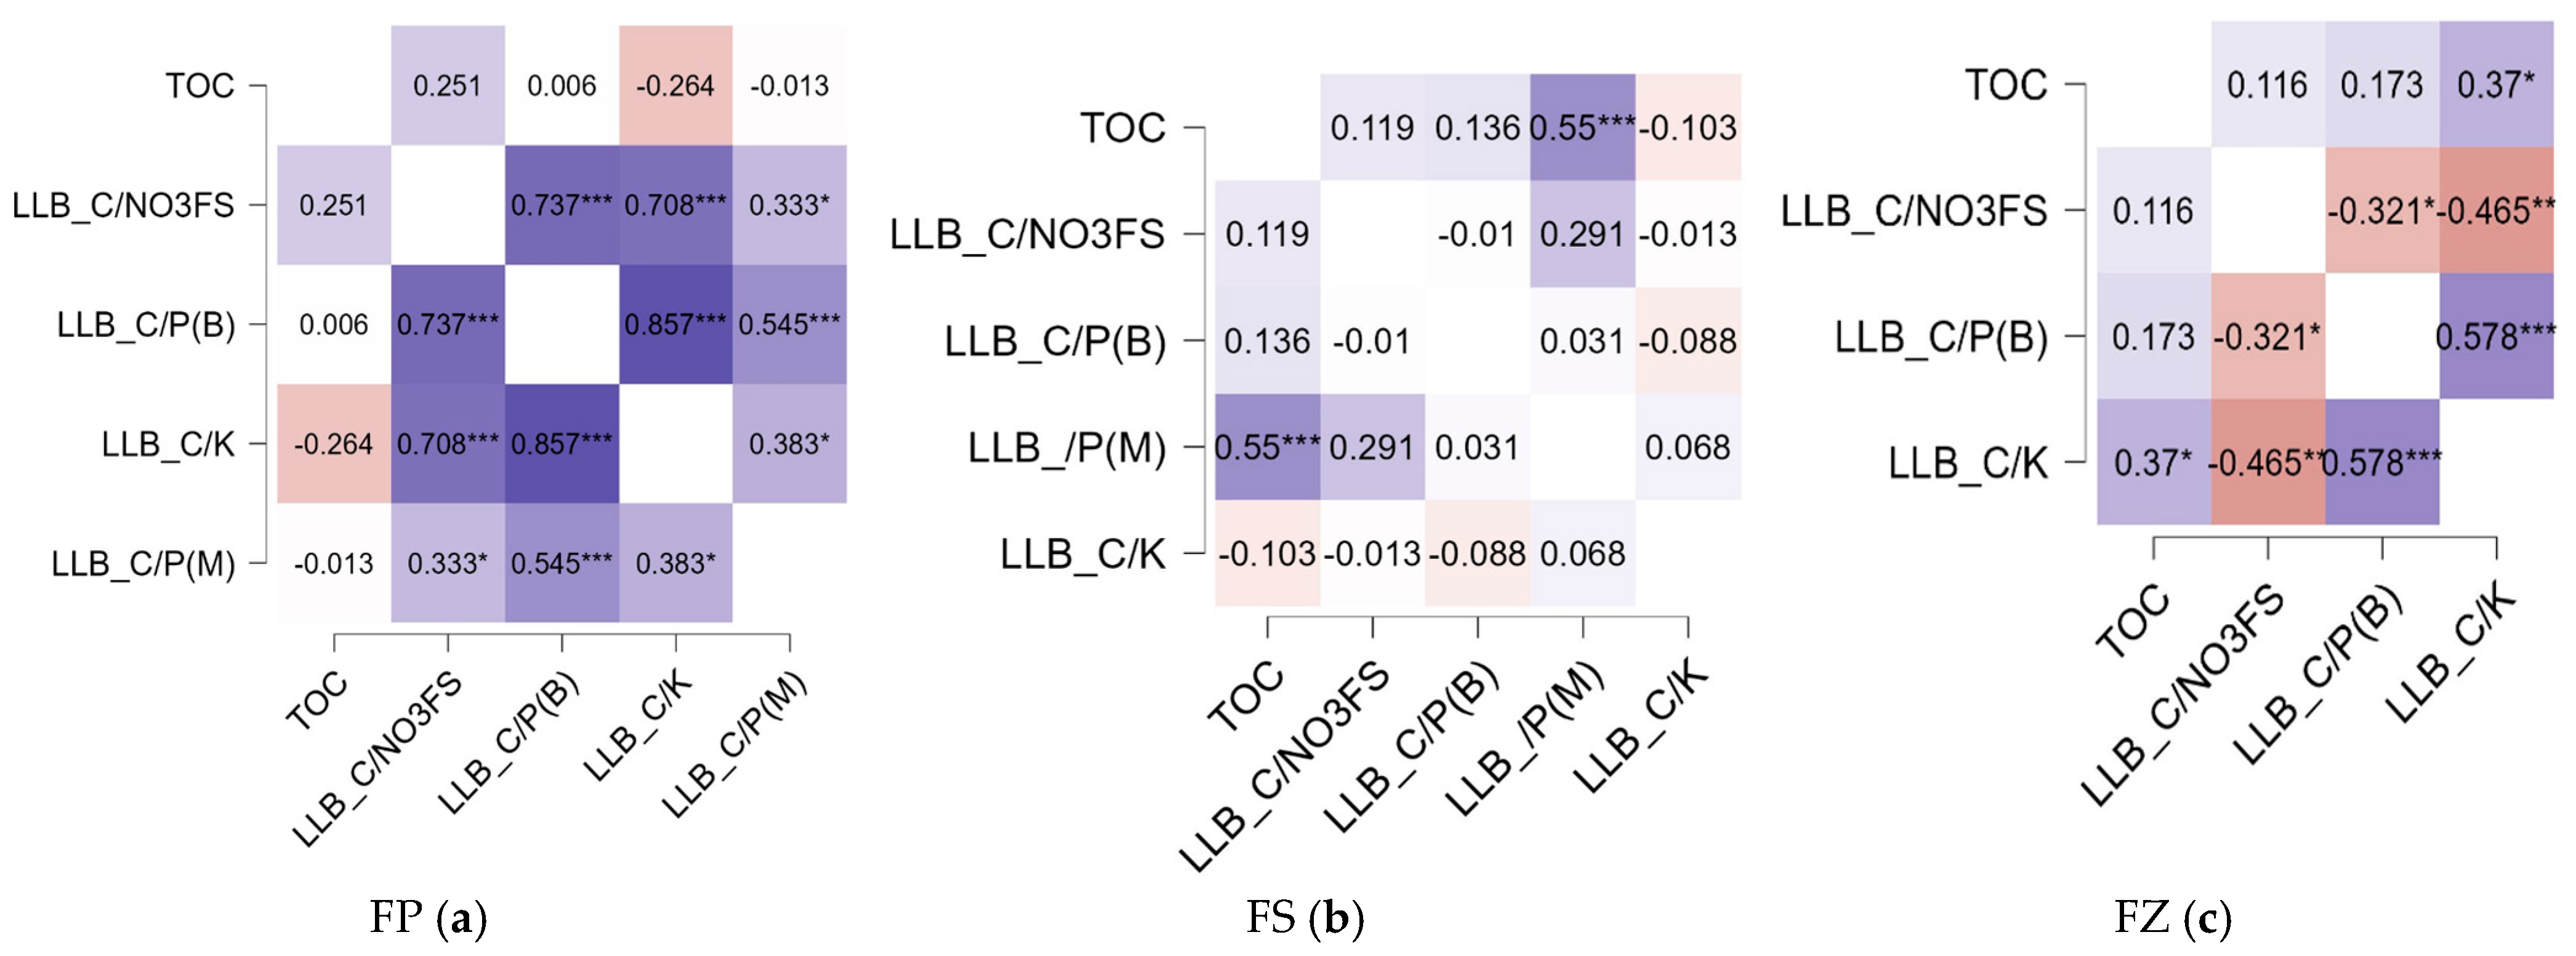
3.4. Ratio of Less Labile Carbon (LLB_C) to the NPK Content in Soil

Ratio of LLB_C/K: According to the LLB/K ratio (labile carbon/potassium ratio), the values for the treatments FP (305 ± 44), FS (281 ± 27), and FZ (68 ± 7) were significantly different, as previously noted. We found that FP exhibited the highest ratio, with the greatest average value (Figure 7a). Ratio of LLB_C/NO3 (fresh soil): The acronym “LLB_C/NO3 fresh soil” stands for the less labile carbon nitrate ratio. When comparing the treatment FS (171 ± 18) with FP (321 ± 31) and FZ (559 ± 50), the latter values were certainly lower, as shown by the substantial statistical differences (Figure 7b). Ratio of LLB_C/P(B): There was a statistically significant difference between the ratio values for the FP (1410 ± 213), FS (876 ± 103), and FZ (2001 ± 456) fertilizer management treatments, with FZ having the highest (Figure 7c). Ratio of LLB_C/P (M): This study found that fertilizer management has a lower effect on the LLB_C/P (M) ratio in the FS (553 ± 27) than in the FP treatment (1063 ± 75) (Figure 7d). By switching long-term arable soils to reduced-nitrogen fertilization (i.e., FS and FZ), the LLB_C/K, LB/P (B), and LLB_C/P (M) ratios were examined in the research; FP had the greatest ratio, and the FZ treatment had the highest average value. It was discovered that FS had a lower LLB/NO3 than FP and FZ. Additionally, we discovered that the LLB_C/P (M) ratio in the FS treatment was less affected by fertilizer management than it was in FP treatment. When we looked at the percentage decrease, we found that the ratios of LLB_C/NO3 _FS and LLB_C/P (B) in FS treatment all fell by 47% and 38%, respectively, compared to the mean of the FP. In the FZ variant, these ratios experienced an increase of 74% and 42%, respectively. While LLB_C/P (M) decreased by 48% compared to the mean of FP, the LLB_C/K ratio decreased in FS and FZ treatment by 8% and 78% compared to FP, respectively. In this study, as we reduced the N addition, the effect size decreased in the sequence LLB_C/P (M) > LLB_C/NO3 > LLB_C/K > LLB_C/P (B), in comparison to the FP treatment. FS revealed a decrease in LLB_C/NO3, LLB_C/P (M), LLB_C/P (B), and LLB_C/K, while FZ was higher in LLB_C/NO3 and LLB_C/P (B) compared to FP. These findings underscore the importance of considering them for assessing soil carbon dynamics in agricultural soils
Spearman’s rho correlation coefficient for the ratio of LLB_C to N and P in soil is as follows: Fertilizer management has different effects on plant nutrient availability and what kinds of organic matter are in the soil. For example, the ratio of LLB_C to P(M) is positively related to TOC, reducing N in FS treatment. The LLB_C/K ratio exhibits a positive correlation with TOC when no N is added (FZ), but it shows a negative correlation with TOC in the FP and FS treatments (Figure 8a–c). For LLB_C/NO3_FS, a trending positive correlation was observed with TOC across all fertilizer practices.
Therefore, this study demonstrated that LLB_C/P(M) was a crucial factor for keeping SOC under a lower N addition (FS) but not FP. When there was no N addition, the LLB_C/K ratio had a positive relationship with TOC, whereas FP and FS both showed negative relationships. While the LLB_C/NO3_FS ratio and LLB_C/P (B) were trending positive with TOC in all the different N addition patterns, FP exhibited the highest correlation coefficient compared with FS and FZ (Figure 8a–c).

4. Discussion

4.1. The Labile and Recalcitrant Carbon Content Decreased When Switched to SSNM

Labile Carbon Under Lower N Addition

Less nitrogen can lead to more SOM mineralization as microbes “mine” for nitrogen, which makes the priming effect (PE) stronger [59,60]. This trait led to an increase in the SOC mineralization in FS treatment. There was not enough nitrogen in the soil, so the rates of microbial biomass and soil respiration slowed down. This action caused labile carbon reservoirs to temporarily rise [27,28]. The other study found that adding low nitrogen can raise the carbon management index (CMI) and lower labile carbon fractions like MBC and DOC [61]. This study therefore showed that the drop in labile carbon content under a low N addition (FS) could be because labile carbon inputs under low N addition induced a priming effect that significantly contributed to the depletion of labile carbon pools. The availability of labile carbon supported the mineralization or priming of soil organic matter (SOM), with soils differing in the extent to which labile C stimulates priming [36]. N deficiency in root exudates can cause microbes to accelerate SOM decomposition to meet their N needs, a phenomenon [59] also observed and which we discovered in this study. Zeng et al. [62] showed that the deficiency in N promoted total cumulative carbon release, and the low nitrogen addition raised the activity of labile C-degradation genes and enzymes, which caused more CO2 to be released and labile carbon to break down more quickly [25,26]. Zeng et al. [62] reported that the notable rise in microbial carbon use efficiency and soil microbial biomass nitrogen did not influence or may have even reduced labile carbon decomposition. Our results did not show a significant difference based on the nitrogen application patterns, while the NFF remained the highest in FZ. These labile carbons did not decompose due to the limited availability of N. On the other hand, the availability of N decreased. Begum et al. [63] established that a nitrogen level of 120–140% raised labile carbon as well as POXC and that POXC was more sensitive to N management systems, as shown by the physical and microbial properties of the soil. The research also showed that POXC, as a sign of healthy soil, accurately detected changes in the soil’s labile carbon pool caused by N management [63]. Compared to the NFF, the labile organic carbon fraction, such as LB_C, significantly decreased, reflecting the different responses to levels of nitrogen supply patterns.
Recalcitrant Carbon under lower N addition: Our study showed in a short period (1-crop season) a contrast in the amounts of stable carbon, with a low N input, an increase in NLB, and a decrease in Passive_C and the FF. Consistently with these findings, a study using ion-exchange membranes found that the total cumulative carbon release was promoted via the N deficiency treatment but inhibited via the high N treatment, and N deficiency increased soil recalcitrant carbon decomposition [62]. The fine fraction is positively correlated with the accumulation of soil organic carbon in mineral horizons, indicating its importance in carbon stabilization [29,30]. The N addition generally decreases the recalcitrant carbon pool in soils. This finding is attributed to enhanced enzyme activities that promote the decomposition of recalcitrant carbon and increased dissolved organic carbon that stimulates this carbon fraction pool decomposition [26,27,64]. For the FF, nutrient addition increased FF levels in all soils, with a significant interaction between soil type and nutrient treatment. Nutrient addition (as N) significantly increased FF sequestration in soils over seven consecutive incubation cycles [32]. On the other hand, inorganic nitrogen sources tend to inhibit soil carbon cycle processes, leading to the accumulation of recalcitrant organic carbon [65]. Microbial regulation strategies under a N imbalance drove soil labile C release [62]. Adding nitrogen raises SOC in fine soil fractions, such as mineral-associated fractions, which facilitates the overall SOC build-up [35]. The shortage of available soil N (i.e., FZ) showed the lowest level of recalcitrant C decomposition (i.e., the FF). A meta-analysis of 48 sites in China found that the synthetic nitrogen fertilizer reduction decreased soil organic carbon [66] while also finding that short-term chemical nitrogen fertilizer reduction negatively impacted SOC levels. This finding explains why soil organic C decomposition was more sensitive to N scarcity than to N abundance [62].
Increased soil organic carbon from organic amendments can enhance nitrification by supplying additional substrates for microbial activity [67,68]. However, the total content of soil carbon and the ratio of soil carbon to nitrogen were insufficient to account for the occurrence of heterotrophic nitrification [69].
When comparing this finding to the application of high levels of nitrogen, as practiced by farmers, Begum et al. [63] found that nitrogen fertilization (120 and 140%) significantly increased the labile C pools compared to the control and lower rates. High N levels also increased the MBC, C pool, lability, and management indices, indicating improved soil biological activities. Higher N fertilization rates led to higher MBC and POC stocks and labile C pool stocks and would consequently increase SOC in rice-based systems in subtropical climates, which suggests that an optimal N fertilization treatment can improve soil quality. The reason for this finding is partially because continuous fertilization combined with crop residue incorporation can enhance labile carbon fractions and related enzyme activities, suggesting that proper management practices can mitigate labile carbon loss [70]. Exogenous nitrogen in litter did not affect litter and soil organic matter decomposition, except for stalk litter treatment, which reduced litter carbon loss and increased soil organic matter carbon loss [71]. There were also significant differences in SOC stability among N addition treatments, and SOC could be most stable via a mid-level N addition [61]. N fertilization at 120 to 140% over a period of seven years markedly decreased C loss (as CO2) via improving anabolism with an associated increase in the size of the labile pool of TOC, especially the POC, MBC, and POXC contents, when compared to the control (100% N) under a wheat–mungbean–rice agroecosystem in subtropical soil and climatic conditions. Increased labile carbon fraction contents translated into stratification [63]. Mid- and high-level N additions decreased soil microbial richness and evenness; however, the low N addition increased the carbon management index [61]. These reasons would explain the high organic carbon fraction and TOC in high N doses applied in FP treatment. This study showed that, due to the lower amount of N in FS and FZ treatments, the scarcity of soil N would hasten the breakdown of recalcitrant C (i.e., the FF) and LLB_C. However, labile carbon fractions (i.e., POXC and LB_C) would not break down as quickly via “nitrogen mining”, as hypothesized by [62].

4.2. The Impact of Availability of NPK Balanced with Carbon on SOC

Soil organic C decomposition responded to changes in N availability asymmetrically [62]. Meanwhile, high nitrogen availability reduced PE by decreasing the need for microbial nutrient mining [60], and the high N availability enhanced microbial C use efficiency and reduced SOC mineralization [60]. This study found significant differences in NH4+ concentrations upon addition, and that turning, lowering, and adding FS resulted in a lower of availability of NH4+ and NO3.
Higher levels of ammonium alter the process by which microbes break down organic matter, altering the structure of the microbiome and often increasing the ratio of fungi to bacteria [72]. Additionally, it may hinder the decomposition of plant residues and soil organic matter, thereby reducing the rates of carbon mineralization [38,73]. Adding ammonium can render enzymes that break down carbon less active, such as β-glucosidase and phenol oxidase, and this finding is especially true in soils that are already acidic [74]. Ammonium additions can lead to a decrease in soil pH value, which in turn affects microbial enzyme activities and carbon mineralization rates [38]. On the other hand, it was reported that adding nitrates tends to raise the SOC content and has less of an impact on microbial activity and carbon mineralization. Unlike ammonium, it reduces the SOC in the soil organic layer by a significant amount, causing more minerals to form and the loss of organic carbon [75]. Because there is less nitrogen in FS and FZ treatments, the priming effect becomes stronger; less nitrogen can lead to increased SOM mineralization as microbes “mine” for nitrogen, which strengthens makes the priming effect (PE) [59,60]. Zeng et al. [62] demonstrated that nitrogen deficiency enhanced the total cumulative carbon release, whereas nitrogen addition suppressed it. The lack of N significantly enhanced the decomposition of recalcitrant carbon through an increase in soil pH, whereas a sufficient level of N had no effect or reduced the decomposition of labile carbon. Due to the lower C availability and the dominance of K-strategists in microbial communities, the driving mechanism of SOC decomposition will follow the “microbial N mining” hypothesis. The increase in N availability will decrease the mineralization of recalcitrant C, simultaneously depleting more labile C (i.e., LB_C), which Zeng et al. [62] found in FS treatment. However, the increase in N availability would stimulate SOC decomposition, which is supposed to be regulated via “stoichiometric decomposition” [62], while the decrease in N availability would increase the storage of SOC in FZ [62]. N deficiency in root exudates can cause microbes to accelerate SOM decomposition to meet their N needs. Chertov et al. [59] also observed this phenomenon, which we expect to find in our study, particularly in FZ.
Heterotrophic nitrification rates correlated with the composition of soil organic carbon [69]. It was found that the recalcitrant carbon fractions, specifically carbonyl C and aromatic C, exhibited a significant positive correlation with heterotrophic nitrification rates, which resulted in a decrease in nitrification rates in FS and FZ treatment. Subsequently, FS and FZ might exhibit an increase in NO3 limitation. In contrast, labile carbon is easily degradable to carbon sources, such as glucose, and it promotes heterotrophic nitrification while suppressing autotrophic nitrification. Additionally, the labile carbon content would increase the microbial immobilization of ammonium, leading to a reduction in its availability for autotrophic nitrifiers [61,76]. This study showed the remaining labile carbon content, including POXC and LB_C, was elevated in FS treatment, while FZ treatment may partially inhibit autotrophic nitrification [61]. The incorporation of readily degradable carbon into soil enhances heterotrophic nitrification and N2O emissions while suppressing autotrophic nitrification, which results in elevated nitrification rates and increased NO3 accumulation [76].
It is important to consider the significance of accounting for various factors when evaluating the soil carbon content in arable crops. The LLB_C/P (M) ratio affects the P/C acquisition ratio [77]. Extracellular hydrolases control the amount of available carbon (C) and phosphorus (P) in the soil, making it easier for microbes and plants to obtain C and P [77].
According to this study, changes in soil organic carbon mineralization affect the amounts of nutrients, such as the availability of N, P, and K. These changes can be seen in the LLB_C/NO3 and LLB_C/K ratios. This study revealed that the levels of LB_C, NFF, POXC, and DOC remained high, indicating a reduction in nitrogen management. Decreased nitrogen availability can cause imbalances, preventing substrates from meeting N requirements for microbial growth. Microbes immobilize nitrogen in new biomass, inhibiting growth and activity and slowing soil organic carbon decomposition [62]. The increase in DOC is due to the reduction in N fertilization, yet despite the lack of significant phosphorus availability in this study, the released DOC in FS treatment (524.506 mg kg−1) was higher than that in FP treatment (468.072 mg kg−1) and did not significantly differ from the data not included in this article. The decrease in LLB_C and FF contents could potentially explain the decline in LLB_C/P (B) and LLB_C/P (M), particularly in FS treatment.
This study found no significant phosphorus availability in P (B) but not in P (M). It is important to acknowledge the role of phosphorus fertilization. The increase in DOC is due to the reduction in N fertilization. It is also important to acknowledge the role of phosphorus fertilization. Adding phosphate can raise the amount of labile carbon and dissolved organic carbon (DOC) in the soil solution [44]. In temperate grassland soils, the dissolved organic carbon pool is quickly turned over, with soil microorganisms being the main consumers [78]. P fertilization enhances the recalcitrant carbon fraction associated with MAOC formation [79,80]. However, the phosphorus amendment increases the decomposition of the soil carbon fraction, thus constituting a longer-term sink, which suggests that the availability of P could significantly influence the strength of SOC sinks. The long-term P addition resulted in enhanced DOC biodegradation in an N-limited temperate wetland [81], which are physiochemical aspects. The co-limitation of N and phosphorus results in the highest priming effect (PE) when both nutrients are present in subsoils, suggesting that a match between nutrient availability and microbial demand boosts SOC turnover [82]. However, no evidence was found for phosphorus mining, as P fertilization increases both short- and long-term mineralization [83]. There are dynamic relationships between carbon that is recalcitrant and carbon that is labile when nitrogen addition is reduced. Additions of N and P resulted in microbial changes that accelerated the decomposition of recalcitrant soil organic carbon, leading to reductions in both the slow carbon pool and the total SOC pool, while increasing the active carbon pool [84]. Our results indicate a reduction in LLB_C (i.e., higher stability and slower decomposition), which resembles a recalcitrant soil carbon pool, particularly in the FF under conditions of lower nitrogen input and decreased sufficient phosphorus availability (i.e., P(M). The deficiency of phosphorus in soil may result in microbes more efficiently utilizing recalcitrant phenol, thereby influencing soil organic matter priming and N2O emissions [42]. Adding phosphorus (P) accelerated SOC mineralization by forcing microbes to work harder and speeding up the rate at which C substrates from outside the body went through mineralization [41,42]. The combined effects of labile carbon and phosphorus are substantial, and the interaction between labile C and P can significantly influence SOC mineralization. For instance, adding P can intensify the priming effect of labile C, resulting in increased SOC loss [43,44]. A P addition can also inhibit the decomposition of SOC, especially in scenarios of heightened nitrogen deposition, an interaction that influences microbial community composition and enzyme activities, resulting in alterations in SOC stability [85].
Optimal N to K ratios are crucial for high-yielding crops. Both deficiency and excess of potassium can inhibit plant growth and nutrient uptake [86,87]. Nitrate (NO3) tends to enhance potassium uptake and distribution [43,86]. A lack of nitrogen supply, coupled with low nitrate in variant FZ, cannot support better K uptake and overall plant health. In FZ, high SOC levels and possible clay mineral composition significantly influenced high K retention and availability [80]. The soil in the FZ treatment had a higher residual K content compared to both FP and FS variants. Even though continuous cropping without K fertilization can deplete soil K, the presence of certain clay minerals can mitigate this depletion to some extent [88]. K availability has a significant impact on the arable soil’s SOC. This study showed that the positive correlation is between the LLB_C/K ratio and SOC and the highest availability of K in the FZ treatment, as K availability can limit humus-C sequestration [89,90]. SOC sequestration strongly correlates with the availability of N and P, whereas the role of K is less clear [50,91,92]. Furthermore, K could impact both the labile forms, like hot water-extractable carbon (HWEC), and the stable forms, like soil organic carbon. Voltr et al. [93] reported that labile forms such as HWEC were negatively affected by K (−7%). Furthermore, in arable soil, a high concentration of K reduced the soil’s ability to sequester carbon by altering its physical structure [94] and led to the loss of SOC. K fertilization alone did not significantly affect organic carbon levels in upland and paddy soils [95]. It may decrease nitrate-induced soil N2O emissions [96]. The addition of K can enhance CO2 sequestration in cropland soils, with the extent of sequestration influenced by soil pH, Ca2+ concentration, and crop growth conditions [46].
In future research, we plan to investigate a long-term replacement plan with less nitrogen input while switching labile carbon to recalcitrant carbon with certain crops. Additionally, we have identified this issue as one of the limitations of this study. We now explicitly state that each plant’s cropping history, farming practices, and related factors should ideally be addressed individually in future research to gain more accurate insights. We also aim to model the optimal N input for crop yield, soil fertility, and soil carbon storage.
We would like to summarize that short-term reduced-nitrogen fertilizers can swiftly lead to a decrease in the availability of nutrients, particularly N. This, in turn, results in a decrease in carbon fractions, especially stable ones like the FF and LLB_C, which decompose more slowly, while simultaneously increasing some labile carbons like POXC. This outcome ultimately leads to a promising SOC in arable soil (Figure 9).
This study’s findings highlight apprehensions about the exclusive dependence on SSNM for fertilizer application. Although we must evaluate the fertilization recommendations of this policy and contemplate decreasing the use of synthetic fertilizers, if only to mitigate GHG emissions, this action would not intentionally contribute to climate change within agricultural practices. It is essential to sustain target crop yields while reducing fertilizer costs for farmers, and we must also consider fertilizer application for soil fertility and quality to combat climate change by sequestering carbon in the soil. It is critical to use quick and accurate soil analysis methods, as well as nutrient requirement models for each plant species, and to consider the soil quality and long-term health of an ecosystem. We can then implement these recommendations through training programs and use the results of this study, along with other similar knowledge patterns, to make recommendations to local farmers. Our study on reduced nitrogen inputs in Northern Thailand’s soil organic carbon dynamics may not fully capture its long-term effects, so expanding our research to different regions and exploring interactions with other soil amendments could therefore provide deeper insights.

5. Conclusions

The SSNM concept of reduced N addition resulted in a 2% decrease in SOC in long-term arable soils that were transitioned to a reduced nitrogen fertilizer. Conversely, treatment with no fertilization resulted in a 6% increase in SOC, indicating a decrease in LLB_C and FF, which were the stable carbon fractions compared to FP, while, in contrast, the labile carbon fractions, such as POXC and LB_C, experienced an increase. The availability of NH4+ and NO3 thus influences the availability of reduced N additions.

Author Contributions

Conceptualization, S.A. and C.C.; methodology, S.A.; software, C.C.; validation, S.A. and P.F.; formal analysis, S.A., P.F., T.C. and C.C.; investigation, S.A. and C.C.; resources, C.C.; data curation, P.F., T.C., K.K. and D.L.; writing—original draft preparation, S.A.; writing—review and editing, S.A., C.C. and D.L.; visualization, S.A., C.C. and D.L.; supervision, S.A. and C.C.; project administration, S.A.; funding acquisition, S.A. and C.C. All authors have read and agreed to the published version of the manuscript.

Funding

This research was funded by the Agricultural Research Development Agency of Thailand, grant number PRP6605030280 and partially supported by Chiang Mai University (CMU).

Data Availability Statement

The original contributions presented in the study are included in the article, further inquiries can be directed to the corresponding author.

Conflicts of Interest

The authors declare no conflicts of interest.

References

  1. van Dijk, M.; Morley, T.; Rau, M.L.; Saghai, Y. A meta-analysis of projected global food demand and population at risk of hunger for the period 2010–2050. Nat. Food 2021, 2, 494–501. [Google Scholar] [CrossRef] [PubMed]
  2. Fukase, E.; Martin, W. Economic Growth, Convergence, and World Food Demand and Supply. World Dev. 2017, 132, 104954. [Google Scholar] [CrossRef]
  3. FAO (Food and Agriculture Organization of the United Nations). Global Perspectives—Studies: Food and Agriculture Projections to 2050. Available online: https://www.fao.org/global-soil-partnership/resources/highlights/detail/en/c/1452041 (accessed on 9 March 2024).
  4. Menegat, S.; Ledo, A.; Tirado, R. Greenhouse gas emissions from global production and use of nitrogen synthetic fertilisers in agriculture. Sci. Rep. 2022, 12, 14490. [Google Scholar] [CrossRef]
  5. Mustafa, A.; Hu, X.; Sun, N.; Kailou, L.; Qing-hai, H.; Mohammad Tahsin Karimi, N.; Minggang, X. Long-Term Fertilization Alters the Storage and Stability of Soil Organic Carbon in Chinese Paddy Soil. Agronomy 2023, 13, 1463. [Google Scholar] [CrossRef]
  6. Urmi, T.A.; Rahman, M.; Islam, M.; Islam, A.; Jahan, N.A.; Mia, A.B.; Akhter, S.; Siddiqui, M.H.; Kalaji, H.M. Integrated Nutrient Management for Rice Yield, Soil Fertility, and Carbon Sequestration. Plants 2022, 11, 138. [Google Scholar] [CrossRef] [PubMed]
  7. Karimi, S.; Shahrzad, S.; Khadijeh, J. Positive and Negative Impact of Nitrogen Fertilizer on Soil Properties and Nutrient Dynamic. Asian J. Res. Agric. For. 2023, 9, 233–240. [Google Scholar] [CrossRef]
  8. Armel, Z.; Alberto, E.; Portell, X.; Rodrigo, A.; Virto, I.; Orcaray, L. A Fertilisation Strategy Combining Mineral Fertiliser and Biosolid Improves Long-Term Yield and Carbon Storage in a Calcareous Soil. Agriculture 2023, 13, 860. [Google Scholar] [CrossRef]
  9. Nisar, S.; Mavi, M.S.; Singh, J.; Dey, P. Integrated nutrient management in spring-maize improves yield, nutrient use efficiency and minimizes greenhouse gas intensity. Arch. Agron. Soil Sci. 2023, 69, 2522–2536. [Google Scholar] [CrossRef]
  10. Bashkin, V.; Alekseev, A. Global Food Security and Fundamental Role of Fertilizer Part 2. Fundamental Role of Fertilizer in Food Production. Issues Risk Anal. 2022, 19, 10–29. [Google Scholar] [CrossRef]
  11. Sapkota, T.B.; Jat, M.L.; Rana, D.S.; Khatri-Chhetri, A.; Jat, H.S.; Bijarniya, D.; Sutaliya, J.M.; Kumar, M.; Singh, L.K.; Jat, R.K.; et al. Crop nutrient management using Nutrient Expert improves yield, increases farmers’ income and reduces greenhouse gas emissions. Sci. Rep. 2021, 11, 1564. [Google Scholar] [CrossRef]
  12. Wu, H.; MacDonald, G.K.; Galloway, J.N.; Zhang, L.; Gao, L.; Yang, L.; Yang, J.; Li, X.; Li, H.; Yang, T. The influence of crop and chemical fertilizer combinations on greenhouse gas emissions: A partial life-cycle assessment of fertilizer production and use in China. Resour. Conserv. Recycl. 2021, 168, 105303. [Google Scholar] [CrossRef]
  13. Corcimaru, V.; Corcimaru, S. A potentially underestimated source of CO2 and other greenhouse gases in agriculture. J. Emerg. Investig. 2022, 5, 1–5. [Google Scholar] [CrossRef] [PubMed]
  14. Kong, D.; Liu, N.; Ren, C.; Li, H.; Wang, W.; Li, N.; Ren, G.; Feng, Y.; Yang, G. Effect of Nitrogen Fertilizer on Soil CO2 Emission Depends on Crop Rotation Strategy. Sustainability 2020, 12, 5271. [Google Scholar] [CrossRef]
  15. Walling, E.; Vaneeckhaute, C. Greenhouse gas emissions from inorganic and organic fertilizer production and use: A review of emission factors and their variability. J. Environ. Manag. 2020, 276, 111211. [Google Scholar] [CrossRef]
  16. Kim, G.W.; Lim, J.Y.; Islam Bhuiyan, M.S.; Das, S.; Khan, M.I.; Kim, P.J. Investigating the arable land that is the main contributor to global warming between paddy and upland vegetable crops under excessive nitrogen fertilization. J. Clean. Prod. 2022, 346, 131197. [Google Scholar] [CrossRef]
  17. Zhao, H.; Li, X.; Jiang, Y. Response of Nitrogen Losses to Excessive Nitrogen Fertilizer Application in Intensive Greenhouse Vegetable Production. Sustainability 2019, 11, 1513. [Google Scholar] [CrossRef]
  18. Atieno, M.; Herrmann, L.; Nguyen, H.T.; Phan, H.T.; Nguyen, N.K.; Srean, P.; Than, M.M.; Zhiyong, R.; Tittabutr, P.; Shutsrirung, A.; et al. Assessment of biofertilizer use for sustainable agriculture in the Great Mekong Region. J. Environ. Manag. 2020, 275, 111300. [Google Scholar] [CrossRef] [PubMed]
  19. Jiang, Z.; Zhong, Y.; Yang, J.; Wu, Y.; Li, H.; Zheng, L. Effect of nitrogen fertilizer rates on carbon footprint and ecosystem service of carbon sequestration in rice production. Sci. Total Environ. 2019, 670, 210–217. [Google Scholar] [CrossRef]
  20. Govindasamy, P.; Muthusamy, S.; Bagavathiannan, M.; Mowrer, J.; Jagannadham, P.T.; Maity, A.; Halli, H.; Sujayananad, G.K.; Vadivel, R.; Das, T.K.; et al. Nitrogen use efficiency—A key to enhance crop productivity under a changing climate. Front. Plant Sci. 2023, 14, 1121073. [Google Scholar] [CrossRef]
  21. Zhang, Z.; Li, H.; Hu, J.; Li, X.; He, Q.; Tian, G.; Wang, H.; Wang, S.; Wang, B. Do microorganism stoichiometric alterations affect carbon sequestration in paddy soil subjected to phosphorus input? Ecol. Appl. 2015, 25, 866–879. [Google Scholar] [CrossRef]
  22. Zhao, H.; Sun, B.; Lu, F.; Wang, X.; Zhuang, T.; Zhang, G.; Ouyang, Z. Roles of nitrogen, phosphorus, and potassium fertilizers in carbon sequestration in a Chinese agricultural ecosystem. Clim. Change 2017, 142, 587–596. [Google Scholar] [CrossRef]
  23. Jin, S. Recommended nitrogen fertilization enhances soil carbon sequestration in China’s monsoonal temperate zone. PeerJ 2018, 6, e5983. [Google Scholar] [CrossRef] [PubMed]
  24. Tang, B.; Rocci, K.S.; Lehmann, A.; Rillig, M.C. Nitrogen increases soil organic carbon accrual and alters its functionality. Glob. Change Biol. 2023, 29, 1971–1983. [Google Scholar] [CrossRef]
  25. Song, Y.; Song, C.; Meng, H.; Swarzenski, C.M.; Wang, X.; Tan, W. Nitrogen additions affect litter quality and soil biochemical properties in a peatland of Northeast China. Ecol. Eng. 2017, 100, 175–185. [Google Scholar] [CrossRef]
  26. Jing, H.; Li, J.; Yan, B.; Wei, F.; Wang, G.; Liu, G. The effects of nitrogen addition on soil organic carbon decomposition and microbial C-degradation functional genes abundance in a Pinus tabulaeformis forest. For. Ecol. Manag. 2021, 489, 119098. [Google Scholar] [CrossRef]
  27. Jiang, X.; Cao, L.; Zhang, R. Changes of labile and recalcitrant carbon pools under nitrogen addition in a city lawn soil. J. Soils Sediments 2014, 14, 515–524. [Google Scholar] [CrossRef]
  28. Liu, H.; Xue, S.; Wang, G.; Liu, B. Effects of nitrogen addition on soil oxidisable organic carbon fractions in the rhizospheric and bulk soils of Chinese pines in north-western China. Soil Res. 2017, 56, 192–203. [Google Scholar] [CrossRef]
  29. Gruba, P.; Socha, J.; Błońska, E.; Lasota, J. Effect of variable soil texture, metal saturation of soil organic matter (SOM) and tree species composition on spatial distribution of SOM in forest soils in Poland. Sci. Total Environ. 2015, 521–522, 90–100. [Google Scholar] [CrossRef]
  30. McNally, S.R.; Beare, M.H.; Curtin, D.; Meenken, E.D.; Kelliher, F.M.; Calvelo Pereira, R.; Shen, Q.; Baldock, J. Soil carbon sequestration potential of permanent pasture and continuous cropping soils in New Zealand. Glob. Change Biol. 2017, 23, 4544–4555. [Google Scholar] [CrossRef]
  31. Kirkby, C.A.; Richardson, A.E.; Wade, L.J.; Batten, G.D.; Blanchard, C.L.; McLaren, G.; Zwart, A.B.; Kirkegaard, J.A. Accurate measurement of resistant soil organic matter and its stoichiometry. Eur. J. Soil Sci. 2016, 67, 695–705. [Google Scholar] [CrossRef]
  32. Kirkby, C.A.; Richardson, A.E.; Wade, L.J.; Batten, G.D.; Blanchard, C.; Kirkegaard, J.A. Carbon-nutrient stoichiometry to increase soil carbon sequestration. Soil Biol. Biochem. 2013, 60, 77–86. [Google Scholar] [CrossRef]
  33. Kirkby, C.A.; Richardson, A.E.; Wade, L.J.; Passioura, J.B.; Batten, G.D.; Blanchard, C.; Kirkegaard, J.A. Nutrient availability limits carbon sequestration in arable soils. Soil Biol. Biochem. 2014, 68, 402–409. [Google Scholar] [CrossRef]
  34. Geng, J.; Cheng, S.; Fang, H.; Pei, J.; Xu, M.; Lu, M.; Yang, Y.; Cao, Z.; Li, Y. Different Molecular Characterization of Soil Particulate Fractions under N Deposition in a Subtropical Forest. Forests 2019, 10, 914. [Google Scholar] [CrossRef]
  35. Xu, H.; Liu, K.; Zhang, W.; Rui, Y.; Zhang, J.; Wu, L.; Colinet, G.; Huang, Q.; Chen, X.; Xu, M. Long-term fertilization and intensive cropping enhance carbon and nitrogen accumulated in soil clay-sized particles of red soil in South China. J. Soils Sediments 2020, 20, 1824–1833. [Google Scholar] [CrossRef]
  36. Paterson, E.; Sim, A. Soil-specific response functions of organic matter mineralization to the availability of labile carbon. Glob. Change Biol. 2013, 19, 1562–1571. [Google Scholar] [CrossRef] [PubMed]
  37. Liu, N.; Michelsen, A.; Rinnan, R. Vegetation and soil responses to added carbon and nutrients remain six years after discontinuation of long-term treatments. Sci. Total Environ. 2020, 722, 137885. [Google Scholar] [CrossRef]
  38. Song, Y.; Song, C.; Tao, B.; Wang, J.; Zhu, X.; Wang, X. Short-term responses of soil enzyme activities and carbon mineralization to added nitrogen and litter in a freshwater marsh of Northeast China. Eur. J. Soil Biol. 2014, 61, 72–79. [Google Scholar] [CrossRef]
  39. Shan, Z.; Yin, Z.; Yang, H.; Zuo, C.; Zhu, T. Long-Term Cultivation of Fruit Plantations Decreases Mineralization and Nitrification Rates in Calcareous Soil in the Karst Region in Southwestern China. Forests 2020, 11, 1282. [Google Scholar] [CrossRef]
  40. Tian, Q.; Yang, X.; Wang, X.; Liao, C.; Li, Q.; Wang, M.; Wu, Y.; Liu, F. Microbial community mediated response of organic carbon mineralization to labile carbon and nitrogen addition in topsoil and subsoil. Biogeochemistry 2016, 128, 125–139. [Google Scholar] [CrossRef]
  41. Tang, Z.; Sun, X.; Luo, Z.; He, N.; Sun, O.J. Effects of temperature, soil substrate, and microbial community on carbon mineralization across three climatically contrasting forest sites. Ecol. Evol. 2018, 8, 879–891. [Google Scholar] [CrossRef]
  42. Mehnaz, K.R.; Corneo, P.E.; Keitel, C.; Dijkstra, F.A. Carbon and phosphorus addition effects on microbial carbon use efficiency, soil organic matter priming, gross nitrogen mineralization and nitrous oxide emission from soil. Soil Biol. Biochem. 2019, 134, 175–186. [Google Scholar] [CrossRef]
  43. Mehnaz, K.R.; Keitel, C.; Dijkstra, F.A. Effects of carbon and phosphorus addition on microbial respiration, N2O emission, and gross nitrogen mineralization in a phosphorus-limited grassland soil. Biol. Fertil. Soils 2018, 54, 481–493. [Google Scholar] [CrossRef]
  44. Aumtong, S.; Chotamonsak, C.; Pongwongkam, P.; Cantiya, K. Chemical Fertilization Alters Soil Carbon in Paddy Soil through the Interaction of Labile Organic Carbon and Phosphorus Fractions. Agronomy 2023, 13, 1588. [Google Scholar] [CrossRef]
  45. Nottingham, A.T.; Turner, B.L.; Stott, A.W.; Tanner, E.V.J. Nitrogen and phosphorus constrain labile and stable carbon turnover in lowland tropical forest soils. Soil Biol. Biochem. 2015, 80, 26–33. [Google Scholar] [CrossRef]
  46. Bar-Yosef, B.; Ben Asher, J. Simulating the effect of potassium fertilization on carbon sequestration in soil. J. Plant Nutr. Soil Sci. 2013, 176, 375–386. [Google Scholar] [CrossRef]
  47. DOA (Department of Agriculture). Recommendations for Applying Fertilizer Based on Soil Analysis Values. Available online: https://www.doa.go.th/th/ (accessed on 29 September 2024).
  48. Nelson, D.W.; Sommers, L.E. Total Carbon, Organic Carbon, and Organic Matter. In Methods of Soil Analysis; SSSA Book Series; John Wiley & Sons Inc.: Hoboken, NJ, USA, 1996; pp. 961–1010. [Google Scholar]
  49. Walkley, A.; Black, I.A. An Examination of the Degtjareff Method for Determining Soil Organic Matter, and A Proposed Modification of the Chromic Acid Titration Method. Soil Sci. 1934, 37, 29–38. [Google Scholar] [CrossRef]
  50. Kirkegaard, J.A.; Richardson, A.E.; Kirkby, C.A. Fate and cost effectiveness of soil carbon sequestered using supplementary nutrients applied to crop residues under field conditions. Nutr. Cycl. Agroecosystems 2023, 126, 143–161. [Google Scholar] [CrossRef]
  51. Ohno, T.; Zibilske, L.M. Determination of Low Concentrations of Phosphorus in Soil Extracts Using Malachite Green. Soil Sci. Soc. Am. J. 1991, 55, 892–895. [Google Scholar] [CrossRef]
  52. Miller, A.P.; Arai, Y. Comparative Evaluation of Phosphate Spectrophotometric Methods in Soil Test Phosphorus Extracting Solutions. Soil Sci. Soc. Am. J. 2016, 80, 1543–1550. [Google Scholar] [CrossRef]
  53. Keeney, D.R.; Nelson, D.W. Nitrogen—Inorganic Forms. In Methods of Soil Analysis; Agronomy Monographs; John Wiley & Sons, Inc.: Hoboken, NJ, USA, 1982; pp. 643–698. [Google Scholar]
  54. Baethgen, W.E.; Alley, M.M. A manual colorimetric procedure for measuring ammonium nitrogen in soil and plant Kjeldahl digests. Commun. Soil Sci. Plant Anal. 1989, 20, 961–969. [Google Scholar] [CrossRef]
  55. Weil, R.; Stine, M.; Gruver, J.; Samson-Liebig, S. Estimating active carbon for soil quality assessment: A simplified method for laboratory and field use. Am. J. Altern. Agric. 2003, 18, 3–17. [Google Scholar] [CrossRef]
  56. Chan, K.; Bowman, A.; Oates, A. Oxidizible Organic Carbon Fractions and Soil Quality Changes in An Oxic Paleustalf Under Different Pasture Leys. Soil Sci. 2001, 166, 61–67. [Google Scholar] [CrossRef]
  57. Yeomans, J.C.; Bremner, J.M. A rapid and precise method for routine determination of organic carbon in soil. Commun. Soil Sci. Plant Anal. 1988, 19, 1467–1476. [Google Scholar] [CrossRef]
  58. Maia, S.M.F.; Xavier, F.A.S.; Oliveira, T.S.; Mendonça, E.S.; Araújo Filho, J.A. Organic carbon pools in a Luvisol under agroforestry and conventional farming systems in the semi-arid region of Ceará, Brazil. Agrofor. Syst. 2007, 71, 127–138. [Google Scholar] [CrossRef]
  59. Chertov, O.; Kuzyakov, Y.; Priputina, I.; Frolov, P.; Shanin, V.; Grabarnik, P. Modelling the Rhizosphere Priming Effect in Combination with Soil Food Webs to Quantify Interaction between Living Plant, Soil Biota and Soil Organic Matter. Plants 2022, 11, 2605. [Google Scholar] [CrossRef]
  60. Yang, K.; Peng, P.; Duan, F.; Tang, H.; Wu, K.; Wu, Z.; Li, F.; Chen, Y.; Zou, C.; Liu, L.; et al. Microbial Mechanisms of the Priming Effect over 12 Years of Different Amounts of Nitrogen Management. Agronomy 2023, 13, 1783. [Google Scholar] [CrossRef]
  61. Zhang, J.; Huang, H.; Liu, H.; Wu, H.; Zhang, Z.; Wang, G.; Xue, S.; Liu, G. Effects of Soil Microbiological Properties on the Fractional Distribution and Stability of Soil Organic Carbon under Different N Addition Treatments. Forests 2023, 14, 1540. [Google Scholar] [CrossRef]
  62. Zeng, W.; Wang, Z.; Chen, X.; Yao, X.; Ma, Z.; Wang, W. Nitrogen deficiency accelerates soil organic carbon decomposition in temperate degraded grasslands. Sci. Total Environ. 2023, 881, 163424. [Google Scholar] [CrossRef]
  63. Begum, R.; Jahangir, M.M.R.; Jahiruddin, M.; Islam, M.R.; Rahman, M.T.; Rahman, M.L.; Ali, M.Y.; Hossain, M.B.; Islam, K.R. Nitrogen fertilization impact on soil carbon pools and their stratification and lability in subtropical wheat-mungbean-rice agroecosystems. PLoS ONE 2021, 16, e0256397. [Google Scholar] [CrossRef]
  64. Ramirez, K.S.; Craine, J.M.; Fierer, N. Consistent effects of nitrogen amendments on soil microbial communities and processes across biomes. Glob. Change Biol. 2012, 18, 1918–1927. [Google Scholar] [CrossRef]
  65. Du, Y.; Guo, P.; Liu, J.; Wang, C.; Yang, N.; Jiao, Z. Different types of nitrogen deposition show variable effects on the soil carbon cycle process of temperate forests. Glob. Change Biol. 2014, 20, 3222–3228. [Google Scholar] [CrossRef] [PubMed]
  66. Li, C.; Aluko, O.O.; Yuan, G.; Li, J.; Liu, H. The responses of soil organic carbon and total nitrogen to chemical nitrogen fertilizers reduction base on a meta-analysis. Sci. Rep. 2022, 12, 16326. [Google Scholar] [CrossRef] [PubMed]
  67. Elrys, A.S.; Wang, J.; Metwally, M.A.S.; Cheng, Y.; Zhang, J.B.; Cai, Z.C.; Chang, S.X.; Müller, C. Global gross nitrification rates are dominantly driven by soil carbon-to-nitrogen stoichiometry and total nitrogen. Glob. Chang Biol. 2021, 27, 6512–6524. [Google Scholar] [CrossRef] [PubMed]
  68. Waqas, M.A.; Li, Y.e.; Ashraf, M.N.; Ahmed, W.; Wang, B.; Sardar, M.F.; Ma, P.; Li, R.; Wan, Y.; Kuzyakov, Y. Long-term warming and elevated CO2 increase ammonia-oxidizing microbial communities and accelerate nitrification in paddy soil. Appl. Soil Ecol. 2021, 166, 104063. [Google Scholar] [CrossRef]
  69. Zhang, Y.; Liu, S.; Cheng, Y.; Cai, Z.; Müller, C.; Zhang, J. Composition of soil recalcitrant C regulates nitrification rates in acidic soils. Geoderma 2019, 337, 965–972. [Google Scholar] [CrossRef]
  70. Zhang, X.; Yu, F. Physical disturbance accelerates carbon loss through increasing labile carbon release. Plant Soil Environ. 2020, 66, 584–589. [Google Scholar] [CrossRef]
  71. Kochsiek, A.; Knops, J. Effects of Nitrogen Availability on the Fate of Litter-Carbon and Soil Organic Matter Decomposition. Br. J. Environ. Clim. Change 2013, 3, 24–43. [Google Scholar] [CrossRef]
  72. Wang, T.; Tian, Z.; Tunlid, A.; Persson, P. Influence of Ammonium on Formation of Mineral-Associated Organic Carbon by an Ectomycorrhizal Fungus. Appl. Environ. Microbiol. 2019, 85, e03007–e03018. [Google Scholar] [CrossRef]
  73. Laura, R.D. Effects of neutral salts on carbon and nitrogen mineralisation of organic matter in soil. Plant Soil 1974, 41, 113–127. [Google Scholar] [CrossRef]
  74. Min, K.; Kang, H.; Lee, D. Effects of ammonium and nitrate additions on carbon mineralization in wetland soils. Soil Biol. Biochem. 2011, 43, 2461–2469. [Google Scholar] [CrossRef]
  75. Geng, J.; Fang, H.; Cheng, S.; Pei, J. Effects of N deposition on the quality and quantity of soil organic matter in a boreal forest: Contrasting roles of ammonium and nitrate. CATENA 2021, 198, 104996. [Google Scholar] [CrossRef]
  76. Lan, T.; Liu, R.; Suter, H.; Deng, O.; Gao, X.; Luo, L.; Yuan, S.; Wang, C.; Chen, D. Stimulation of heterotrophic nitrification and N2O production, inhibition of autotrophic nitrification in soil by adding readily degradable carbon. J. Soils Sediments 2020, 20, 81–90. [Google Scholar] [CrossRef]
  77. Liu, Y.; Shahbaz, M.; Fang, Y.; Li, B.; Wei, X.; Zhu, Z.; Lynn, T.M.; Lu, S.; Shibistova, O.; Wu, J.; et al. Stoichiometric theory shapes enzyme kinetics in paddy bulk soil but not in rhizosphere soil. Land Degrad. Dev. 2022, 33, 246–256. [Google Scholar] [CrossRef]
  78. Boddy, E.; Hill, P.W.; Farrar, J.; Jones, D.L. Fast turnover of low molecular weight components of the dissolved organic carbon pool of temperate grassland field soils. Soil Biol. Biochem. 2007, 39, 827–835. [Google Scholar] [CrossRef]
  79. Chen, L.; Xin, X.; Li, J.; Han, C.; Xiong, W.; Luo, Y.; Sun, R.; Zhang, J. Phosphorus Fertilization Boosts Mineral-Associated Soil Organic Carbon Formation Associated with Phagotrophic Protists. Microb. Ecol. 2023, 86, 2541–2551. [Google Scholar] [CrossRef] [PubMed]
  80. Chen, M.; Zhang, Y.; Gao, C.; Zhang, S.; Liu, L.; Wu, L.; Li, Y.; Ding, X. Mineral-microbial interactions in nine-year organic fertilization field experiment: A mechanism for carbon storage in saline-alkaline paddy soil. Plant Soil 2023, 489, 465–481. [Google Scholar] [CrossRef]
  81. Mao, R.; Zhang, X.-H.; Li, S.-Y.; Song, C.-C. Long-term phosphorus addition enhances the biodegradability of dissolved organic carbon in a nitrogen-limited temperate freshwater wetland. Sci. Total Environ. 2017, 605–606, 332–336. [Google Scholar] [CrossRef]
  82. Meyer, N.; Welp, G.; Bornemann, L.; Amelung, W. Microbial nitrogen mining affects spatio-temporal patterns of substrate-induced respiration during seven years of bare fallow. Soil Biol. Biochem. 2017, 104, 175–184. [Google Scholar] [CrossRef]
  83. Craine, J.M.; Morrow, C.; Fierer, N. Microbial Nitrogen Limitation Increases Decomposition. Ecology 2007, 88, 2105–2113. [Google Scholar] [CrossRef]
  84. Li, J.H.; Cheng, B.H.; Zhang, R.; Li, W.J.; Shi, X.M.; Han, Y.W.; Ye, L.F.; Ostle, N.J.; Bardgett, R.D. Nitrogen and phosphorus additions accelerate decomposition of slow carbon pool and lower total soil organic carbon pool in alpine meadows. Land Degrad. Dev. 2021, 32, 1761–1772. [Google Scholar] [CrossRef]
  85. Fang, X.-M.; Zhang, X.-L.; Chen, F.-S.; Zong, Y.-Y.; Bu, W.-S.; Wan, S.-Z.; Luo, Y.; Wang, H. Phosphorus addition alters the response of soil organic carbon decomposition to nitrogen deposition in a subtropical forest. Soil Biol. Biochem. 2019, 133, 119–128. [Google Scholar] [CrossRef]
  86. Zhang, F.; Niu, J.; Zhang, W.; Chen, X.; Li, C.; Yuan, L.; Xie, J. Potassium nutrition of crops under varied regimes of nitrogen supply. Plant Soil 2010, 335, 21–34. [Google Scholar] [CrossRef]
  87. Xu, X.; Zhang, W.; Xu, M.; Li, S.; An, T.; Pei, J.; Xiao, J.; Xie, H.; Wang, J. Characteristics of differently stabilised soil organic carbon fractions in relation to long-term fertilisation in Brown Earth of Northeast China. Sci. Total Environ. 2016, 572, 1101–1110. [Google Scholar] [CrossRef] [PubMed]
  88. Das, R.; Purakayastha, T.J.; Das, D.; Ahmed, N.; Kumar, R.; Biswas, S.; Walia, S.S.; Singh, R.; Shukla, V.K.; Yadava, M.S.; et al. Long-term fertilization and manuring with different organics alter stability of carbon in colloidal organo-mineral fraction in soils of varying clay mineralogy. Sci. Total Environ. 2019, 684, 682–693. [Google Scholar] [CrossRef]
  89. Gan, H.Y.; Schöning, I.; Schall, P.; Ammer, C.; Schrumpf, M. Soil Organic Matter Mineralization as Driven by Nutrient Stoichiometry in Soils Under Differently Managed Forest Stands. Front. For. Glob. Change 2020, 3, 99. [Google Scholar] [CrossRef]
  90. Tipping, E.; Somerville, C.J.; Luster, J. The C:N:P:S stoichiometry of soil organic matter. Biogeochemistry 2016, 130, 117–131. [Google Scholar] [CrossRef]
  91. Zhao, X.; Nafziger, E.; Pittelkow, C. Nitrogen rate strategies for reducing yield-scaled nitrous oxide emissions in maize. Environ. Res. Lett. 2017, 12, 124006. [Google Scholar] [CrossRef]
  92. Zeng, W.; Wang, W. Combination of nitrogen and phosphorus fertilization enhance ecosystem carbon sequestration in a nitrogen-limited temperate plantation of Northern China. For. Ecol. Manag. 2015, 341, 59–66. [Google Scholar] [CrossRef]
  93. Voltr, V.; Menšík, L.; Hlisnikovský, L.; Hruška, M.; Pokorný, E.; Pospíšilová, L. The Soil Organic Matter in Connection with Soil Properties and Soil Inputs. Agronomy 2021, 11, 779. [Google Scholar] [CrossRef]
  94. Farahani, E.; Emami, H.; Fotovat, A.; Khorassani, R. Effect of different K:Na ratios in soil on dispersive charge, cation exchange and zeta potential. Eur. J. Soil Sci. 2019, 70, 311–320. [Google Scholar] [CrossRef]
  95. Xinghua, S.; Aibin, W. Organic carbon and black carbon with fertilization in paddy and upland soils. J. Zhejiang AF Univ. 2014, 31, 554. [Google Scholar] [CrossRef]
  96. Li, Z.; Li, L.; Xia, S.; Zhang, R.; Zhang, R.; Chen, P.; Pan, J.; Liu, Y. K fertilizer alleviates N2O emissions by regulating the abundance of nitrifying and denitrifying microbial communities in the soil-plant system. J. Environ. Manag. 2021, 291, 112579. [Google Scholar] [CrossRef] [PubMed]
Figure 1. The impact of a reduction in N addition on the soil organic carbon and labile carbon fractions: TOC (a) and NFF (b), along with the LLB_C (less labile carbon) (c). Note: FP = high N addition via farmer practices; FS = reduced N addition via SSNM; FZ = No additional N fertilizer. The lines above and below the bars represent the maximum and minimum values, respectively. The line inside the bar graph indicates the average value for each individual N addition. ƞ2 = estimated effect size. The statistically significant group, which includes different small brown hyphenates, is denoted as a, b, and c.
Agronomy 14 02587 g001
Figure 2. The impact of the N addition pattern on the labile carbon fractions: POXC (a), and LB_C (b). Typical farmer practices (FPs); lower N via SSNM (FS); no fertilizer (FZ). Note: The lines above and below the bars represent the maximum and minimum values, respectively. The line inside the bar graph indicates the average value for each individual N addition. ƞ2 = estimated effect size. The statistically significant group, which includes different small brown hyphenates, is denoted as a and b.
Agronomy 14 02587 g002
Figure 3. The impact of the N addition pattern on the stable carbon fractions: NLB_C (a), FF (b), and Passive_C (c). Typical farmer practices (FPs); N addition via SSNM (FS); no fertilizer added (FZ). Note: The lines above and below the bars represent the maximum and minimum values, respectively. The line inside the bar graph indicates the average value for each individual N addition. ƞ2 = estimated effect size. The statistically significant group, which includes different small brown hyphenates, is denoted as a and b.
Agronomy 14 02587 g003
Figure 4. The impact of the N addition pattern on the availability of P and exchangeable K; the P via Bray II method (a), the P via Malachite method (b), and Exch. K (c). Typical farmer practices (FPs); N addition via SSNM (FS); no fertilizer added (FZ). The lines above and below the bars represent the maximum and minimum values, respectively. The line inside the bar graph indicates the average value for each individual N addition. The statistically significant group, which includes different small brown hyphenates, is denoted as a and b. (b) does not display any available P(M) data for the FZ treatment.
Agronomy 14 02587 g004
Figure 5. The impact of the N addition patterns on the availability of N: NH4+_DS (a), NO3_DS (b), NH4+_FS (c), and NO3_ FS (d). Note: FP = high N addition via farmer practices; FS = reduced N addition via SSNM; FZ = no additional N fertilizer. The lines above and below the bars represent the maximum and minimum values, respectively. The line inside the bar graph indicates the average value for each individual N addition. The statistically significant group, which includes different small brown hyphenates, is denoted as a, b, and c.
Agronomy 14 02587 g005
Figure 6. The heatmap illustrates the correlation coefficient relationship between carbon fractions and TOC in FZ (a), FS (b), and FZ (c). Note: * p < 0.05, ** p < 0.01, *** p < 0.001; blue = positive correlation; brown = negative correlation; dark blue = stronger positive correlation; dark brown = stronger negative correlation.
Agronomy 14 02587 g006aAgronomy 14 02587 g006b
Figure 7. The impact of the N addition patterns on LLB_C/K (a), LLB_C/NO3_FS (b), LLB_C/P(B) (c), and LLB_C/P(M) (d). Typical farmer practices (FPs); N added via SSNM (FS); no fertilizer added (FZ). Note: The lines above and below the bars represent the maximum and minimum values, respectively. The line inside the bar graph indicates the average value for each individual N addition. ƞ2 = estimated effect size. The statistically significant group, which includes different small brown hyphenates, is denoted as a, b, and c. (d) shows no available data for the FZ treatment.
Agronomy 14 02587 g007
Figure 8. The heatmap displays the correlation coefficient link in FP (a), FS (b), and FZ (c) treatments between the ratio of LLB_C to NO3-_FS, P (via Bray II and Malachite methods), exchangeable K, and TOC. Note: * p < 0.05, ** p < 0.01, *** p < 0.001; blue = positive correlation; brown = negative correlation.
Agronomy 14 02587 g008
Figure 9. Schematic representation of reduced nitrogen input decreasing N availability, leading to a reduction in recalcitrant carbon content (i.e., FF on soil organic carbon in arable soils).
Agronomy 14 02587 g009
Table 1. Comparing the amounts of N additions via farmer practices (FPs) and N recommendations based on soil analysis (FS) and determining the amounts of P2O5 and K2O for every individual crop.
Crop
(No of Plot),
Age: YearFPFSFZFPFSFZFPFSFZFertilizer Used in FP Treatment
N (kg ha−1)P2O5 (kg ha−1)K2O (kg ha−1)
Banana
(3)
2
3
5
14
14
14
3
2
2
0
0
0
0
0
0
1
1
1
0
0
0
0
0
0
2
2
2
0
0
0
46-0-0
46-0-0
46-0-0
Cabbage
(2)
20
20
575.5
182.8
93.8
62.5
0
0
0
182.8
31.3
31.3
0
0
0
295.3
62.5
62.5
0
0
46-0-0
13-13-21
Garlic
(2)
17
41
77.5
135
62.5
93.8
0
0
92.5
135
31.3
31.3
0
0
112.5
135.0
31.3
31.3
0
0
18-24-24,13-13-21
18-18-18
Litchi (1)20211175021122021144.0015-15-15
Maize
(2)
20
20
168.8
115
31.3
31.3
0
0
75
0
18.8
62.5
0
0
75
0
39
39
0
0
46-0-0,15-15-15
46-0-0
Mango
(2)
20
20
575
163
47
47
0
0
163
0
16
63
0
0
0
263
39
39
0
0
46-0-0,16-20-0
46-0-0,0-0-60
Rice
(2)
36
36
80
230
37.5
37.5
0
0
100
0
0
0
0
0
0
0
0
0
0
0
16-20-0
46-0-0
Note: In FS treatment, the ratios of N, P2O5, and K2O applied in synthetic fertilizer form were 46-0-0, 18-46-0, and 0-0-60. Cropping system of individual year: Only one type of crop was present in the studied plots, including banana, litchi, and mango. The individual plots of cabbage, garlic, maize, and rice are cultivated biannually. The number displayed in the light green background area represents the amount of N added to our study.
Disclaimer/Publisher’s Note: The statements, opinions and data contained in all publications are solely those of the individual author(s) and contributor(s) and not of MDPI and/or the editor(s). MDPI and/or the editor(s) disclaim responsibility for any injury to people or property resulting from any ideas, methods, instructions or products referred to in the content.

