Article

Appropriate Planting Density Can Improve the Storage Root Yield and Commercial Features of Sweet Potato (Ipomoea batatas L.) by Optimizing the Photosynthetic Performance

1
Institute of Nanfan & Seed Industry, Guangdong Academy of Sciences, Guangzhou 510316, China
2
Key Laboratory for Quality Regulation of Tropical Horticultural Crops of Hainan Province, Hainan University, Haikou 570228, China
3
School of Breeding and Multiplication (Sanya Institute of Breeding and Multiplication), Hainan University, Sanya 572025, China
*
Authors to whom correspondence should be addressed.
These authors contributed equally to this work.
Agronomy 2024, 14(11), 2579; https://doi.org/10.3390/agronomy14112579
Submission received: 1 October 2024 / Revised: 22 October 2024 / Accepted: 30 October 2024 / Published: 1 November 2024
(This article belongs to the Section Agroecology Innovation: Achieving System Resilience)

Abstract

:
Planting density is a crucial factor in sweet potato output. However, the relationship among photosynthetic performance, yield, and storage root commercial features that respond to planting density is not well understood. We conducted a three-year field experiment with four planting densities (83,280 plants hm−2, plant spacing 15 cm, D15; 62,520 plants hm−2, plant spacing 20 cm, D20; 50,025 plants hm−2, panting spacing 25 cm, D25; and 41,640 plants hm−2, 30 cm, D30; 80 cm row space for all) to investigate the dynamic of photosynthetic performance, dry matter, yield, carbohydrate metabolism, and commercial features of storage root. The result showed that the highest yield was observed in the D20 treatment, and the yield increment was by 8.47–24.92% when compared to the D25 control treatment during the three growth periods. The observation can be attributed to the fact that appropriate planting density D20 can shape a good canopy structure to improve photosynthetic performance by significantly increasing IPAR, TPAR, light transmission, and extinction coefficient through different canopy levels. Hence, the Pn, Tr, Ci, Gs and WUE, and the chlorophyll fluorescence parameters were significantly improved. Eventually, promoting root sink development by up-regulating starch, fructose, glucose, and sucrose in storage roots, resulting in vigorous carbon flux from the source toward the root sink. Therefore, the optimal planting density D20 treatment increased individual plant yield and commercial features by increasing the number of storage roots, particularly medium-sized ones. Herein, we claim that optimizing the plant population density of sweet potatoes can be a good way to increase the yield and commercial features, and our results are great and important for improving the market value and profits of sweet potatoes.

1. Introduction

Sweet potato (Ipomoea batatas L.), being one of the most important staple food crops worldwide, is characterized as the sixth most widely cultivated crop globally [1]. It is widely consumed due to its exquisite flavor and health benefits, and China is the world’s largest producer of sweet potatoes [2,3]. On sweet potatoes, at a given planting density, the final yield is determined by the storage root number and storage root fresh weight of individual plants [4]. Increasing the storage root number per plant, on the one hand, can significantly increase the yield, but more importantly, it can improve the storage root appearance by reducing individual storage root fresh weight and ratio of length/diameter, which results in a better storage root commercial feature [5]. Hence, balancing the relationship between the storage root number and the storage root fresh weight of the individual plants is the key point to improve the final yield and commercial feature of sweet potato. At the canopy closure period, the sweet potato storage roots (root sink) had formed, and the storage root number was almost certain. Photo assimilation is the main component that deposits in those root sinks to enlarge the root size. Therefore, lengthening the photosynthetic duration is the optimal strategy to tap the yield potential of sweet potatoes. At a given population scale, the canopy ‘source capacity’ will reach a stable level. Hence, the key factor in increasing yield and storage root commercial feature strongly relies on the photo assimilation from the source whose expenditure would facilitate more storage root formation in the closure period and whose allocation to each root sink during the bulking period was more evenly. However, the underlying mechanism to balance the relationship between storage root number and storage root fresh weight of individual plants that are regulated by planting density is still unclear.
Planting density is an important agronomic component that influences crop output potential [6]. Individual competition among plants that responds to planting density mostly through canopy structure light absorption and root system nutrition uptake [7]. Planting density is one of the determining factors in crop interception of radiation by regulating the canopy structure. Intercepted photosynthetically active radiation (IPAR) reflects the level of light capture and uptake absorption. Canopy IPAR is extremely associated with the canopy structure, which is strongly linked to leaf physiological and morphological traits, such as leaf area index, leaf nitrogen content, specific leaf area, and canopy micro-environments like canopy temperature and humidity [8]. The technique to increase sunlight energy use efficiency is also strongly tied to proper canopy structure. In cereal crops such as maize [9] and wheat [10], an appropriate planting density has been shown to boost production by enhancing canopy leaf exposure to light.
The chlorophyll fluorescence is a nondestructive evaluation of PSII reaction center activity in individual plants. Among these parameters, the YII measures light energy capture efficiency, which reflects the actual direct sunlight energy conversion efficiency of the PSII reaction center [11]. Fv/Fm, the maximal photochemical efficiency of PSII, determines the potential quantum efficiency of PSII [12]. The external light environment has a normal influence on the electron transport rate (ETR) [13]. The non-photochemical quenching (NPQ) and coefficient of photochemical quenching (qP) are two important parameters to represent the degree of openness of the PSII reaction center, with a higher qP resulting in increased electron transfer activity in PSII [14]. Leaf gas exchange plays an important role in photoassimilation and crop yield determination [15]. However, the individual plant under dense planting can significantly decrease the stomatal conductance (Gs) and intercellular carbon dioxide concentration (Ci), which has a negative impact on the photosynthetic system [16]. CO2 concentration is strongly linked with net photosynthetic rate, which varies depending on species and environmental conditions [17]. Plants with low planting density have reduced chlorophyll content, a greater electron transfer rate, and ribulose-1,5-bi-phasphate carboxylase/oxygenase when compared to dense planting conditions [18]. The vigor of carbon flow to the sink is an important factor in determining sweet potato yield, which is determined by the source capacity, such as photo assimilation and transportation activity, as well as the sink strength, which is primarily determined by the number of storage roots per plant and the weight of each storage root. Starch, a major component of store roots, is produced by the sucrose-starch conversion process, which involves several enzyme activities. Previous studies have shown that boosting the enzymic activity of AGPase, SSS, SBE, and GBSS can promote starch production and deposition in the sink, leading to sink formation [5,19]. The distribution and accumulation of dry biomass in the root system is a critical component in defining sweet potato storage root production and development, as well as influencing the root-to-shoot ratio. A reasonable root/shoot ratio is heavily reliant on a balance of shoot and root development, which promotes sink creation and growth.
We hypothesize that optimal planting density not only shapes a reasonable canopy structure to improve sunlight distribution and individual photosynthesis but also coordinates individual plant development by enhancing the relationship between individual and population plant growth and development, resulting in higher yield. Furthermore, optimal planting density can enhance photo-assimilate to facilitate storage root formation, thus increasing storage root number, which sculpts a good storage root appearance by enhancing the uniformity of storage root fresh weight, ultimately improving commercial features. The objectives of this study were to investigate (1) the performance of photosynthetic characteristics, such as canopy sunlight distribution and individual photosynthesis responses to planting densities, (2) the relationship between photosynthetic assimilation to the root sink and photosynthetic characteristics during storage root bulking period, and (3) the relationship between storage root appearance and photosynthetic performance.

2. Materials and Methods

2.1. Experimental Materials

Fertilizers used in this experiment included urea (N 46%, Sinopec, Co., Ltd., Dongfang, China), calcium superphosphate (P 16%, SDIC Xinjiang Lop Nur Potassium Salt Co., Ltd., Hami, China), and potassium sulfate (K 52%, Guangdong Zhanhua Group Co., Ltd., Zhanjiang, China).

2.2. Experimental Design

Three-year field trials were conducted from November 2021 to March 2023, with the first round taking place on 3 November 2021 and ending on 21 February 2022 at Hainan University (20°06’ N, 110°33’ E). The second round started on 19 March 2022 and ended on 5 July 2022, while the third one began on 31 October 2022 and was completed on 5 March 2023, both were set in the Breeding Base of the Institute of Nanfan & Seed Industry, Guangdong Academic of Science at Yazhou District, Sanya City, Hainan province (18°21’ N, 109°9’ E). The soil physical and chemical properties at the 0–30 cm soil tillage layer were described in Table S1. The climate characteristics during the three-round experiments are detailed in Table S2. Sweet potato Yanshu25 (Yan-25), a popular type grown in China and known for its orange-fresh flavor, was chosen for this experiment. Vegetative terminal cuttings of around 25 cm in length that were virus-free were used. The field trials were arranged as a complete randomized block design (CRBD) for three replications; each plot area was 30 m2 (6 m × 5 m). We set four planting densities, namely, D15 (83,280 plants hm−2), D20 (62,520 plants hm−2), D25 (50,025 plants hm−2, as control), and D30 (41,640 plants hm−2). For all treatments, the plant spacing was 15, 20, 25, and 30 cm, with a row distance of 80 cm for all. Before sowing, each treatment plot received N 120 kg ha−1, P 112 kg ha−1, and K 240 kg ha−1 as base fertilizer. Stem cuttings that were virus-free and grown with four stem inter-nodes were sown in the soil using the oblique planting method. Throughout the experiment, field management approaches were consistent with local high-yield field practice.

2.3. Sampling Method

The sampling times were arranged at 50, 70, 90, and 110 days after planting. Before sampling, the functional leaf (the 4th or 5th fully-expand leaf from the main stem terminal) had its SPAD (chlorophyll content), photosynthetic characteristics, chlorophyll fluorescence performance were measured, and plant population canopy photosynthetically active radiation (PAR) measured. Five representative plants were randomly selected at random from each treatment. Each plant was divided into the shoot and root systems for further analysis.

2.4. Physiological Analysis

2.4.1. Functional Leaf SPAD Value and Leaf Nitrogen Content

A hand-held chlorophyll meter was used to measure the functional leaves SPAD value (chlorophyll content) and leaf nitrogen content (TYS-4N, Beijing Jinkelida Electronic Technology Co., Ltd., Beijing, China). Nine functional leaves from each treatment were selected for measurement. Each leaf was measured twice at the same sites in the middle part of the leaf.

2.4.2. Photosynthetic Characteristic

Seven functional leaves from each treatment were measured at 1800 µmol m−2 s−1 of light on a sunny morning from 9:00 a.m. to 12:00 p.m. The CO2 content in the leaf chamber was kept constant at 400 µmol L−1. Leaf photosynthetic rate (Pn), stomatal conductance (Gs), transpiration rate (Tr), and intercellular carbon dioxide concentration (Ci) were measured using a portable photosynthesis system (LI-6400, Li-Cor, Lincoln, NE, USA). Furthermore, water use efficiency (WUE) was formulated as follows [20]:
WUE = Pn/Tr

2.4.3. Chlorophyll Fluorescence Measurements

A PAM-2500 High-performance field and laboratory chlorophyll fluorometer from Heinz Walz GmbH Co., Ltd., Nürnberg, Germany, measured the maximum quantum efficiency of PS II (Fv/Fm), the quantum yield of photosystem II (Y(II)), photo-chemical quenching (qP), non-photochemical quenching (NPQ), and electron transport rate (ETR) [21].

2.4.4. Canopy Photosynthetic Measurement

During the canopy closure period, the SUNSCAN Canopy Analysis System (Delta-T Device Co., Ltd., Burwell, UK) measured intercepted photosynthetically active radiation (IPAR) (measure site: 10 cm above the canopy), transmitted photosynthetically active radiation (TPAR) (measure site: 10 cm above the ground), and leaf area index (LAI). The extinction coefficient (k value) was computed as [22]:
K = −ln (TPAR/IPAR) × LAI−1

2.4.5. Agronomic Traits

The fresh weight, number of branches, main stem length, average branch length, and stem base diameter, as well as storage root diameter and fresh weight, were measured or calculated. The plant organs were collected and steamed at 105 °C for 30 min to gain constant dry weight at 80 °C. Then the Root/shoot ratio = Root dry biomass/shoot dry biomass × 100%; Organ dry biomass allocation rate = Organ dry biomass/total plant dry biomass × 100% was calculated.

2.4.6. Storage Root Yield, Yield Component, and Commercial Traits

According to the grading standards of Villordon (2013) [23] and Si (2022) [24], the roots whose diameter reached 1.00 cm above are storage roots. At harvest time, all storage roots were dug out. The average storage root number per plant, average storage root weight, and yield were calculated. The storage roots of five representative plants of per plot were measured, and their length/diameter ratio (L/D) has been used to define shape in agricultural goods, with an L/D ratio of 1 indicating that the object is circular. The uniformity of storage root weight is expressed by the coefficient of variation (CV), CV = standard deviation/average value. The smaller the CV, the better the uniformity of storage root weight. At last, according to the actual production in China in recent years, the storage roots (diameter of storage root 2.00 cm, weight of storage root more than 50.00 g) were classified into large commercial storage root (250–500 g root), medium-sized commercial storage root (100–250 g root) and small commercial storage root (50–100 g root), and the number of commercial storage root of each grade was investigated manually.

2.4.7. Storage Root Carbohydrate Content

The procedure of carbohydrate content determination was optimized. A 250 mg fresh root sample was taken from the −80 °C refrigerators and immediately placed in 5 mL distilled water and extracted by 80 °C water bath for 30 min in a test tube. After cooling to room temperature, the sample was centrifuged at 8000× g rpm for ten minutes under 4 °C. The supernatant was used to determine the contents of starch, sucrose, glucose, and fructose according to the analysis kits produced by the Nanjing Jiancheng Bioengineering Institute (To acquire detailed information, please consult via http://www.njjcbio.com/ (accessed on 1 July 2014)). Each treatment was tested three times.

2.4.8. Real-Time Quantitative PCR Analysis

The frozen storage root total RNA was extracted according to the manual of the Plant Total RNA Isolation Kit Plus (Foregene, RE05024, Chengdu, China). The first-strain cDNA generated by (MonScriptTM RTIII Super Mix with dsDNase (Two-step), Wuhan, China) and real-time quantitative PCR were performed in a 20-µL reaction volume containing 1 × MonAMPTM ChemoHS Qpcr Mix (Monad Biotech, Wuhan, China). Quantitative analysis was conducted by ABI QuanStudioTM5 System under standard mode. The 2−ΔΔCt method calculated relative expression levels from three biological replicates that used the β-actin gene as a housekeeping gene. The primers used for qRT-PCR are listed in Table S3.

2.5. Statistical Analysis

One-way Anova determined statistical analysis with a significant level at p < 0.05 tested by Duncan. The statistical analysis was performed by SPSS 19 and Excel 2019, and the figures were designed by GraphPad Prism software (Version 8.4.2 for Windows).

3. Results

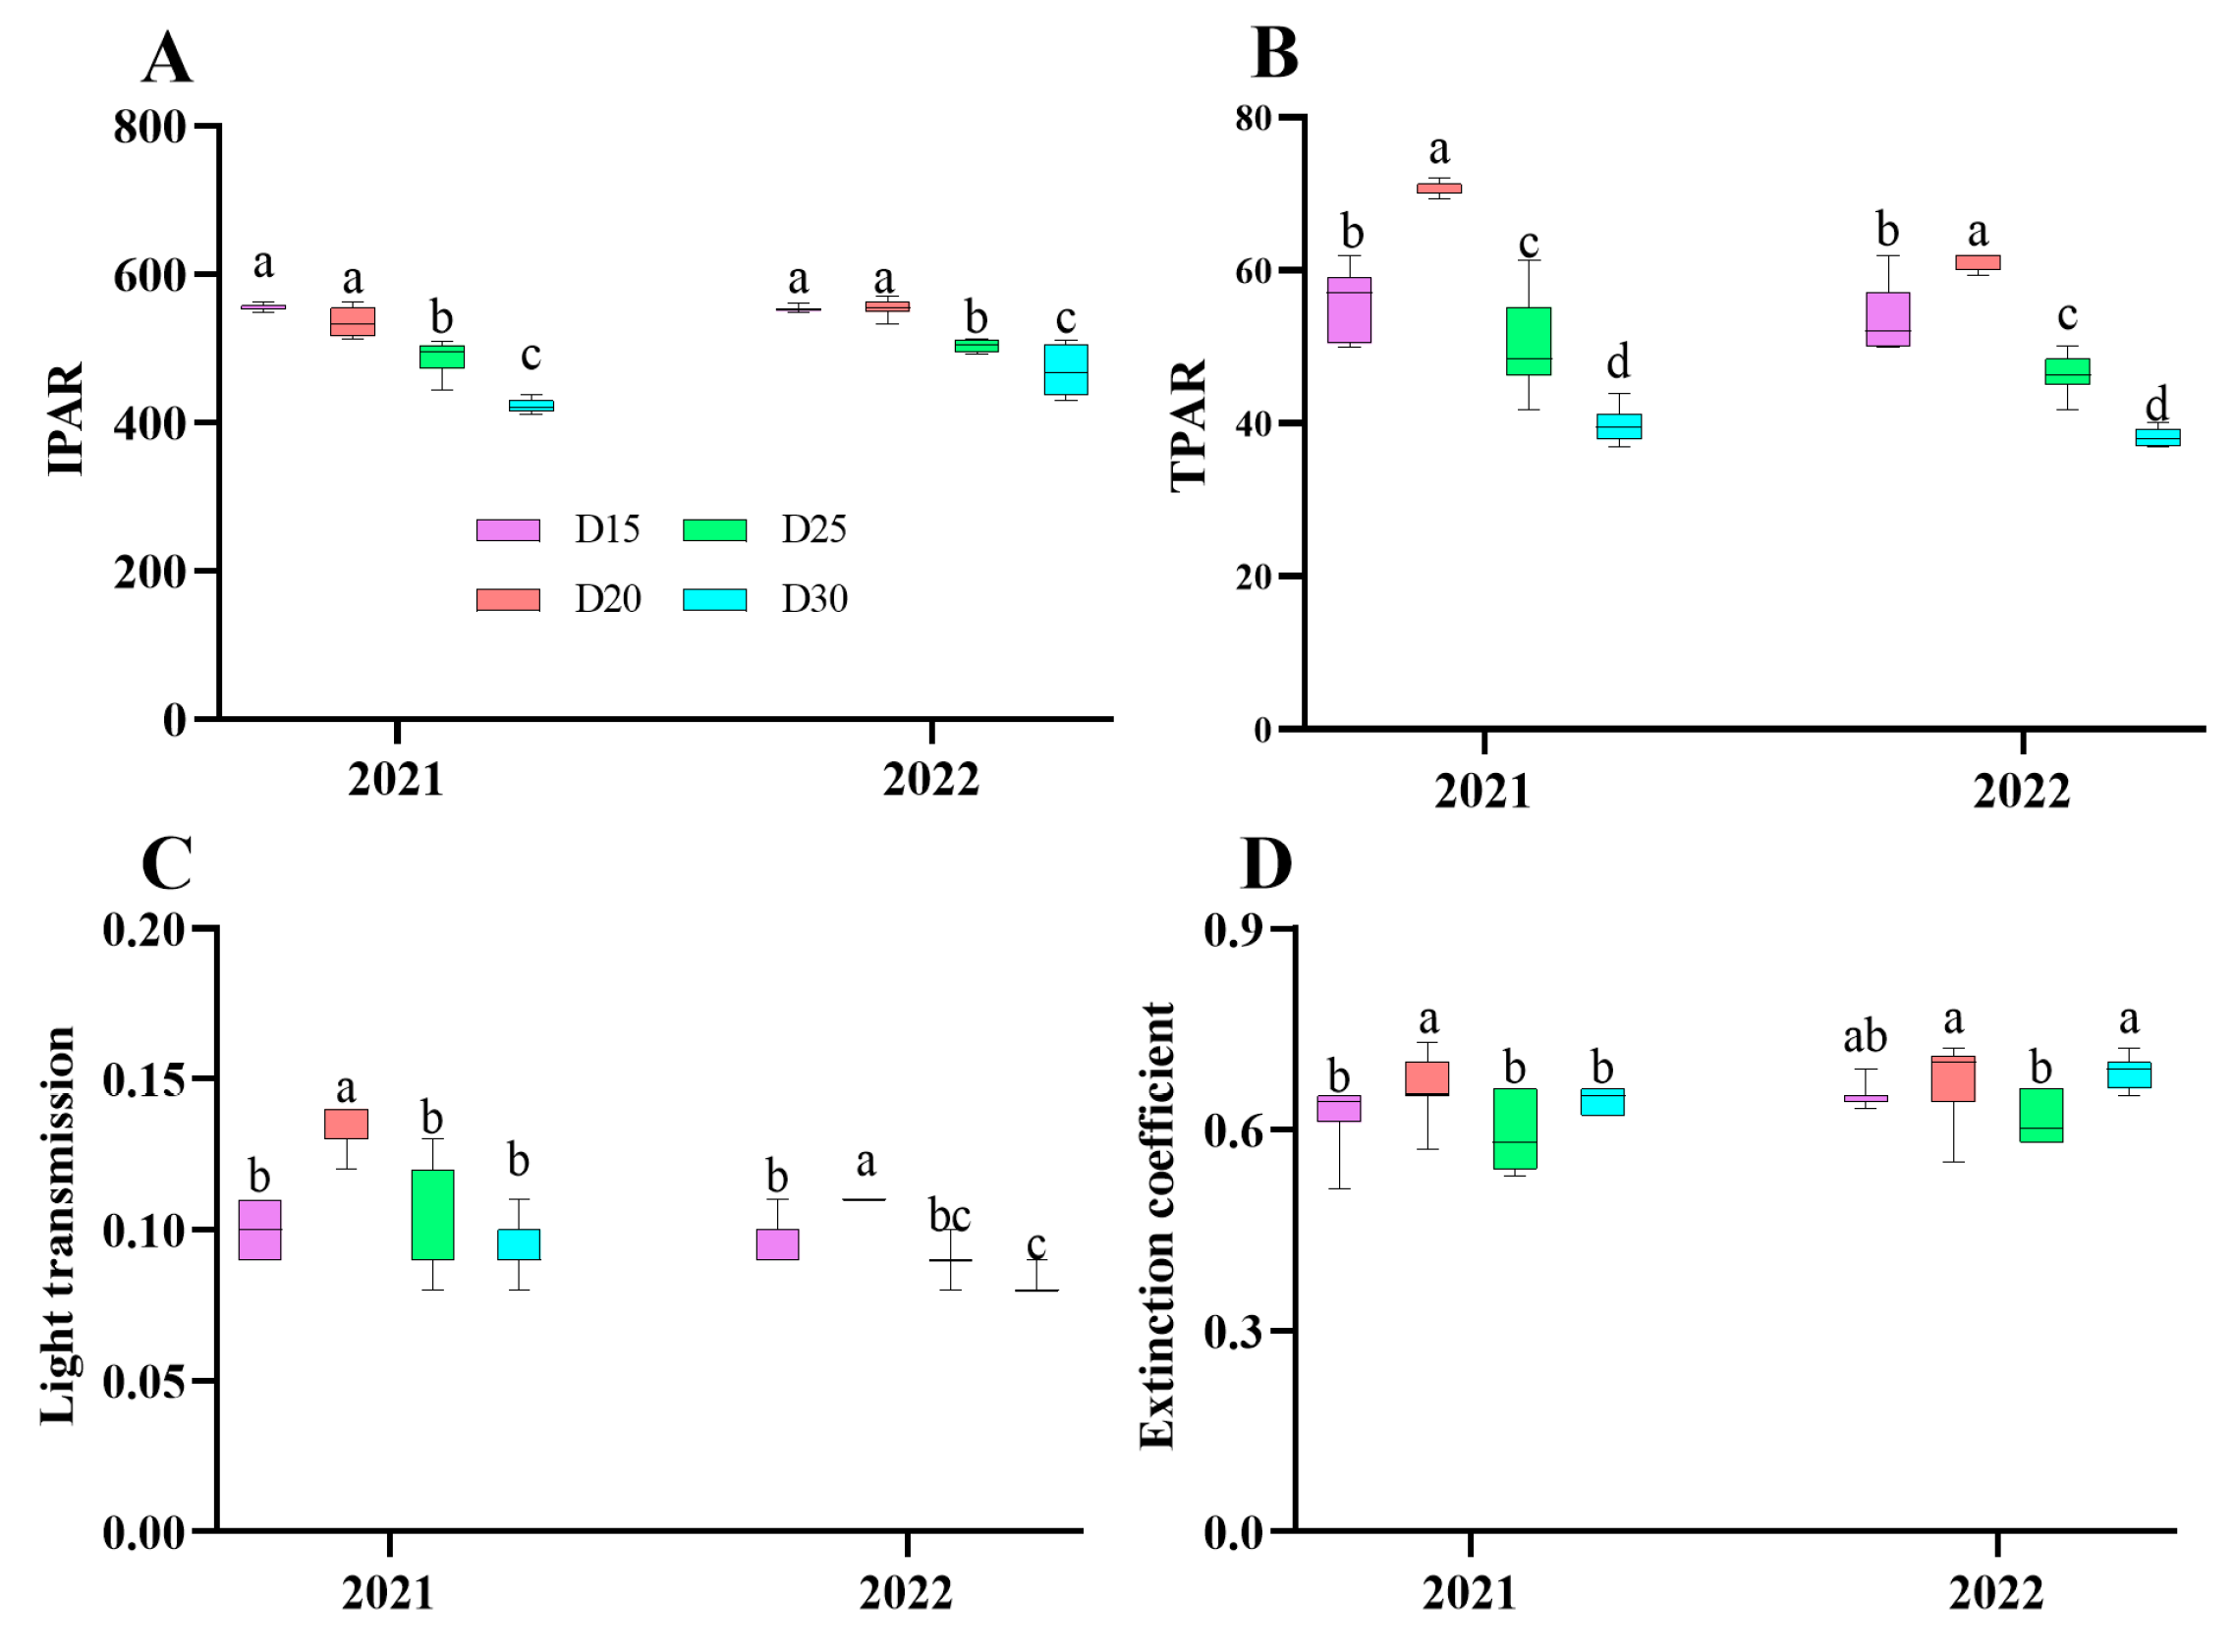
3.1. Canopy Spectrum Parameter

The findings of a field investigation conducted over a period of two years revealed comparable patterns in light transmission, IPAR, TPAR, and extinction coefficient. The initial increase in these parameters was followed by a decrease as the planting density decreased. Notably, the highest value was observed in the D20 treatment, which was significantly higher than the other treatments (p < 0.05; Figure 1). And the average increment of IPAR, TPAR, light transmission, and extinction coefficient value in D20 treatment plants was by 3.55%, 9.63% and 26.77%; 22.03%, 25.03% and 84.61%; 30.12%, 30.25%, and 39.49; 6.45%, 11.86%, and 2.32%, respectively, when compared to the D15, D25, and D30 treatment plants.

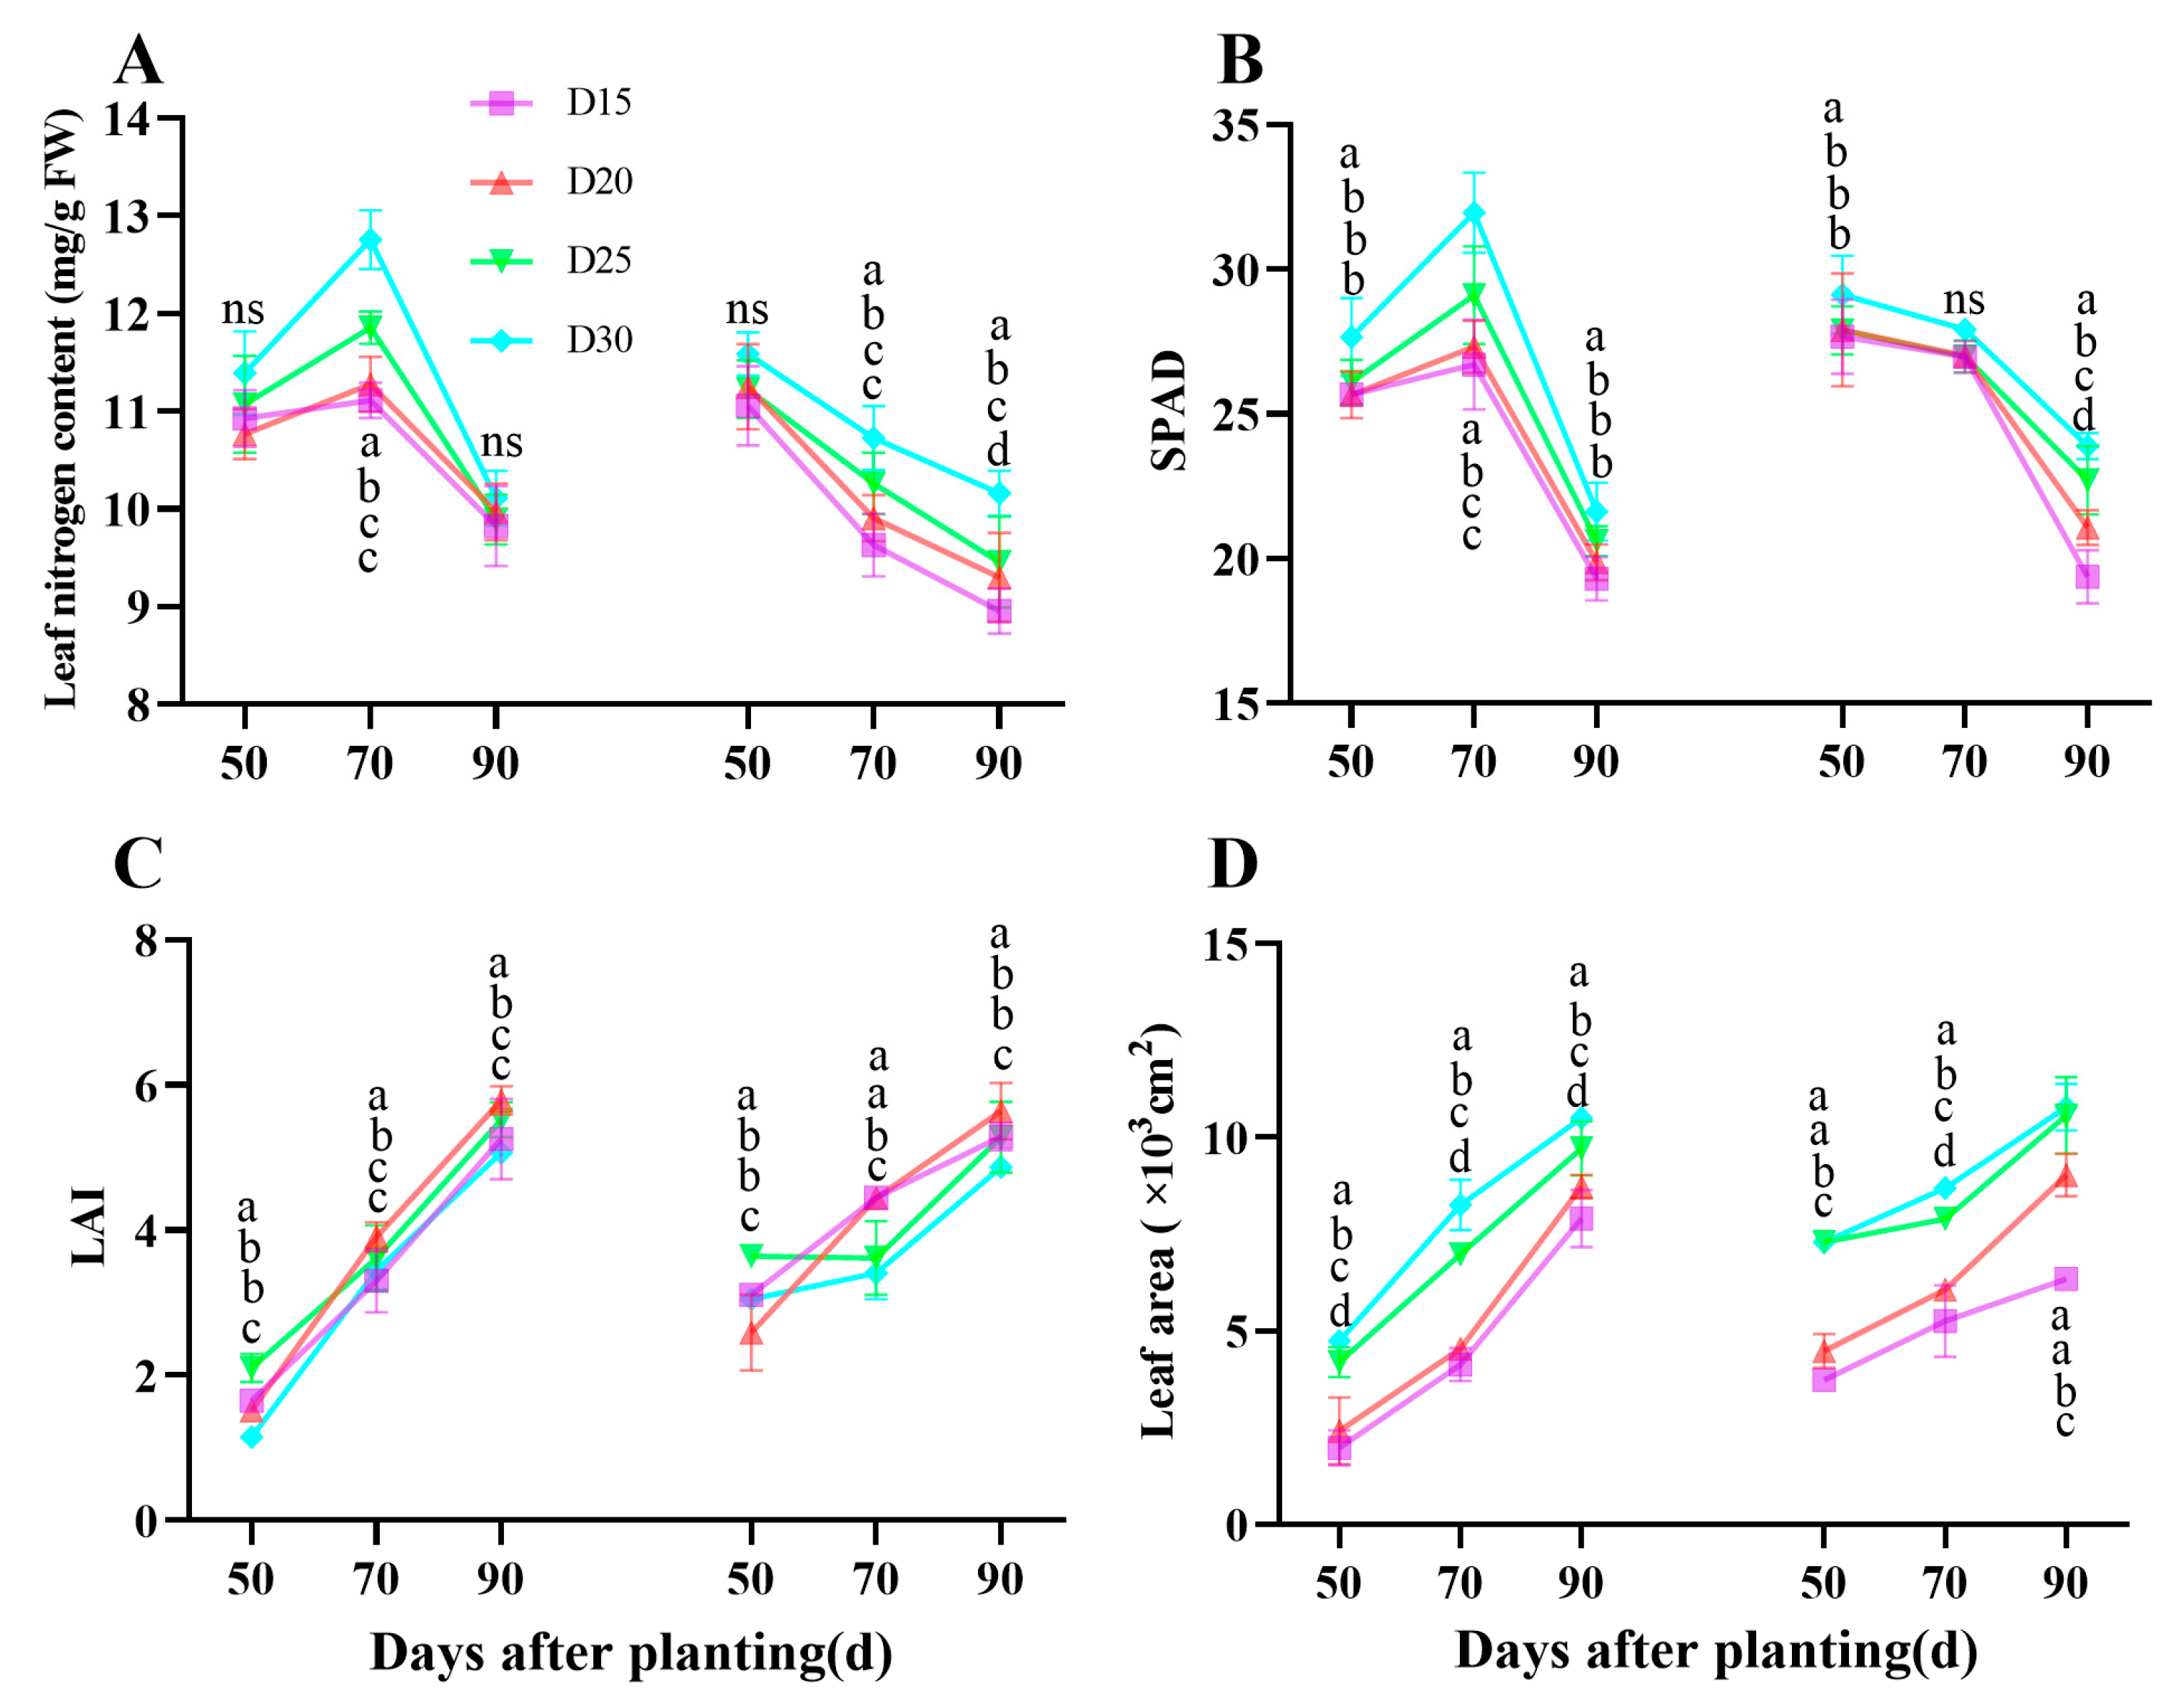
3.2. Leaf Nitrogen Content, Chlorophyll Content, LAI, and LA Characteristics During Bulking Period

A reduction in planting density resulted in a significant increase in leaf nitrogen content, SPAD, and leaf area (p < 0.05; Figure 2A,B,D). The LAI value was found to be greatest in the D20 treatment (p < 0.05; Figure 2C), and the average increment in D20 treatment was by −8.48%, −2.85%, and 31.30%, 18.19%, 7.73%, and 13.37%; 10.28%, 4.7% and 14.20 when compared to the D15, D25 and D30 treatment during the bulking period, respectively.

3.3. Leaf Gas Exchange

As compared with the control D25 treatment, the D20 treatment significantly increased the Pn (p < 0.05; Figure 3A,B) and WUE (p < 0.05; Figure 3I,J), and the average increment of Pn and WUE was 9.25%, 5.19%, and 3.65%; −3.29%, 21.02%, and 12.39%, respectively, during the bulking period. However, Ci and showed insignificant differences (p > 0.05; Figure 3C,D). The Gs were significantly higher in D20 treatment during 50–70 days after planting as compared to the rest of the treatments, while there was no significance among treatments at 90 days after planting (p < 0.05; Figure 3E,F). In contrast, Tr has a similar trend in the two-year experiments. In detail, plants in dense planting (D15 and D20 treatment) had a comparable effect on Tr and were significantly higher than plants in reduced planting density (D25 and D30 treatment) during 50–70 days after planting; however, the opposite effect was detected at 90 days after planting (p < 0.05; Figure 3G,H).

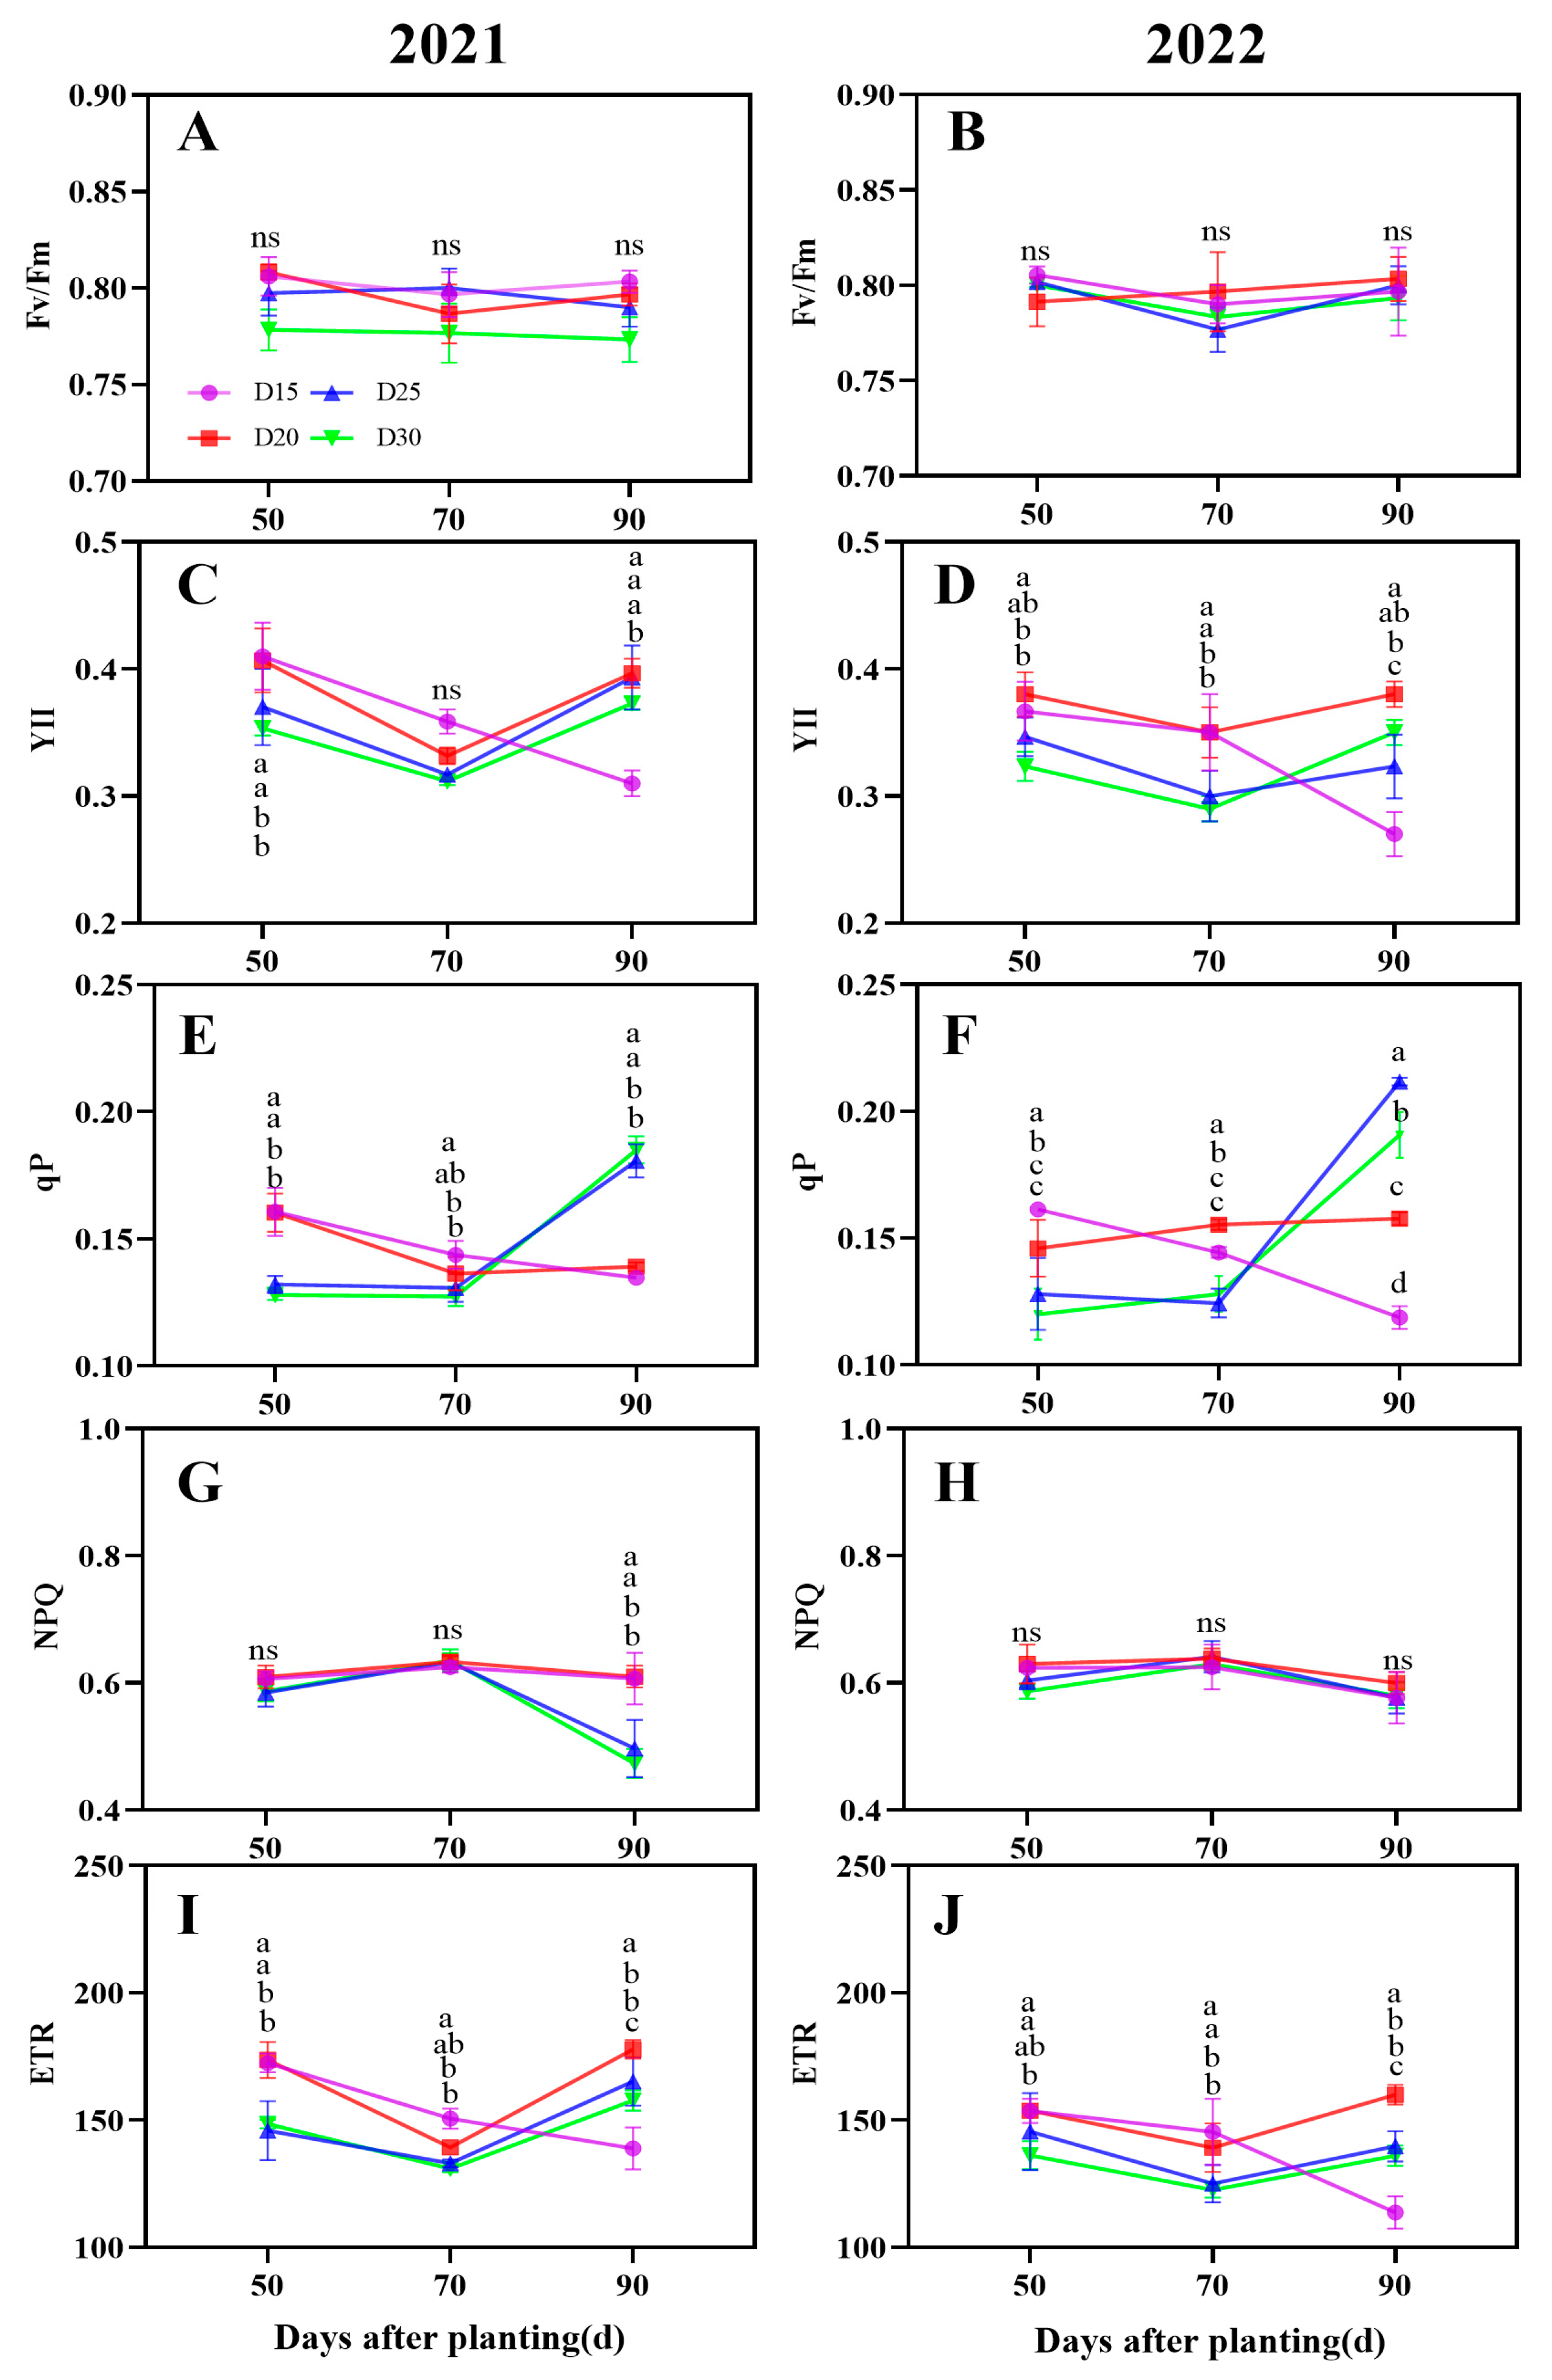
3.4. Chlorophyll Fluorescence Parameters

There was no discernible variation in the Fv/Fm analysis in response to planting density (p > 0.05; Figure 4A,B). Interestingly, the YII and ETR under the plants in dense planting D20 treatment were significantly higher than the plants in the other three treatments during the storage root bulking period (p < 0.05; Figure 4C,D,I,J). Compared to the D25 treatment plants, the average increment of YII and ETR was by 9.90%, 4.66%, and 0.85%, 19.06%, 4.66%, and 7.61%, respectively, during the bulking period. In addition, during the 50–70-day period following planting, the qP parameter value under dense panting plants (D15 and D20 treatment) was significantly greater than that of the plants in low plant density (D25 and D30 treatment), whereas the opposite tendency was observed at 90 days after planting (Figure 4E,F). Furthermore, no discernible variation was seen in the plant NPQ analysis between the D15 and D20 dense planting treatments, and the values of NPQ parameters gradually decreased with the decrease in planting density (Figure 4G,H).

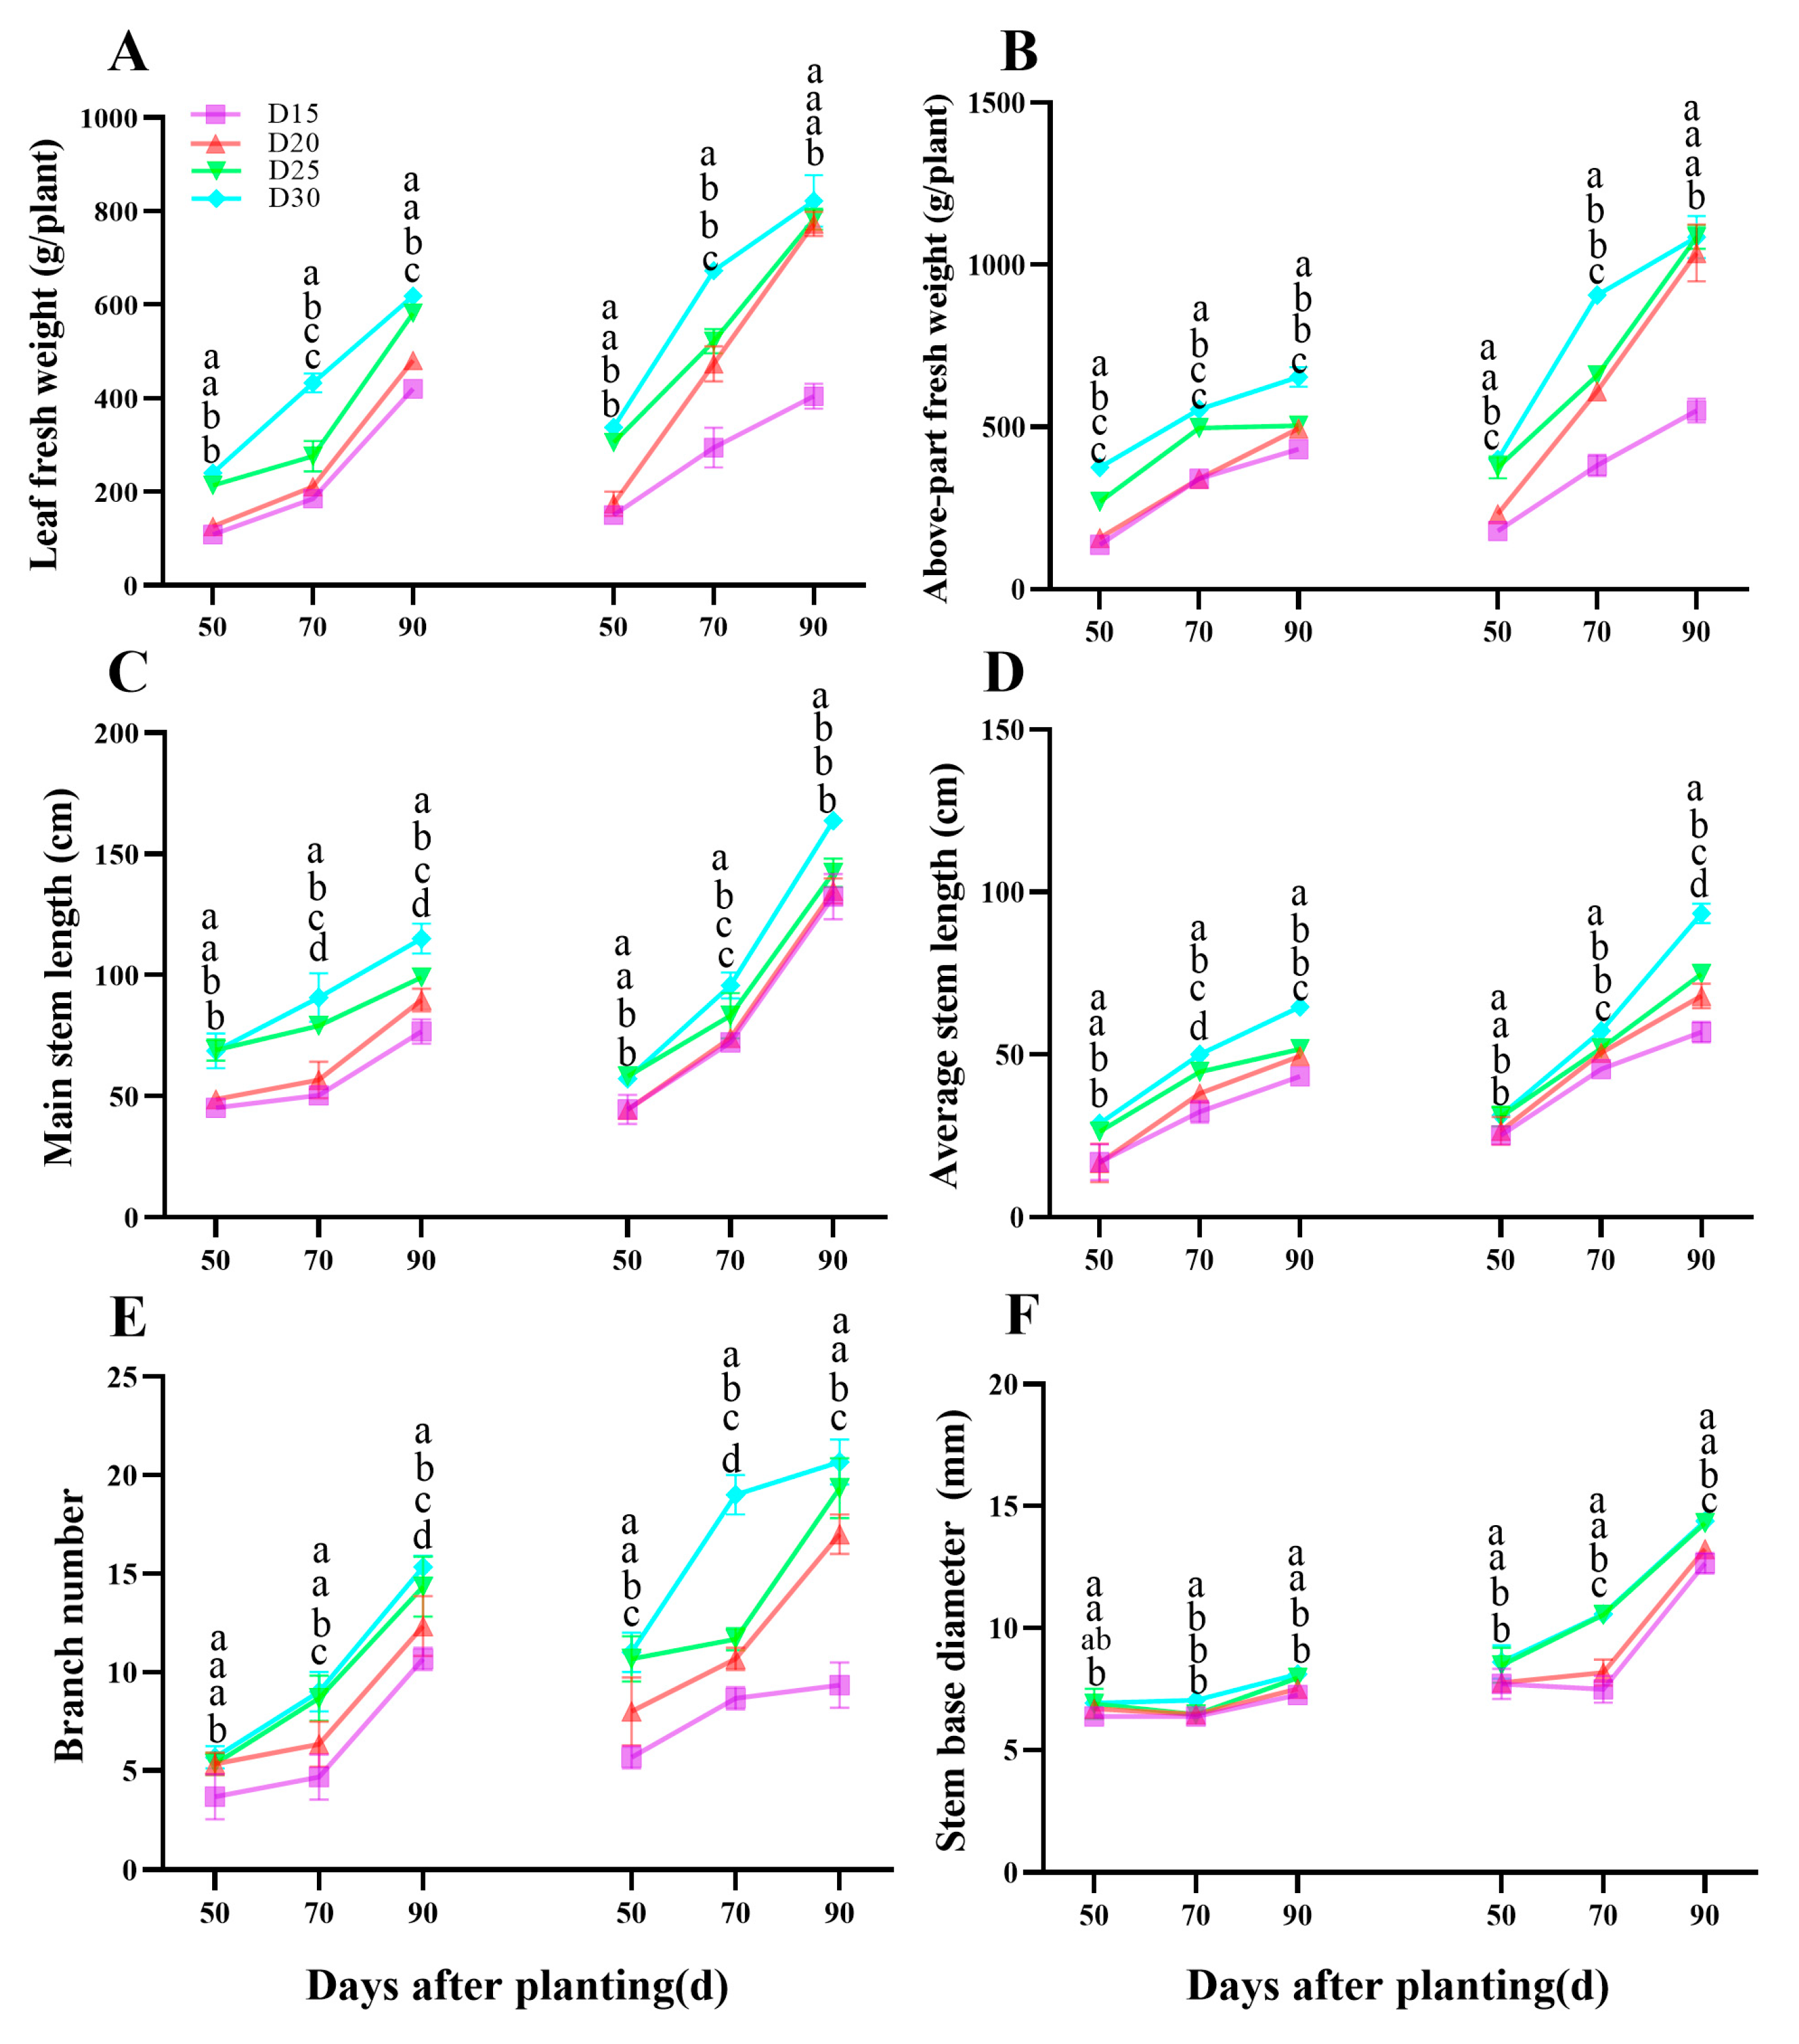
3.5. Above-Part Development

The field studies found a comparable effect on sweet potato above-part development (Figure 5). During the storage root bulking period, decreasing plant population density resulted in substantial increases in leaf fresh weight (Figure 5A), above-part fresh weight (Figure 5B), main stem length (Figure 5C), average stem length (Figure 5D), branch number (Figure 5E) and stem base diameter (p < 0.05, Figure 5F).

3.6. Dry Matter Accumulation and Allocation

Reduced planting density led to significant increases in the above-part dry weight, storage root, and total dry matter weight of individual plants (p < 0.05; Figure 6A,D). In contrast, the plants under dense planting D20 treatment had a comparable effect on dry matter allocation to each plant storage root and shoot as the D30 low planting density treatment (p < 0.05; Figure 6B,E). The D20 treatment plant had a significantly larger root/shoot ratio than other treatments due to a higher allocation of dry matter to storage roots and lower allocation to shoots (p < 0.05; Figure 6C,F). The average increment of root/shoot ratio in D20 treatment plants was by 27.39%, 14.75%, and 9.26%; 112.5%, 27.27%, and 3.84%; 132.5%, 16.67%, and 10.14% during the bulking period when compared to the D15, D25, and D30 treatment plants, respectively.

3.7. Genes Expression Level on Regulating Carbohydrates Metabolism in Storage Root

The expression levels of SuSy (Figure 7A), SSS (Figure 7B), AGPase (Figure 7C), SBE1 (Figure 7D), GBSS (Figure 7E), and SPS (Figure 7F) were found to exhibit a significant increase initially, followed by a decrease in planting density. The highest levels were observed under the D20 treatment, and this difference from the other treatments was statistically significant (p < 0.05; Figure 7). The expression levels of the genes mentioned above in the D20 treatment were, overall, roughly 20–80% greater throughout the store root bulking period than in the other treatments in the storage root sink (Figure 7).

3.8. Carbohydrate Content on Storage Root During Bulking Period

The starch and fructose content was first increased and then decreased with the decrease in planting density, and the maximum value was observed in dense planting D20 treatment plants, which had a significant comparison to other treatments (p < 0.05, Figure 8A, D). Furthermore, the starch content in each treatment steadily increased as the growth period proceeded; the sucrose content grew dramatically as the planting density fell and peaked under the control D25 treatment (p < 0.05, Figure 8B). Furthermore, the glucose content was significantly increased under the D20 treatment compared to the control during 50–70 days after planting but decreased at 90 days after planting in both years (p < 0.05; Figure 8C).

3.9. Storage Root Development Characteristics During Bulking Period

In both years, decreasing planting density resulted in a substantial increase in storage root width and fresh weight (p < 0.05; Figure 9). Additionally, each treatment gradually rose with the growing period (Figure 9).

3.10. Storage Root Characteristics at Canopy Closure Period

Data reveals that planting density had a significant effect on sweet potato storage root characteristics during the canopy closure period (Table 1). As compared with the control D25 treatment, the D20 treatment significantly increased the storage root number, mainly increasing the mature ones during the 2022 and 2023 growth seasons with an increment of 8.25% and 27.24%, respectively. And an increment of 8.99% of developing ones during the 2021 field experiment (p < 0.05; Table 1). Additionally, the average storage root diameter and fresh weight were dramatically increased with planting density deceased (p < 0.05; Table 1).

3.11. Storage Root Yield, Yield Component, and Appearance Quality at Harvest Period

A three-year field experiment showed that planting density had the same influence on storage root yield, yield component, and appearance quality (Table 2). The dense planting D20 treatment resulted in significantly higher storage root yield compared to other treatments, likely due to a greater quantity of storage roots (p < 0.05; Table 2). In addition, the yield increase over three years with D15, D20, and D30 treatment was by 14.41%, 24.92%, −7.14; and by 3.46%, 14.13%, −5.34%; and by 3.69%, 8.47%, −1.51%, when compared to D25 control, respectively. Furthermore, D20 treatment improved storage root appearance quality by reducing length (p < 0.05; Table 2), L/D ratio, and the CV of individual root weight. In contrast, the storage root diameter and average storage root weight were significantly increased with the decrease in planting density (p < 0.05; Table 2).

3.12. Storage Root Commercial Characteristics at Harvest Time

A three-year field experiment found that decreasing planting density led to significant increases in commercial storage root weight and large storage root number (p < 0.05; Table 3). However, compared to the control D25 treatment, the commercial storage root number, especially medium storage root number, and the D20 treatment significantly increased commercial e storage, particularly medium storage root number and yield (p < 0.05; Table 3). Moreover, commercial storage root production increased by 8.96–33.46% in three years compared to D25 treatment (p < 0.05; Table 3).

3.13. Correlation Analysis

The correlation analysis found that the storage root number per plant was positively correlated with the yield. At the same time, storage root fresh weight had a negative correlation with the storage root number and yield (Table 4). The parameters of canopy IPAR, TPAR, Ci, Fv/Fm, as well as NPQ have significant positive correlations with yield and storage root number (Table 4). Additionally, a significant positive correlation between the storage root fresh weight and Pn, Gs, Tr, qP, ΦPSII, and ETR parameters was observed (Table 4).

4. Discussion

Selecting a reasonable planting density can provide a good canopy structure by optimizing the spatial distribution of plants and the structure, ventilation, and light transmittance of the canopy, thus contributing to better light interception and utilization [25,26], which resulting in an improvement of leaf gas exchange and Chlorophyll performance of the individual plant [27]. In this study, we found that the D20 treatment can better shape a canopy structure for optimal light distribution on different canopy layers when compared to the other treatments. Therefore, the IPAR, TPAR, light transmission and extinction coefficient K values were significantly increased (Figure 1). Similar findings were also recorded in maize under different planting densities [28]. Leaf gas exchange measurement is a good way to estimate yield [15]. Otherwise, chlorophyll fluorescence is an important approach to evaluate the light-use efficiency of photosynthesis in plants [29,30,31]. The SPAD value of functional leaves, leaf nitrogen content, leaf area, and leaf area index are important parameters for determining leaf vigor and leaf senescence, which are significant factors influencing crop photosynthesis [32]. In the present study, the result showed that the Pn and WUE in D20 plants were significantly higher than other treatments (Figure 3). This result indicated that plant density has a great effect on leaf stomatal conductance (Figure 3), and optimal plant population density may improve stomatal traits to increase net photosynthetic rate as well as water use efficiency [33]. The leaf pigment, leaf area size, and leaf nitrogen content were linearly related to the photosynthesis and adjusted to respond to the unfavorable environment of high density and exhibited a negative effect with planting density (Figure 2) [34]. However, we found that D20 plants had a significantly higher LAI than other treatments in the whole growth period, especially during the 70–90 days after planting period. That can be concluded that LAI is the main factor in determining the photosynthetic performance and final yield via capturing more light to promote photosynthesis, thus increasing the light use efficiency [35]. Higher maximal PSII quantum yield (Fv/Fm), effective PSII quantum yield (YII), and electron transfer rate (ETR) indicated that the photosynthetic performance of leaves was better [36]. Otherwise, photochemical quenching (qP) and non-photochemical quenching (NPQ) indicated the degree of openness of the PSII reaction center [14]. In the present study, we found that the Fv/Fm was no statistical difference among the treatments (Figure 4), this indicated that there was no shading stress under the field conditions. The (YII) and ETR were significantly increased in D20 treatment plants, while the qP in dense planting (D15 and D20 treatment) was significantly higher than the plants in D25 and D30 treatment plants during 50–70 days after planting period. However, the NPQ has no significant difference among treatments. This indicated that the PSII flux absorbs more energy for the photochemical process in D20 treatment plants, but the non-photochemical quenching process was limited and eventually increased the light use efficiency. The results were consistent with maize [32,37], wheat [38], and soybean [39] when responding to varying planting densities.
Balancing the relationship between source and sink development of individual plants is an important factor in determining crop yield. The allocation and accumulation of dry biomass to the root sink is the main event that occurs during tuber crop yield formation and development [40,41]. In our present study, we found that the total dry weight of individual plants was significantly increased with planting density decrease (Figure 6A,D). However, the allocation of dry matter to the root sink was increased dramatically in high-density plants (Figure 6B,E), which resulted in a higher root/shoot ratio (Figure 6C,F). These results can be explained by the fact that plants with lower planting density had an over-grown shoot development with a higher leaf fresh weight, above-part fresh weight, which can consume large amounts of dry biomass to maintain shoot development (Figure 5A,B). Besides, the longer main and average stem length and more branch number in lower planting density treatment can hinder the photo-assimilation flow to the root sink (Figure 5C–E), eventually decreasing the root/shoot ratio (Figure 6C,F). This indicated that optimal planting density can improve the coordination between root and shoot, which promotes the carbohydrate flux to the sink organs.
Among these genes, the SuSy, SPS, SSS, AGPase, SBE, and GBSS play important roles in carbohydrate metabolism [42,43,44,45]. Sucrose is decomposed into hexoses by both the sucrose synthase and invertase pathways, and the former is the main source for fructose and glucose biosynthesis, which provides the substrate for starch biosynthesis [5,46]. Our results reveal that during the bulking period, the starch and fructose content in storage roots were significantly higher when treated with the D20 appropriate planting density than when treated with the D25 control (Figure 8A,D), and the glucose content in storage root was significantly increased during 50–70 days after planting but decreased sharply at 90 days after planting (Figure 8C); however, the sucrose showed a negative correlation (Figure 8B). That is because appropriate planting density could promote the process of sucrose-starch converse by up-regulating the expression level of the carbohydrate metabolism genes (Figure 7). These results were consistent with a previous study in which sweet potatoes were treated with different potassium levels [46].
Storage root number per plant and single storage root fresh weight are both significant factors in determining the yield and commercial features of sweet potatoes [5,24,47]. In the present study, we found that by increasing the number of storage roots per plant, an appropriate planting density D20 treatment substantially increased storage root yield compared to the control D25 treatment in both years by 8.47–24.91% (Table 2). Besides, appropriate planting density can also improve the appearance by reducing the length/width ratio and increasing uniformity on individual fresh weight of storage root (Table 2). As a result, the commercial features were improved by increasing the commercial storage root number, mainly the middle-sized ones (Table 3). Eventually, the commercial storage root yield significantly increased, and the increment was by 8.96–33.46% compared with the control D25 treatment in the three-year field experiments (Table 3). The increment of yield and commercial features were mainly attributed to the improvement of storage root formation during the canopy closure period (Table 1). In our present study, we found a substantial positive correlation between the number of storage roots and the yield. However, we observed that the fresh weight of the storage roots had an opposing influence on both the yield and the number of storage roots (Table 4). These findings were consistent with the previous study [5]. Furthermore, we found a strong correlation between the photosynthetic performance and the yield and yield components. The IPAR, TPAR, Ci, Fv/Fm, and NPQ showed a positive correlation with both yield and storage root number. On the other hand, Pn, Gs, Tr, qP, YII, and ETR exhibited a positive correlation with storage root fresh weight (Table 4). The findings suggest that the distribution of light throughout the canopy is a crucial element in determining the amount of storage roots. Planting density has a crucial role in influencing micro-climate at different levels of the canopy by controlling the distribution of sunlight. This, in turn, provides suitable atmospheric and soil conditions for the development of adventitious roots during the early growth stage [48]. However, further studies should be undertaken to validate our existing hypothesis. The correlation analysis also suggested that the photosynthesis capacity of individual plants is dependent on root welling. The efficiency of photosynthetic electron transfer and gas exchange are important factors in the deposition and accumulation of photo assimilation in the storage root. These factors contribute to the growth of larger storage roots.

5. Conclusions

Enhancing planting density is a critical factor in increasing agricultural yields. In the three-year field experiment, the yield increment of sweet potato was by 8.47–24.92% during the three growth periods through Haikou and Sanya city under appropriate planting density D20 treatment. The observation can be attributed to the fact that the optimum planting density can improve canopy structure, resulting in better sunlight distribution. Hence, the IPAR, TPAR, light transmission, and extinction coefficient in different canopy layers were significantly increased. As a result, improving individual plants’ photosynthetic performance by increasing the Pn, Tr, Ci, Gs, and WUE, as well as the chlorophyll fluorescence parameters. And eventually enlarge the sink strength by increasing the storage root number, particularly medium-sized ones. Therefore, improving the appearance of storage roots is accomplished by lowering the length/diameter ratio and maintaining a more uniform fresh weight distribution across roots of different sizes. These findings provide a solid foundation for the development of high-value sweet potatoes.

Supplementary Materials

The following supporting information can be downloaded at: https://www.mdpi.com/article/10.3390/agronomy14112579/s1, Table S1: Climatic growth condition for sweet potato.; Table S2: Experimental soil physical and chemical properties; Table S3: Genes primer sequences used in qRT-PCR.

Author Contributions

Q.L.: Writing-Original Draft, Investigation, Conceptualization; H.C. (Hongrong Chen), H.C. (Hailong Chang), J.W. and Y.C. (Yue Chen): Investigation, Methodology; S.K., Y.C. (Yanli Chen) and Y.L.: Writing-Review & Editing; Q.W. and G.Z.: Project administration and Funding acquisition. All authors have read and agreed to the published version of the manuscript.

Funding

This work was supported by the earmarked fund for CARS-10-GW2; GDAS Project of Science and Technology Development (2022GDASZH-2022010102); Specific Research Fund of The Innovation Platform for Academicians of Hainan Province (YSPTZX202206); Provincial scientific research institutions stability support sub-project in 2020 “Breeding and construction of healthy seedling propagation system of new sugarcane varieties (lines)”.

Data Availability Statement

The datasets generated during the current study are available from the corresponding author upon reasonable request.

Conflicts of Interest

The authors declare that they have no conflict of interest.

References

  1. Kumar, S.; Wang, S.; Wang, M.; Zeb, S.; Khan, M.N.; Chen, Y.; Zhu, G.; Zhu, Z. Enhancement of sweetpotato tolerance to chromium stress through melatonin and glutathione: Insights into photosynthetic efficiency, oxidative defense, and growth parameters. Plant Physiol. Biochem. 2024, 208, 108509. [Google Scholar] [CrossRef] [PubMed]
  2. Buettner, D. The Blue Zones Solution: Eating and Living Like the World’s Healthiest People; National Geographic Books: Washington, DC, USA, 2005. [Google Scholar]
  3. Tairo, F.; Mukasa, S.B.; Jones, R.A.C.; Kullaya, A.; Rubaihayo, P.R.; Valkonen, J.P.T. Unravelling the genetic diversity of the three main viruses involved in Sweet Potato Virus Disease (SPVD), and its practical implications. Mol. Plant Pathol. 2005, 6, 199–211. [Google Scholar] [CrossRef] [PubMed]
  4. Ebem, E.C.; Afuape, S.O.; Chukwu, S.C.; Ubi, B.E. Genotype × Environment Interaction and Stability Analysis for Root Yield in Sweet Potato [Ipomoea batatas (L.) Lam]. Front. Agron. 2021, 3, 665564. [Google Scholar] [CrossRef]
  5. Liang, Q.; Chen, H.; Chang, H.; Liu, Y.; Wang, Q.; Wu, J.; Liu, Y.; Kumar, S.; Chen, Y.; Chen, Y.; et al. Influence of Planting Density on Sweet Potato Storage Root Formation by Regulating Carbohydrate and Lignin Metabolism. Plants 2023, 12, 2039. [Google Scholar] [CrossRef] [PubMed]
  6. Lai, Z.; Fan, J.; Yang, R.; Xu, X.; Liu, L.; Li, S.; Zhang, F.; Li, Z. Interactive effects of plant density and nitrogen rate on grain yield, economic benefit, water productivity and nitrogen use efficiency of drip-fertigated maize in northwest China. Agric. Water Manag. 2022, 263, 107453. [Google Scholar] [CrossRef]
  7. Postma, J.A.; Hecht, V.L.; Hikosaka, K.; Nord, E.A.; Pons, T.L.; Poorter, H. Dividing the pie: A quantitative review on plant density responses. Plant Cell Environ. 2020, 44, 1072–1094. [Google Scholar] [CrossRef]
  8. Wang, Z.; Wang, Z.; Ma, L.; Lv, X.; Meng, Y.; Zhou, Z. Straw returning coupled with nitrogen fertilization increases canopy photosynthetic capacity, yield and nitrogen use efficiency in cotton. Eur. J. Agron. 2021, 126, 126267. [Google Scholar] [CrossRef]
  9. Cao, Y.-J.; Wang, L.-C.; Gu, W.-R.; Wang, Y.-J.; Zhang, J.-H. Increasing photosynthetic performance and post-silking N uptake by moderate decreasing leaf source of maize under high planting density. J. Integr. Agric. 2021, 20, 494–510. [Google Scholar] [CrossRef]
  10. Liu, T.N.; Wang, Z.L.; Cai, T. Canopy apparent photosynthetic characteristics and yield of two spike-type wheat cultivars in response to row spacing under high plant density. PLoS ONE 2016, 11, e0148582. [Google Scholar] [CrossRef]
  11. Mussgnug, J.H.; Thomas-Hall, S.; Rupprecht, J.; Foo, A.; Klassen, V.; McDowall, A.; Schenk, P.M.; Kruse, O.; Hankamer, B. Engineering photosynthetic light capture: Impacts on improved solar energy to biomass conversion. Plant Biotechnol. J. 2007, 5, 802–814. [Google Scholar] [CrossRef]
  12. Singh, S.K.; Badgujar, G.; Reddy, V.R.; Fleisher, D.H.; Bunce, J.A. Carbon dioxide diffusion across stomata and mesophyll and photo-biochemical processes as affected by growth CO2 and phosphorus nutrition in cotton. J. Plant Physiol. 2013, 170, 801–813. [Google Scholar] [CrossRef] [PubMed]
  13. Rascher, U.; Bobich, E.G.; Lin, G.H.; Walter, A.; Morris, T.; Naumann, M.; Nichol, C.J.; Pierce, D.; Bil, K.; Kudeyarov, V.; et al. Functional diversity of photosynthesis during drought in a model tropical rainforest–the contributions of leaf area, photo-synthetic electron transport and stomatal conductance to reduction in net ecosystem carbon exchange. Plant Cell Environ. 2004, 27, 1239–1256. [Google Scholar] [CrossRef]
  14. Long, J.-R.; Ma, G.-H.; Wan, Y.-Z.; Song, C.-F.; Sun, J.; Qin, R.-J. Effects of Nitrogen Fertilizer Level on Chlorophyll Fluorescence Characteristics in Flag Leaf of Super Hybrid Rice at Late Growth Stage. Rice Sci. 2013, 20, 220–228. [Google Scholar] [CrossRef]
  15. Detmann, K.C.; Araújo, W.L.; Martins, S.C.; Sanglard, L.M.; Reis, J.V.; Detmann, E.; Rodrigues, F.; Nunes-Nesi, A.; Fernie, A.R.; DaMatta, F.M. Silicon nutrition increases grain yield, which, in turn, exerts a feed-forward stimulation of photosynthetic rates via enhanced mesophyll conductance and alters primary metabolism in rice. New Phytol. 2012, 196, 752–762. [Google Scholar] [CrossRef]
  16. Chen, M.; Liang, F.; Yan, Y.; Wang, Y.; Zhang, Y.; Tian, J.; Jiang, C.; Zhang, W. Boll-leaf system gas exchange and its application in the analysis of cotton photosynthetic function. Photosynth. Res. 2021, 150, 251–262. [Google Scholar] [CrossRef]
  17. Tjoelker, M.G.; Oleksyn, J.; Reich, P.B. Seedlings of five boreal tree species differ in acclimation of net photosynthesis to elevated CO2 and temperature. Tree Physiol. 1998, 18, 715–726. [Google Scholar] [CrossRef]
  18. Kirschbaum, M.U.F. Forest growth and species distribution in a changing climate. Tree Physiol. 2000, 20, 309–322. [Google Scholar] [CrossRef] [PubMed]
  19. Ravi, V.; Chakrabarti, S.; Makeshkumar, T.; Saravanan, R. Molecular regulation of storage root formation and development in sweet potato. Hortic. Rev. 2014, 42, 157–208. [Google Scholar]
  20. Liu, X.; Peng, Y.; Yang, Q.; Wang, X.; Cui, N. Determining optimal deficit irrigation and fertilization to increase mango yield, quality, and WUE in a dry hot environment based on TOPSIS. Agric. Water Manag. 2020, 245, 106650. [Google Scholar] [CrossRef]
  21. Rascher, U.; Liebig, M.; Lüttge, U. Evaluation of instant light-response curves of chlorophyll fluorescence parameters obtained with a portable chlorophyll fluorometer on site in the field. Plant Cell Environ. 2000, 23, 1397–1405. [Google Scholar] [CrossRef]
  22. Dong, B.; Wang, Z.; Evers, J.B.; Stomph, T.J.; van der Putten, P.E.; Yin, X.; Wang, J.L.; Sprangers, T.; Hang, X.; van der Werf, W. Competition for light and nitrogen with an earlier-sown species negatively affects leaf traits and leaf photosynthetic capacity of maize in relay intercropping. Eur. J. Agron. 2024, 155, 127119. [Google Scholar] [CrossRef]
  23. Villordon, A.; LaBonte, D.; Firon, N.; Carey, E. Variation in Nitrogen Rate and Local Availability Alter Root Architecture Attributes at the Onset of Storage Root Initiation in ‘Beauregard’ Sweetpotato. HortScience 2013, 48, 808–815. [Google Scholar] [CrossRef]
  24. Si, C.-C.; Liang, Q.-G.; Liu, H.-J.; Wang, N.; Kumar, S.; Chen, Y.-L.; Zhu, G.-P. Response Mechanism of Endogenous Hormones of Potential Storage Root to Phosphorus and Its Relationship with Yield and Appearance Quality of Sweetpotato. Front. Plant Sci. 2022, 13, 872422. [Google Scholar] [CrossRef] [PubMed]
  25. Li, R.; Zhang, G.; Liu, G.; Wang, K.; Xie, R.; Hou, P.; Ming, B.; Wang, Z.; Li, S. Improving the yield potential in maize by constructing the ideal plant type and optimizing the maize canopy structure. Food Energy Secur. 2021, 10, e312. [Google Scholar] [CrossRef]
  26. Liu, T.; Gu, L.; Dong, S.; Zhang, J.; Liu, P.; Zhao, B. Optimum leaf removal increases canopy apparent photosynthesis, 13C-photosynthate distribution and grain yield of maize crops grown at high density. Field Crop. Res. 2015, 170, 32–39. [Google Scholar] [CrossRef]
  27. Yang, G.-Z.; Luo, X.-J.; Nie, Y.-C.; Zhang, X.-L. Effects of Plant Density on Yield and Canopy Micro Environment in Hybrid Cotton. J. Integr. Agric. 2014, 13, 2154–2163. [Google Scholar] [CrossRef]
  28. Fan, P.; Anten, N.P.; Evers, J.B.; Li, Y.; Li, S.; Ming, B.; Xie, R. Higher yields of modern maize cultivars are not associated with coordinated light and N distribution within the canopy. Field Crop. Res. 2023, 305, 109182. [Google Scholar] [CrossRef]
  29. Bashir, N.; Athar, H.U.R.; Kalaji, H.M.; Wróbel, J.; Mahmood, S.; Zafar, Z.U.; Ashraf, M. Is photoprotection of PSII one of the key mechanisms for drought tolerance in maize? Int. J. Mol. Sci. 2021, 22, 13490. [Google Scholar] [CrossRef]
  30. Peng, J.; Feng, Y.; Wang, X.; Li, J.; Xu, G.; Phonenasay, S.; Luo, Q.; Han, Z.; Lu, W. Effects of nitrogen application rate on the photosynthetic pigment, leaf fluorescence characteristics, and yield of indica hybrid rice and their interrelations. Sci. Rep. 2021, 11, 7485. [Google Scholar] [CrossRef]
  31. Perera-Castro, A.V.; Flexas, J. The ratio of electron transport to assimilation (ETR/AN): Underutilized but essential for assessing both equipment’s proper performance and plant status. Planta 2023, 257, 29. [Google Scholar] [CrossRef]
  32. Yang, H.; Chai, Q.; Yin, W.; Hu, F.; Qin, A.; Fan, Z.; Yu, A.; Zhao, C.; Fan, H. Yield photosynthesis and leaf anatomy of maize in inter- and mono-cropping systems at varying plant densities. Crop. J. 2021, 10, 893–903. [Google Scholar] [CrossRef]
  33. Samedani, B.; Juraimi, A.S.; Anwar, M.P.; Rafii, M.Y.; Sheikh Awadz, S.H.; Anuar, A.R. Competitive interaction of Axonopus compressus and Asystasia gangetica under contrasting sunlight intensity. Sci. World J. 2013, 2013, 308646. [Google Scholar] [CrossRef] [PubMed]
  34. Khan, A.; Zheng, J.; Tan, D.K.Y.; Khan, A.; Akhtar, K.; Kong, X.; Munsif, F.; Iqbal, A.; Afridi, M.Z.; Ullah, A.; et al. Changes in Leaf Structural and Functional Characteristics when Changing Planting Density at Different Growth Stages Alters Cotton Lint Yield under a New Planting Model. Agronomy 2019, 9, 859. [Google Scholar] [CrossRef]
  35. Wu, B.; Zuo, W.; Yang, P.; Zhang, W. Optimal water and nitrogen management increases cotton yield through improving leaf number and canopy light environment. Field Crop. Res. 2023, 290, 108745. [Google Scholar] [CrossRef]
  36. Guo, Y.; Yin, W.; Fan, H.; Fan, Z.; Hu, F.; Yu, A.; Zhao, C.; Chai, Q.; Aziiba, E.A.; Zhang, X. Photosynthetic Physiological Characteristics of Water and Nitrogen Coupling for Enhanced High-Density Tolerance and Increased Yield of Maize in Arid Irrigation Regions. Front. Plant Sci. 2021, 12, 726568. [Google Scholar] [CrossRef]
  37. Zheng, B.; Li, Y.; Wu, Q.; Zhao, W.; Ren, T.; Zhang, X.; Li, G.; Ning, T.; Zhang, Z. Maize (Zea mays L.) planted at higher density utilizes dynamic light more efficiently. Plant Cell Environ. 2023, 46, 3305–3322. [Google Scholar] [CrossRef]
  38. Dai, Y.L.; Fan, J.L.; Liao, Z.Q.; Zhang, C.; Yu, J.; Feng, H.L.; Zhang, C.; Li, Z.J. Supplemental irrigation and modified plant density improved photosynthesis, grain yield and water productivity of winter wheat under ridge-furrow mulching. Agric. Water Manag. 2022, 274, 107985. [Google Scholar] [CrossRef]
  39. Liao, Z.Q.; Zeng, H.L.; Fan, J.L.; Lai, Z.L.; Zhang, C.; Zhang, F.C.; Wang, H.D.; Cheng, M.H.; Guo, J.J.; Li, Z.J.; et al. Effects of plant density, nitrogen rate and supplemental irrigation on photosynthesis, root growth, seed yield and water-nitrogen use efficiency of soybean under ridge-furrow plastic mulching. Agric. Water Manag. 2022, 268, 107688. [Google Scholar] [CrossRef]
  40. Xia, F.; Yang, Y.; Zhang, S.; Li, D.; Sun, W.; Xie, Y. Influencing factors of the supply-demand relationships of carbon sequestration and grain provision in China: Does land use matter the most? Sci. Total. Environ. 2022, 832, 154979. [Google Scholar] [CrossRef]
  41. Baroja-Fernández, E.; Muñoz, F.J.; Montero, M.; Etxeberria, E.; Sesma, M.T.; Ovecka, M.; Bahaji, A.; Ezquer, I.; Li, J.; Prat, S.; et al. Enhancing Sucrose Synthase Activity in Transgenic Potato (Solanum tuberosum L.) Tubers Results in Increased Levels of Starch, ADPglucose and UDPglucose and Total Yield. Plant Cell Physiol. 2009, 50, 1651–1662. [Google Scholar] [CrossRef]
  42. Hashida, Y.; Hirose, T.; Okamura, M.; Hibara, K.-I.; Ohsugi, R.; Aoki, N. A reduction of sucrose phosphate synthase (SPS) activity affects sucrose/starch ratio in leaves but does not inhibit normal plant growth in rice. Plant Sci. 2016, 253, 40–49. [Google Scholar] [CrossRef] [PubMed]
  43. Li, N.; Zhang, S.; Zhao, Y.; Li, B.; Zhang, J. Over-expression of AGPase genes enhances seed weight and starch content in transgenic maize. Planta 2011, 233, 241–250. [Google Scholar] [CrossRef]
  44. Kang, X.; Gao, W.; Cui, B.; El-Aty, A.A. Structure and genetic regulation of starch formation in sorghum (Sorghum bicolor (L.) Moench) endosperm: A review. Int. J. Biol. Macromol. 2023, 239, 124315. [Google Scholar] [CrossRef] [PubMed]
  45. Du, F.; Liu, H.; Yin, X.; Zhao, Q.; Shi, C. Potassium-mediated regulation of sucrose metabolism and storage root formation in sweet potato. Arch. Agron. Soil Sci. 2021, 67, 703–713. [Google Scholar] [CrossRef]
  46. Gao, Y.; Tang, Z.H.; Xia, H.Q.; Sheng, M.F.; Liu Ming Pan, S.Y.; Li, Z.Y.; Liu, J.R. Potassium fertilization stimulates sucrose-to-starch conversion and root formation in sweet potato (Ipomoea batatas (L.) Lam.). Int. J. Mol. Sci. 2021, 22, 4826. [Google Scholar] [CrossRef] [PubMed]
  47. Si, C.; Shi, C.; Liu, H.; Zhan, X.; Liu, Y. Effects of nitrogen forms on carbohydrate metabolism and storage-root formation of sweet potato. J. Plant Nutr. Soil Sci. 2018, 181, 419–428. [Google Scholar] [CrossRef]
  48. Dumbuya, G.; Alemayehu, H.A.; Hasan, M.; Matsunami, M.; Shimono, H. Effect of soil temperature on growth and yield of sweet potato (Ipomoea batatas L.) under cool climate. J. Agric. Meteorol. 2021, 77, 118–127. [Google Scholar] [CrossRef]
Figure 1. Effect of planting density on sweet potato canopy spectrum parameter at canopy closure period. IPAR (A), TPAR (B), Light transmission (C), and Extinction coefficient (D). Data are means ± SE. Significant differences among treatments, analyzed by the Duncan test (p < 0.05), are indicated by different letters.
Agronomy 14 02579 g001
Figure 2. Effect of planting density on sweet potato Leaf nitrogen content (A), SPAD (B), LAI (C), and LA (D) during storage bulking period in 2021 (Haikou) and 2022 (Sanya). Data are means ± SE. Significant differences among treatments, analyzed by the Duncan test (p < 0.05), are indicated by different letters. ns, no significance.
Agronomy 14 02579 g002
Figure 3. Effect of planting density on sweet potato leaf gas exchange parameters. Pn (A,B), Ci (C,D), Gs (E,F), Tr (G,H), WUE (I,J) in 2021 (Haikou) and 2022 (Sanya). Data are means ± SE. Significant differences among treatments, analyzed by the Duncan test (p < 0.05), are indicated by different letters. ns, no significance.
Agronomy 14 02579 g003
Figure 4. Effect of planting density on sweet potato leaf Chlorophyll fluorescence parameters. Fv/Fm (A,B), YII (C,D), qP (E,F), NPQ (G,H), ETR (I,J). Data are means ± SE. Significant differences among treatments, analyzed by the Duncan test (p < 0.05), are indicated by different letters. ns, no significance.
Agronomy 14 02579 g004
Figure 5. Effect of planting density on sweet potato above-part development. Leaf fresh weight (A), Above-part fresh weight (B), branch number (C), main stem length (D), average stem length (E), and stem base diameter (F). Data are means ± SE. Significant differences among treatments, analyzed by the Duncan test (p < 0.05), are indicated by different letters.
Agronomy 14 02579 g005
Figure 6. Effect of planting density on sweet potato dry matter accumulation (A,D) and allocation (B,E) as well as R/T ratio (C,F) in 2021 (Haikou) and 2022 (Sanya). Data are means ± SE. Significant differences among treatments, analyzed by the Duncan test (p < 0.05), are indicated by different letters.
Agronomy 14 02579 g006
Figure 7. Effect of planting density on gene expression of carbohydrate metabolism on storage root during bulking period (year of 2022 in Sanya). SuSy (A), SSS (B), AGPase (C), SBE1 (D), GBSS (E), and SPS (F). Data are means ± SE. Significant differences among treatments, analyzed by the Duncan test (p < 0.05), are indicated by different letters.
Agronomy 14 02579 g007
Figure 8. Effect of planting density on carbohydrate content in sweet potato storage root during the bulking period in 2021 (Haikou) and 2022 (Sanya). Starch content (A), Sucrose content (B), Glucose content (C), and Fructose content (D) in storage root. Data are means ± SE. Significant differences among treatments, analyzed by the Duncan test (p < 0.05), are indicated by different letters.
Agronomy 14 02579 g008
Figure 9. Effect of planting density on sweet potato storage root diameter (A) and individual storage root (SR) fresh weight (B) during the bulking period in 2021 (Haikou) and 2022 (Sanya). Data are means ± SE. Significant differences among treatments, analyzed by the Duncan test (p < 0.05), are indicated by different letters.
Agronomy 14 02579 g009
Table 1. Effect of planting density on sweet potato SR onset characteristics at canopy closure period.
YearsTreatmentAverage SR Diameter
(mm)
Average SR Fresh Weight
(g)
Young SR Number
(2 < Φ < 5 mm)
Developing SR Number
(5 < Φ < 20 mm)
Mature SR Number
(Φ > 20 mm)
SR Number
2021
(Haikou)
D15 †5.14 c ‡1.35 c2.33 a2.33 c-4.67 b
D207.84 b2.60 b1.67 b4.00 a-5.67 a
D258.07 b4.87 a0.67 c3.67 ab-4.33 bc
D3010.62 a4.70 a0.67 c3.00 b-3.67 c
2022
(Sanya)
D1518.99 b18.96 b-3.33 a3.67 b7.00 a
D2021.60 a26.74 a-2.33 bc4.33 a6.67 a
D2521.11 a27.74 a-2.00 c4.00 ab6.00 b
D3022.67 a28.87 a-2.67 b4.00 ab6.67 a
2023 (Sanya)D1520.95 c31.14 c-0.67 c4.67 b5.33 c
D2020.80 c32.90 b-2.33 a4.67 a7.00 a
D2523.27 b36.42 a-1.67 b4.67 a6.33 b
D3024.66 a34.09 ab-1.67 b3.67 b5.33 c
Note: SR, storage root, † D15, 15 cm plant distance and 83,280 plants ha−1; D20, 20 cm plant distance and 62,520 plants ha−1; D25, 25 cm plant distance and 50,025 plants ha−1; D30, 30 cm plant distance and 41,640 plants ha−1. The row distance was set at 80 cm for all. ‡ Values followed by different letters present significant differences (p < 0.05) among planting density treatments.
Table 2. Effect of planting density on storage root yield, yield component, and appearance quality.
YearsTreatmentSR Diameter
(mm)
SR
Length
(cm)
L/D RatioAverage SR Weight
(g)
CV
(%)
Average SR Number Per PlantYield (kg/hm2)Yield Increment
(%)
2021
(Haikou)
D15 †36.95 c ‡9.98 bc2.7104.56 b5.643.57 d29,763.09 b14.41 #
D2038.75 b9.69 c2.5111.13 b1.774.52 a32,497.89 a24.92
D2539.39 a10.24 b2.6127.26 a11.874.16 b26,013.56 c-
D3039.15 a11.74 a3.0133.97 a5.494.00 c24,154.95 d−7.14
2022 (Sanya)D1539.04 b10.15 a2.688.50 d7.695.26 c38,795.60 b3.46
D2039.81 b9.15 b2.3110.81c2.906.19 a42,883.33 a14.13
D2539.72 b9.53 ab2.4131.66 b6.715.71 b37,494.90 b-
D3042.71 a9.82 ab2.3170.61a7.645.01 d35,592.04 c−5.34
2023
(Sanya)
D1551.64 b14.31 b2.7174.65 c5.555.44 b47,801.67 b3.69
D2050.19 b15.15 ab3.0200.59 b3.656.41 a50,025.00 a8.47
D2551.31 b15.92 a3.9215.37 ab4.525.99 ab46,120.27 b-
D3053.52 a15.87 a3.0235.26 a6.335.63 b45,416.67 b−1.51
Note: † D15, 15 cm plant distance and 83,280 plants ha−1; D20, 20 cm plant distance and 62,520 plants ha−1; D25, 25 cm plant distance and 50,025 plants ha−1; D30, 30 cm plant distance and 41,640 plants ha−1. The row distance was set at 80 cm for all. ‡ Values followed by different letters present significant differences (p < 0.05) among planting density treatments. # Compared with the control.
Table 3. Effect of planting density on storage root commercial characteristics at harvest period.
YearsTreatments †Commercial SR Weight
(g)
Commercial SR Number Per PlantLarge SR NumberMiddle
SR Number
Small
SR Number
Commercial
Rate (%)
Commercial SR Yield
(kg hm−2)
Increment
(%)
2021
(Haikou)
D15122.61 b ‡2.33 c0.33 c1.67 b0.33 a 65.7119,558.23 b−0.51 #
D20129.91 b3.00 a1.00 b2.00 a0.00 b74.95 24,367.17 a 23.35
D25158.45 a2.33 c1.33 a1.00 d0.00 b75.45 19,697.51 b-
D30162.41 a2.67 b1.33 a1.33 c0.00 b70.3716,998.00 c−16.16
2022
(Sanya)
D1598.89 d3.00 c1.00 b2.00 b0.00 c64.3224,954.02 c 29.60
D20117.89 c4.67 a1.00 b3.00 a0.67 a 80.0834,342.08 a33.46
D25136.87 b4.00 b1.67 a2.00 b0.33 b 68.4825,676.50 b-
D30201.50 a3.00 c1.67 a1.33 c0.00 c70.7925,198.06 bc−1.95
2023
(Sanya)
D15179.46 c4.33 c0.00 d4.33 a0.00 a81.7839,092.21 b0.92
D20203.59 b5.33 a1.00 b4.33 a0.00 a84.39 42,216.09 a8.96
D25232.03 a4.67 b1.67 a3.00 b0.00 a83.99 38,736.41 b-
D30242.80 a4.33 c1.67 a2.67 c0.00 a79.3736,047.21 c−6.94
Note: † D15, 15 cm plant distance and 83,280 plants ha−1; D20, 20 cm plant distance and 62,520 plants ha−1; D25, 25 cm plant distance and 50,025 plants ha−1; D30, 30 cm plant distance and 41,640 plants ha−1. The row distance was set at 80 cm for all. ‡ Values followed by different letters present significant differences (p < 0.05) among planting density treatments. # Compared with the control.
Table 4. Pearson correlation analysis between yield components and photosynthesis characteristics.
SRN †SRFWYieldIPARTPARPnGs
SRN1.00−0.751 ***0.793 ***0.791 ***0.593 **−0.596 **0.018 ns
SRFW−0.751 *** #1.00−0.682 ***−0.938 ***−0.618 **0.540 *0.324 ns
Yield0.793 ***−0.682 ***1.000.764 ***0.658 **−0.393 ns0.010 ns
CiTrFv/FmqPΦPSIIETRNPQ
SRN0.506 *−0.233 ns0.389 ns−0.546 *−0.705 ***−0.500 *0.571 **
SRFW−0.316 ns0.429 ns−0.637 **0.730 **0.901 ***0.685 **−0.631 **
Yield0.317 ns−0.175 ns0.549 *−0.648 **−0.793 ***−0.676 **0.578 **
Note: † SRN, storage root number per plant; SRFW, storage root fresh weight. # ns indicated no significant difference; * and ** and *** indicated significant differences at p < 0.05 and p < 0.01, and p < 0.001, respectively.
Disclaimer/Publisher’s Note: The statements, opinions and data contained in all publications are solely those of the individual author(s) and contributor(s) and not of MDPI and/or the editor(s). MDPI and/or the editor(s) disclaim responsibility for any injury to people or property resulting from any ideas, methods, instructions or products referred to in the content.

