Article

Evaluating the Effectiveness of the Biodegradable Superabsorbent Polymer (Fasal Amrit) on Soil Hydrological Properties: A Laboratory Rainfall Simulation Study

by
P. P. Ruwanpathirana
1,2,*,
Kazuhito Sakai
1,3,*,
Tamotsu Nakandakari
1,3 and
Kozue Yuge
1,4
1
United Graduate School of Agricultural Sciences, Kagoshima University, 1-21-24 Korimoto, Kagoshima 890-0065, Japan
2
Department of Agricultural Engineering, Faculty of Agriculture, University of Ruhuna, Kamburupitiya 81100, Sri Lanka
3
Faculty of Agriculture, University of the Ryukyus, 1 Senbaru, Nishihara-cho, Okinawa 903-0213, Japan
4
Faculty of Agriculture, Saga University, 1 Honjo-machi, Saga 840-8502, Japan
*
Authors to whom correspondence should be addressed.
Agronomy 2024, 14(11), 2467; https://doi.org/10.3390/agronomy14112467
Submission received: 21 September 2024 / Revised: 16 October 2024 / Accepted: 21 October 2024 / Published: 23 October 2024

Abstract

:
Superabsorbent polymers (SAPs) are effective soil amendments that can control soil erosion by improving soil quality. However, many commercial SAPs face challenges including limited biodegradability, high costs, and adverse effects on soil hydrological properties, which can lead to increased water and soil loss. This study examined the potential of lower dosages of biodegradable SAPs to improve the hydrological properties of “Shimajiri-maji” (clay) soil. Three concentrations of biodegradable Fasal Amrit polymer (EFP) (P1: 0, P2: 3 g m−2, and P3: 6 g m−2) were evaluated under three simulated rainfall intensities (I1: 35; I2: 70 and I3: 110 mm h−1) and two gradients (7.5%, and 15%) during consecutive storms. The time to generate runoff, infiltration, runoff, soil loss, and water storage (WS) were quantified over one hour. The results show that runoff generation was delayed in EFP-treated soils compared to the control. Both polymer treatments enhanced infiltration (P2 > P3 > P1) and reduced runoff and soil loss (P2 < P3 < P1). Higher EFP rates improved water storage at surface depths (P3 > P2 > P1). EFP-treated soils exhibited lower interrill erodibility, suggesting greater resistance to soil erosion compared to the control. EFP treatments also significantly improved the soil’s physical properties (bulk density, porosity, organic matter, aggregate stability). EFPs can diminish runoff and soil loss as the EFP-treated plots exhibited greater aggregate stability than the control. It was concluded that low EFP concentrations can improve soil hydrological properties and mitigate soil erosion. Further investigations are needed to optimize the EFP concentrations for different soil types.

1. Introduction

The United Nations has anticipated that the world’s population will increase to approximately 10 billion by 2050 and substantially increase food insecurity worldwide [1]. To meet the rising demands by 2050, global agricultural production may need to undergo a substantial increase, ranging between 70% and 110% [2,3]. Therefore, all nations should focus on enhancing agricultural production to meet future food demand, and intensively engaging in agriculture is essential. However, intensive anthropogenic activities in agriculture could lead to land and soil degradation, including the loss of soil cover, increased soil erosion, salinification, acidification, and compaction [4], which pose major threats to agricultural productivity and environmental conservation, especially in tropical and subtropical regions [4].
The primary cause of soil degradation is soil erosion, a phenomenon that is triggered by wind and water and involves the detachment, transportation, and deposition of productive surface soil particles [5,6,7]; it is mainly affected by factors such as land use, land slope, rainfall intensity, soil properties, and crop characteristics [8,9]. It has been argued that this poses a significant risk to the overall sustainability of land on a global scale [9]. Globally, it is thought that more than 75 billion tons of soil are lost by soil erosion every year [7,10], and the rate of the loss of agricultural soil by erosion is 10 to 40 times greater than the replenishment of new soils [11]. Soil erosion is responsible for approximately 84% of global soil loss [12,13]. In addition, soil erosion extends to a decline in agricultural productivity, diminishes the quality of drinking water, and impairs the overall quality of surface and groundwater resources [7,14,15]. Moreover, the effect of soil erosion varies among crops because of the differences in their plant structure, root systems, and vegetation cover. For example, soybean crops, with their significant leaf coverage, are more effective at reducing soil erosion than maize crops [16].
Sri Lanka, as a tropical country, is particularly susceptible to the effects of climate change, including increased vulnerability to extreme weather events due to its geographic location [17]. Soil erosion is a major form of soil degradation in Sri Lanka, causing serious problems in the agriculture and the environment. Soil erosion has impacted around 44% of the country’s agricultural land, leading to a significant loss of topsoil and nutrients, which negatively affects crop productivity and soil health across the country [18]. Sugarcane is a major bio-energy crop with significant economic value, and it is widely cultivated in tropical and subtropical regions around the globe. In Sri Lanka, sugarcane is a prominent plantation crop that thrives in the country’s climatic conditions [19]. Currently, sugarcane lands are predominantly located in the dry and intermediate agro-climatological zones covering approximately 24,000 hectares [20]. According to the Sugarcane Research Institute (Sri Lanka), sugar production reached approximately 60,000 MT, fulfilling about 10% of the country’s requirements, in 2023. The remaining sugar was imported, costing approximately LKR 127 billion [21]. Therefore, the Sri Lankan sugarcane sector is aiming for rapid growth in sugarcane production by increasing the total extent of sugarcane in rural areas for the next few decades [22].
However, sugarcane cultivation is challenged by soil degradation, particularly soil erosion caused by extreme weather events, which reduces soil quality and sugarcane productivity [19]. Perera et al. [23] found that the predicted mean annual soil loss rate of sugarcane lands was 27.8 t ha−1 in Monaragala, Sri Lanka. Since sugarcane cultivation primarily relies on rainfed agriculture, its critical growth stages coincide with the rainy seasons. Changes in monsoonal weather patterns could cause heavy rainfall during the sugarcane crop cycle, increasing the risk of soil erosion [24]. In addition, during early crop stages, a large amount of agricultural land is bare, making it particularly vulnerable to the movement of topsoil layers. Martinelli and Filoso [25] reported that sugarcane lands are highly prone to erosion between harvesting and the growth of new canes due to the exposure of bare soils. When the surface of the soil is exposed to periods of intense rainfall, the soil that lacks organic matter is susceptible to erosion [26]. This loss of fertile topsoil diminishes the soil’s capacity to support healthy plant growth and maintain moisture levels; on the other hand, expanding sugarcane cultivation into steep lands is problematic because it accelerates soil erosion and results in the loss of water and soil nutrients [27]. Thus, increased soil erosion could result from intensive agricultural methods in sugarcane farmlands without site-specific management techniques. Soil erosion can be minimized by improving soil physical properties, such as infiltration, porosity, hydraulic conductivity, aggregate stability, and water retention, which helps to conserve the topsoil and prevent its detachments. These strategies must be implemented promptly to enhance the soil properties by reducing erosion in cultivated areas.
Traditional land management techniques, such as mulching, cultivating cover crops, crop rotation, and conventional tillage methods, are commonly employed in farmlands as soil erosion control strategies because they improve soil aggregate stability and minimize soil erodibility [28,29]. In addition, several physical measures such as geotextiles [30,31] and rock fragment coverage [32,33] can be employed in agricultural fields to reduce soil and water loss. Moreover, soil amendments have proven to be a promising tool in soil erosion control as they reduce rainfall erosivity and improve soil conditions [34,35]. The addition of soil amendments including compost, manure, and biochar can improve the qualities of the soil, reducing soil loss and water runoff while increasing its infiltration, water retention, aeration, permeability, and structure. Recently, superabsorbent polymers (SAPs) derived from either natural or synthetic sources have been recognized as alternative soil amendments that can be used to mitigate soil erosion by improving soil quality [36,37].
SAPs are hydrophilic polymeric materials comprising cross-linked, three-dimensional networks [38]; they can absorb and store water more than a hundred times their weight [39,40]. The benefits of SAPs include their ability to increase water retention [41], increase soil aggregation [28], reduce soil erosion [42], slow water release, and enhance the soil organic matter and essential micronutrients [41]. It is important that the application of SAPs in agriculture increases productivity by promoting plant growth and enhancing yields due to the improvement in soil quality and the maximization of fertilizer usage [39]. SAPs can be categorized into two main types based on their composition and structure: (1) synthetic and (2) natural or organic [38,43]. Synthetic SAPs are produced through a polymerization process that creates long chains of repeating monomers, including cross-linked hydrophilic structures [44]. In agriculture, inorganic polyacrylamide (PAM), polyacrylic acid (PAA), and its salts are widely used examples of synthetic SAPs because of their low cost and ability to prevent soil and water loss by stabilizing the soil structure [34,37,45]. A study conducted by Tümsavas and Kara [36] reported that applying PAM to soil significantly reduced surface runoff and soil losses while increasing the infiltration rate compared to the untreated soils. Abu-Zreig [46] recommended that the application of PAM enhances infiltration and reduces soil erosion while increasing crop productivity. Cao et al. [47] reported that different concentrations of SAPs showed significant results in reducing surface water and sediment transportation and the initial runoff time. However, most of these synthetic SAPs are not readily biodegradable because of their long durability and the environmental and health concerns they raise. More importantly, the degradation products are toxic and hazardous to the environment [45,48]. In terms of an environmentally friendly approach, recently, biodegradable SAPs derived from natural materials have emerged as an alternative soil amendment for erosion control. Natural SAPs such as cellulose, starch, and chitosan are produced using natural raw materials (biopolymers and their derivatives), and agricultural waste products including fruit waste, corn straw, and bagasse have excellent biodegradability [43,49,50].
Bio-degradable or organic SAPs offer significant advantages in terms of their biodegradability and environmental sustainability. Under natural conditions, natural SAPs can be easily decomposed or degraded by the actions of microorganisms and enzymes on their three-dimensional structures [50]. Khushbu et al. [49] reported that hydrogels synthesized from tamarind kernel gum could be used as a soil conditioner because their results showed higher degradability and significant enhancements in the soil conditions. The application of excessive amounts of organic SAPs is not economically viable because they are relatively expensive. In addition, the excessive application of SAPs could show negative effects on crop yield due to the changes in the physical and chemical properties of the soil [51]. It is essential to evaluate the optimal concentration of SAPs based on the soil’s texture, climate, and type of SAPs. Cao et al. [47] found that, when the application dosage of SAPs was greater than 1%, soil erosion prevention was significantly reduced on the Loess Plateau; they suggested that a dosage of 0.75% could provide better results in erosion control in the region. Thus, it is important to explore the effect of organic SAPs at low dosages on surface runoff and soil loss. Fasal Amrit polymer, also referred to as EF Polymer (EFP), is a 100% biodegradable superabsorbent polymer (SAP) produced by EF Polymer Pvt. Ltd. in Rajasthan, India, and it is made from fruit peels. EFP can be used as an alternative soil amendment over synthetic polymers because of its ability to improve water retention, increase soil aggregation, reduce soil erosion, increase crop productivity, and slow water release, as well as being non-toxic and biodegradable [52]. Meena et al. [53] reported that the crop growth characteristics significantly increased with the addition of EFP compared to the control. Although synthetic SAPs have been widely studied for soil conservation, there is limited research on the effectiveness of biodegradable SAPs, particularly in tropical and subtropical sugarcane-growing regions, hence, they need to be extensively studied.
Therefore, this study presents a novel approach by focusing on the application of low concentrations of biodegradable EFP to evaluate their efficacy in mitigating soil erosion and enhancing hydrological properties in tropical and subtropical sugarcane-growing regions. To the best of our knowledge, this is the first investigation to systematically assess the effects of EFP on sugarcane soils subjected to consecutive rainfall events. In this study, EFP was mixed with soils at low concentrations (P1: 0, P2: 3 g m−2, and P3: 6 g m−2), and experiments were carried out to evaluate the effect of biodegradable SAPs in terms of reducing surface runoff and soil loss, as well as improving soil hydrological properties under different consecutive rainfall storms simulated using an indoor rainfall simulator. The rainfall simulation study was conducted in the laboratory by providing similar conditions for each rainfall storm to obtain more accurate results.

2. Materials and Methods

2.1. Study Area and Soil Sampling

This study was carried out at the artificial rainfall laboratory, Faculty of Agriculture, University of the Ryukyus, Okinawa, Japan. Although this study was conducted in Okinawa, Japan, this region was selected based on the similarities between the climate and soil types of Okinawa and key agricultural regions in Sri Lanka, particularly those prone to soil erosion and water scarcity [19,23]. Both regions experience similar subtropical climates and comparable soil characteristics, which allowed us to assume that findings related to soil erosion and hydrological properties in Okinawa could offer insights applicable to sugarcane cultivation in Sri Lanka. The experimental soils were collected from the bare land area of the research field, Faculty of Agriculture, University of the Ryukyus, Okinawa, Japan (26°15′10.6″ N 127°45′52.5″ E). This region has a subtropical climate, with an average annual precipitation of approximately 2300 mm and a mean annual temperature of 23.8 °C in 2023 [54]. The soil type at the experimental site was “Shimajiri-maji”, which belongs to the calcaric dark red subgroup (based on the USDA classification) and is one of the abundant soils in Okinawa [55]. Disturbed soil samples were collected from the most superficial layer (0–25 cm depth). The soil texture was determined using a PARIO soil particle analyzer (METER Group, München, Germany) [56] and characterized as 55% clay, 30% silt, and 15% sand. Thus, the soil can be classified as clay according to the USDA classification. The soil’s pH and EC were measured in 1:2.5 and 1:5 soil/water ratios, respectively. The saturated hydraulic conductivity (Ks) of the soil was determined using the constant head method [57]. Some of the main soil properties of the selected soil are shown in Table 1.

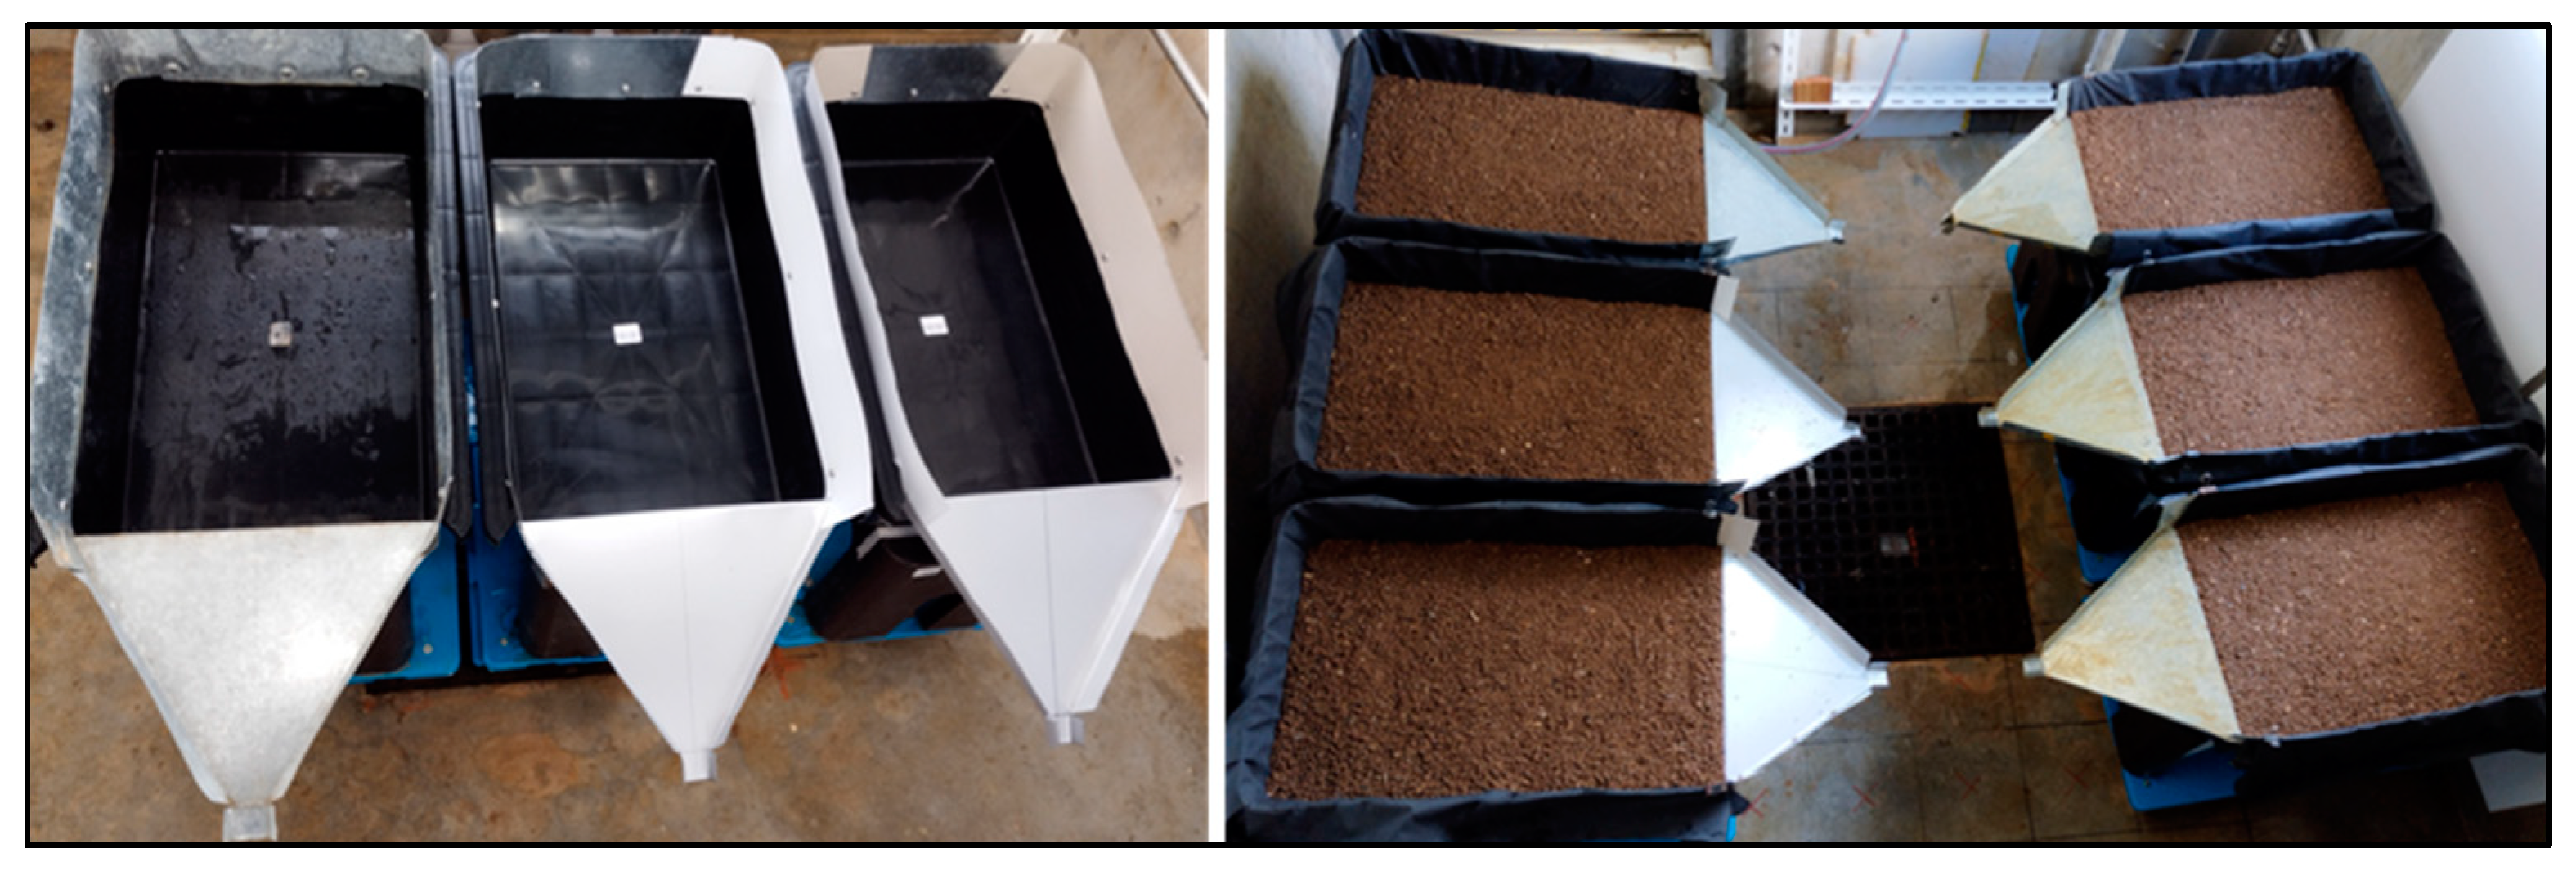
2.2. Experimental Setup and Treatments

Small erosion plots (>1 m2) were used for the rainfall simulation study because large plots consume more time and labor, specifically in sample preparation, and require soils in large quantities. Previous studies also reported that erosion plots less than 1 m2 could be successfully used for erosion assessment studies [28,58]. To prepare the soil erosion plots, we used plastic boxes with a length, width, and height of 0.56 m, 0.35 m, and 0.20 m, respectively. Each erosion plot was equipped with two outlets at the top and the bottom of the boxes to collect surface runoff and percolation (infiltration), respectively. To prevent splash erosion and soil spillage, 0.5 m height barriers were set on the other three sides of the boxes using galvanized metal sheets (Figure 1).
Fasal Amrit polymer (EFP) was selected for this study because it is an eco-friendly organic SAP that possesses excellent biodegradability. The EFP has an approximate shelf life of six months after application, during which it decays in the soil and boosts fertility. Its bio-waste origin confirms that it has minimal harmful effects on soil flora and fauna [52]. However, due to the cost of production, it is necessary to apply minimal rates of bio-degradable SAPs. The manufacturer (EF Polymer Pvt. Ltd., Rajasthan, India) suggested a lower EFP dosage of 1.5 g m−2, typically applied as a surface application in field conditions to improve crop yields. However, we selected 3 g m−2 and 6 g m−2 for our study, as we mixed the polymer directly into the soil to confirm uniform distribution and treatment consistency, allowing controlled measurement of its influences on soil hydrological properties. Based on the selected rate, the EFP amounts were 0.6 g (P2) and 1.2 g (P3) for a plot area of 1960 cm2. Thus, we used low dosages of bio-degradable SAPs in this study to confirm their effect on soil erosion and hydrological properties, while considering the environmental and economic impacts.
EFP is a white powder characterized by a particle size of 0.01–2.00 mm and a water absorption capacity of 50 g/g in tap water. This SAP has good characteristics, such as being a natural organic hydrogel, reducing irrigation water requirements (after 10–12 days), and improving the water-holding capacity of the soil. The organic matter content of EFP is greater than 70% [52]. Three treatments were selected using different polymer dosages, P1: 0, P2: 3 g m−2, and P3: 6 g m−2, to confirm the effectiveness of the EFPs on soil hydrological properties. The soil was airdried, crushed, and sieved (5 mm) before the application of the polymer. The initial moisture content of the soil was determined to be 15%, based on the gravimetric method. EFP was mixed into the top 0–2 cm layer of the soil (4 kg of soil) used in the erosion plot. For 4 kg of air-dry soil, the biopolymer application rates were 0.015% (P2) and 0.03% (P3) by weight, respectively. The EFP and soil mixture (P2 and P3) were thoroughly and evenly mixed by turning the soil due to the relatively small number of EFPs used based on the selected dosages. The same procedure was followed for mixing the soil not undergoing the EFP treatment (P1: control) to maintain similar conditions for each treatment.
A total of 4 cm layer of gravel (8 mm in size) was added to the bottom layer to allow for better percolation of infiltrated water. Polypropylene non-woven fabric layers were added over the rock layers before the addition of soil to prevent soil loss via the below layer. The sieved soils were added up to 6 cm soil depth over the gravel layer by adding four soil layers (2 cm layer-wise) to maintain similar bulk densities for each erosion plot. Finally, treatments were applied over the upper 2 cm depth of the soil boxes (Figure 1). While packing each soil layer, the soils were compacted to a 1.01 g cm−3 bulk density using a wooden log [37].

2.3. Rainfall Simulation and Procedure

The experiment was carried out under laboratory conditions to obtain precise results. The rainfall events were simulated using an artificial rainfall device at the artificial rainfall laboratory, Faculty of Agriculture, University of the Ryukyus, Okinawa, Japan. The rainfall simulation experimental setup consisted of two major components, the water supply and control system, and a rainfall simulator. The water supply and control systems feature a plastic water storage tank (100 L), water pump (2 hp), pressure gauge, pressure control valve, water supply and drainage hoses, and valves. The layout of the rainfall simulator is shown in Figure 2a. The rainfall simulator was developed using artificial rainfall nozzles (TRCN_ST -Technocore Co., Ltd., Kawaguchi, Japan) with an opening diameter of 3 mm, in which the simulator consisted of 24 nozzles (8 nozzles per line). The red circle in Figure 2b shows the TRCN_ST nozzles utilized to produce artificial rainfall. These nozzles exhibit repetitive motion due to the water pressure [58]. The rainfall intensity and coverage area were changed by changing the number of nozzles with a similar water pressure (0.4 atm). The rainfall intensity ranges between 35 mm h−1 and 110 mm h−1. The raindrop fall height was approximately 3 m, and the raindrop diameter was 2–3 mm, which is close to the average diameter of natural rainfall. An oscillating motor was integrated with the rainfall simulator to enhance the uniformity of the rainfall over the experiment plots. The Christiansen uniformity coefficient (Cv) was calculated to determine the uniformity coverage and even distribution of rainfall over the experimental area (Equation (1)) [59]. According to the calibration procedure, this rainfall simulator can be used to evaluate soil erosion responses under different soil conditions because it consists of uniformity coverage (>86%) and creates raindrops similar to those seen under natural rainfall conditions.
C v = 1 I S D I m e a n × 100
where Cv represents the Christiansen uniformity coefficient in %, Imean denotes the mean rainfall intensity in mm h−1, and ISD indicates the standard deviation of the intensity measurements.
All the erosion plots were saturated using tap water from below (in a horizontal position) for 24 h before the rainfall simulation experiments to provide the same moisture conditions among the treatments and facilitate the recording of infiltration data immediately during the first trial. The boxes were kept for 24 h after the saturation for air drying and the removal of excess water. The plots were set at two inclinations: S1 was 7.5% and S2 was 15%, under the rainfall simulator. The 15% slope condition was selected based on previous research studies highlighting its significance in evaluating soil erosion [28]. To compare soil erodibility with the application of EFPs, we chose slope conditions of 15% and 7.5%. The treatments were randomly assigned by changing the position of each rainfall storm [37].
The study was conducted using three rainfall intensities, I1: 35 mm h−1, I2: 70 mm h−1, and 110 mm h−1, to confirm the effectiveness of the EFP in improving soil hydrological properties under the S1 and S2 gradients. In this trial, 3 consecutive rainfall storms were simulated for each rainfall intensity (9 storms in total) and the rainfall duration for each storm was 1 h. To achieve steady rainfall events, runoff plots were exposed to rainfall for 10 min after the commencement of the rainfall event. Each experimental plot was covered with a plastic board for the initial 10 min of the rainfall events. The time interval between the two rainfall events was set to 48 h.

2.4. Evaluating the Effect of EFPs on Soil Hydrological and Erosional Responses

The time to generate runoff (TR) was recorded for the first three sequential rainfall storms (D1–D3) for I1 conditions on both slopes. The runoff (RO) and infiltration (IR) water were collected at 10-min intervals during the 1 h rainfall event. The volumes of RO and IR were measured using a graduated cylinder. After the measuring of the runoff samples, 1 mL of saturated alum solution (50 g/L) per 1 L of runoff volume was applied as a coagulant, stirred, and kept for the sedimentation process [58]. After removing the supernatant, the samples were dried in an oven for 24 h at 105 °C to record the soil loss (SL) collected every 10 min.
The water storage depth (WS) was calculated for the treatment plots at the end of each storm by employing the water balance equation. The water storage depth represents the actual amount of water supplied to the root zone [60]. This method involves quantifying the difference between the inflow and outflow water components. Rainfall (I) is considered the inflow component, while infiltration (IR) and runoff (RO) represent the outflow water components. The evapotranspiration was considered negligible due to the short duration of the experiment. Therefore, WS was calculated using the following equation (Equation (2)):
W S = I ( I R + R O )
where WS is the water storage (mm), I is the rainfall (mm), IR is the infiltration (mm), and RO is the surface runoff (mm).
In this study, the interrill soil erodibility factor (Ki) was calculated as a measure of soil erodibility based on the approach proposed by Kinnell [61] in the water erosion prediction project (WEPP) model. Runoff and soil loss values for each rainfall event were used to determine Ki, following the relationship outlined in Equation (3). This method allows for the quantification of soil erodibility under different rainfall intensities, slopes, and treatment conditions, providing a robust assessment of the soil’s resistance to erosion [62]:
K i = D i I Q S f
where Ki is the interrill soil erodibility (kg s m−4), Di is the interrill erosion rate (kg m−2 s−1), I is the rainfall intensity (m s−1), Q is the runoff rate (m s−1), and Sf is the slope factor, which is calculated using Equation (4):
S f = 1.05 0.85 exp ( 4 s i n θ )
where θ is the slope gradient (°).

2.5. Evaluating the Effect of SAP Rates on Soil Properties

After the end of the rainfall simulation, the soil samples were collected from the topmost 2 cm layer of each treatment to determine some key physical properties. Air-dried 2 mm sieved soils were used to determine the following soil properties: bulk density (BD), porosity, organic matter % (OM), hydraulic conductivity, and mean weight diameter (MWD). The BD of the soils was determined using the core sampler method and the hydrogen peroxide method was used to analyze the soil’s OM content. The saturated hydraulic conductivity values of each treatment were measured using the constant head method. The method proposed by Kemper and Rosenau [63] was used to produce water-stable aggregates and the MWD of each treatment was calculated to analyze the aggregate stability of the soils (Equation (5)). Higher MWD values indicate better aggregate stability [64]:
M W D = Σ X i W i
where  X i  is the mean diameter of the i th sieve size, and  W i  is the proportion of the total aggregates in the ith fraction.

2.6. Data Analysis

The cumulative IR, RO, and SL values were calculated via the summation of the IR, RO, and SL values obtained at each 10-min interval. The total RO and SL, with the rate of change, were calculated at the end of each rainfall storm. Soil hydrological responses (TR, IR, RO, and WS) and erosional responses (SL, and Ki) were analyzed to evaluate the effectiveness of the EFP application. Descriptive statistical tools were used to analyze the hydrological and erosion responses for the selected EFP rates. The parametric statistical analysis was conducted using one-way ANOVA and the least significant difference (LSD) tests to determine the significance of the soil properties of each treatment at the 0.05 probability level. All the analyses were conducted using R studio software (v. 4.2.0).

3. Results

3.1. Effect of the Application of EFP on Soil Properties

Table 2 shows the results obtained from the LSD test for soil properties for the different treatments. According to the results, the bulk density (BD) was significantly decreased in P2 compared to P1. The lowest BD was observed for the P2 treatment, whereas the highest value was obtained for the control (P1). However, no significant difference was observed between P2 and P3. In terms of soil porosity, it increased in EFP-treated soils compared to the control. The porosity obtained for the P2 treatment was significantly higher than P1 and P3. However, the porosity of P3 was not significantly different from P1.
The soil organic matter (SOM) content increased significantly with increasing EFP rates, as EFPs are derived from organic materials. Moreover, the SOM content in untreated soil was significantly lower compared to the EFP-treated soils. The results demonstrate that the control (P1) showed significantly higher hydraulic conductivity (Ks) than P2 and P3. The soil hydraulic conductivity decreased by 4.6% and 18% for P2 and P3, respectively, compared to the control. When considering the soil aggregate stability, the MWD values in both EFP treatments were significantly higher than those of the control. This means EFPs can increase soil aggregate stability. However, no significantly different results were obtained between the EFP rates (P2 and P3).

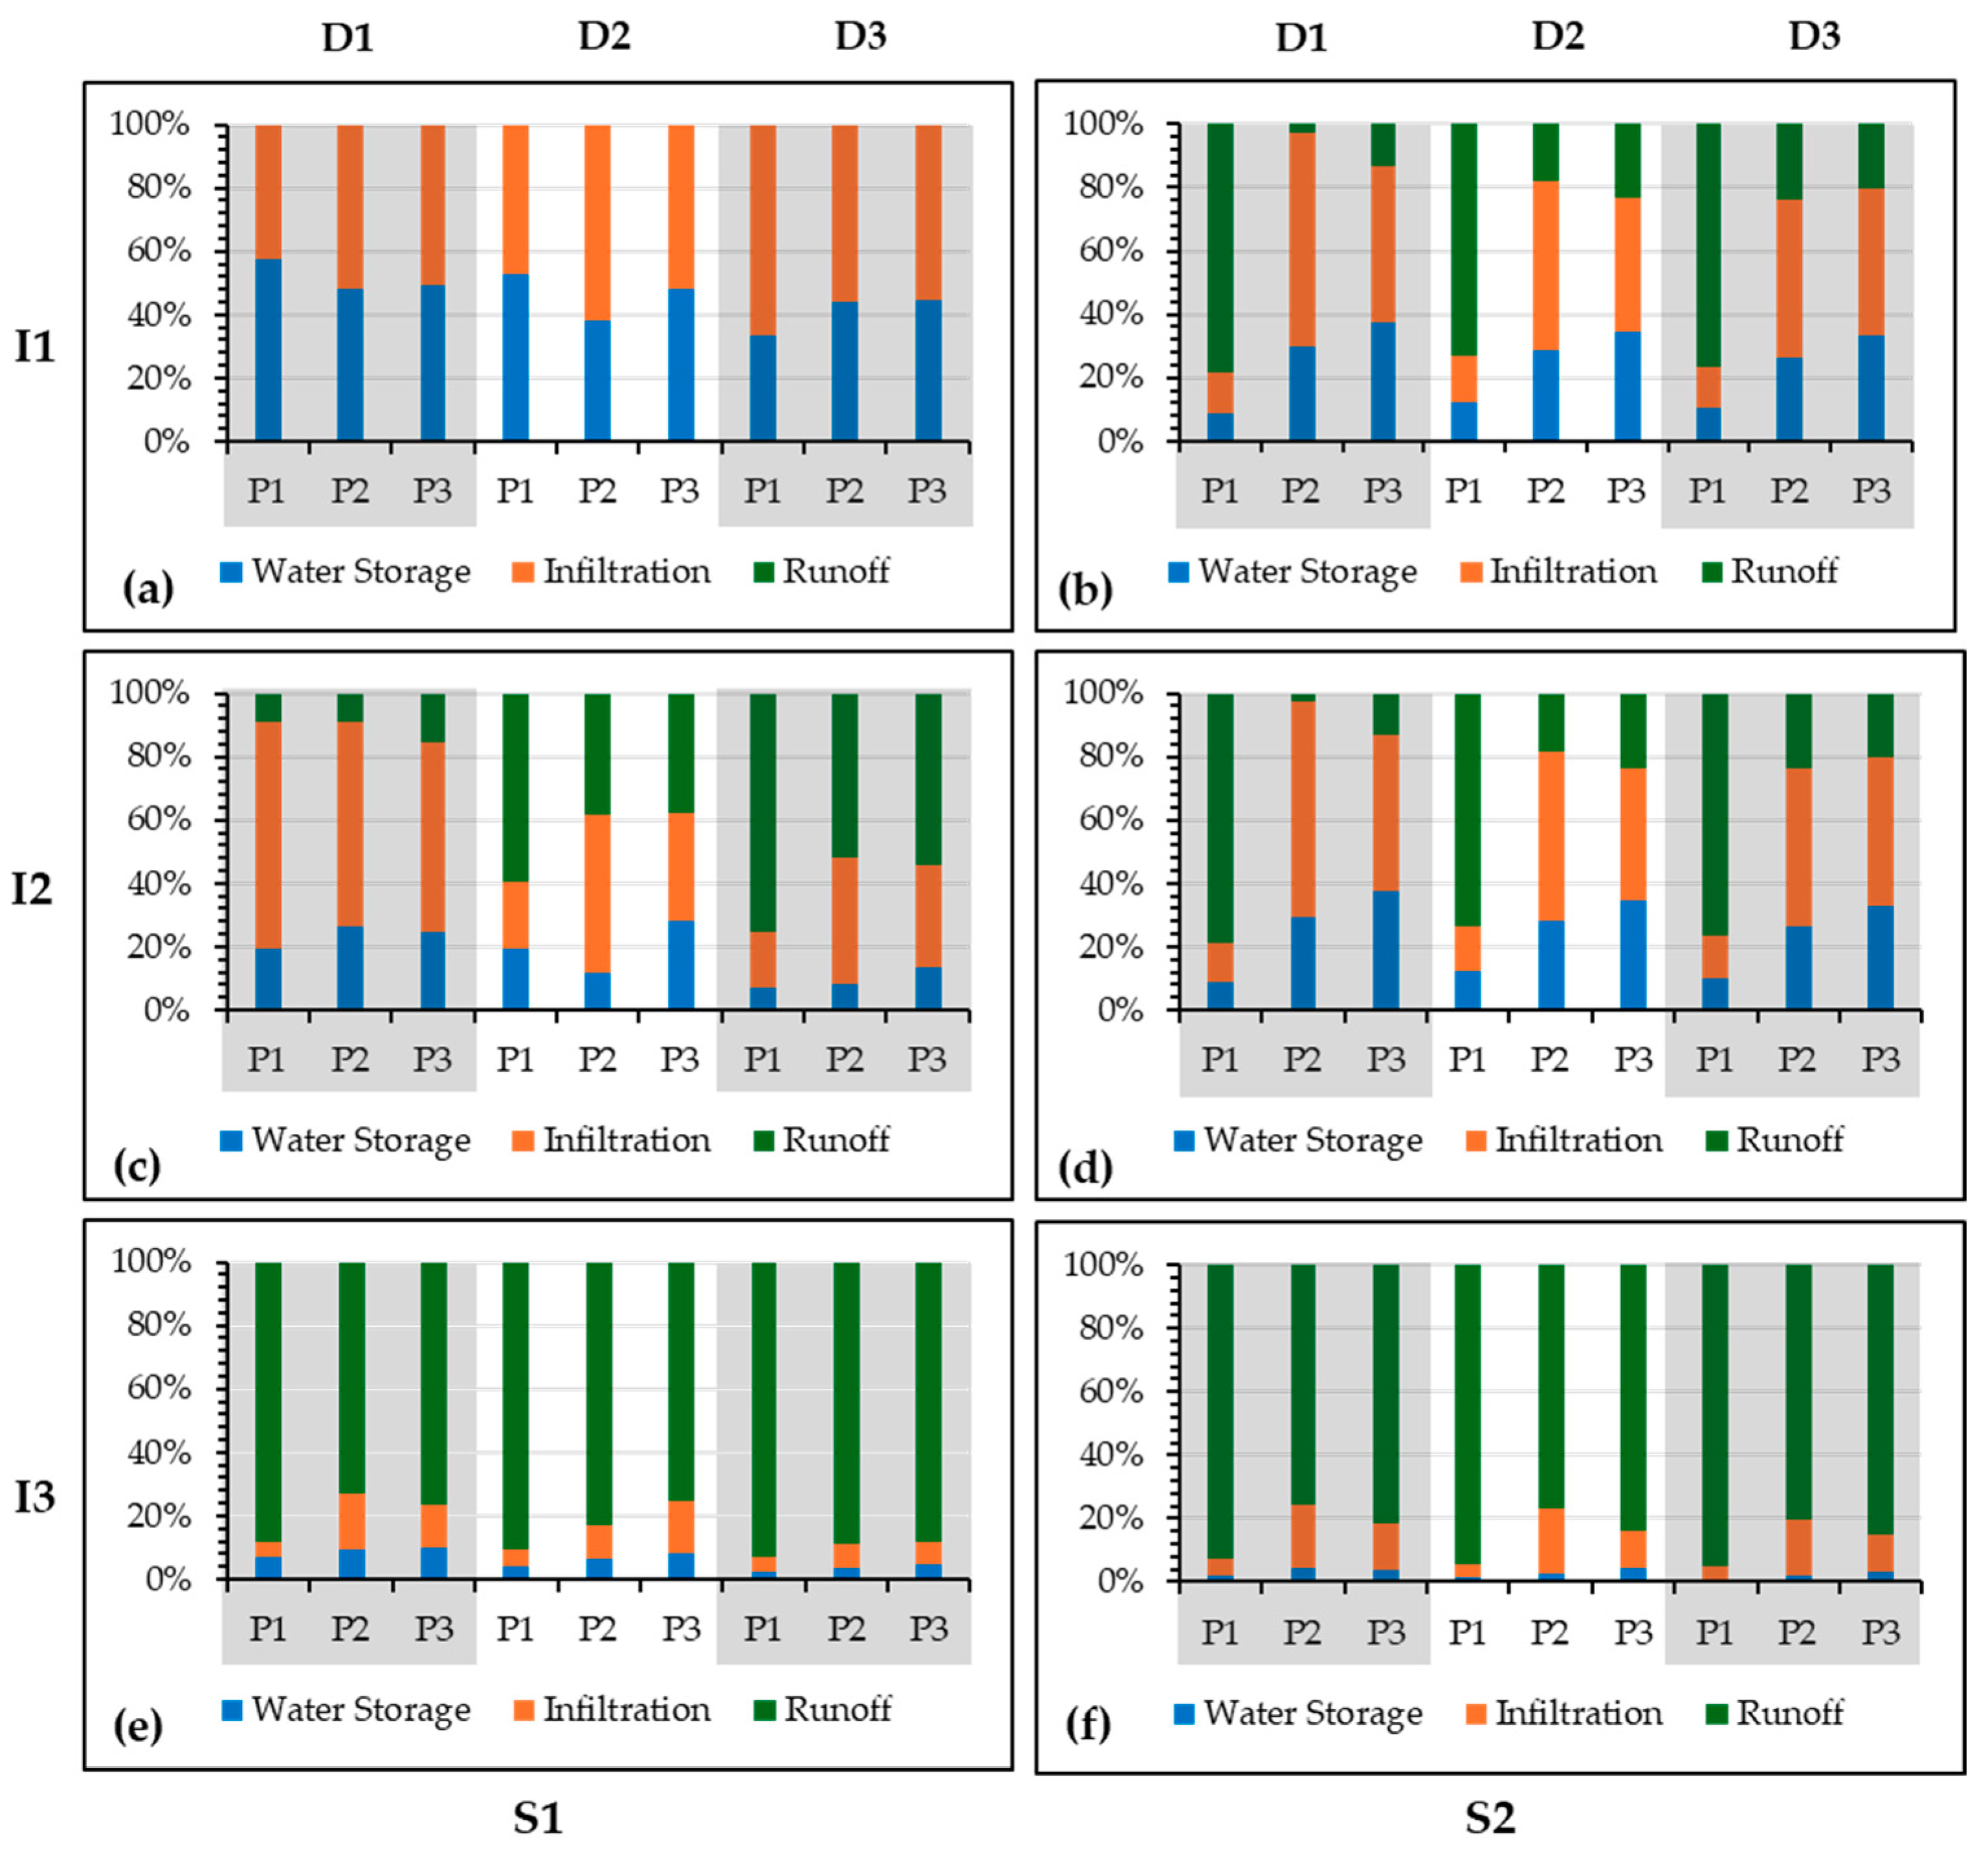
3.2. Effect of EFP Treatments on Hydrological Responses

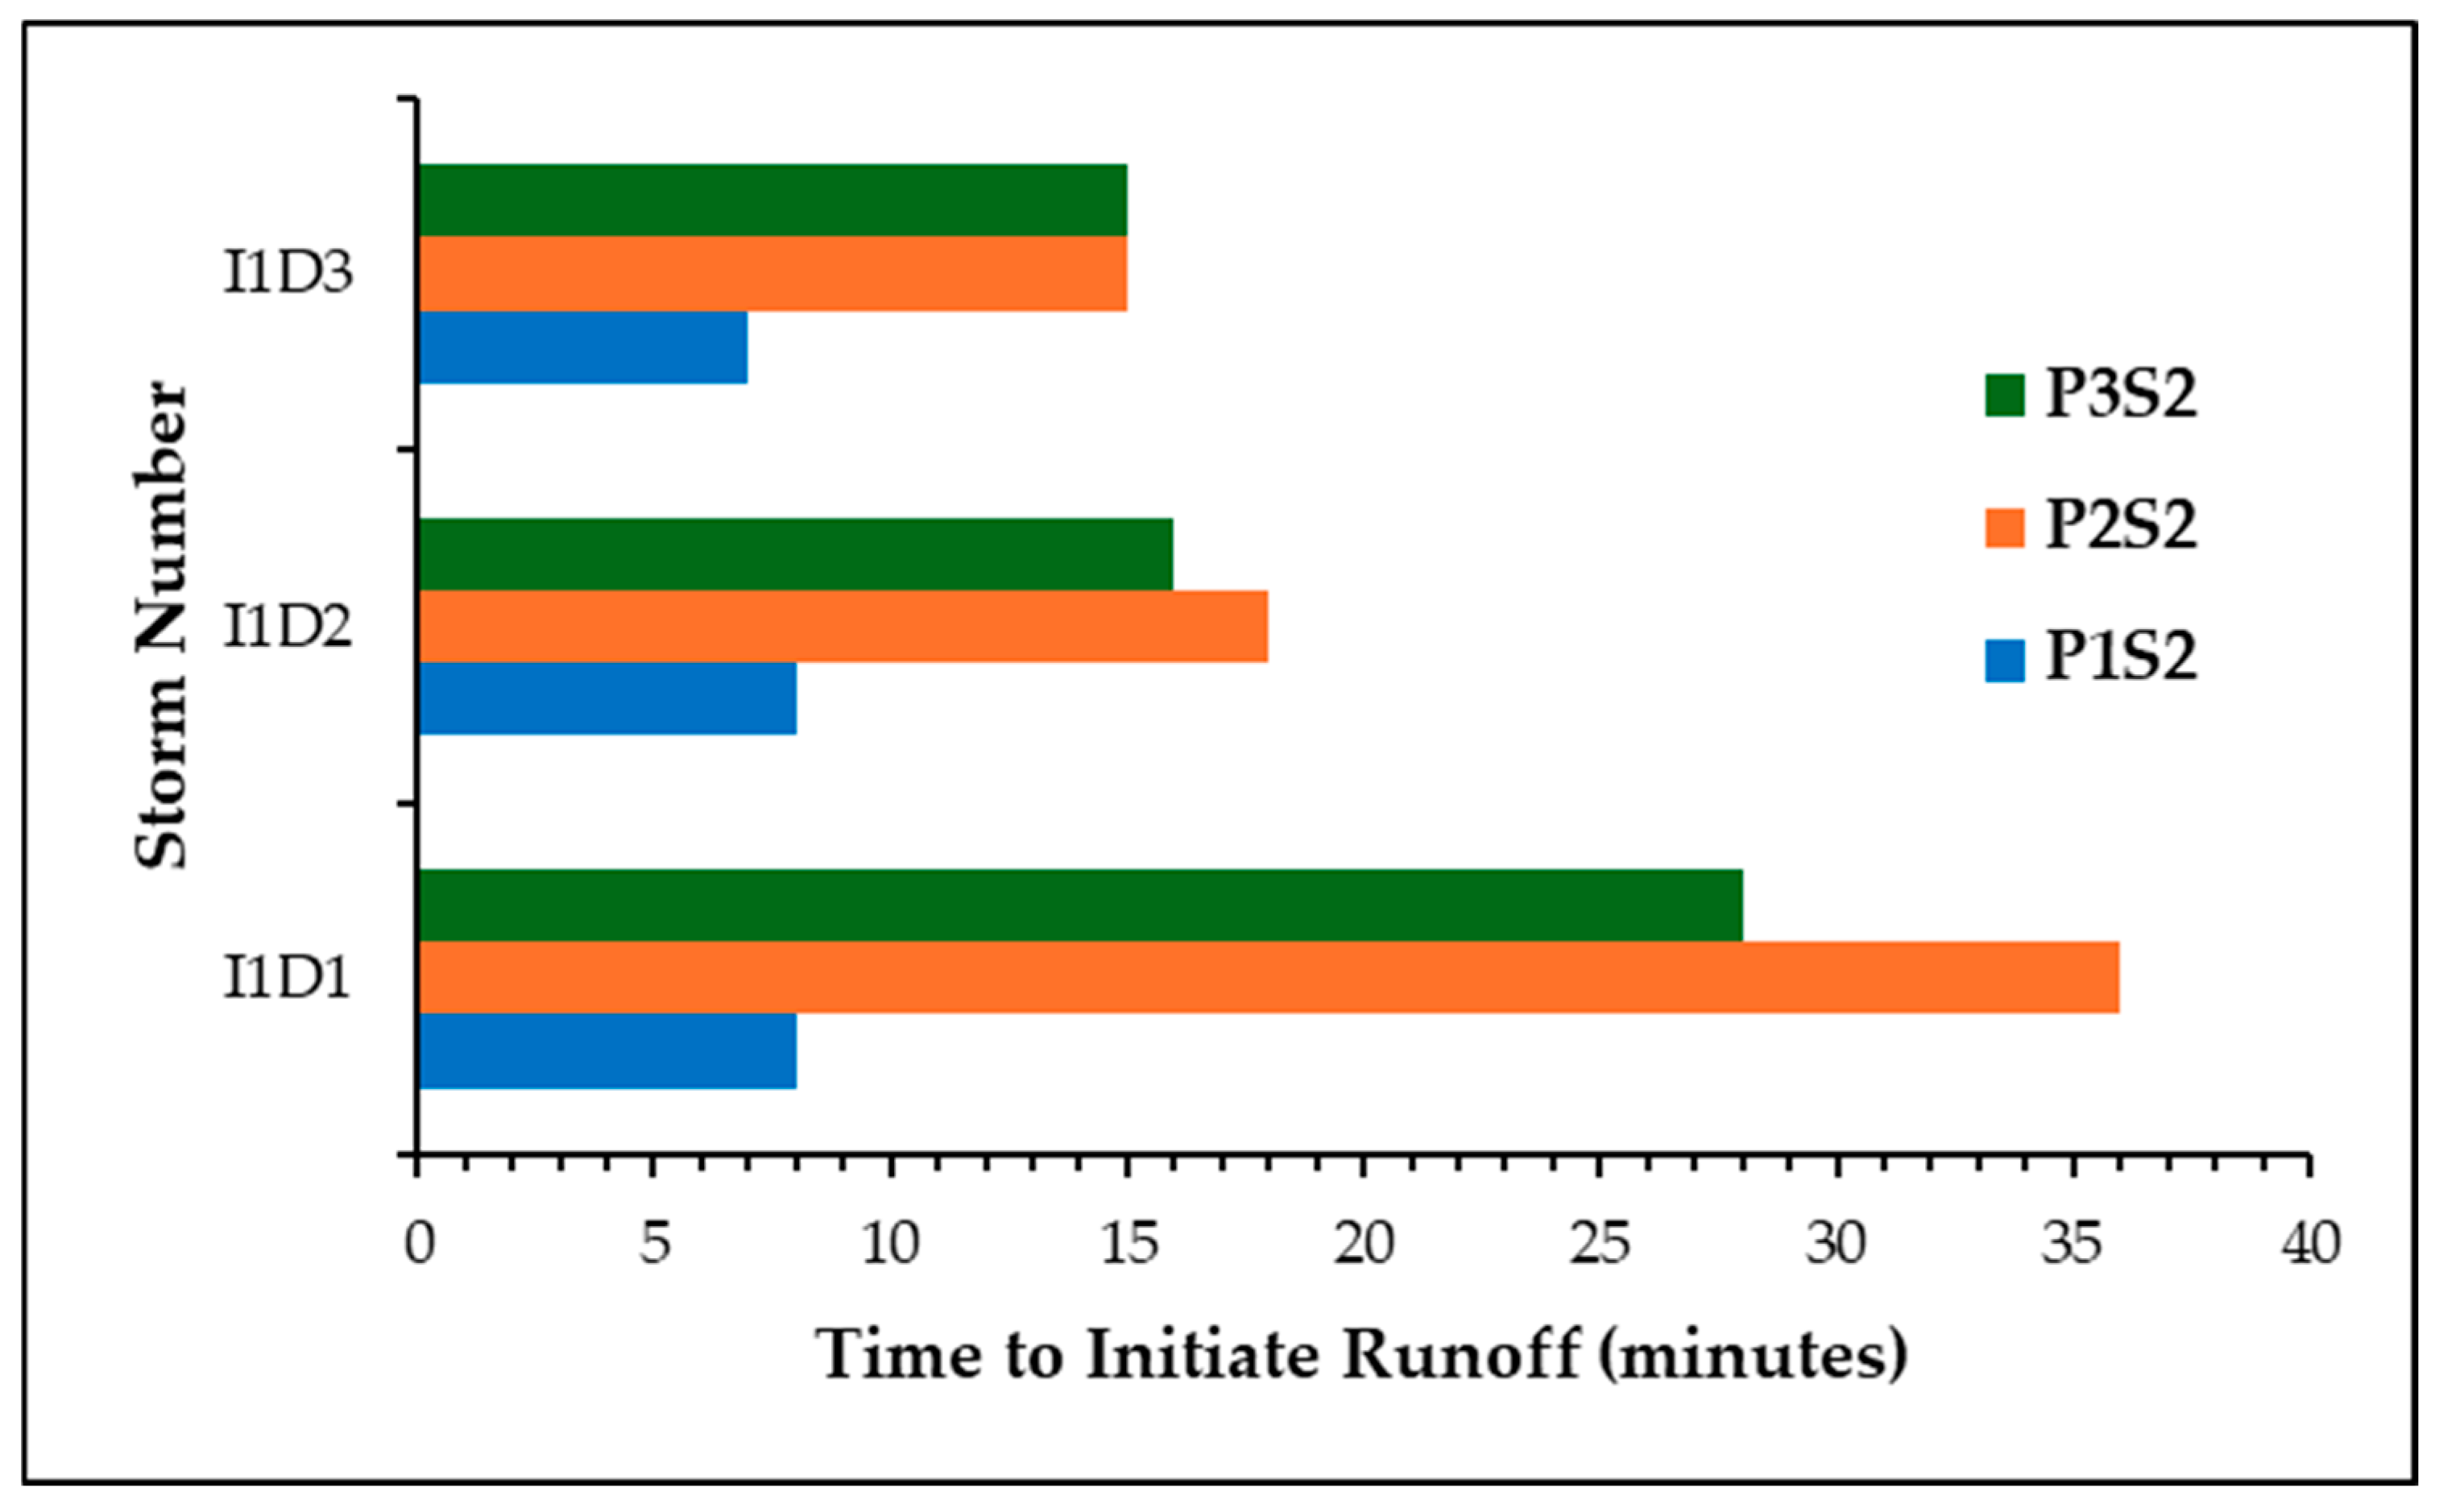
3.2.1. Time to Generate Runoff (TR)

In this study, TR was recorded for each treatment during the initial three storms at I1 rainfall intensity. As no runoff was generated during the initial three storms (I1D1–I1D3) under the lowest slope condition (S1), the TR was recorded as zero for all treatments. The recorded TR values for the 15% slope condition are shown in Figure 3. In general, the application of a polymer causes a delayed runoff generation time compared to control. During the first storm, the highest TR was observed at P2 (36 min), while the lowest value was obtained at P1 (8 min). Compared to the control, the runoff generation delay ranged from 77 to 46% and 71 to 46% for P2 and P3, respectively. Moreover, the runoff generation time was reduced after the first rainfall storm for P2 and P3.

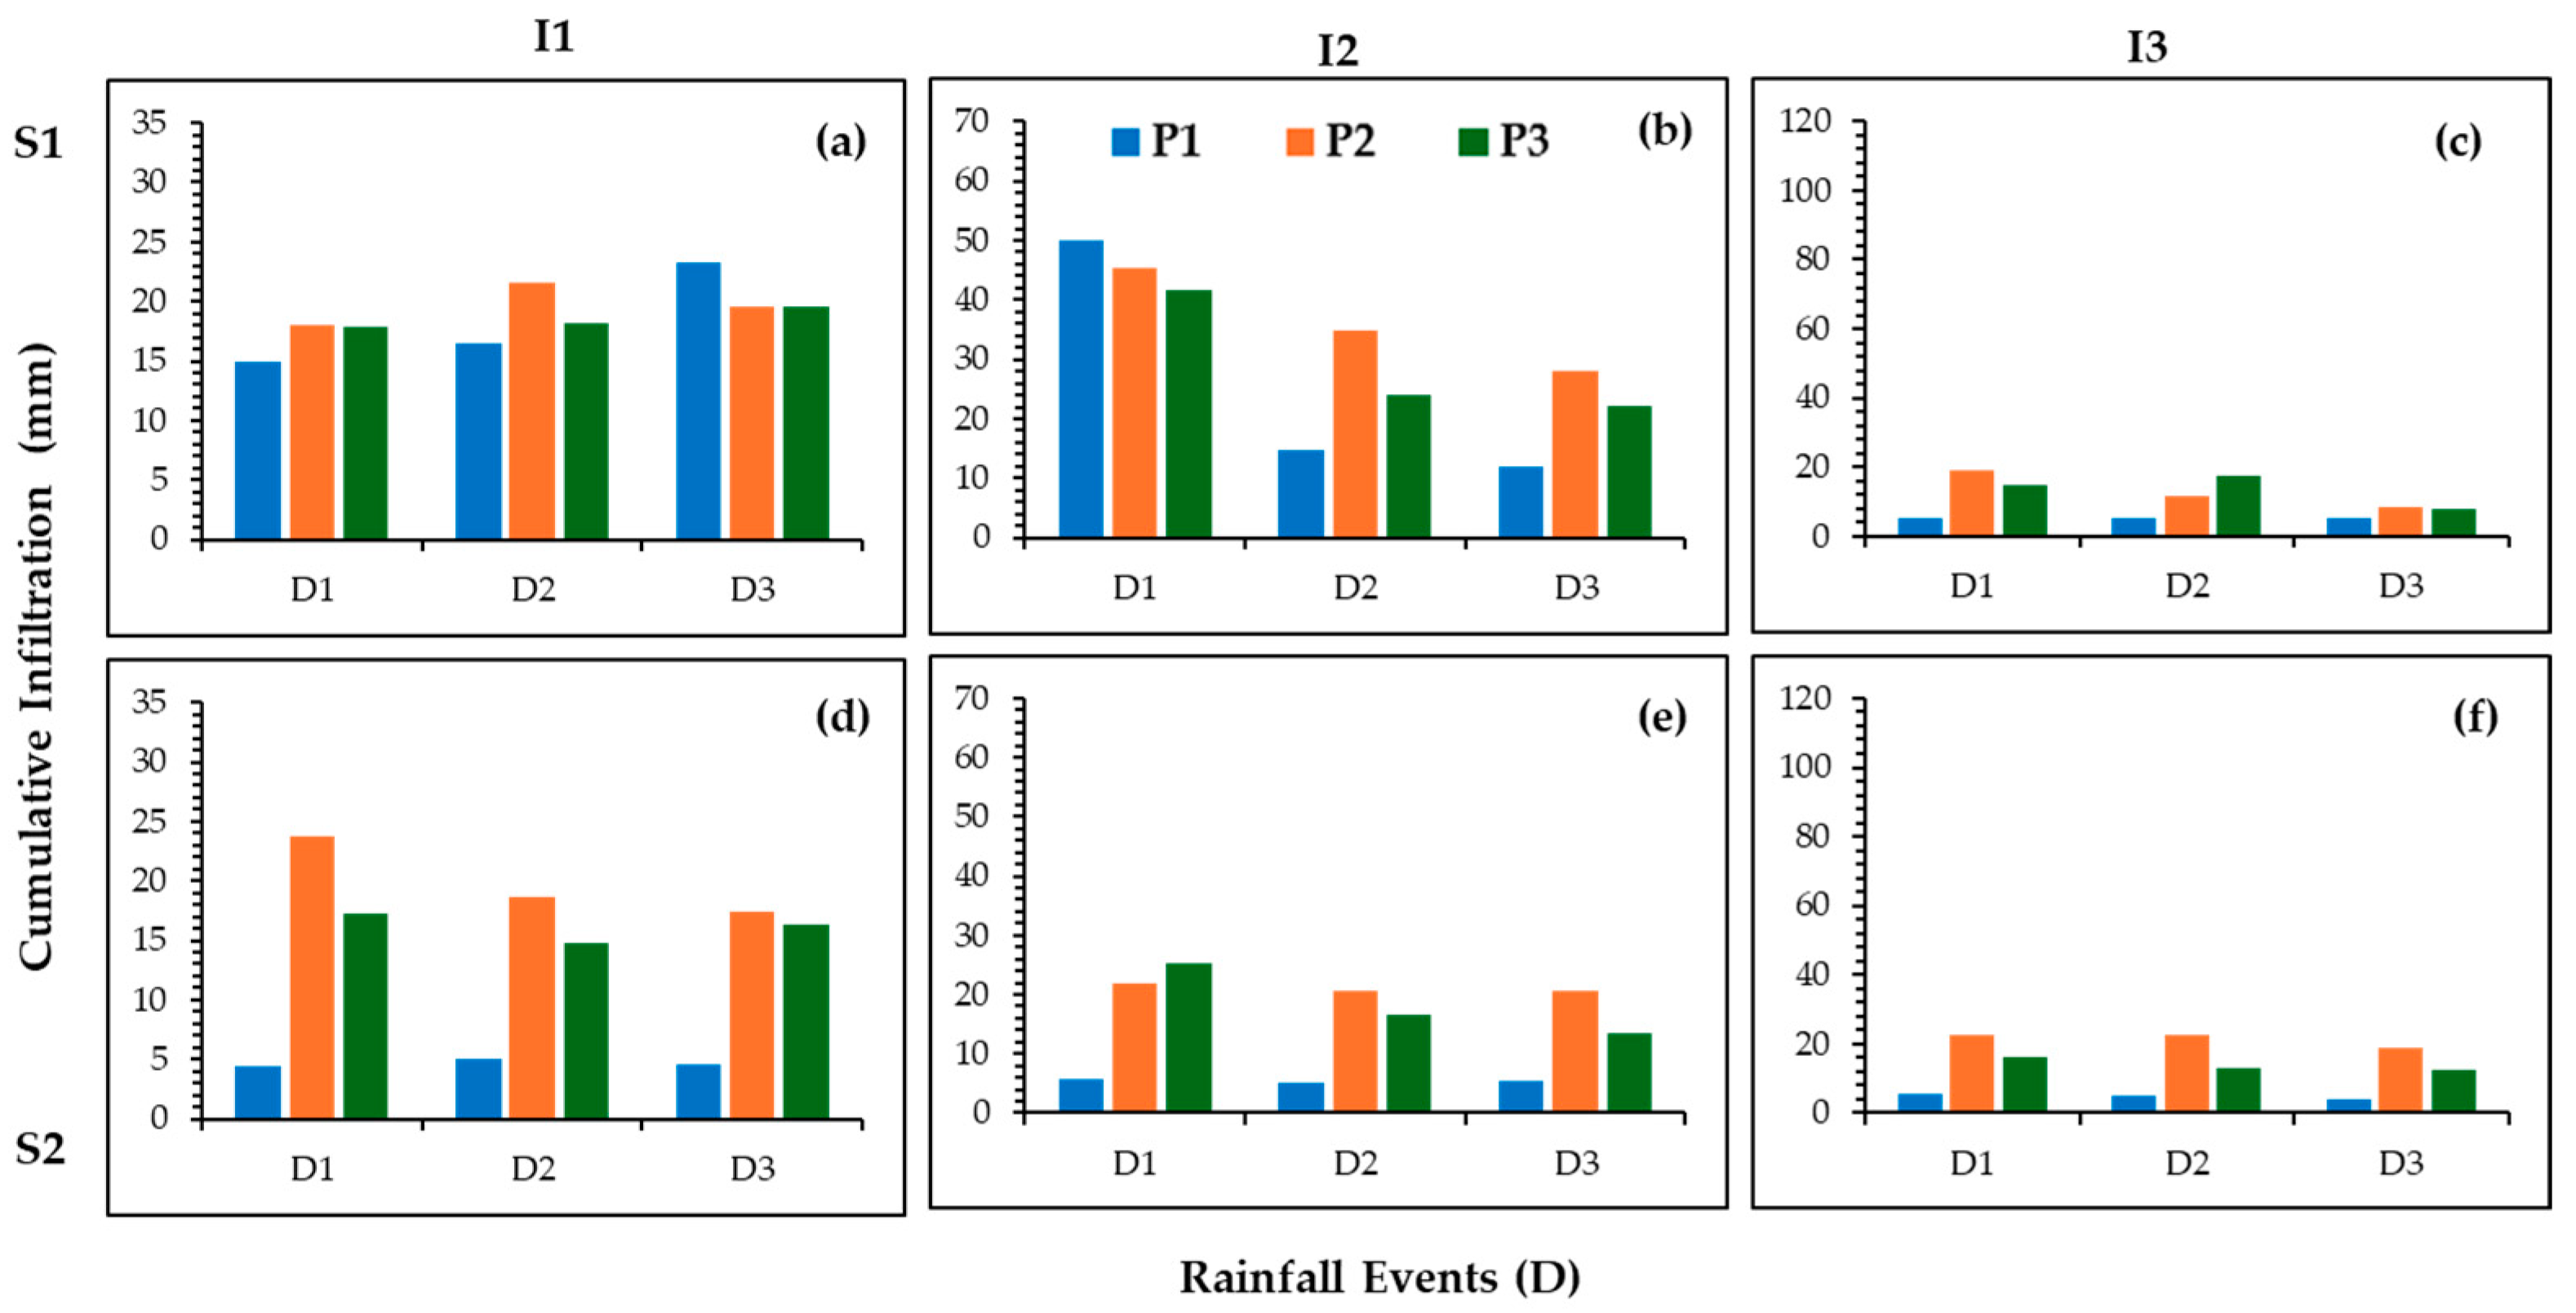
3.2.2. Infiltration (IR)

Figure 4 illustrates the effect of the EFP rate on cumulative IR for different rainfall intensities and slopes. Infiltration decreased with increasing rainfall intensity and gradient levels in all treatments. The EFP-treated soil maintained a high IR rate compared to that of the untreated soil. The maximum IR, ranging from 42 to 50 mm, was recorded during the first rainfall storm (D1) under the I2S1 condition for all treatments. The highest IR capacity, exceeding 43% of the net rainfall, was observed at the beginning of the S1 condition, under a rainfall intensity of I1, across all treatments (Figure 4a). After nine consecutive rainfall storms, the total IR was greater in P2 and lowest in P1 (P2 > P3 > P1). However, the difference in infiltration capacity between the P2 and P3 of EFP concentrations was not noticeable across all the conditions.

3.2.3. Surface Runoff (RO)

Figure 5 shows the variations in the cumulative RO depth for each treatment during all nine rainfall storms. The changing patterns in cumulative RO were similar for all rainfall intensities and slope conditions. Not surprisingly, the RO depth was increased when rainfall intensity and slope conditions increased. No RO was generated under the I1S1 condition (Figure 5a). Runoff was initiated from I2 rainfall intensity under the S1 slope condition for all treatments. Compared with the control, the RO reduction was remarkable for the EFP-treated plots under all rainfall and slope conditions. However, the RO depth at P2 and P3 showed variation for all the conditions, indicating no clear differences between the selected polymer dosages. The initial rainfall storms showed a greater RO reduction in cumulative runoff for both polymer-treated plots than during later rainfall storms.
Table 3 shows the total runoff with a reduction rate from all three rainfall storms (D1 to D3) for each rainfall intensity condition. For both slope conditions, the total RO was greatest for the control for every storm compared to the EFP-treated soils. The reduction in total RO under I1S2 conditions was 80.57% and 75.19% for P2 and P3, respectively (Table 3). However, it was also observed that the increase in the EFP concentration from P2 to P3 did not exhibit any notable RO reduction effect under the I1 conditions. In addition, the RO reduction effect diminished with the increasing exposure of the erosion plots to successive rainfall storms. The RO depth reduction effect of the EFP-treated soils ranged from 25 to 31% and 10 to 18%, values observed under the I2 and I3 rainfall conditions, respectively. The results showed that increasing EFP concentration (P3) led to a decrease in the RO reduction effect compared to the lowest EFP concentration (P2) for all the conditions, except for I3S1. At the end of storm 9, the cumulative RO was increased in the order of P1 > P3 > P2 for both slope conditions.

3.2.4. Water Storage (WS)

Figure 6 shows the percentage distribution of WS, IR, and RO as components of the water balance from net rainfall. In general, the WS values decreased under all the treatments with increasing slope and rainfall levels. The peak ranges of WS were observed for the initial rainfall storms (D1–D3) for the combination of I1 and S1 conditions by 33–58%, 38–48%, and 44–49% for P1, P2, and P3, respectively (Figure 6a). In addition, these erosion plots exhibited a higher infiltration capacity (>43%) with no runoff generated under any of the conditions. During heavy rainfall storms (I3), the lowest soil WS was observed for both slope levels. Specifically, untreated soils had 3–7% lower WS than the EFP-treated plots in S1 and a value of 1–2% lower in S2 (Figure 6). Moreover, the runoff increased during heavy rainfall, ranging from 73% to 95%, indicating a lower infiltration capacity. Compared to the control, the soil WS increased for the EFP-treated experimental plots (P1 and P2) for all rainfall conditions. In contrast, the highest concentration of EFP (P3) showed higher WS values compared to P2 across all rainfall storms. The maximum WS depth of P3 accounted for 44–49% of the total rainfall under I1 and S1 conditions. The results show that soil water storage increased in the order of P3 > P2 > P1 for all conditions.

3.3. Effect of EFP Rates on Soil Erosional Responses

3.3.1. Soil Loss (SL)

Cumulative SL variation patterns from the treatment plots for the nine rainfall storms are presented in Figure 7. Following the variation pattern of a reduction in RO, the cumulative SL also decreased in the EFP-treated plots compared to the control. For all the rainfall storms, the cumulative SL was lowered for the polymer-treated plots compared to the control. However, no clear differences were observed for the EFP-treated plots. Table 4 shows the total SL with a reduction rate in the erosion plots for each rainfall and slope condition. In general, the results showed a considerable reduction in SL in the EFP-treated plots compared to the control. The highest reduction effect in SL compared to the untreated soil was observed for the I1 condition, which decreased by 88.83% and 85.58% for P2 and P3, respectively (Table 4). Moreover, the SL reduction effect during the last rainfall condition (I3) for P2 and P3 ranged from 11 to 22% and 26 to 34% for S1 and S2 slopes, respectively. Moreover, there was not a considerable difference between the cumulative SL reduction effect for both EFP concentrations during the I1 and I2 rainfall storms. The SL reduction effect between P2 and P3 considerably varied during the I3 storm.

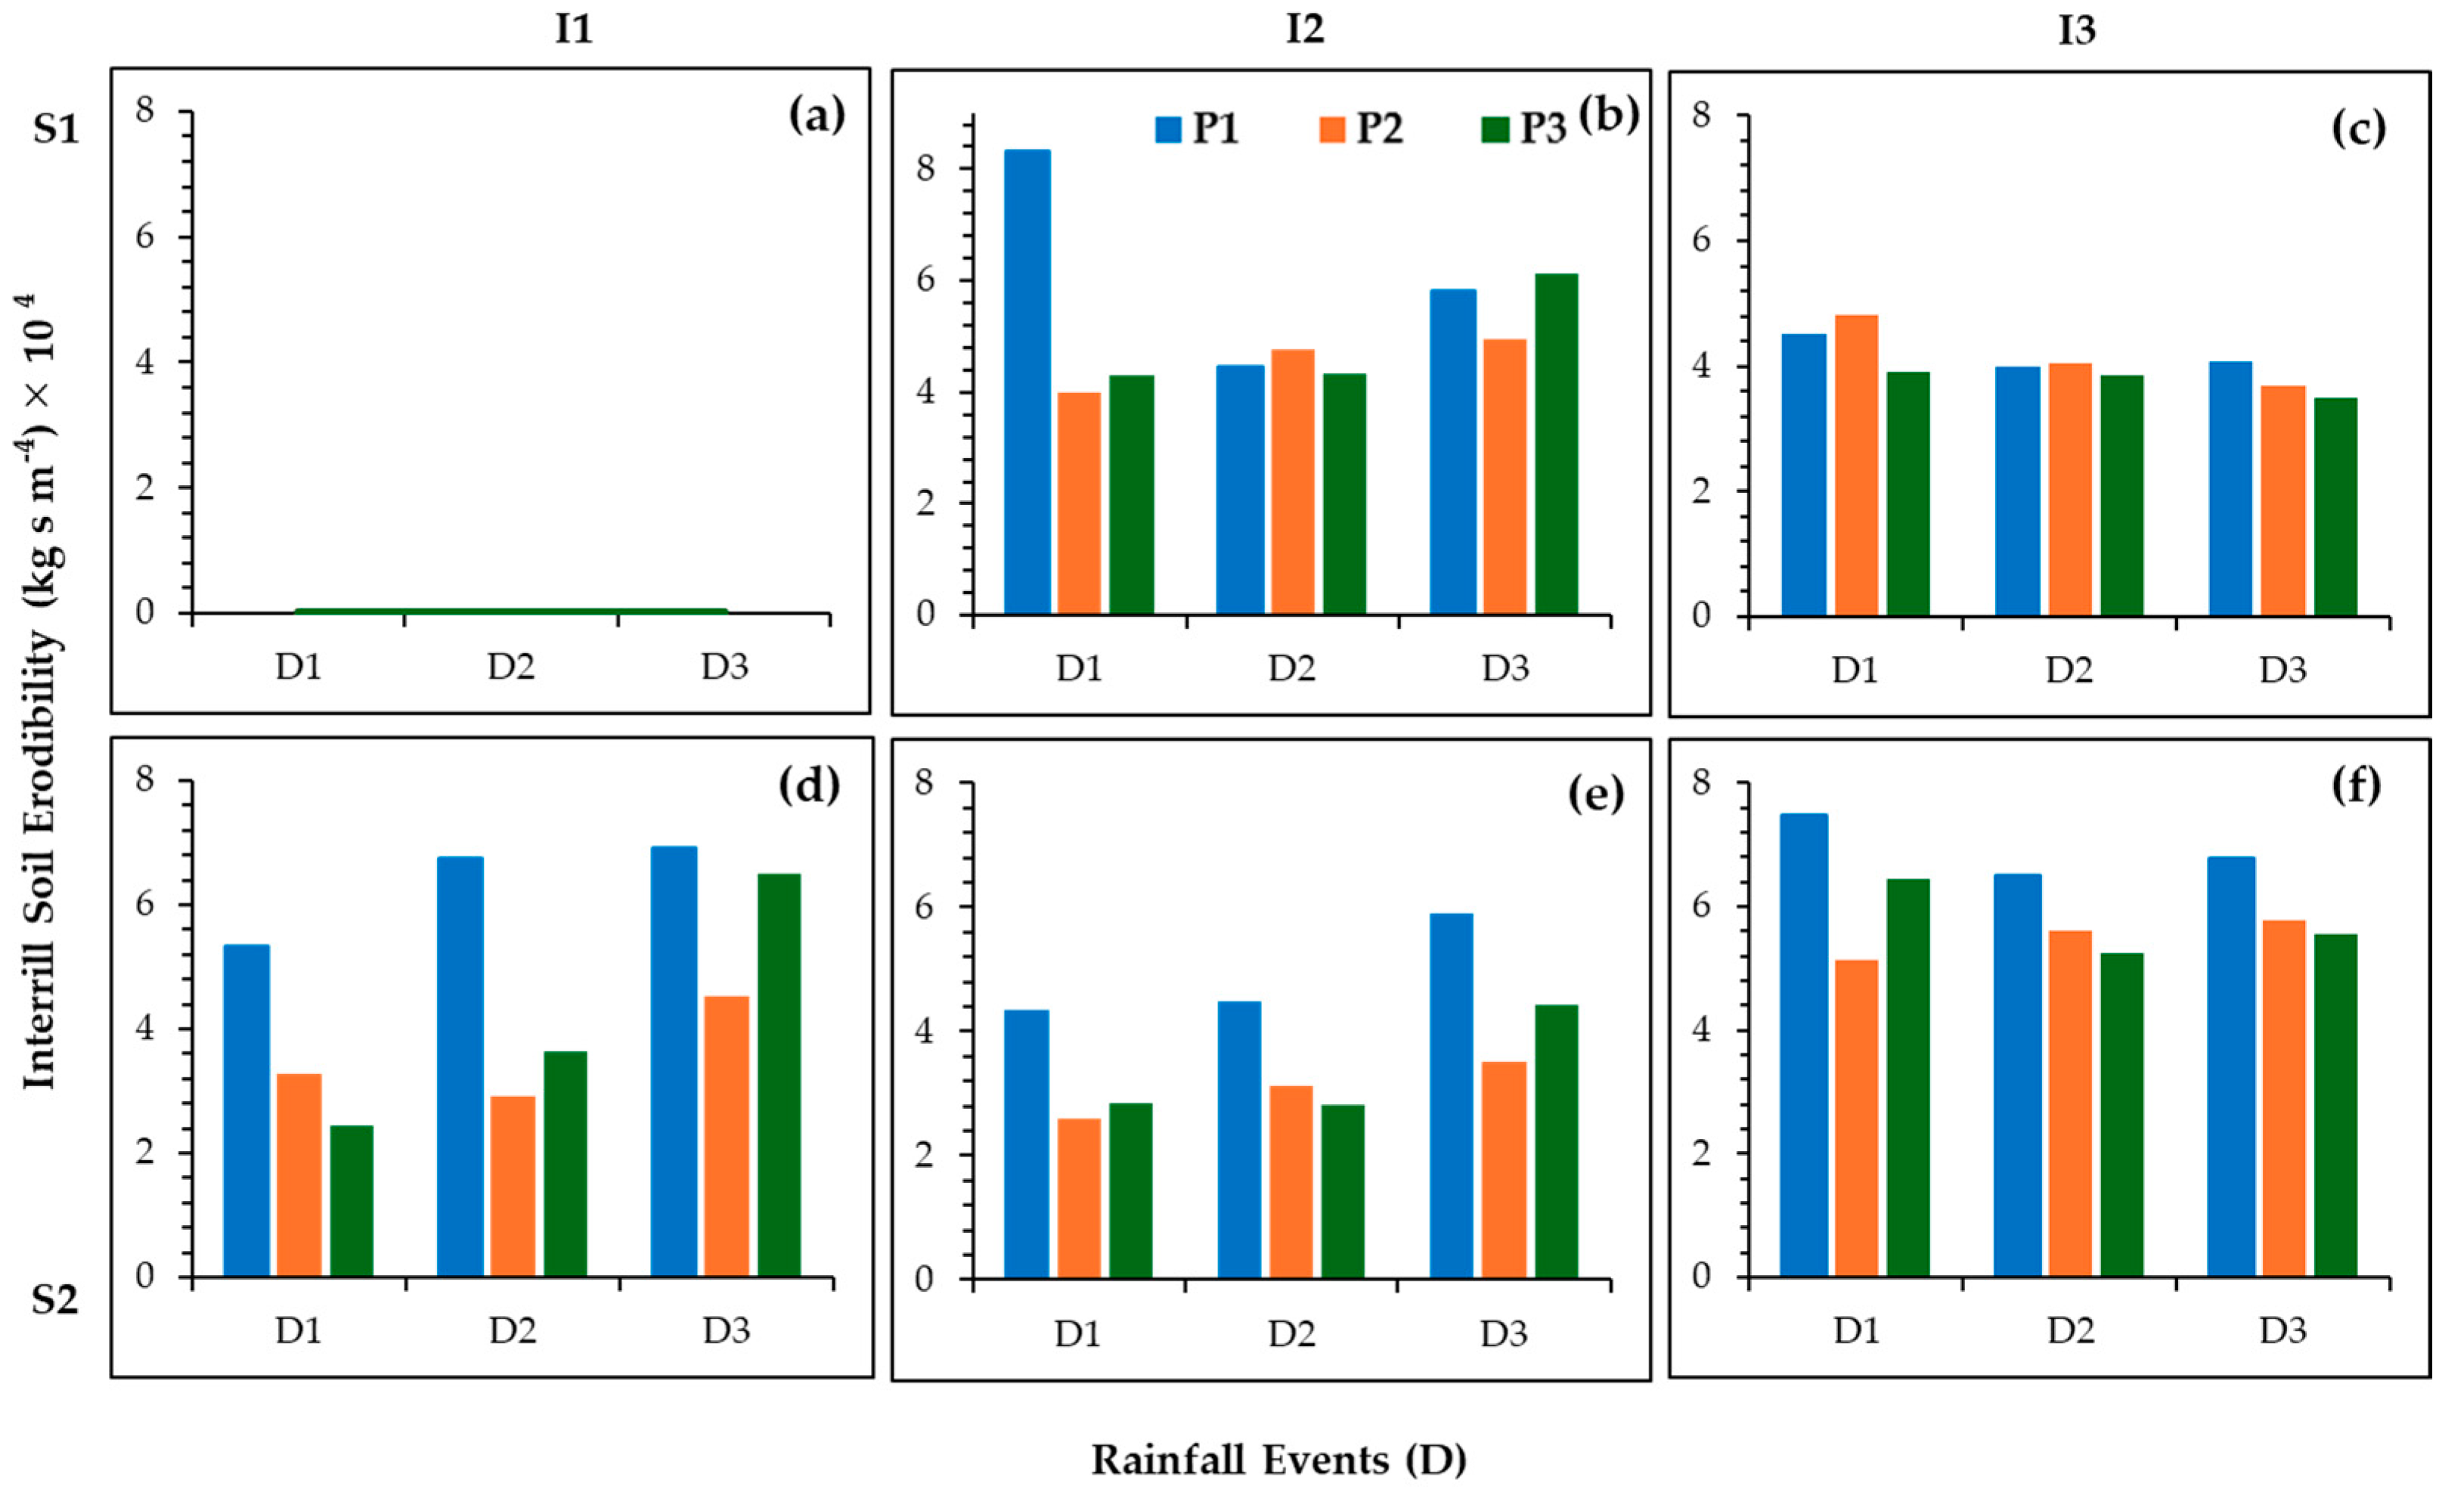
3.3.2. Interrill Soil Erodibility (Ki)

Figure 8 demonstrates the variability in Ki values across the different treatments and rainfall intensities. The P1 treatment consistently resulted in the highest Ki values across all conditions, with the most pronounced values observed under the highest rainfall intensity (Figure 8f). In contrast, P2 and P3 exhibited lower Ki values, indicating less soil loss than untreated soil. The increasing trend of Ki values from D1 to D3 is particularly noticeable for P1, though this pattern is not uniform across all figures. For the S1 slope, the highest Ki value was observed during the first rainfall storm (D1) under the I2 condition, with a value of 8.34 × 10⁴ kg s m4 (Figure 8b). The highest interrill erodibility factor value, 7.5 × 10⁴ kg s m4, was observed in the untreated soil during the final rainfall event under the highest rainfall intensity with an S2 slope (Figure 8f). Across both slopes, the P1 > P2 > P3 trend was consistent, highlighting the higher erosion susceptibility of untreated soils under varying rainfall conditions.

4. Discussion

4.1. Evaluating the Influence of EFP on Soil Properties

Assessing the impact of EFP on the soil’s physical properties such as bulk density (BD), porosity, soil organic matter (SOM), saturated hydraulic conductivity (Ks), and aggregate stability is essential for understanding how EFP treatments enhance soil quality and its hydrological performance. BD is a crucial physical parameter because it directly relates to other soil parameters, such as moisture retention, infiltration, and porosity. The application of soil amendments can lower BD, and it can produce optimal plant growth and crop yields. For our tested soils, BD decreased with the addition of EFPs (Table 2). When EFP absorbs water, it expands within the soil, creating more space between the soil particles. As the soil dries and the EFP shrinks, the porosity of the soil increases, which causes a reduction in BD. In our study, the soil porosity values were greater in polymer-treated plots (Table 2). The studies conducted by Abrisham et al. [65] and Bai et al. [66] reported that the soil bulk density decreased with the application of SAPs. A previous study conducted by Han et al. [67] indicated that soil porosity increased with the addition of SAPs. Similarly, our results demonstrated that EFP-treated soils had lower bulk density and higher porosity than the control, and the addition of EFPs reduced surface runoff and soil loss.
Soil organic matter helps to create stable soil structures and provide soil nutrients. The soils with the richest SOM have more potential to reduce soil erosion due to their improvement of the soil structure by increasing aggregation and decreasing bulk density. Our results showed that the SOM content increased with increasing EFPs (Table 2). EFPs are derived from organic materials such as orange peels and, thus, have higher organic matter content. In addition, the water and soil loss in the EFP-treated plots decreased compared to the control; this is another reason for the increase in SOM in the polymer-treated soil [68]. Yang et al. [68] reported that the application of SAPs provides more organic matter immediately than natural amendments such as organic manure, which need time to decompose and become effective.
Saturated hydraulic conductivity is an important physical parameter in soil analysis experiments. The results demonstrated that the Ks of the soil decreased with increasing EFP concentration (Table 2). The swollen EFPs affect the soil pore geometry by decreasing pore space, which may reduce the Ks due to the resulting pore blockage [69,70]. Therefore, soil Ks could be decreased due to the application of EFPs. Although the Ks decreases with increasing EFP concentrations, treated soils can absorb more water due to their higher water absorption capacity. EFPs gradually release water as soil moisture decreases from evaporation, allowing plants to access water in dry conditions. Previous studies have also reported that while Ks decreases, water retention increases with higher rates of SAPs [69,71].
Aggregate stability is an important parameter in the evaluation of soil structure improvements. High aggregate stability leads to improved soil quality by reducing nutrient losses, increasing porosity, and reducing soil erosion [68]. The mean weight diameter is one of the most important indicators in measuring soil aggregation, in which a higher MWD of aggregates shows higher soil structural stability [64]. Our results demonstrated that the MWD values of the EFP-treated soil (P2 and P3) significantly increased compared to the control (Table 2). The addition of EFPs can enhance the soil aggregate stability by improving water absorption and promoting the formation of larger soil aggregates through the binding of soil particles by creating a more cohesive structure. When EFPs absorb water, they swell and fill pore spaces, promoting the aggregation of soil particles and improving their stability [68]. EFP-treated soils demonstrate improved stability, leading to reduced runoff and soil loss, while control plots obtained considerably higher values. Similarly, Yang et al. [68] showed that soil aggregation significantly improved with the application of SAPs compared to natural amendments. In addition, they indicated that the application of a higher rate of SAPs can create a hard soil structure, which causes an increase in soil erosion due to poor soil quality. Our results showed no significant difference in MWD between the two selected EFP rates; this may have occurred due to the soil’s inherent characteristics, such as the soil texture (Table 2).
Overall, a comparison of the soil properties showed that there were no significantly different results between the P2 and P3 rates. Similarly, Abrisham et al. [65] also reported no significantly different results between SAP treatments (1 g dm−3, and 3 g dm−3) in a study comparing soil properties, they recommended that the lowest concentration of SAP is the best, as it improved soil properties and was economically viable. Li et al. [72] reported that runoff and soil sediment decreased when increasing the rate of the PAM superabsorbent polymer (<0.7 g kg−1). Therefore, based on our results, low concentrations of EFP (3–6 g m−2) have the potential to effectively improve the soil’s physical properties.

4.2. Evaluating the Influence of EFP on Hydrological Responses

4.2.1. Analysis of Time to Initiate Runoff

A delayed runoff initiation can reduce soil erosion by allowing more time for water to infiltrate into the soil, thus, decreasing the volume and velocity of the surface runoff. This can lead to better water retention, improved soil structure, and enhanced agricultural productivity. According to our results, under the lowest slope condition, no runoff was generated because the combination of rainfall and slope was insufficient to induce surface water loss, which is attributed to the greater infiltration capacity of the soil. The results of the S2 conditions indicated that the runoff generation time was delayed with the application of EFPs in comparison to the control, resulting in less soil surface water loss (Figure 3). The soil structure could improve due to the application of SAPs by increasing the soil aggregate stability, which could lead to a delayed runoff generation time [65]. Based on our study results of the soil properties, the EFP-treated soils had higher stability with greater MWD values compared to the untreated soils (Table 2); on the other hand, due to the higher water absorption capacity of the EFPs, the runoff generation time may decrease in EFP-treated plots. Cao et al. [47] reported that the initial runoff time was delayed in the rainfall simulation study when increasing the rate of SAPs. Similarly, Li et al. [72] investigated whether the initial runoff generation time could be delayed due to the application of different rates of PAM polymer (0.4–1.3 g kg−1). However, our results indicated that the runoff initiation time was reduced for all treatments from the second rainfall storm onward, likely due to the inadequate time left between storms for the soil plots to dry completely. Yakupoglu et al. [28] reported that the runoff generation time could be reduced by the application of SAPs, and the runoff generation was initiated earlier under sequential rainfall storms for all treatments with a 15% slope.

4.2.2. Analysis of Infiltration (IR)

According to the test results, the cumulative IR decreased with increasing slope and rainfall intensity levels (Figure 4). The condition with the lowest slope and rainfall intensity showed the highest IR capacity, exceeding 43% of the net rainfall, indicating that no runoff occurred in any of the treatments (Figure 8a). Slope and rainfall intensity are factors with a strong influence on infiltration. The IR decreases with increasing slope level due to the decrease in the surface storage capacity and pressure head during ponding [73]. In addition, increasing rainfall intensity with consecutive rainfall storms may create crust layers on the soil surface and cause blockages in the soil by reducing the IR capacity during later storms [74]. The EFP-treated soils showed a noticeable increase in IR depth compared to the untreated soils (P2 > P3 > P1) (Figure 4). When the SAPs were applied to the soil, properties such as its water-holding capacity, porosity, and aggregation could be increased and lead to an enhanced soil IR value [32,33]. The results of the soil properties indicated that EFPs may improve soil physical properties, with decreased bulk density, increased porosity, increased soil organic matter, decreased saturated hydraulic conductivity (Ks), and increased soil aggregate stability (Table 2). Interestingly, although the Ks decreased, the infiltration rate (IR) increased in the EFP-treated soils. This phenomenon can be attributed to improved soil structure and aggregate stability, which increase water retention and distribution, facilitating greater downward movement of water. Similarly, a study of the effectiveness of PAM on soil erosion control conducted by Li et al. [72] reported that the infiltration rate increased at the beginning of the rainfall period and decreased when runoff was initiated during the later stages by improving the soil structure. However, the optimum EFP rate could not be confirmed from our results because we found slight variations in IR rates between the selected EFP rates. Similarly, Trout et al. [75] reported that the infiltration capacity was increased by the application of PAM polymers, and they also observed inconsistent results between the experiments. Kebede et al. [37] also reported that the infiltration rate decreased with increasing rates of PAMs in six consecutive rainfall storms under 70 mm h−1 rainfall intensity. Therefore, the results of our study confirm that the application of EFPs could improve soil IR for water retention and management.

4.2.3. Analysis of Surface Runoff (RO)

The results obtained from this study demonstrated that the cumulative RO values were minimal across all treatments during early rainfall events while increasing during the latter stages of rainfall storms (Figure 5). At the lowest rainfall intensity (I1), no RO was generated for the lowest slope condition (S1), as this condition exhibited a notably higher IR capacity (Figure 4a). The gentle slope, combined with low rainfall intensity, allowed for more efficient water absorption into the soil, preventing surface RO. A rainfall simulation study conducted by Zhao et al. [76] reported that the lowest rainfall intensity with the lowest slopes was not large enough to cause surface RO. Thus, the combination of I1 and the S1 slope condition is not sufficient to cause surface water loss through RO for the selected clay-type soil. According to the results, the cumulative RO decreased with increasing rainfall intensity and slope gradients (Figure 5). The increasing rainfall intensity may affect the creation of sealing formation on the soil surface for all treatments. Previous studies found that the crust formation on the soil surface would reduce soil IR and result in increased RO generation [77,78,79]. Therefore, surface RO was increased for all the treatments, and there were slight differences observed between the control and EFP-treated soils after the first period of rainfall. Assouline and Ben-Hur [80] concluded that factors including rainfall intensity and slope gradient have a significant effect on soil surface sealing and it is directly related to enhanced runoff and sediment yield. Our findings proved that the rainfall intensity and slope effect may be heavily influenced by RO generation because the cumulative runoff varies with changes in both slope and rainfall intensity.
In our study, the application of different EFP–soil mixtures demonstrated a notable reduction in total RO generation compared to untreated soils (Table 3). It was evident that the SAP-treated soils consistently generated less RO depth than the untreated soils [37]. However, the effectiveness of EFPs in controlling surface water loss can diminish over time when erosion plots are exposed to consecutive rainfall conditions. Repeated intense rainfall can gradually wash EFPs away from the soil surface, resulting in reduced water absorption and soil cohesion [37]. Thus, RO values increased under the last rainfall intensity condition (Figure 5c,e). Initially, EFP molecules absorb more water, swell, and occupy greater pore spaces within the soil. As the SAP swells, it creates a more viscous, gel-like thickened structure within the soil matrix [37,81]. Thus, the overall viscosity of the soil–water mixture increases more in SAP-treated soils than in untreated soils [82]. The higher viscosity of the soil–water mixture could lead to the prevention of rapid water movement across the soil surface, resulting in a reduction in the surface RO in EFP-treated soil. Previous studies also reported that SAPs can increase the viscosity in soil–water mixtures and reduce soil-water loss [83,84]. Moreover, when the rainfall events progressed, the EFP-treated soils had better soil quality, resulting in less RO generation than in control. Furthermore, our results demonstrated that increased aggregate stability in EFP-treated soils compared to the control (Table 2) contributed to a reduction in RO generation. Previous studies reported that the aggregate stability may break down due to the raindrop effect in untreated soil and cause enhanced RO generation due to enhanced crust formation [74,85]. In the simulated rainfall tests, the P2 and P3 EFP rates exhibited only slight variations in RO generation, suggesting that their effectiveness in managing runoff may be similar under the tested conditions.

4.2.4. Analysis of Water Storage (WS)

Soil water storage is critical for optimal plant growth as it directly affects soil moisture levels, which are vital for sustaining healthy plants [60]. When rainfall is effectively captured and retained in the soil, it ensures that plants have a steady supply of water, especially during dry periods. According to the results, the soil WS depth was at its peak during the early rainfall storms compared to the later storms because the erosion plots had loose soils with higher porosity (Figure 6). In addition, the WS decreased during heavy rainfall because of the higher rainfall intensity, which led to increased runoff due to soil compaction. Chen et al. [86] reported that soil WS is highly dependent on the rainfall intensity and soil gradient. In comparison to the control, the soil WS increased in the EFP-treated experimental plots (Figure 6). This improvement can be attributed to the ability of EFP treatments to enhance soil moisture retention, likely by improving the soil structure, reducing compaction, and increasing porosity (Table 2). These changes promote better water infiltration and retention, reducing rapid runoff, and allowing more water to remain stored within the soil. In addition, EFP increases the water-holding capacity due to its hydrophilic groups, which allow it to absorb and retain significant amounts of water, enhancing soil moisture retention. Previous studies found that the application of SAPs improved soil’s water retention capacity [41,66]. On the other hand, we used clay soil for this study, which is favorable for water absorption, and the addition of EFP could enhance the WS capacity [66]. Thus, applying EFP is crucial for enhancing soil water movement, resulting in greater WS in the shallow root zone, where many roots are concentrated.

4.3. Evaluating the Influence of EFP on Soil Erosional Responses

Similarly, cumulative SL in untreated soil erosion plots increased compared to the EFP-treated soils, which can be attributed to some key factors related to the impacts of EFP on soil structure in relation to reducing soil erosion. When EFPs are incorporated into soils, they absorb more water and expand, thereby enhancing the binding effect of clay particles in the soil structure [87]. This binding effect can increase soil aggregate stability and reduce soil erosion due to the resistance of soil particles moving across the soil surface [37,47]. According to the results, the soil aggregate stability was significantly higher in EFP-treated soils compared to the control (Table 2). In contrast, untreated soils are more prone to erosion due to the lack of aggregate stability. Yakupoglu et al. [28] discovered that soil loss could be reduced by applying SAPs due to the enhancement of the soil aggregate stability. Moreover, the viscosity of the SAP-treated soil increases more than that of the untreated soil due to the swelling ability of the soil [88]. Thus, the soil cohesion and stability were improved by reducing the rapid flow movement within the soil surface. Consequently, SL is effectively reduced due to the decrease in sediment transportation by water from a more viscous soil–water matrix. Previous studies reported that the application of SAPs effectively prevents SL due to the increase in the runoff viscosity [83,84]. Similarly, EFP-treated soils produce less RO due to the increase in soil water retention and infiltration, which reduces SL compared to the control (Figure 5 and Figure 7). Untreated soil may result in higher SL because sediments are easily transported by the higher runoff volume [83]. Interestingly, the differences in RO and SL between the selected EFP rates (P2 and P3) were relatively slight, suggesting that this SAP was effective in reducing RO generation even at a lower concentration. Similarly, Kebede et al. [37] used six consecutive rainfall storms to study the effectiveness of PAM for erosion control. They reported that RO and SL were effectively reduced at lower concentrations of SAPs than in the untreated soils during later rainstorms. Therefore, the results confirmed that EFP is effective in reducing soil erosion.
The interrill soil erodibility factor is critical for understanding soil erosion responses, as it measures the soil’s susceptibility to erosion under rainfall and runoff, which informs the development of effective erosion control strategies [62]. The variability in Ki values across different treatments and rainfall intensities highlights the complex dynamics of soil erosion. The large Ki value for S1I2 could be attributed to the detached soil from the I1 experiments (D1–D3) remaining on the surface, which contributed to increased runoff during the first day of the I2 experiment (Figure 8a,b). The consistently high Ki values for P1 across all conditions, particularly under the highest rainfall intensity (Figure 8f), suggest that this treatment may be less effective in mitigating erosion compared to P2 and P3. This may be because of the inherent limitations of untreated soil in maintaining stability under severe conditions [61]. In addition, the lower Ki values for EFP-treated soils indicate their superior performance in reducing soil loss due to their greater aggregate stability, making them more effective strategies for erosion control. Ding and Zhang [89] reported that soils with higher aggregate stability have lower Ki values, indicating reduced susceptibility to soil erosion. The differences in Ki between EFP treatments are minimal compared to the variations in soil loss (Figure 7 and Figure 8). These results suggest that the effectiveness of EFP in reducing soil loss is not due to a reduction in erodibility, but rather to changes in the hydrological response, such as reduced runoff (Figure 5, Figure 7 and Figure 8).

5. Conclusions

Overall, evaluating soil hydrological and erosional responses to EFP treatments is crucial for confirming the effectiveness of EFP rates in enhancing soil water movement and improving soil hydrological properties. The EFP treatment not only increased water infiltration and water storage but also played a significant role in reducing erosion. Due to enhancements in the soil structure and porosity, water movement through the soil profile was more efficient, allowing for deeper percolation and reducing surface runoff. This improved water movement helps in retaining moisture within the root zone, supporting plant growth, while simultaneously minimizing soil erosion. More importantly, the soil aggregate stability was markedly improved in the EFP-treated plots compared to the control, as the polymer enhanced soil aggregation, leading to reduced soil erosion through stabilization. Moreover, the EFP-treated soils exhibited lower soil loss and interrill erodibility values, indicating higher resistance to soil erosion. However, the most effective EFP rate among the selected treatments could not be determined based on our rainfall simulation study results. We used minimal EFP dosages for both treatments in the study (>0.1%), which may account for the similar results observed. These findings confirm that even low concentrations of EFP can effectively mitigate soil erosion by enhancing soil hydrological characteristics. This could be beneficial for farmers in terms of their economic considerations. Moreover, this polymer is not only more environmentally beneficial but also enhances soil fertility, potentially leading to higher crop yields due to its superior biodegradability. Therefore, EFP can be used in sugarcane cultivation to enhance productivity by reducing soil erosion and improving soil quality. In conclusion, low concentrations of Fasal Amrit polymers could be used as a soil amendment to improve the soil’s hydrological properties by mitigating soil and water loss.
However, the effectiveness of EFPs can vary widely depending on the soil type, polymer concentration, and environmental conditions, leading to inconsistent results across different settings. To address these challenges, future research should focus on optimizing EFP formulations to enhance their efficacy across various soil types and climatic conditions. Additionally, future studies should consider utilizing a factorial design to investigate the interactions between slope, rainfall intensity, and EFP treatments on soil hydrological properties. Moreover, there is a need for comprehensive field trials to validate laboratory findings and assess the practical applicability of EFPs for improving soil hydrological properties in real-world scenarios.

Author Contributions

Conceptualization, methodology and formal analysis, P.P.R., K.S., T.N. and K.Y.; investigation, P.P.R. and K.S.; writing—original draft preparation, P.P.R.; writing—review and editing, P.P.R. and K.S.; supervision, K.S., T.N. and K.Y. All authors have read and agreed to the published version of the manuscript.

Funding

This research received no external funding.

Data Availability Statement

Data are contained within the article.

Acknowledgments

The authors would like to acknowledge EF Polymer Pvt. Ltd., Onna village, Okinawa, Japan, for their generous support in supplying the Fasal Amrit polymer, which was essential for conducting this research. This research was part of the dissertation submitted by the first author in partial fulfillment of the Ph.D. degree. All authors have provided consent for the article’s publication and the submission of the dissertation.

Conflicts of Interest

The authors declare no conflicts of interest.

References

  1. He, P.; Dai, W.; Luo, Y.; Ding, R.; Zheng, X. Towards Sustainable Development Goals: Study on the Consequences of Food Insecurity among Global Population—Worldwide, 2022. China CDC Wkly. 2022, 4, 583. [Google Scholar] [PubMed]
  2. FAO. How to Feed the World 2050: Global Agriculture Towards 2050. In Proceedings of the High-Level Expert Forum: How to Feed the World in 2050, Rome, Italy, 12–13 October 2009; FAO: Rome, Italy, 2009. Available online: http://www.fao.org/fileadmin/templates/wsfs/docs/Issues_papers/HLEF2050_Global_Agriculture.pdf (accessed on 2 August 2024).
  3. Tian, X.; Engel, B.A.; Qian, H.; Hua, E.; Sun, S.; Wang, Y. Will Reaching the Maximum Achievable Yield Potential Meet Future Global Food Demand? J. Clean. Prod. 2021, 294, 126285. [Google Scholar] [CrossRef]
  4. Mandal, D.; Patra, S.; Sharma, N.K.; Alam, N.M.; Jana, C.; Lal, R. Impacts of Soil Erosion on Soil Quality and Agricultural Sustainability in the North-Western Himalayan Region of India. Sustainability 2023, 15, 5430. [Google Scholar] [CrossRef]
  5. Khosravi, K.; Rezaie, F.; Cooper, J.R.; Kalantari, Z.; Abolfathi, S.; Hatamiafkoueieh, J. Soil Water Erosion Susceptibility Assessment Using Deep Learning Algorithms. J. Hydrol. 2023, 618, 129229. [Google Scholar] [CrossRef]
  6. Tang, Q.; Xu, Y.; Bennett, S.J.; Li, Y. Assessment of Soil Erosion Using RUSLE and GIS: A Case Study of the Yangou Watershed in the Loess Plateau, China. Environ. Earth Sci. 2015, 73, 1715–1724. [Google Scholar] [CrossRef]
  7. Kumar, S.; Singh, D.; Kumar, A.; Kumar, M.; Giri, K.; Devi, K.; Singh, S. Estimation of Soil Erosion in the Indo-Gangetic Region Using Revised Universal Soil Loss Equation (RUSLE) Model and Geospatial Technology. Model. Earth Syst. Environ. 2023, 9, 1251–1273. [Google Scholar] [CrossRef]
  8. Dutta, S. Soil Erosion, Sediment Yield, and Sedimentation of Reservoirs: A Review. Model. Earth Syst. Environ. 2016, 2, 123. [Google Scholar] [CrossRef]
  9. Mohammed, S.; Abdo, H.G.; Szabo, S.; Pham, Q.B.; Holb, I.J.; Linh, N.T.T.; Anh, D.T.; Alsafadi, K.; Mokhtar, A.; Kbibo, I.; et al. Estimating Human Impacts on Soil Erosion Considering Different Hillslope Inclinations and Land Uses in the Coastal Region of Syria. Water 2020, 12, 2786. [Google Scholar] [CrossRef]
  10. Borrelli, P.; Robinson, D.A.; Fleischer, L.R.; Lugato, E.; Ballabio, C.; Alewell, C.; Meusburger, K.; Modugno, S.; Schütt, B.; Ferro, V.; et al. An Assessment of the Global Impact of 21st Century Land Use Change on Soil Erosion. Nat. Commun. 2017, 8, 2013. [Google Scholar] [CrossRef]
  11. Pimentel, D.; Burgess, M. Soil Erosion Threatens Food Production. Agriculture 2013, 3, 443–463. [Google Scholar] [CrossRef]
  12. Marondedze, A.K.; Schütt, B. Assessment of Soil Erosion Using the RUSLE Model for the Epworth District of the Harare Metropolitan Province, Zimbabwe. Sustainability 2020, 12, 8531. [Google Scholar] [CrossRef]
  13. Nut, N.; Mihara, M.; Jeong, J.; Ngo, B.; Sigua, G.; Prasad, P.V.; Reyes, M.R. Land Use and Land Cover Changes and Its Impact on Soil Erosion in the Stung Sangkae Catchment of Cambodia. Sustainability 2021, 13, 9276. [Google Scholar] [CrossRef]
  14. de Mello, K.; Taniwaki, R.H.; de Paula, F.R.; Valente, R.A.; Randhir, T.O.; Macedo, D.R.; Leal, C.G.; Rodrigues, C.B.; Hughes, R.M. Multiscale Land Use Impacts on Water Quality: Assessment, Planning, and Future Perspectives in Brazil. J. Environ. Manag. 2020, 270, 110879. [Google Scholar] [CrossRef] [PubMed]
  15. Dharmawan, I.W.S.; Pratiwi; Siregar, C.A.; Narendra, B.H.; Undaharta, N.K.E.; Sitepu, B.S.; Sukmana, A.; Wiratmoko, M.D.E.; Abywijaya, I.K.; Sari, N. Implementation of Soil and Water Conservation in Indonesia and Its Impacts on Biodiversity, Hydrology, Soil Erosion, and Microclimate. Appl. Sci. 2023, 13, 7648. [Google Scholar] [CrossRef]
  16. Yang, R.; Zheng, J.; Li, G.; Huang, Y.; Wang, J.; Qiu, F. Effects of Rainfall Characteristics and Sugarcane Growth Stage on Soil and Nitrogen Losses. Environ. Sci. Pollut. Res. 2023, 30, 87575–87587. [Google Scholar] [CrossRef] [PubMed]
  17. Samaraweera, W.G.R.L.; Dharmadasa, R.A.P.I.S.; Kumara, P.H.T.; Bandara, A.S.G.S. Evidence of Climate Change Impacts in Sri Lanka—A Review of Literature. Sri Lanka J. Econ. Res. 2024, 11, 69–94. [Google Scholar] [CrossRef]
  18. de Silva, S.S.; Abeysingha, N.S.; Nirmanee, K.G.S.; Sandamali Pathirage, P.D.S.; Mallawatantri, A. Effect of Land Use–Land Cover and Projected Rainfall on Soil Erosion Intensities of a Tropical Catchment in Sri Lanka. Int. J. Environ. Sci. Technol. 2023, 20, 9173–9188. [Google Scholar] [CrossRef]
  19. Deegala, D.M.B.M.; Abeysingha, N.S.; Muthuwatta, L.P.; Ray, R.L. Sustainable Growing Areas for Sugarcane in Sri Lanka Under a Changing Climate. Sugar Tech 2022, 24, 1801–1813. [Google Scholar] [CrossRef]
  20. Kulasekara, B.R.; Ariyawansha, B.D.S.K.; Weerasinghe, H.A.S.; Kodithuwakku, K.A.D.; Kumarasiri, U.W.L.M. Response of Soil, Cane Yield, and Cane Quality Parameters to Zinc Fertiliser Under Alfisols Condition in Sri Lanka: A Preliminary Investigation. Sugar Tech 2024, 26, 915–919. [Google Scholar] [CrossRef]
  21. Sugarcane Research Institute. Statistics of the Sugarcane Industry. 2023. Available online: https://sugarres.lk/statistics-of-sugarcane-sri-lanka/ (accessed on 7 September 2024).
  22. Ariyawansha, T.; Abeyrathna, D.; Kodithuwakku, D.; Wijayawardhana, J.; Sewwandi, N.; Weerasinghe, A.; Pottawela, D.; Komoto, H.; Ahamed, T.; Noguchi, R. A Systematic Framework for Studying Two Sugarcane Harvesting Systems Based on National Policy Implementation in Sri Lanka. Sugar Tech 2023, 25, 846–861. [Google Scholar] [CrossRef]
  23. Perera, K.H.K.; Udeshani, W.A.C.; Piyathilake, I.D.U.H.; Wimalasiri, G.E.M.; Kadupitiya, H.K.; Udayakumara, E.P.N.; Gunatilake, S.K. Assessing Soil Quality and Soil Erosion Hazards in the Moneragala District, Sri Lanka. SN Appl. Sci. 2020, 2, 2175. [Google Scholar] [CrossRef]
  24. De Silva, A.L.C.; Wijayawardhana, L.M.J.R.; Witharama, W.R.G. Present Status of Research and Development on Climate Change Mitigation and Future Needs in the Sugarcane Sector in Sri Lanka. In Proceedings of the Workshop on Present Status of Research and Activities on Climate Change and Adaptation; Sri Lanka Council for Agricultural Research Policy: Colombo, Sri Lanka, 2016; pp. 101–112. [Google Scholar]
  25. Martinelli, L.A.; Filoso, S. Expansion of Sugarcane Ethanol Production in Brazil: Environmental and Social Challenges. Ecol. Appl. 2008, 18, 885–898. [Google Scholar] [CrossRef] [PubMed]
  26. Paringit, E.C.; Nadaoka, K. Sediment Yield Modelling for Small Agricultural Catchments: Land-Cover Parameterization Based on Remote Sensing Data Analysis. Hydrol. Process. 2003, 17, 1845–1866. [Google Scholar] [CrossRef]
  27. Senanayake, S.S.; Munasinghe, M.A.K.; Wickramasinghe, W.M.A.D.B. Use of Erosion Hazard Assessments for Regional Scale Crop Suitability Mapping in the Uva Province. Ann. Sri Lanka Dep. Agric. 2013, 15, 127–141. [Google Scholar]
  28. Yakupoglu, T.; Rodrigo-Comino, J.; Cerdà, A. Potential Benefits of Polymers in Soil Erosion Control for Agronomical Plans: A Laboratory Experiment. Agronomy 2019, 9, 276. [Google Scholar] [CrossRef]
  29. Keesstra, S.D.; Rodrigo-Comino, J.; Novara, A.; Giménez-Morera, A.; Pulido, M.; Di Prima, S.; Cerdà, A. Straw Mulch as a Sustainable Solution to Decrease Runoff and Erosion in Glyphosate-Treated Clementine Plantations in Eastern Spain: An Assessment Using Rainfall Simulation Experiments. Catena 2019, 174, 95–103. [Google Scholar] [CrossRef]
  30. Giménez-Morera, A.; Sinoga, J.R.; Cerdà, A. The Impact of Cotton Geotextiles on Soil and Water Losses from Mediterranean Rainfed Agricultural Land. Land Degrad. Dev. 2010, 21, 210–217. [Google Scholar] [CrossRef]
  31. Davies, K.; Fullen, M.A.; Booth, C.A. A Pilot Project on the Potential Contribution of Palm-Mat Geotextiles to Soil Conservation. Earth Surf. Process. Landf. 2006, 31, 561–569. [Google Scholar] [CrossRef]
  32. Jomaa, S.; Barry, D.A.; Heng, B.C.P.; Brovelli, A.; Sander, G.C.; Parlange, J.Y. Influence of Rock Fragment Coverage on Soil Erosion and Hydrological Response: Laboratory Flume Experiments and Modeling. Water Resour. Res. 2012, 48, 5. [Google Scholar] [CrossRef]
  33. Jomaa, S.; Barry, D.A.; Brovelli, A.; Heng, B.C.P.; Sander, G.C.; Parlange, J.Y.; Rose, C.W. Rain Splash Soil Erosion Estimation in the Presence of Rock Fragments. Catena 2012, 92, 38–48. [Google Scholar] [CrossRef]
  34. Lu, S.; Wang, Z.; Hu, Y.; Liu, B.; Liu, J. Effectiveness and Durability of Polyacrylamide (PAM) and Polysaccharide (Jag C 162) in Reducing Soil Erosion Under Simulated Rainfalls. Water 2018, 10, 257. [Google Scholar] [CrossRef]
  35. Garg, A.; Wani, I.; Kushvaha, V. Application of Artificial Intelligence for Predicting Erosion of Biochar Amended Soils. Sustainability 2022, 14, 684. [Google Scholar] [CrossRef]
  36. Tümsavaş, Z.; Kara, A. The Effect of Polyacrylamide (PAM) Applications on Infiltration, Runoff, and Soil Losses Under Simulated Rainfall Conditions. Afr. J. Biotechnol. 2011, 10, 2894–2903. [Google Scholar] [CrossRef]
  37. Kebede, B.; Tsunekawa, A.; Haregeweyn, N.; Tsubo, M.; Mulualem, T.; Mamedov, A.I.; Meshesha, D.T.; Adgo, E.; Fenta, A.A.; Ebabu, K.; et al. Effect of Polyacrylamide Integrated with Other Soil Amendments on Runoff and Soil Loss: Case Study from Northwest Ethiopia. Int. Soil Water Conserv. Res. 2022, 10, 487–496. [Google Scholar] [CrossRef]
  38. Moslemi, Z.; Habibi, D.; Asgharzadeh, A.; Ardakani, M.R.; Mohammadi, A.; Sakari, A. Effects of Super Absorbent Polymer and Plant Growth Promoting Rhizobacteria on Yield and Yield Components of Maize Under Drought Stress and Normal Conditions. Afr. J. Agric. Res. 2011, 6, 4471–4476. [Google Scholar] [CrossRef]
  39. Elshafie, H.S.; Camele, I. Applications of Absorbent Polymers for Sustainable Plant Protection and Crop Yield. Sustainability 2021, 13, 3253. [Google Scholar] [CrossRef]
  40. Lertsarawut, P.; Rattanawongwiboon, T.; Tangthong, T.; Laksee, S.; Kwamman, T.; Phuttharak, B.; Romruensukharom, P.; Suwanmala, P.; Hemvichian, K. Starch-Based Super Water Absorbent: A Promising and Sustainable Way to Increase Survival Rate of Trees Planted in Arid Areas. Polymers 2021, 13, 1314. [Google Scholar] [CrossRef]
  41. Wang, W.; Wang, A. Synthesis, Swelling Behaviors, and Slow-Release Characteristics of a Guar Gum-g-Poly (Sodium Acrylate)/Sodium Humate Superabsorbent. J. Appl. Polym. Sci. 2009, 112, 2102–2111. [Google Scholar] [CrossRef]
  42. Meng, Q.; Fu, B.; Tang, X.; Ren, H. Effects of Land Use on Phosphorus Loss in the Hilly Area of the Loess Plateau, China. Environ. Monit. Assess. 2008, 139, 195–204. [Google Scholar] [CrossRef]
  43. Krasnopeeva, E.L.; Panova, G.G.; Yakimansky, A.V. Agricultural Applications of Superabsorbent Polymer Hydrogels. Int. J. Mol. Sci. 2022, 23, 11534. [Google Scholar] [CrossRef]
  44. Sroka, K.; Sroka, P. Superabsorbent Hydrogels in the Agriculture and Reclamation of Degraded Areas. Sustainability 2024, 16, 2945. [Google Scholar] [CrossRef]
  45. Damiri, F.; Salave, S.; Vitore, J.; Bachra, Y.; Jadhav, R.; Kommineni, N.; Karouach, F.; Paiva-Santos, A.C.; Varma, R.S.; Berrada, M. Properties and Valuable Applications of Superabsorbent Polymers: A Comprehensive Review. Polym. Bull. 2024, 81, 6671–6701. [Google Scholar] [CrossRef]
  46. Abu-Zreig, M. Control of Rainfall-Induced Soil Erosion with Various Types of Polyacrylamide. J. Soils Sediments 2006, 6, 137–144. [Google Scholar] [CrossRef]
  47. Cao, Y.; Wang, B.; Guo, H.; Xiao, H.; Wei, T. The Effect of Super Absorbent Polymers on Soil and Water Conservation on the Terraces of the Loess Plateau. Ecol. Eng. 2017, 102, 270–279. [Google Scholar] [CrossRef]
  48. Thombare, N.; Mishra, S.; Siddiqui, M.Z.; Jha, U.; Singh, D.; Mahajan, G.R. Design and Development of Guar Gum Based Novel, Superabsorbent and Moisture Retaining Hydrogels for Agricultural Applications. Carbohydr. Polym. 2018, 185, 169–178. [Google Scholar] [CrossRef]
  49. Khushbu, S.G.W.; Warkar, A.; Kumar, A. Synthesis and Assessment of Carboxymethyl Tamarind Kernel Gum Based Novel Superabsorbent Hydrogels for Agricultural Applications. Polymer 2019, 182, 121823. [Google Scholar] [CrossRef]
  50. Chen, Y. Properties and Development of Hydrogels. In Hydrogels Based on Natural Polymers; Elsevier: Amsterdam, The Netherlands, 2020; pp. 3–16. [Google Scholar] [CrossRef]
  51. Yang, F.; Cen, R.; Feng, W.; Liu, J.; Qu, Z.; Miao, Q. Effects of Super-Absorbent Polymer on Soil Remediation and Crop Growth in Arid and Semi-Arid Areas. Sustainability 2020, 12, 8785. [Google Scholar] [CrossRef]
  52. EF Polymer Pvt Ltd. EF Polymer | Reimagining Sustainable Agriculture. 2023. Available online: https://efpolymer.com/ (accessed on 28 August 2024).
  53. Meena, C.B.; Pilania, S.; Singh, V.; Jat, G.; Surolia, D.K.; Bairwa, H.L.; Kumari, M.; Singh, R. Effect of Ball Culture in Seed Germination of Ridge Gourd. Curr. J. Appl. Sci. Technol. 2022, 41, 16–20. [Google Scholar] [CrossRef]
  54. Japan Meteorological Agency. Tables of Monthly Climate Statistics. Available online: https://www.data.jma.go.jp/stats/data/en/smp/index.html (accessed on 15 August 2024).
  55. Bellido, J.; Sakai, K.; Nakamura, S.; Kazuro, M.; Okamoto, K.; Nakandakari, T. N2O Emissions from Shimajiri-Maji (Calcaric Dark Red Soil) after Applying Two Chemical Fertilizers. Appl. Ecol. Environ. Res. 2015, 13, 339–348. [Google Scholar] [CrossRef]
  56. Durner, W.; Iden, S.C. The Improved Integral Suspension Pressure Method (ISP+) for Precise Particle Size Analysis of Soil and Sedimentary Materials. Soil Tillage Res. 2021, 213, 105086. [Google Scholar] [CrossRef]
  57. Klute, A. Physical and Mineralogical Methods of Soil Analysis; American Society of Agronomy: Madison, WI, USA, 1986. [Google Scholar]
  58. Kojima, R.; Osawa, K.; Matsuura, M.; Fujisawa, H.; Tomisaka, M.; Matsui, H. Identification of Soil Erodibilities for an Application of WEPP Model with Biological Ground Cover by Algae and Fungi. J. Jpn. Soc. Civ. Eng. Ser. G Environ. Res. 2018, 74, I_233–I_239. [Google Scholar] [CrossRef] [PubMed]
  59. Christiansen, J.E. Irrigation by Sprinkling; University of California: Berkeley, CA, USA, 1942; Volume 4. [Google Scholar]
  60. Tu, A.; Xie, S.; Mo, M.; Song, Y.; Li, Y. Water Budget Components Estimation for a Mature Citrus Orchard of Southern China Based on HYDRUS-1D Model. Agric. Water Manag. 2021, 243, 106426. [Google Scholar] [CrossRef]
  61. Kinnell, P.I.A. Runoff as a Factor Influencing Experimentally Determined Interrill Erodibilities. Aust. J. Soil Res. 1993, 31, 333–342. [Google Scholar] [CrossRef]
  62. Zhang, F.B.; Wang, Z.L.; Yang, M.Y. Validating and Improving Interrill Erosion Equations. PLoS ONE 2014, 9, e88275. [Google Scholar] [CrossRef]
  63. Kemper, W.D.; Rosenau, R.C. Aggregate Stability and Size. In Methods of Soil Analysis, Part 1—Physical and Mineralogical Methods; ASA/SSSA: Madison, WI, USA, 1986; Volume 9, pp. 425–442. [Google Scholar] [CrossRef]
  64. Igwe, C.A.; Nwokocha, D. Influence of Soil Properties on the Aggregate Stability of a Highly Degraded Tropical Soil in Eastern Nigeria. Int. Agrophysics 2005, 19, 131–139. [Google Scholar]
  65. Abrisham, E.S.; Jafari, M.; Tavili, A.; Rabii, A.; Zare Chahoki, M.A.; Zare, S.; Egan, T.; Yazdanshenas, H.; Ghasemian, D.; Tahmoures, M. Effects of a Super Absorbent Polymer on Soil Properties and Plant Growth for Use in Land Reclamation. Arid Land Res. Manag. 2018, 32, 407–420. [Google Scholar] [CrossRef]
  66. Bai, W.; Zhang, H.; Liu, B.; Wu, Y.; Song, J.Q. Effects of Super-Absorbent Polymers on the Physical and Chemical Properties of Soil Following Different Wetting and Drying Cycles. Soil Use Manag. 2010, 26, 253–260. [Google Scholar] [CrossRef]
  67. Han, Y.G.; Yang, P.L.; Luo, Y.P.; Ren, S.M.; Zhang, L.X.; Xu, L. Porosity Change Model for Watered Super Absorbent Polymer-Treated Soil. Environ. Earth Sci. 2010, 61, 1197–1205. [Google Scholar] [CrossRef]
  68. Yang, Y.; Wu, J.; Zhao, S.; Gao, C.; Pan, X.; Tang, D.W.; van der Ploeg, M. Effects of Long-Term Super Absorbent Polymer and Organic Manure on Soil Structure and Organic Carbon Distribution in Different Soil Layers. Soil Tillage Res. 2021, 206, 104781. [Google Scholar] [CrossRef]
  69. Bhardwaj, A.K.; Shainberg, I.; Goldstein, D.; Warrington, D.N.; Levy, G.J. Water Retention and Hydraulic Conductivity of Cross-Linked Polyacrylamides in Sandy Soils. Soil Sci. Soc. Am. J. 2007, 71, 406–412. [Google Scholar] [CrossRef]
  70. Han, Y.; Yu, X.; Yang, P.; Li, B.; Xu, L.; Wang, C. Dynamic Study on Water Diffusivity of Soil with Super-Absorbent Polymer Application. Environ. Earth Sci. 2013, 69, 289–296. [Google Scholar] [CrossRef]
  71. Shahid, S.A.; Qidwai, A.A.; Anwar, F.; Ullah, I.; Rashid, U. Improvement in the Water Retention Characteristics of Sandy Loam Soil Using a Newly Synthesized Poly(acrylamide-co-acrylic Acid)/AlZnFe2O4 Superabsorbent Hydrogel Nanocomposite Material. Molecules 2012, 17, 9397–9412. [Google Scholar] [CrossRef] [PubMed]
  72. Li, Y.; Shao, M.; Horton, R. Effect of Polyacrylamide Applications on Soil Hydraulic Characteristics and Sediment Yield of Sloping Land. Procedia Environ. Sci. 2011, 11, 763–773. [Google Scholar] [CrossRef]
  73. Khan, M.N.; Gong, Y.; Hu, T.; Lal, R.; Zheng, J.; Justine, M.F.; Azhar, M.; Che, M.; Zhang, H. Effect of Slope, Rainfall Intensity and Mulch on Erosion and Infiltration under Simulated Rain on Purple Soil of South-Western Sichuan Province, China. Water 2016, 8, 528. [Google Scholar] [CrossRef]
  74. Ren, Z.; Zhang, X.; Zhang, X.C.; Li, Z.; Li, P.; Zhou, Z.Z. Sand Cover Enhances Rill Formation under Laboratory Rainfall Simulation. Catena 2021, 205, 105472. [Google Scholar] [CrossRef]
  75. Trout, T.J.; Sojka, R.E.; Lentz, R.D. Polyacrylamide Effect on Furrow Erosion and Infiltration. Trans. Am. Soc. Agric. Eng. 1995, 38, 761–766. [Google Scholar] [CrossRef]
  76. Zhao, Q.; Li, D.; Zhuo, M.; Guo, T.; Liao, Y.; Xie, Z. Effects of Rainfall Intensity and Slope Gradient on Erosion Characteristics of the Red Soil Slope. Stoch. Environ. Res. Risk Assess. 2015, 29, 609–621. [Google Scholar] [CrossRef]
  77. Mandal, U.K.; Bhardwaj, A.K.; Warrington, D.N.; Goldstein, D.; Bar Tal, A.; Levy, G.J. Changes in Soil Hydraulic Conductivity, Runoff, and Soil Loss Due to Irrigation with Different Types of Saline-Sodic Water. Geoderma 2008, 144, 509–516. [Google Scholar] [CrossRef]
  78. Ran, Q.; Su, D.; Li, P.; He, Z. Experimental Study of the Impact of Rainfall Characteristics on Runoff Generation and Soil Erosion. J. Hydrol. 2012, 424–425, 99–111. [Google Scholar] [CrossRef]
  79. Zhu, T.X.; Band, L.E.; Vertessy, R.A. Continuous Modeling of Intermittent Stormflows on a Semi-Arid Agricultural Catchment. J. Hydrol. 1999, 226, 11–29. [Google Scholar] [CrossRef]
  80. Assouline, S.; Ben-Hur, M. Effects of Rainfall Intensity and Slope Gradient on the Dynamics of Interrill Erosion During Soil Surface Sealing. Catena 2006, 66, 211–220. [Google Scholar] [CrossRef]
  81. Misiewicz, J.; Datta, S.S.; Lejcuś, K.; Marczak, D. The Characteristics of Time-Dependent Changes of Coefficient of Permeability for Superabsorbent Polymer-Soil Mixtures. Materials 2022, 15, 4465. [Google Scholar] [CrossRef] [PubMed]
  82. Inbar, A.; Ben-Hur, M.; Sternberg, M.; Lado, M. Using Polyacrylamide to Mitigate Post-Fire Soil Erosion. Geoderma 2015, 239, 107–114. [Google Scholar] [CrossRef]
  83. Abrol, V.; Shainberg, I.; Lado, M.; Ben-Hur, M. Efficacy of Dry Granular Anionic Polyacrylamide (PAM) on Infiltration, Runoff and Erosion. Eur. J. Soil Sci. 2013, 64, 699–705. [Google Scholar] [CrossRef]
  84. Yu, J.; Lei, T.; Shainberg, I.; Mamedov, A.I.; Levy, G.J. Infiltration and Erosion in Soils Treated with Dry PAM and Gypsum. Soil Sci. Soc. Am. J. 2003, 67, 630–636. [Google Scholar] [CrossRef]
  85. Ben-Hur, M. Seal Formation Effects on Soil Infiltration and Runoff in Arid and Semiarid Regions under Rainfall and Sprinkler Irrigation Conditions. In Environmental Science and Engineering; Springer: Berlin/Heidelberg, Germany, 2008; pp. 430–452. [Google Scholar] [CrossRef]
  86. Chen, H.; Shao, M.; Li, Y. The Characteristics of Soil Water Cycle and Water Balance on Steep Grassland under Natural and Simulated Rainfall Conditions in the Loess Plateau of China. J. Hydrol. 2008, 360, 242–251. [Google Scholar] [CrossRef]
  87. Zheng, M.; Huang, Z.; Ji, H.; Qiu, F.; Zhao, D.; Bredar, A.R.; Farnum, B.H. Simultaneous Control of Soil Erosion and Arsenic Leaching at Disturbed Land Using Polyacrylamide Modified Magnetite Nanoparticles. Sci. Total Environ. 2020, 702, 134997. [Google Scholar] [CrossRef]
  88. Berninger, T.; Dietz, N.; González López, Ó. Water-Soluble Polymers in Agriculture: Xanthan Gum as Eco-Friendly Alternative to Synthetics. Microb. Biotechnol. 2021, 14, 1881–1896. [Google Scholar] [CrossRef]
  89. Ding, W.F.; Zhang, X.C. An Evaluation on Using Soil Aggregate Stability as the Indicator of Interrill Erodibility. J. Mt. Sci. 2016, 13, 831–843. [Google Scholar] [CrossRef]
Figure 1. Soil erosion plots used for the rainfall simulation test.
Agronomy 14 02467 g001
Figure 2. Layout of the rainfall simulation procedure: (a) sketch of the rainfall simulator and erosion plot and (b) TRCN_ST Nozzles (source: https://www.kawaguchicci.or.jp, accessed on 20 August 2024).
Agronomy 14 02467 g002
Figure 3. The effect of EFP rates on the time (min) to generate runoff for erosion plots during rainfall storms 1–3 (I1: 35 mm h−1) under 15% (S2) slope conditions (P1: control, P2: 3 g m−2, and P3: 6 g m−2). The three storms of I1 rainfall conditions are denoted as D1, D2, and D3.
Agronomy 14 02467 g003
Figure 4. Effect of EFP treatments on cumulative infiltration (mm) for three different rainfall intensities, I1: 35 mm h−1, I2: 70 mm h−1, and I3: 110 mm h−1, and two slope conditions, S1: 7.5% (ac) and S2: 15% (df), in the 1 h rainfall period. The treatments were P1: control, P2: 3 g m−2, and P3: 6 g m−2. The three storms for each rainfall condition are denoted as D1, D2, and D3.
Agronomy 14 02467 g004
Figure 5. Effect of EFP treatments on cumulative runoff (mm) for three different rainfall intensities, I1: 35 mm h−1, I2: 70 mm h−1, and I3: 110 mm h−1, and two slope conditions, S1: 7.5% (ac) and S2: 15% (df), in the 1 h rainfall period. The treatments were P1: control, P2: 3 g m−2, and P3: 6 g m−2. The three storms of each rainfall condition are denoted as D1, D2, and D3.
Agronomy 14 02467 g005
Figure 6. Effect of EFP treatments (P1: 0, P2: 3 g m−2, and P3: 6 g m−2) on water balance components (changes in water storage, infiltration, and runoff). Rainfall simulation tests were conducted using three rainfall intensities, I1: 35 mm h−1, I1: 70 mm h−1, and I3: 110 mm h−1, and two slope conditions, S1: 7.5% (a,c,e) and S2:15% (b,d,f), in the 1 h rainfall period. The three storms for each rainfall condition are denoted as D1, D2, and D3.
Agronomy 14 02467 g006
Figure 7. Effect of EFP treatments on the cumulative soil loss (mm) for three different rainfall intensities, I1: 35 mm h−1, I2: 70 mm h−1, and I3: 110 mm h−1, and two slope conditions, S1: 7.5% (ac) and S2:15% (df), in the 1 h rainfall period. The treatments were P1: control, P2: 3 g m−2, and P3: 6 g m−2. The three storms for each rainfall condition are denoted as D1, D2, and D3.
Agronomy 14 02467 g007
Figure 8. Effect of EFP treatments on interrill soil erodibility (kg s m−4) for three different rainfall intensities, I1: 35 mm h−1, I1: 70 mm h−1, and I3: 110 mm h−1, and two slope conditions; S1: 7.5% (ac) and S2:15% (df) in the 1 h rainfall period. The treatments were P1: 0, P2: 3 g m−2, and P3: 6 g m−2. The three storms of each rainfall condition are denoted as D1, D2, and D3.
Agronomy 14 02467 g008
Table 1. Main properties of experimental soil (0–25 cm layer).
Soil TypeParticle Size Distribution (%)pHEC
(µs cm−1)
SOM (%)BD
(g cm−3)
Ks
(cm s−1)
ClaySiltSand
Shimajiri-maji5530157.995128.930.0631.123.27 × 10−3
EC is electrical conductivity, SOM is soil organic matter, BD is bulk density, and Ks is saturated hydraulic conductivity.
Table 2. The effect of EFP rates on soil physical properties.
Soil ParameterP1P2P3
Bulk density—BD (g cm−3)1.123 a1.073 b1.109 ab
Porosity %52.72 b56.79 a54.16 b
Organic Matter (%)0.063 c0.837 b1.253 a
Hydraulic conductivity
Ks (mm/h)
117.72 a112.32 b96.12 c
Mean weight Diameter—MWD (mm)0.716 b0.862 a0.854 a
Treatments: P1, control; P2, 3 g m−2; and P3, 6 g m−2. Values represent the mean of the replicates, and different letters indicate significant differences at p < 0.05 (n = 3).
Table 3. The effect of treatments on the reduction percentage in total runoff compared to the control. The values were obtained from the three sequential rainfall storms for each rainfall intensity condition.
SlopeTreatmentTotal RunoffRunoff Reduction Effect Compared to the Control (%)
I1I2I3I1I2I3
S1Control-100.92299.31-
P2-69.44268.82-31.1910.21
P3-75.42264.0-25.2811.79
S2Control80.03186.68310.32
P215.55134.95256.3980.5727.7117.37
P319.85138.57275.975.1925.7711.08
Treatments were P1: control, P2: 3 g m−2, and P3: 6 g m−2. The slope conditions were S1: 7.5% and S2: 15%, and the simulated rainfall intensities were I1: 35 mm h−1, I2: 70 mm h−1, and I3: 110 mm h−1.
Table 4. Effect of treatments on the reduction effect (%) in total soil loss compared to the control. The values were obtained from the three sequential rainfall storms under each rainfall condition.
Erosion PlotTotal Soil Loss (g/m−2)Reduction Effect Compared to the Control (%)
I1I2I3I1I2I3
S1Control-228.01822.30-
P2-138.52730.82-39.2511.12
P3-164.29645.71-27.9521.47
S2Control146.38531.4591954.8
P217.14241.021288.6288.2954.6534.08
P325.20273.671440.7182.7848.5126.30
Treatments—P1: control, P2: 3 g m−2, and P3: 6 g m−2. Slope conditions—S1: 7.5% and S2: 15%. Simulated rainfall intensities—I1: 35 mm h−1, I2: 70 mm h−1, and I3: 110 mm h−1.
Disclaimer/Publisher’s Note: The statements, opinions and data contained in all publications are solely those of the individual author(s) and contributor(s) and not of MDPI and/or the editor(s). MDPI and/or the editor(s) disclaim responsibility for any injury to people or property resulting from any ideas, methods, instructions or products referred to in the content.

