Article

Maize-Straw Biochar Enhances Soil Properties and Grain Yield of Foxtail Millet in a Newly Reclaimed Land

1
College of Life Science, Yulin University, Yulin 719000, China
2
Institute of Crop Sciences, Chinese Academy of Agricultural Sciences, Beijing 100081, China
3
The UWA Institute of Agriculture, School of Agriculture and Environment, The University of Western Australia, Perth, WA 6009, Australia
*
Author to whom correspondence should be addressed.
These authors contributed equally to this work.
Agronomy 2024, 14(11), 2465; https://doi.org/10.3390/agronomy14112465
Submission received: 26 September 2024 / Revised: 15 October 2024 / Accepted: 19 October 2024 / Published: 22 October 2024
(This article belongs to the Section Agricultural Biosystem and Biological Engineering)

Abstract

:
Large-scale land reclamation has become common in northwestern China; however, low soil fertility and poor soil water-holding capacity limit agricultural production on these reclaimed lands, requiring increased fertilizer and irrigation inputs. Biochar, produced from agricultural waste, has shown potential in improving soil quality and water-holding capacity. In this two-year field study (2021 and 2022), we investigated the effects of biochar produced from maize straw on soil properties and grain yield of foxtail millet grown on newly reclaimed land. Three biochar treatments (3000, 4500, and 6000 kg ha−1) were compared to a control (CK) with no biochar application. Biochar application resulted in increased soil organic matter, total phosphorus, total nitrogen, soil enzyme activity, and soil organic acid content. It also significantly decreased soil pH and bulk density. Compared with the CK, biochar increased available nitrogen from 29.7% to 108% in 2021 and 37.0% to 88.4% in 2022. Similarly, biochar increased available phosphorus from 64.7% to 143% in 2021 and 41.9% to 96.5% in 2022. Grain yields ranged from 3092 to 4753 kg ha−1. Biochar treatments increased grain yield compared to the CK, ranging from 12.2% to 24.6% in 2021 and 27.1% to 53.7% in 2022. Correlation analysis revealed that soil pH was negatively related to soil oxalic acid content, phosphorus content, and sucrase activity. Available nitrogen and phosphorus contents were negatively related to soil bulk density and positively related to catalase activity. Soil water content was negatively correlated with soil bulk density and positively correlated with organic matter. In conclusion, biochar improved the rhizosphere soil pH and the effectiveness of soil fertility in the newly reclaimed soil, resulting in an enhanced grain yield of foxtail millet.

1. Introduction

Land degradation and desertification have emerged as two of the most pressing ecological problems and challenges, particularly in sustaining agriculture within rain-fed arid and semi-arid regions [1]. Soil degradation significantly diminishes soil water-holding capacity, exacerbating the loss of soil nutrients and rendering the soil unsuitable for robust plant growth and development, a phenomenon not exclusive to grain production [2]. As the global population burgeons, the demand for land for housing and food production is escalating. Consequently, degraded lands are being reclaimed for agricultural purposes, especially for grain production [3]. Due to the diminished water storage capacity of the soil in degraded lands, substantial amounts of underground water are used for irrigation to optimize grain yield [4]. This irrigation practice facilitates the transportation of topsoil nutrients to deeper soil layers through water infiltration. Therefore, there is an urgent need for the development or introduction of materials that enhance soil environments and increase topsoil water storage capacity.
Biochar, a solid carbon residue which is produced from agricultural biomass waste such as crop stems, wood, twigs, and sewage sludge, has shown promise in addressing these challenges [5]. Previous studies have indicated that biochar application can improve soil water content (SWC) and nutrients in the plough layer [2,6,7,8]. Biochar’s low bulk densities, substantial charge densities, and large surface area allow it to effectively decrease soil bulk density (SBD) and enhance water-holding capacity in coarse-textured soil, ultimately improving crop plant growth [9,10]. It has been confirmed that biochar increases the water conductivity and field water retention capacity of farmed soils, resulting in high moisture levels of the soil. Additionally, biochar addition increases soil porosity, potentially enhancing plant root growth and nutrient uptake, thereby increasing crop yield [11]. Results from a pot experiment showed that biochar increased soil’s available phosphorus (AP) and wheat yield but decreased available nitrogen (AN) [12]. In a four-year field study, biochar was found to reduce nitrate leaching, increase soil available N content, and improve SWC without a concurrent improvement in grain yield [13]. Although there is a consensus that biochar application could increase SWC, its effects on soil N and grain yield are not fully understood. Moreover, research has shown that the application of a large volume of biochar may exacerbate the degree of salinization in saline and alkaline lands [14]. Soil salinization is prevalent in irrigated farming areas, limiting the application of biochar in such regions. However, low amounts of biochar could improve salt-affected soils and enhance crop yield [15]. In a study involving yearly biochar applications in the field, the biochar was found to remarkably improve saline–alkaline soil properties [5]. Nevertheless, few studies have evaluated the effect of a single application of biochar added at once on saline–alkaline soil over an extended period in different growth seasons, especially in newly reclaimed land. Consequently, the relative long-term effects of biochar application on saline–alkaline soil in newly reclaimed land remain unclear.
In the soil–plant system, the relationship between soil and plants is reciprocal. The quality and nature of the soil play a vital role in the growth and development of plants. Soil is the source of life for plants; it not only provides the nutrients and water needed by plants, but also provides space and support for their root systems to grow. For instance, plants secrete low-molecular-weight organic acids to enhance the rhizosphere environment. Under field conditions, biochar application can alter soil enzyme activity, such as urease activity, in crop systems [16]. Newly reclaimed land, which is large in number and area, is not covered with a large amount of mature soil and is mainly changed from sandy land, making the newly reclaimed land poor in fertility and unable to be effectively cultivated in the short term. Moreover, the topsoil of newly reclaimed farmland is exposed and easily washed away by rain, resulting in serious soil erosion. However, how plants interact with soil on newly reclaimed lands with saline–alkaline soil is not well understood. Therefore, there is a need for an investigation to determine the effects of biochar on soil physical and chemical properties, plant growth, and the interactions between plants and saline–alkaline soil.
The Mu Us sandy land in northwest China, one of the country’s four largest sandy areas, covering an area of 3.98 × 10⁶ ha [3], has become the second-largest grain source in Shaanxi Province due to increased grain production facilitated by land reclamation [2]. However, the low water and nutrient-holding capacity of the soil in Mu Us necessitates extensive groundwater for irrigation and chemical fertilizer usage. While biochar has the potential to increase soil water-holding capacity, its impact on the soil properties of sandy land, especially in newly reclaimed areas, is not well understood. This study aimed to examine the effects of biochar application on soil properties, plant growth, and foxtail millet (Setaria italica L.) yield on newly reclaimed land. The posited hypothesis is that biochar application could improve soil properties, including soil field water capacity (FWC), soil organic matter (SOM), pH, and bulk density in the newly reclaimed land with saline–alkaline soil as well as stimulated root exudations and improve the rhizosphere environment, leading to higher yields.

2. Materials and Methods

2.1. Experiment Site Location

The experiment took place at a modern agricultural experimental station, established in 2021, affiliated with the College of Life Sciences at Yulin University, located in Yulin, Shaanxi Province, China (109°50′ E, 38°21′ N, Figure S1A). The experiment spanned from 1 May 2021 to 31 October 2022. The geographical location is characterized by a warm temperate monsoon climate, featuring an annual average temperature of 8.3 °C and an average precipitation of 365.7 mm. The long-term annual temperature and precipitation, along with those specific to 2021 and 2022, are illustrated in Figure 1 [2]. Before construction, the site exhibited sandy soil with low fertility. Following reclamation, a 30-cm layer of uncultivated loess covered the sandy soil. The initial soil properties of the study site are detailed in Table 1. In summary, the sandy soils had 0.07‰ TN, 0.23‰ TP, and 0.15% SOM with an SBD of 1.72 g/cm3. In comparison, the loess soils contained 0.12‰ TN, 0.32‰ TP, and 0.25% SOM with an SBD of 1.62 g/cm3. In the processing of reclaiming the land, grass and some leaves of shrubs (Figure S1B) were mixed and dug into the soils.

2.2. Experiment Design

We conducted a two-year experiment with four biochar application rates: 0 (CK), 3000 (B1), 4500 (B2), and 6000 (B3) kg ha−1. The determination of biochar application rates was based on the findings of our previous study, where the application of 4500 kg ha−1 biochar demonstrated improved growth and yield production of millet [2]. Biochar, produced from maize straw by Liaoning Golden Future Agriculture Technology Co., Ltd. (Anshan, Liaoning Province, China), was applied once before sowing in the first year with no further applications in the following year. The maize straw underwent pyrolysis at 450 °C, with sizes ranging from 0.25 to 0.35 cm. The properties of the biochar are outlined in Table 1. The morphology of the biochar was detected with a Zeiss Sigma 300 field emission-scanning electron microscope (FE-SEM; Carl Zeiss AG, Oberkochen, Germany), and the result showed that the surface of the biochar was distributed with many small pores around 100–200 nanometers in size (Figure S2). The experimental plot measured 4.5 m in width by 5 m in length and followed a randomized complete block design (Figure S1C). Each treatment comprised three replicate plots. The basal fertilizer, applied to all plots, included N (180 kg ha−1), P (90 kg ha−1), K (70 kg ha−1), B (1.5 kg ha−1), and Zn (20 kg ha−1). All fertilizers were applied once before sowing and were thoroughly mixed through rotary tillage each year.
The foxtail millet cultivar Yugukang1, released by the Yulin Academy of Agricultural Science in 2018 and ranked first in the Spring Valley in the 13th High Quality Edible millet Quality Evaluation, was utilized in this study. Millet seeds were sown on 14 May 2021 and 4 May 2022. At the three-leaf stage [17], seedlings were thinned to 30 plants per m2, with a row spacing of 50 cm. To prevent bird damage from the jointing stage onwards, a net was placed 2.5 m above the ground and removed at the harvest stage. To facilitate the emergence and growth of seedlings under dry conditions, the plots were irrigated with underground water before sowing and before the seedling stage in July. Additional irrigation occurred in August 2021 due to low precipitation. Notably, between July and late September 2022, the plots did not receive irrigation.

2.3. Sample Collection and Soil Property Measurements

Soil samples were collected during the flowering stage, following the established method from our previous studies [2,18,19]. When approximately 80% of the plants were in bloom, soil samples were gathered from the rhizosphere (0–30 cm depth) at five sampling sites within each plot, and these samples were combined to form a representative sample for that specific plot. The soil was divided into two portions: one was air-dried in the shade for the analysis of pH, TN, TP, AN, AP, and SOM contents, while the other was stored in a refrigerator at 4 °C for the measurement of soil organic acid and soil enzyme activity. Soil bulk density (SBD) was determined at a depth of 15–20 cm, and soil water content (SWC) was measured using the same method as described in our previous study [2]. Fresh soil weight (FW) was weighed immediately after soil collection. After the samples were dried at 105 °C, the dry weight (DW) was obtained. The soil water content (SWC, %) was calculated as follows:
SWC = (FW − DW)/DW × 100
Field water capacity (FWC) was measured during the harvest season of 2022. A circular ring knife (5 cm in diameter) was employed to collect undisturbed soil at a depth of 5–10 cm. The ring knife was then returned to the laboratory, soaked in water for 24 h, and naturally filtrated for 8 h to remove gravity water, and the SWC of these soils was measured and used as the FWC. Using the same method, soil was collected at the harvest stage to detect TN, TP, and SWC. After millet was cultivated continuously for two years, a rotation with soybeans (Glycine max (L.) Merr. Zhonghuang 13) was conducted with the same treatment, and after the harvest of soybeans, the soil from depth of 0–20, 20–50, and 50–80 cm was sampled and used for detecting SOM.
Soil pH was determined using a 1:2.5 (w:v) suspension of soil in water and a benchtop pH meter (Seven Excellence pH Meter Line, Mettler Toledo, Greifensee, Switzerland). SOM was measured using the potassium dichromate oxidation heating method, while TN was measured using a Kjeltec 2300 analyzer (Foss Tecator AB, Hoganas, Sweden). TP was detected using the Mo-Sb anti-spectrophotometric method, and soil AN was measured using the alkaline solution diffusion method, with soil AP determined using the Olsen method and an extraction agent of 0.05 mol L−1 sodium hydroxide. At the harvest stage, the grain yield of the entire plot was collected and analyzed.
Soil representative organic acids (oxalic acid, acetic acid, and citric acid) were measured using high-performance liquid chromatography with an Insertsil ODS-3 (5 mm, 4.6 × 250 mm, elite Inc., Dalian, Liaoning Province, China) under the following conditions: a flow rate of 1.0 mL min−1 for the mobile phase, consisting of 98% phosphoric acid (0.1%) and 2% acetonitrile; column temperature of 35 °C; and UV detection at 210 nm [16]. To extract soil acid, 0.1% phosphoric acid (v/v) was used following our previous method, and a 0.45 μm membrane filter was used to filter out the soil acid [20]. Two technical replications were performed for each sample, and the mean of these two technical replications was used for analysis. Soil enzyme activity was measured for typical enzymes, including urease, catalase, and sucrase. To measure catalase activity, titration with potassium permanganate was used, while urease activity was measured using indophenol blue colorimetry. The detailed methods of catalase and urease activity measurement were described in our previous study [16]. Sucrase activity was detected using the 3,5-dinitrosalicylic acid colorimetric method. Briefly, after incubation at 37 °C for 24 h, glucose production was measured to assess sucrase activity [21]. No substrates or soils were added during incubation to induce blanks.

2.4. Data Statistics and Analysis

One-way ANOVA with the least significant difference (LSD) was employed to compare the soil and grain yield data from the CK, B1, B2, and B3 treatments during the same growth season. Furthermore, the effects of biochar, year, and the combined effects of the year and biochar treatment were investigated using two-way ANOVA with Duncan’s multiple comparison test using SPSS version 18.0 (SPSS Inc., Chicago, IL, USA). Data are presented as mean values ± standard deviation (SD) and were used to create figures using GraphPad Prism 9.5 (GraphPad Software, Boston, MA, USA). The correlations among factors of grain yield and soil indices at the flowering stage were detected using a two-sided test with the Pearson correlation method.

3. Results

3.1. Soil Bulk Density, pH, and Soil Water Content
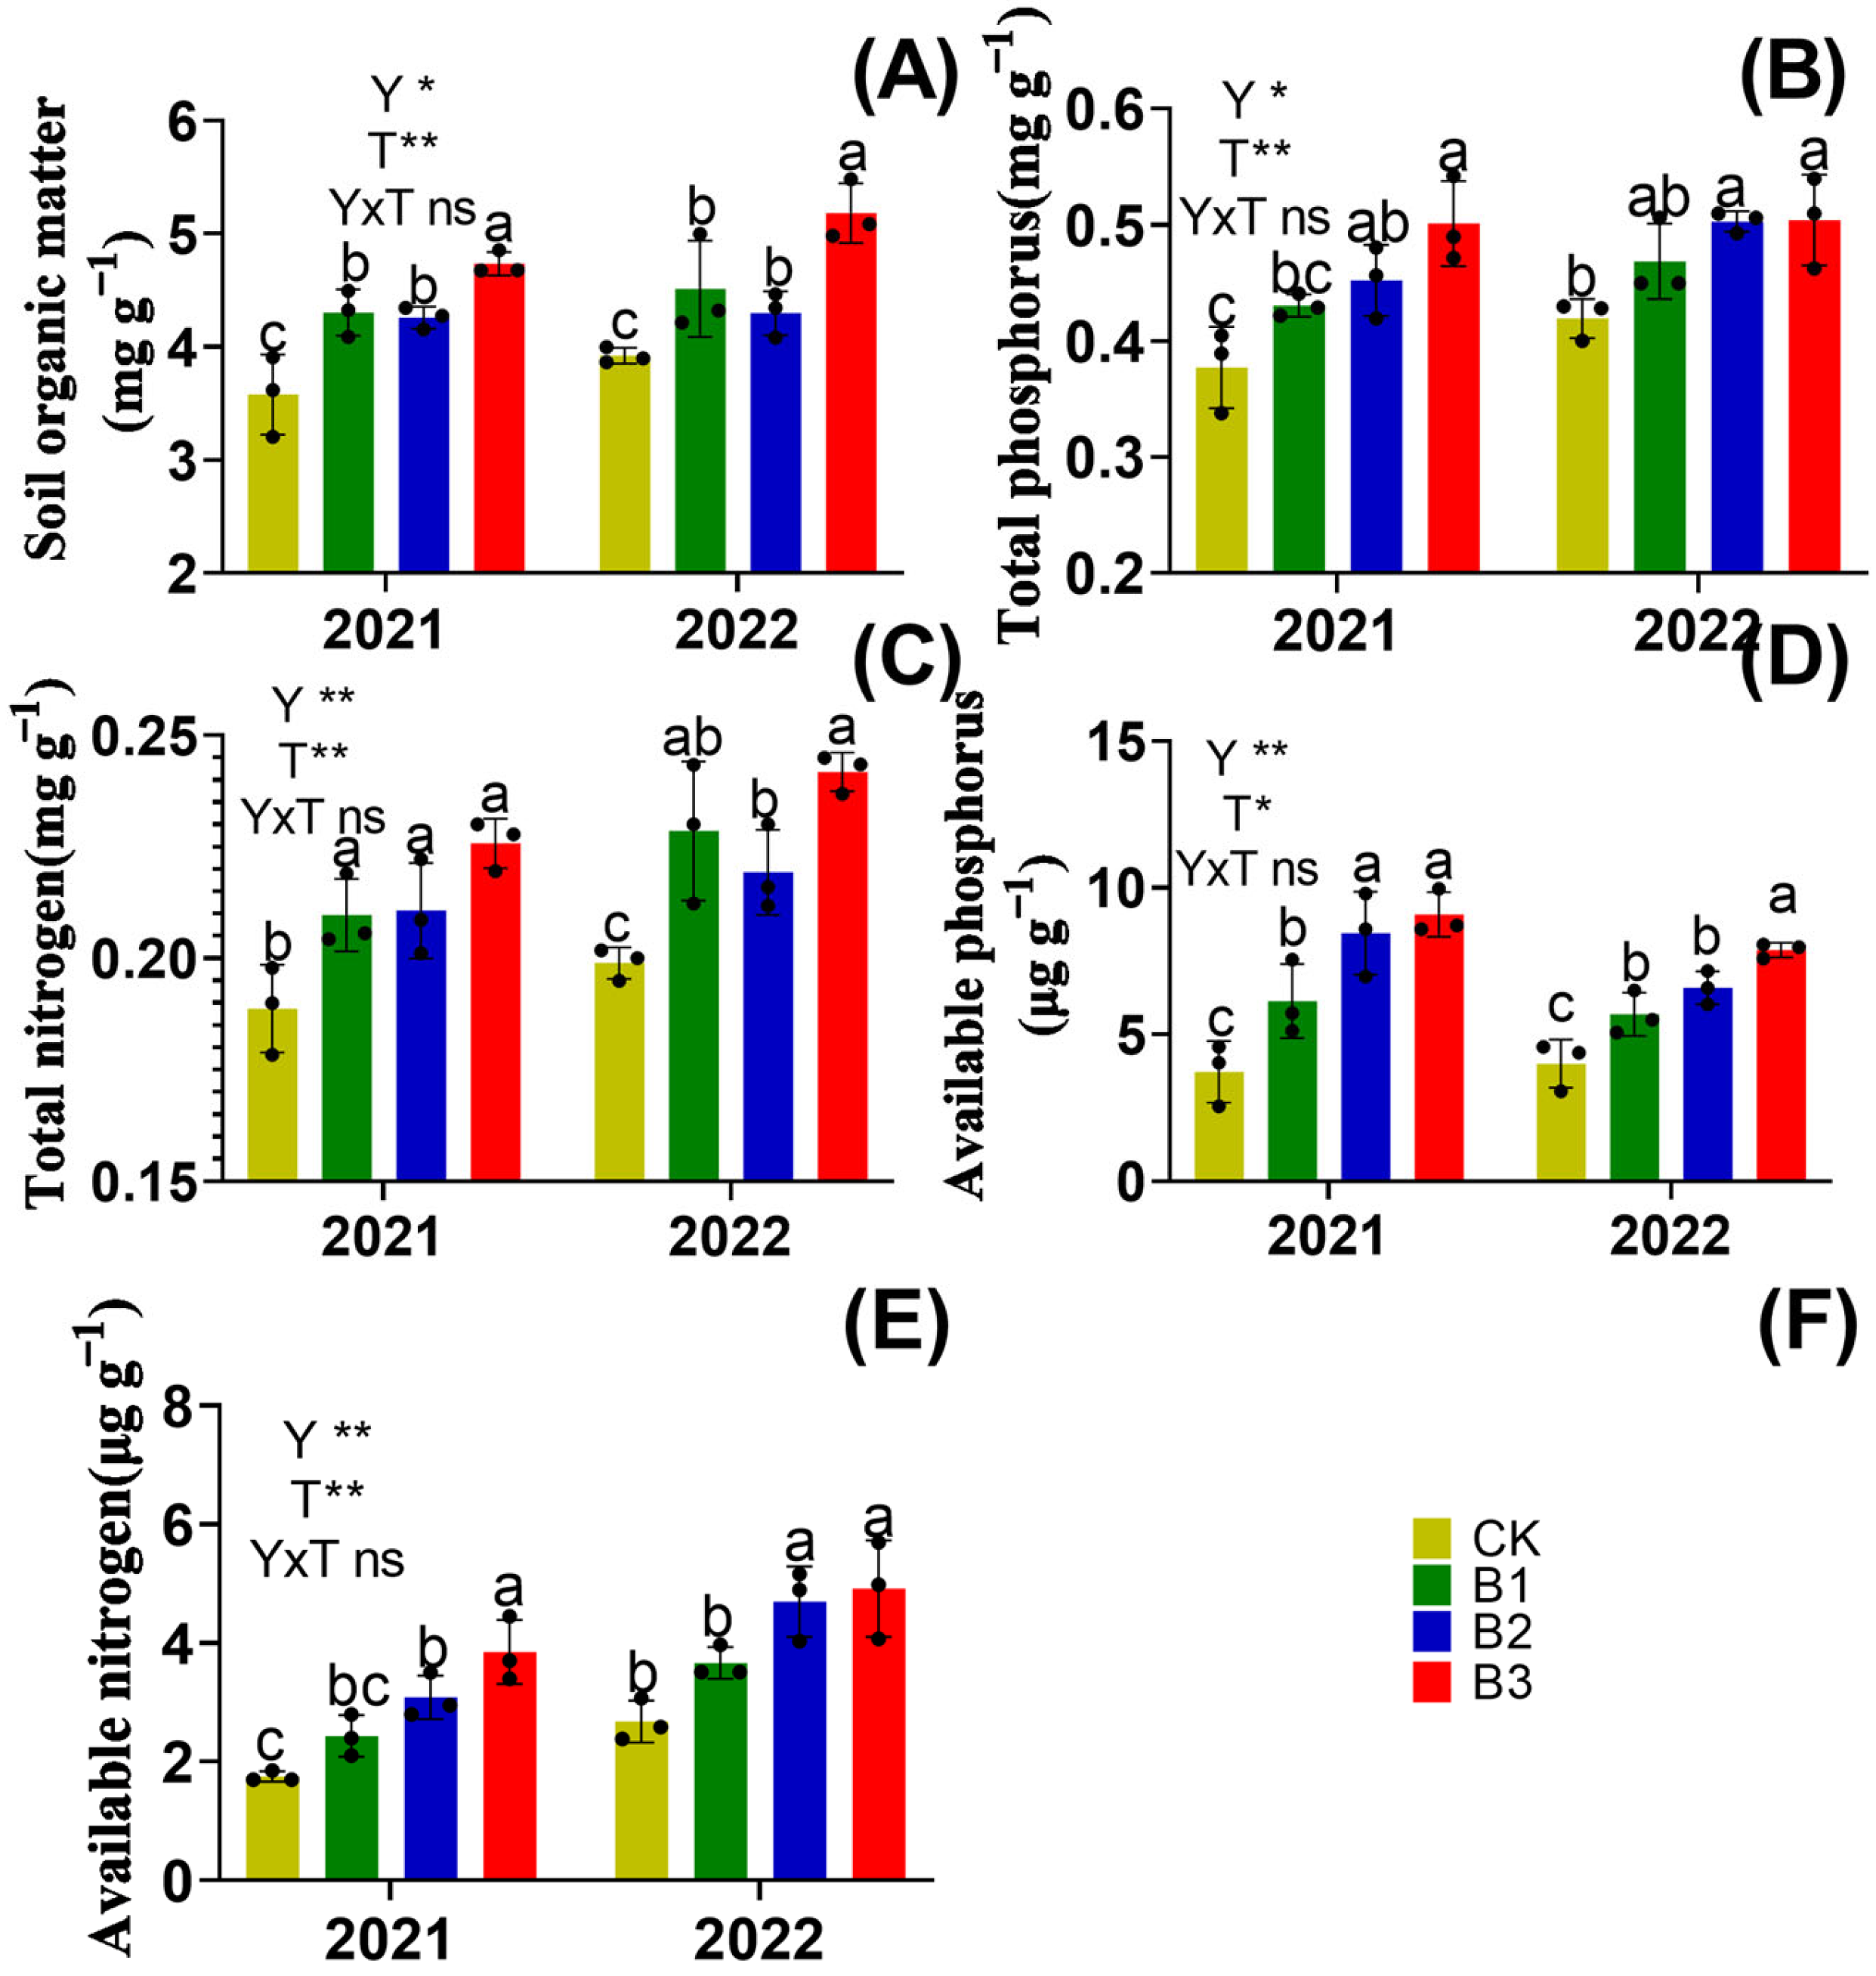
In the 2021 growing season, the SBD ranged from 1.56 to 1.66 g cm−13, and the application of 6000 kg biochar per hectare significantly reduced SBD (Figure 2A). In the second season, the maximum SBD was 1.58 g cm−3 in the control group (CK), followed by that of the biochar treatment groups (B1, B2, and B3). The application of biochar (treatment) and the year significantly affected SBD (p < 0.01), but the interaction between the year and treatment had no significant effect. Biochar application also significantly reduced soil pH, especially in 2022 (Figure 2B). The soil pH was the highest (8.45) in the control group, followed by that in the B1 (8.32), B2 (8.24), and B3 (8.22) groups. The addition of biochar significantly increased the SWC in both growth seasons (flowering stage, p < 0.01, Figure 2C). Briefly, the B3 group had the highest SWC, with 10.7% in 2021 and 15.94% in 2022, followed by the B2 (8.63 and 15.05%), B1 (8.40 and 12.19%), and CK (6.10 and 9.48%) groups. At the harvest stage, the SWCs of the biochar treatment groups were higher than that of the CK group (Figure S3), confirming that biochar application increased SWC. To confirm these results, FWC was measured in the harvest season of 2022, and the results showed that biochar addition significantly increased FWC (Figure S4).

3.2. Soil Nutrients

There was a significant increase in SOM content in both years in the biochar-treated groups compared with that in the CK group (p < 0.05, Figure 3A). The B3 treatment group had the highest SOM content (4.73 mg g−1 in 2021 and 5.78 mg g−1 in 2022), followed by the B2, B1, and CK groups (3.57 mg g−1 in 2021 and 3.92 mg g−1 in 2022), with no significant difference between the SOM contents in the B2 and B1 treatments in both growth seasons while the SOM in 2022 was lower than that in 2021. SOM content was significantly affected by treatment and year (p < 0.05). After rotation for one growth season of soybeans, the SOM was decreased compared with 2022, and the biochar added treatment group had higher SOM content than the CK group (Figure S5).
In 2021, TP content ranged from 0.37 to 0.50 mg g−1, and the B3 treatment resulted in the highest TP content, followed by the B2, B1, and CK treatments, with significant differences between the B2, B3, and CK treatments (p < 0.05, Figure 3B). A similar trend in TP content was observed in 2022. Biochar treatment also significantly increased the soil TN content (p < 0.05, Figure 3C). In 2021, there was no significant difference among the biochar-treated groups, while in 2022, the B2 treatment group exhibited the lowest TP content among the biochar application groups. Both TP and TN were significantly affected by treatment and year. A similar result was also detected in soils at the harvest stage (Figure S6).
AP content ranged from 2.68 to 7.88 μg g−1, and AP increased as the amount of biochar applied increased (Figure 3D). Compared with the CK, biochar increased AP from 64.7 to 143% in 2021 and 41.9 to 96.5% in 2022. AN ranged from 1.75 to 3.85 μg g−1 in 2021 and 2.67 to 4.91 μg g−1 in 2022 (Figure 3E); compared with the CK, biochar increased AN from 29.7 to 108% in 2021 and 37.0 to 88.4% in 2022. In both seasons, the B3 group exhibited the highest AN content, followed by the B2, B1, and CK groups, with no significant differences between the AN content in the CK and B1 treatment groups (p > 0.05), while a significant difference was detected between the AN content of the B2, B3, and CK treatments (p < 0.05). The AN contents of the biochar application groups were significantly different from that of the CK group (p < 0.05). Year and biochar application had a significant effect on AN and AP, while the interaction of the year and treatment did not significantly affect these indexes.

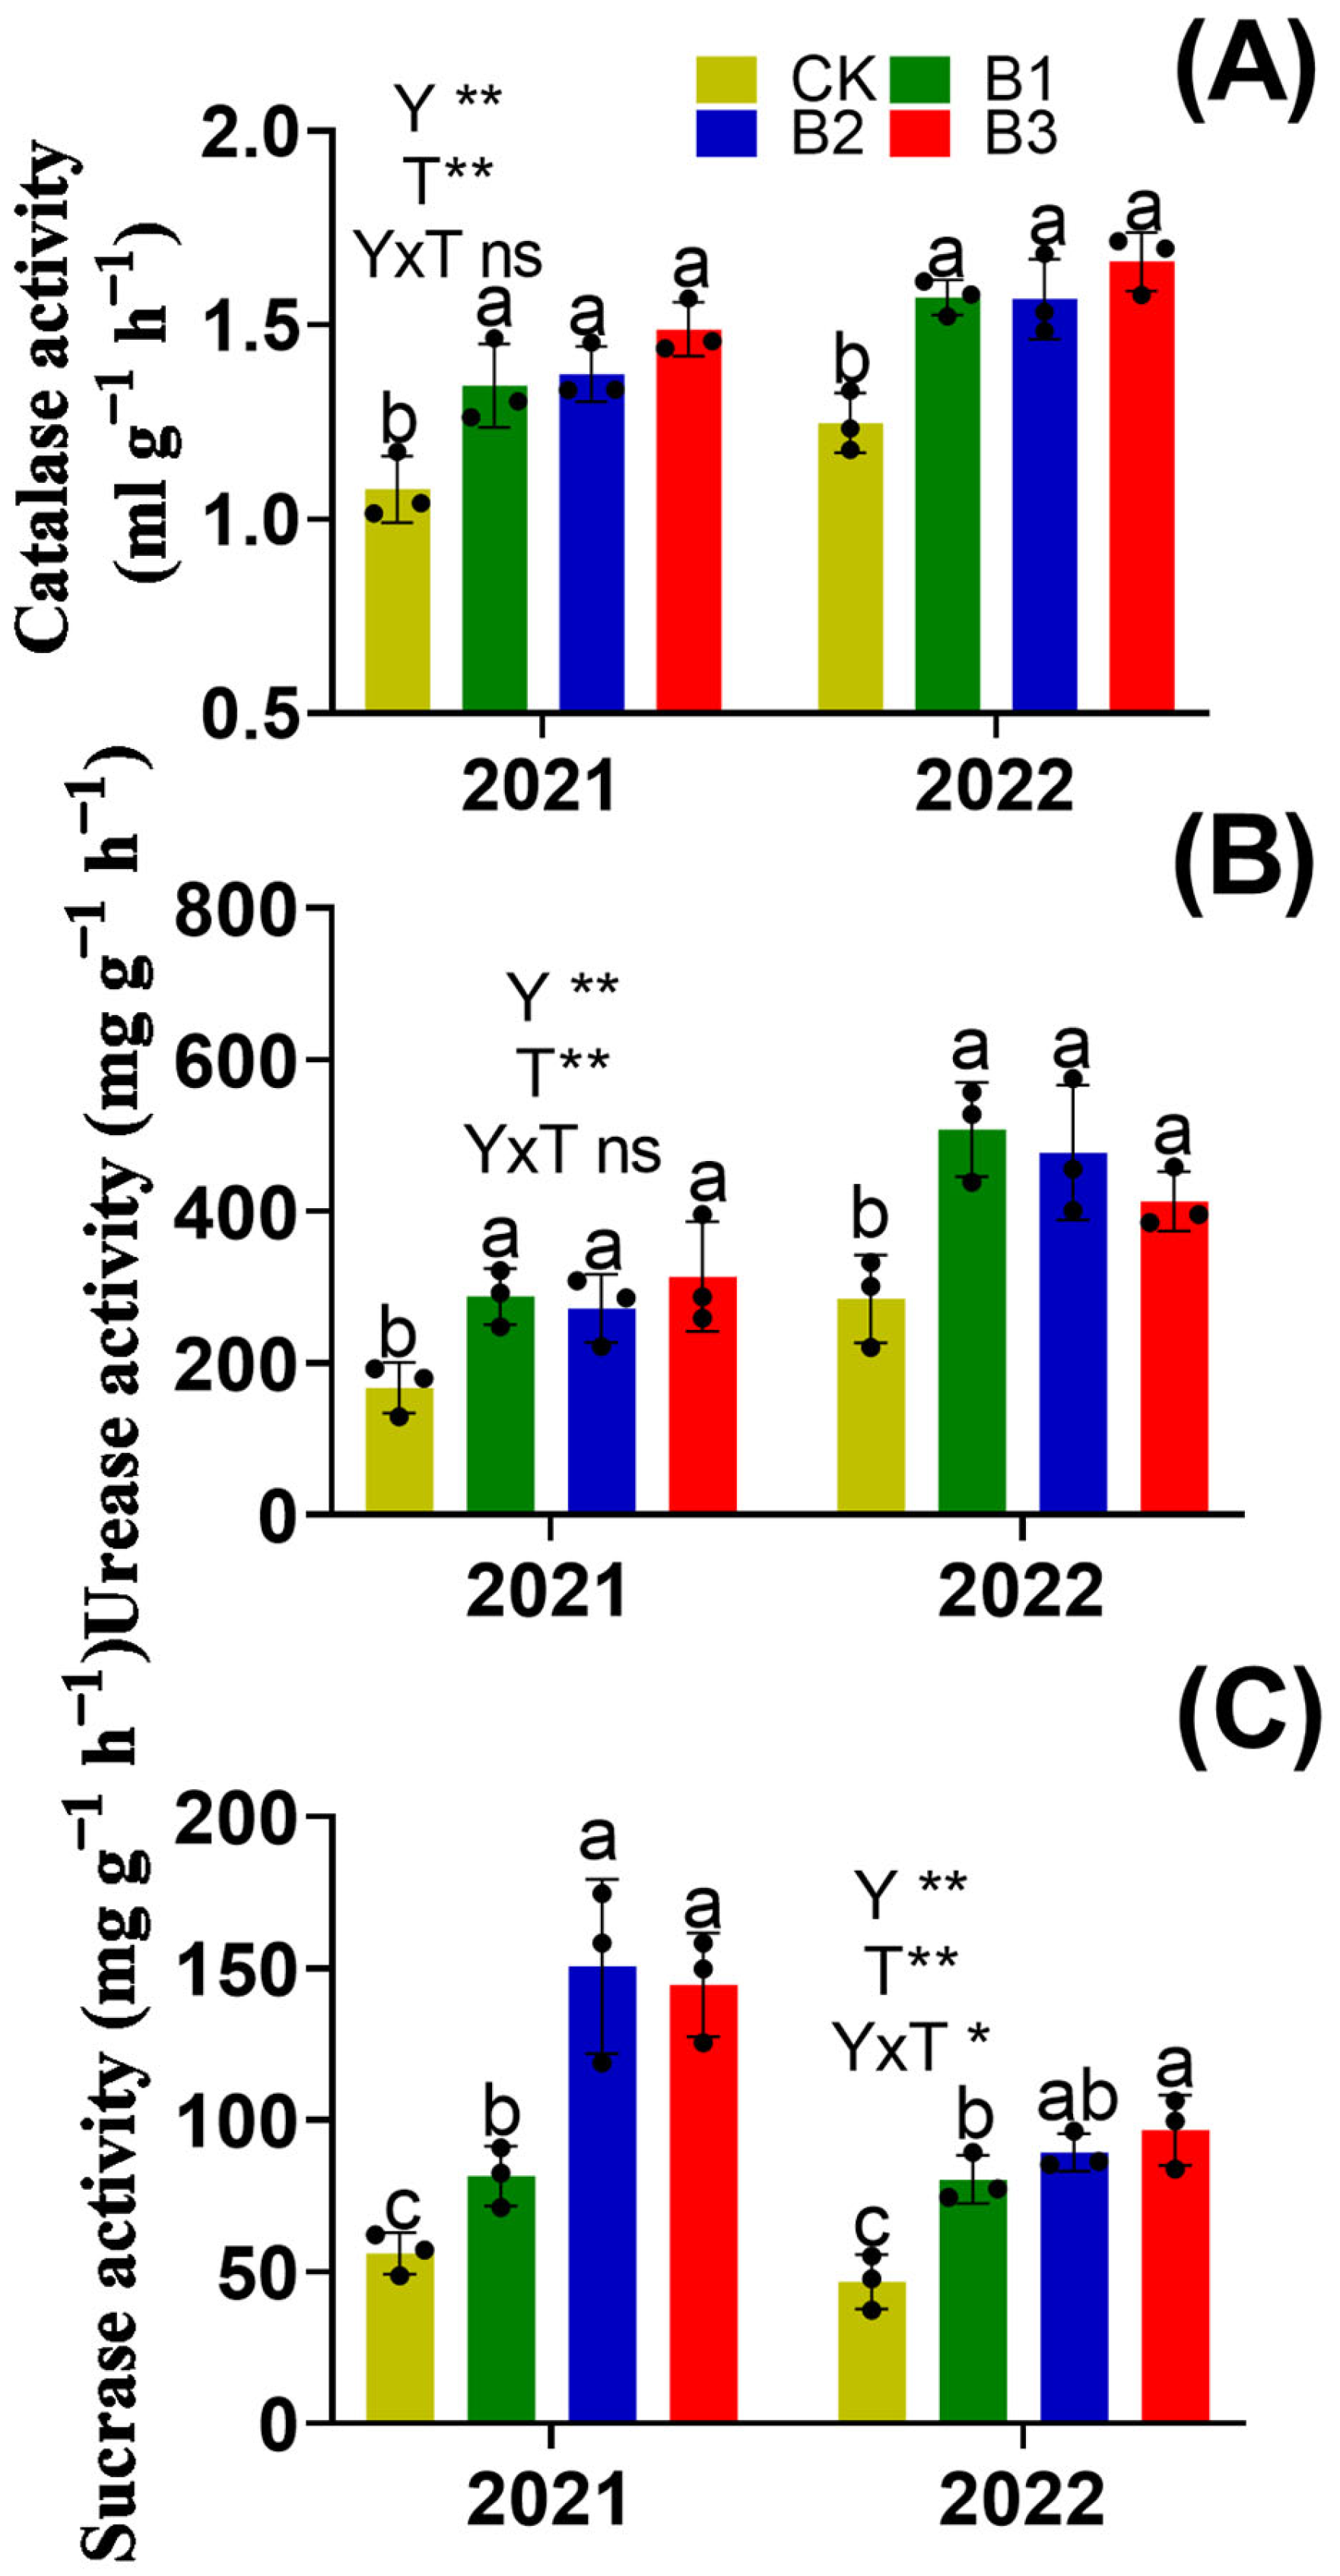
3.3. Soil Enzyme Activity and Organic Acids

The application of biochar significantly increased soil catalase activity (p < 0.05, Figure 4A) in both years. The amount of biochar applied had no effect on catalase activity, as there was no significant difference in the catalase activity among the B1, B2, and B3 treatments (p > 0.05). Similar results were also observed for urease activity (Figure 4B). The application of biochar significantly increased soil urease activity (p < 0.05), but there was no significant difference in urease activity among the B1, B2, and B3 treatments (p > 0.05) in both planting seasons. Sucrase activity increased with increased amounts of biochar applied (Figure 4C). There was a significant difference in sucrase activity between the CK and biochar groups. However, there was no significant difference in sucrase activity between the B2 and B3 treatments (p > 0.05) in both growing seasons. Catalase and urease activities were significantly affected by biochar application and year, but they were not impacted by the interaction between the treatment and year. However, sucrase activity was significantly affected by the year, biochar application, and their interaction.
The application of biochar also increased oxalic acid content, which increased with the increase in the amount of biochar applied (Figure 5A). In 2021, the oxalic acid content in soil after the B3 treatment was 95 times higher than that in soil from the CK, while in 2022, it was 3.7 times higher than that in the CK. The oxalic acid content was significantly affected by biochar application and year, while the interaction of the year and treatment had no significant effect on oxalic acid content. Acetic acid had a similar trend to that of oxalic acid (Figure 5B) and was significantly impacted by year, biochar application, and their interaction. In 2021, no significant difference was detected in citric acid content between the treatments (Figure 5C), while in 2022, the B3 group had the highest citric acid content (0.18 μg g−1), followed by that of B2 (0.14 μg g−1), B1 (0.08 μg g−1), and CK (0.05 μg g−1). Citric acid content was significantly influenced by the application of biochar, but it was not affected by the year or interaction of the year and treatment.

3.4. Grain Yield

The grain yields ranged from 3092 to 4753 kg ha−2 (Table 2). In 2021, the lowest grain yield was 3410 kg ha−2 in CK, and the highest yield was 4250 kg ha−2 in the B3 treatment, followed by B2 (4093 kg ha−2) and B1 (3827 kg ha−2). Compared with the 2021 planting season, the yield in 2022 increased with the same amount of biochar applied, and the yield of CK in 2022 decreased. Compared with CK, biochar increased grain yield from 12.2 to 24.6% in 2021 and 27.1 to 53.7% in 2022, respectively. The grain yield was significantly influenced by the application of biochar (treatment), while it was not affected by the year or the interaction of year and treatment.

3.5. Relationships Among Soil Properties and Grain Yield

The grain yield showed a significant negative correlation with SBD and soil pH (Table 3, p < 0.05) and a significant positive correlation with all other indices (p < 0.05). Soil pH was found to be negatively correlated with soil oxalic acid content, AP, and sucrase activity (p < 0.05). Catalase activity was negatively correlated with SBD (p < 0.05). AN and AP were negatively correlated with SBD and positively correlated with catalase activity (p < 0.05). AN was positively correlated with urease activity (p < 0.05), and AP was positively correlated with sucrase activity (p < 0.05). The SWC was positively correlated with SOM and negatively correlated with SBD (p < 0.05).

4. Discussion

Identification of an efficient method to improve the soil fertility of newly reclaimed land, especially degraded sandy land, has attracted the interest of many researchers [3,22,23]. Previously, we found that the addition of soft rocks and bacterial manure can improve soil properties and achieve promising results [2,9]. However, these methods could not solve the problem of agricultural production waste, e.g., aboveground biomass. Returning crop residues directly to the field causes many problems, including stimulating emissions of greenhouse gases and reducing soil water storage capacity. Developing techniques to convert crop residues into biochar may be a solution to these problems [24,25]. In the present study, the effects of the application of biochar produced from maize straw on the properties of newly reclaimed land soils were evaluated. The biochar resulted in significant improvements in soil physical and chemical properties and also enhanced grain yield.

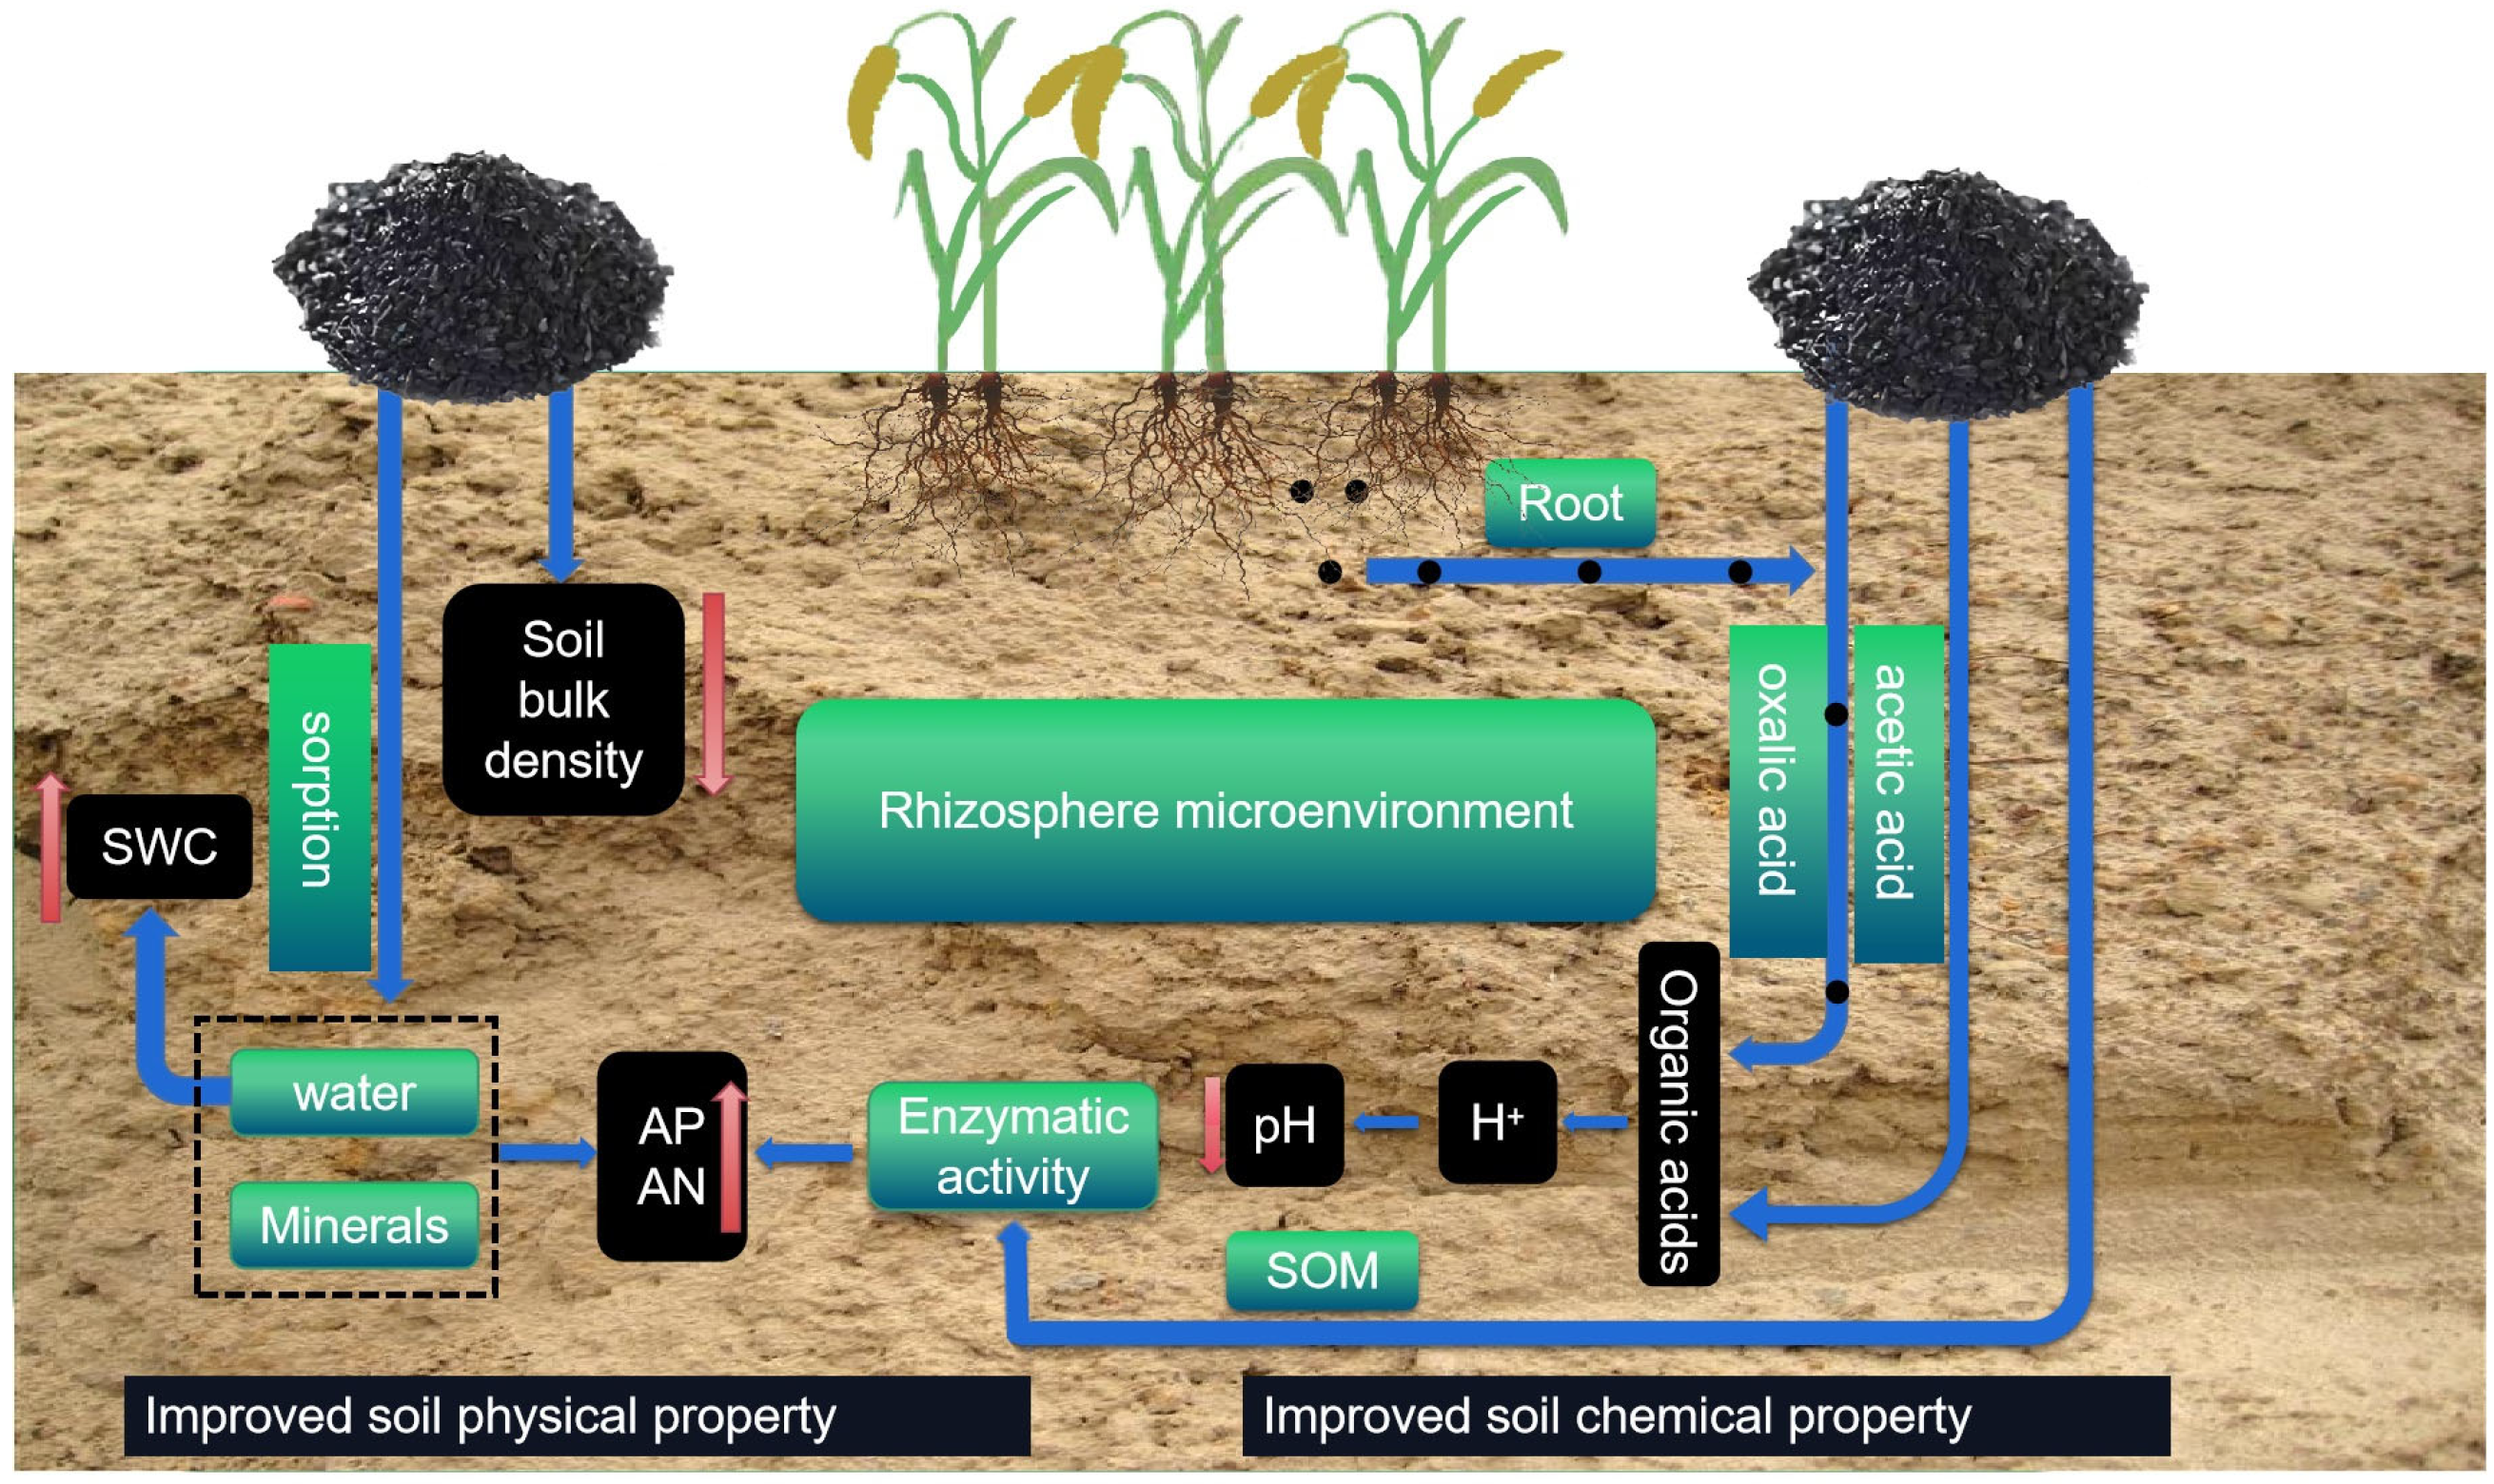
4.1. Biochar Decreased Soil Bulk Density and Improved Soil Water Retention

Sandy soils usually have a higher SBD, which hinders the growth of plants as the optimum SBD for plant growth is 1.4–1.5 g cm−3 [26]. Biochar, as a porous carbonaceous material, has a low bulk density, which means it weighs less in the soil. However, its charge density and surface area are relatively large. This unique physical property gives biochar a significant advantage in soil amendment. When biochar is applied to soil, it effectively reduces the SBD. Owing to its porous structure, biochar is able to absorb and retain large amounts of water, thereby significantly increasing the water-holding capacity of coarse-textured soils. This increase in water-holding capacity is critical for crop growth, especially in arid or semi-arid areas. Due to its low bulk density, biochar has been widely found to reduce SBD [25,27]. Our results were consistent with these findings as biochar was found to increase soil porosity [25]. The reduced SBD could be explained by biochar increasing the total soil porosity and producing physical dilution. Thus, the lower bulk density of the added biochar actually reduced SBD through physical dilution effects. In contrast to a study that found lower biochar application rates (<15,000 kg ha−1) could not significantly decrease SBD in sandy soils [28], our experiment was conducted in covered loess soil; therefore, although our application amounts were low, physical dilution may still play a role in reducing SBD. Here, we found that SBD exhibited a downward trend with the increase in biochar application amounts.
In addition, biochar application increased soil porosity [29,30]. Although we did not measure soil porosity in the present study, a similar biochar produced by the same factory has been found to increase soil porosity [25]. We believe that improvement in soil porosity was also an important factor that contributed to the decreased SBD.
An improvement in SWC was found in the present study. This was in line with the findings of previous studies [29,30,31,32], which have reported that biochar improved the soil skeleton due to its porous nature, enabling the soil to absorb or store more water, and thus enhancing soil water-holding capacity. SBD is negatively correlated with soil water capacity [33]. Our results showed that biochar markedly decreased SBD, which could be beneficial to improving SWC.
Our result showed that the biochar application increased FWC significantly, which was consistent with the results of a previous study [34]. The increased FWC could be an important factor that contributes to the higher SWC. In addition, low SOM content resulted in a reduction of soil water-holding capacity [35]. Biochar application increased SOM in the present study. The higher SOM induced by biochar application may play an important role in maintaining the enhanced SWC. The correlation analysis results also confirmed these conclusions, as SWC was negatively correlated with SBD and positively correlated with SOM.

4.2. Biochar Decreased Soil pH in Saline–Alkaline Soil

Soil pH is an important indicator of cultivated land quality and directly affects soil fertility, nutrient availability, microbial activity, and crop growth and development [36]. Reducing the pH of saline–alkaline soil is crucial for sustainable agriculture. In a previous study, biochar was found to increase soil pH and reduce the phytotoxicity of heavy metals [37]. However, that study was conducted with acidic soil, and the higher pH of biochar directly contributed to an increase in soil pH. According to our 2-year field research on saline–alkaline soil, biochar produced from maize straw can decrease the pH of rhizosphere soil. In our previous study, we also found that rhizosphere soil pH was reduced in a licorice field [25]. When investigating the underlying reason, we found that biochar application significantly increased the oxalic acid and acetic acid contents of the rhizosphere soil. Soil organic acids may be produced from the decomposition of organic matter and root exudates [38]. In this study, biochar application increased SOM content, which may have produced more organic matter for decomposition, resulting in an increase in soil organic acid content. Organic matter degradation is an important source of acetic acid [39].
In addition, decreased soil pH in alkaline soils may enhance the conversion from unavailable phosphorus to available phosphorus [23]. Here, a significant negative correlation between AP and soil pH was found, which indicated that the decreased pH contributed to the increased AP.
Oxalic acid is found in a wide variety of plants, and recently, the extent to which roots exude oxalic acid into the soil has come to be considered an important factor in regulating the root microenvironment [20,40,41]. In this study, biochar application was found to increase soil oxalic acid content. As plants can exude oxalic acid to improve the rhizosphere microenvironment to complete their growth, this could be because biochar stimulated the secretion and efflux of oxalic acid from the roots [20,40,42]. In summary, biochar application could increase the soil oxalic acid and acetic acid content, which may be beneficial for decreasing soil pH. This was confirmed by the correlation analysis results, which showed that soil pH was negatively correlated with soil oxalic acid content.

4.3. Biochar Application Improved Soil Fertility

Soil fertility, particularly soil nutrient availability, is influenced by many complex physical and chemical processes, including soil pH, soil water- and fertilizer-holding capacity, and plant secondary metabolites [43]. Here, we found that the application of biochar increased the total soil nitrogen and phosphorus content, as well as the available nitrogen and phosphorus content. The direct reasons for this are twofold. Firstly, biochar contains nutrients, including nitrogen and phosphorus, and when biochar is used in the field, the nutrients may be released into the soil. Secondly, the carbon contained in biochar has adsorption capabilities [44], and this property could allow biochar to adsorb nutrient ions such as nitrogen and phosphorus, thus reducing nutrient loss. Notably, in the present experiment, the soil was collected from the rhizosphere (0–30 cm depth). The biochar was applied once before soil tillage, and after rotary tillage, it was mixed with topsoil (0–30 cm). At the soil surface, drip irrigation would influence SBD. The nitrogen and phosphorus data were obtained from topsoil, not the whole soil. We believe that soil sorption could help to maintain relatively higher nitrogen and phosphorus contents, as the FWC increased with biochar application. In sandy soils, biochar application could maintain relatively high soil phosphorus content through enhancing soil sorption of phosphorus [45].
The present study shows that biochar application is beneficial for maintaining soil nutrient contents, which may be due to the adsorption capabilities of biochar. In addition, the decline in SBD influences the soil water-holding capacity indirectly, which also contributes to the improvement in the soil’s ability to maintain nutrients [7]. This was confirmed by the improved soil FWC in this study, which indicated that more water was retained in the topsoil, preventing the further loss of available nitrogen and phosphorus with water. Here, an increase in SOM was observed in the biochar treatment groups (Figure 2), which demonstrated 1–2 mg g−1 increases in B3 when compared with CK. Maize straw-derived biochar with similar properties produced by the same factory as our study increased SOM by approximately 2.5 mg g−1 in sandy soils at the maize jointing stage under sufficient irrigation. In contrast, under drought conditions, there were no significant differences in SOM content in the groups which did or did not undergo biochar application [46]. Under sufficient irrigation conditions, all groups contained lower SOM than those under drought conditions [46]. In another study that used similar biochar produced by the same factory, biochar application was found to increase the aromatic and hydrophobic properties of SOM, which may function in slowing the water solubility consumption of SOM. In addition, here in the present study, the biochar had many small holes in its surface (Figure S2), which could be of benefit in maintaining water and soil nutrients including SOM. Biochar application also significantly increased SOM contents overall [47]. We believe that the biochar-induced increases in SOM observed in both our study and Yang’s study were the result of biochar increasing the hydrophobic nature of SOM and the decrease in organic matter dissolved in deep soil during irrigation and rainfall. The increased SOM in the CK and biochar treatments in the growing season compared with their pre-cultivated status (Table 1) could be a result of the degradation of grass and shrub leaves mixed into the soil during land reclamation, as in the detection of data for Table 1, the grass and leaves were manually selected, while in the flowering study, they were degradation. The continuous results of SOM from the rotation of soybeans confirmed the speculation that without the addition of grass and shrub leaves again, the SOM in the present study area decreased compared with the growth season of 2021 and 2022. However, the added biochar treatments had relatively higher SOM than the CK after the application of biochar for three years.
Furthermore, biochar application led to an increase in soil enzyme activity. Soil enzymes serve as valuable indicators of soil health [48] and play a crucial role in the nutrient cycle and promoting plant growth [19,49]. Our previous study confirmed that biochar increased the activity of soil catalase and urease [16]. Soil urease, a significant indicator of soil nitrogen content, plays a role in hydrolyzing nitrogen-containing organic matter to enhance soil available nitrogen content [50]. Catalase is considered an indicator of aerobic microorganisms, reflecting the redox ability of soils, and is closely related to soil fertility [51]. The increased application of biochar induced a rise in organic matter, benefiting microbial growth and enzyme synthesis due to the ample raw material provided by biochar. Ultimately, the heightened soil enzyme activity accelerated the decomposition of organic matter and the release of mineral nutrients. The increasingly hydrophobic nature of biochar-induced SOM necessitates stronger active soil enzymes to decompose organic matter. All these changes collectively contribute to the improved soil available nitrogen and phosphorus content resulting from biochar application.

4.4. Biochar Application Increased Millet Grain Yield

Biochar application has been found to enhance crop grain yield in many plant species [2,13,16]. In the present study, biochar increased grain yield from 12.2 to 24.6% in 2021 and 27.1 to 53.7% in 2022, respectively. The grain yield was significantly influenced by the application of biochar (treatment), while it was not affected by the year or the interaction of year and treatment. In general, such high increases (53.7%) in yield are not commonly observed due to biochar application alone. Wheat grain yields increased by 28.0% under biochar treatment when compared with no biochar treatment [52]. However, most of these results were achieved with fertile farmland, in which the SOM was higher than 13.2 mg g−1, and our results were achieved in newly reclaimed fields with a SOM content of 1.5–2.5 mg g−1. We hypothesize that biochar may be more effective in improving fertilizer retention and yield in barren and nutrient-prone farmland. In our previous study conducted on sandy soil, with poor water- and fertilizer-retention properties, biochar increased the yield of millet by 46.0% [2]. In our previous study, we found that the properties of millet at the flowering stage contributed to grain yield formation. Unsuitable soil pH seriously affects crop production, and it is critical to reduce the pH of saline soils. Moreover, high soil capacity leads to reduced space for crop root hairs and microbial activity, which can reduce crop growth and the rate of microbial degradation of nutrients such as organic matter in the soil. According to the correlation analysis, we found that the lowered soil SBD and pH and the improved soil AN and AP induced by biochar application contributed to the enhanced millet grain yield. Biochar increased the soil AP content, which in turn increased the crop plant grain yield [16]. This implies that biochar application increases soil fertility, leading to an increase in grain yield in the present soil types. As an important model plant for C4 crops [53], the effect of biochar on millet grain yield could play a significant role in improving C4 crop production.
Based on the above analysis, the mechanism underlying the effect of biochar on the soil properties of newly cultivated land has been described (Figure 6). Biochar application significantly increased FWC, SWC, and SOM and decreased SBD. The increased SOM content improves enzymatic activity. Biochar stimulates plant roots to secrete organic acids, such as oxalic acid into the rhizosphere soil, and accelerates the decomposition of organic matter into organic acids such as acetic acid, which improves the rhizosphere microenvironment by lowering soil pH. As a result, the decreased soil pH improves the availability of soil phosphorus and nitrogen.

5. Conclusions

Our study examined the variation in soil physical and chemical properties and millet yield with or without biochar application. All biochar treatments resulted in increased SOM, total phosphorus, total nitrogen, soil enzyme activity, and soil organic acid content, while significantly decreasing soil pH and bulk density. These changes contributed to higher millet grain yield production following biochar treatment. Among the biochar treatments, concentrations of 4500 kg/ha and 6000 kg/ha led to higher grain yield, total nitrogen, SOM, and total phosphorus. However, no significant difference in soil total nitrogen and total phosphorus were observed between these two treatments at the harvest stage. Consequently, we posit that, following changes in land use from uncultivated sandy land, biochar application at a concentration of 4500–6000 kg/ha could effectively improve soil properties and significantly enhance grain yield. Our results underscore that the use of biochar increases soil fertility and boosts grain yield in foxtail millet, highlighting the positive impact of biochar application on soil improvements and crop production in newly reclaimed land with saline–alkaline soil. Further research is needed to study the effect of biochar on different types of soils, such as sandy loam, loamy and clayey, in order to improve the nutrient retention capacity and water retention capacity of soils.

Supplementary Materials

The following supporting information can be downloaded at: https://www.mdpi.com/article/10.3390/agronomy14112465/s1, Figure S1. Location of the experiment site (A), the original appearance of the sand land before reclamation (B), and aerial view of the sand land after reclamation (C); Figure S2. Morphological features of biochar measured by a Zeiss Sigma 300 field emission-scanning electron microscope; Figure S3. Soil water content of soils at the harvest stage of two growth seasons with or without biochar application; Figure S4. Effects of biochar addition on soil field water capacity after two millet growth seasons; Figure S5. Effects of biochar addition on organic matter after two millet growth seasons and one soybean growth season; Figure S6. Soil organic matter (A) and total phosphorus (B) and nitrogen (C) at the harvest stage of two growth seasons (2021 and 2022) with or without biochar application.

Author Contributions

Conceptualization, J.Y. and N.Z.; methodology, W.H.; validation, X.H., Y.Z. and W.H.; investigation, J.Y.; resources, Y.C.; data curation, N.Z.; writing—review and editing, X.H. and J.Y. All authors have read and agreed to the published version of the manuscript.

Funding

This research was funded by the National Natural Science Foundation of China (32460540 and 32301315), the Innovation Ability Support Program of Shaanxi Province (2023KJXX-072 and 2024CX-GXPT-03), Key R&D Plan of Shaanxi Province (2024NC-YBXM-012) and Yulin University graduate innovation Foundation (2024YLYCX18 and 2024YLYCX16). YC was funded by Australian Research Council (FT210100902). The present manuscript was used to celebrate the 102nd anniversary of Yulin university, which was built in 1923.

Data Availability Statement

The original contributions presented in the study are included in the article/Supplementary Materials, further inquiries can be directed to the corresponding author.

Conflicts of Interest

The authors declare that they have no known competing financial interests or personal relationships that could have appeared to influence the work reported in this paper.

References

  1. He, M.; Gao, X.; Zhao, Z.; Yang, H.; Huang, L.; Li, X.; Lei, J. Ecological Restoration and Countmeasures Against Desertification Crisis in Aral Sea Region. Bull. Chin. Acad. Sci. (Chin. Version) 2021, 36, 130–140. [Google Scholar]
  2. Sun, Y.; Zhang, N.; Yan, J.; Zhang, S. Effects of soft rock and biochar applications on millet (Setaria italica L.) crop performance in sandy soil. Agronomy 2020, 10, 669. [Google Scholar] [CrossRef]
  3. Sun, Z.; Han, J. Effect of soft rock amendment on soil hydraulic parameters and crop performance in Mu Us Sandy Land, China. Field Crops Res. 2018, 222, 85–93. [Google Scholar]
  4. Wang, Z.; Wang, L.; Liu, L.; Zheng, Q. Preliminary study on soil moisture content in dried layer of sand dunes in the Mu Us sandland. Arid Zone Res. 2006, 23, 89–92. [Google Scholar]
  5. Saifullah; Saad, D.; Asif, N.; Zed, R.; Ravi, N. Biochar application for the remediation of salt-affected soils: Challenges and opportunities. Sci. Total Environ. 2017, 625, 320–335. [Google Scholar] [CrossRef]
  6. Chen, T.; Liu, C.; Zhang, F.; Han, H.; Wang, Z.; Yi, B.; Tang, L.; Meng, J.; Chi, D.; Wilson, L.T. Acid-modified biochar increases grain yield and reduces reactive gaseous N losses and N-related global warming potential in alternate wetting and drying paddy production system. J. Clean. Prod. 2022, 377, 134451. [Google Scholar] [CrossRef]
  7. Qi, S.; Yang, S.; Lin, X.; Hu, J.; Jiang, Z.; Xu, Y. The long-term effectiveness of biochar in increasing phosphorus availability and reducing its release risk to the environment in water-saving irrigated paddy fields. Agric. Water Manag. 2023, 282, 108295. [Google Scholar]
  8. Singh, S.; Luthra, N.; Mandal, S.; Kushwaha, D.P.; Pathak, S.O.; Datta, D.; Sharma, R.; Pramanick, B. Distinct behavior of biochar modulating biogeochemistry of salt-affected and acidic soil: A review. J. Soil Sci. Plant Nutr. 2023, 23, 2981–2997. [Google Scholar] [CrossRef]
  9. Zhang, N.; Yan, J.; Liu, P. Effect of bacterial manure on the properties of complex soil and growth of ryegrass. Agronomy 2021, 11, 568. [Google Scholar] [CrossRef]
  10. Ghorbani, M.; Neugschwandtner, R.W.; Konvalina, P.; Asadi, H.; Kopecký, M.; Amirahmadi, E. Comparative effects of biochar and compost applications on water holding capacity and crop yield of rice under evaporation stress: A two-years field study. Paddy Water Environ. 2023, 21, 47–58. [Google Scholar]
  11. Ghorbani, M.; Amirahmadi, E.; Konvalina, P.; Moudrý, J.; Bárta, J.; Kopecký, M.; Teodorescu, R.I.; Bucur, R.D. Comparative influence of biochar and zeolite on soil hydrological indices and growth characteristics of corn (Zea mays L.). Water 2022, 14, 3506. [Google Scholar] [CrossRef]
  12. Alburquerque, J.A.; Salazar, P.; Barrón, V.; Torrent, J.; del Campillo, M.d.C.; Gallardo, A.; Villar, R. Enhanced wheat yield by biochar addition under different mineral fertilization levels. Agron. Sustain. Dev. 2013, 33, 475–484. [Google Scholar] [CrossRef]
  13. Haider, G.; Steffens, D.; Moser, G.; Müller, C.; Kammann, C.I. Biochar reduced nitrate leaching and improved soil moisture content without yield improvements in a four-year field study. Agric. Ecosyst. Environ. 2017, 237, 80–94. [Google Scholar]
  14. Singh, C.; Tiwari, S.; Gupta, V.K.; Singh, J.S. The effect of rice husk biochar on soil nutrient status, microbial biomass and paddy productivity of nutrient poor agriculture soils. Catena 2018, 71, 485–493. [Google Scholar] [CrossRef]
  15. Jones, D.; Rousk, J.; Edwards-Jones, G.; DeLuca, T.; Murphy, D. Biochar-mediated changes in soil quality and plant growth in a three year field trial. Soil Biol. Biochem. 2012, 45, 113–124. [Google Scholar]
  16. Yan, J.; Liu, P. Does complex soil enhance grain yield under cropping system? Agronomy 2021, 11, 1502. [Google Scholar] [CrossRef]
  17. Zadoks, J.C.; Chang, T.T.; Konzak, C.F. A decimal code for the growth stages of cereals. Weed Res. 1974, 14, 415–421. [Google Scholar] [CrossRef]
  18. Yan, J.; Zhang, N.; Kang, F.; Wang, J.; Wang, X. Cultivar replacement increases water use efficiency in foxtail millet in Shaanxi Province, China. Plant Physiol. Biochem. 2021, 164, 73–81. [Google Scholar]
  19. Yao, T.; Zhang, W.; Gulaqa, A.; Cui, Y.; Zhou, Y.; Weng, W.; Wang, X.; Liu, Q.; Jin, F. Effects of peanut shell biochar on soil nutrients, soil enzyme activity, and rice yield in heavily saline-sodic paddy field. J. Soil Sci. Plant Nutr. 2021, 21, 655–664. [Google Scholar] [CrossRef]
  20. Zhang, N.; Huang, S.; Lei, H.; Lei, X.; Liu, P.; Yan, J. Changes in soil quality over time focusing on organic acid content in restoration areas following coal mining. Catena 2022, 218, 106567. [Google Scholar]
  21. Gu, Y.; Wang, P.; Kong, C. Urease, invertase, dehydrogenase and polyphenoloxidase activities in paddy soil influenced by allelopathic rice variety. Eur. J. Soil Biol. 2009, 45, 436–441. [Google Scholar]
  22. Dam, R.; Mehdi, B.; Burgess, M.; Madramootoo, C.; Mehuys, G.; Callum, I. Soil bulk density and crop yield under eleven consecutive years of corn with different tillage and residue practices in a sandy loam soil in central Canada. Soil Tillage Res. 2005, 84, 41–53. [Google Scholar] [CrossRef]
  23. Devau, N.; Le Cadre, E.; Hinsinger, P.; Jaillard, B.; Gérard, F. Soil pH controls the environmental availability of phosphorus: Experimental and mechanistic modelling approaches. Appl. Geochem. 2009, 24, 2163–2174. [Google Scholar] [CrossRef]
  24. Abalos, D.; Recous, S.; Butterbach-Bahl, K.; De Notaris, C.; Rittl, T.F.; Topp, C.F.; Petersen, S.O.; Hansen, S.; Bleken, M.A.; Rees, R.M. A review and meta-analysis of mitigation measures for nitrous oxide emissions from crop residues. Sci. Total Environ. 2022, 828, 154388. [Google Scholar]
  25. Xiu, L.; Zhang, W.; Sun, Y.; Wu, D.; Meng, J.; Chen, W. Effects of biochar and straw returning on the key cultivation limitations of Albic soil and soybean growth over 2 years. Catena 2019, 173, 481–493. [Google Scholar] [CrossRef]
  26. Heinonen, R. Towards “normal” soil bulk density. Soil Sci. Soc. Am. J. 1977, 41, 1214–1215. [Google Scholar]
  27. Li, Y.; Feng, H.; Chen, J.; Lu, J.; Wu, W.; Liu, X.; Li, C.; Siddique, K.H. Biochar incorporation increases winter wheat (Triticum aestivum L.) production with significantly improving soil enzyme activities at jointing stage. Catena 2022, 211, 105979. [Google Scholar]
  28. Ndor, E.; Dauda, S.; Azagaku, E. Response of maize varieties (Zea mays) to biochar amended soil in Lafia, Nigeria. Am. J. Exp. Agric. 2014, 5, 525–531. [Google Scholar]
  29. Dempster, D.N.; Jones, D.L.; Murphy, D.V. Clay and biochar amendments decreased inorganic but not dissolved organic nitrogen leaching in soil. Soil Res. 2012, 50, 216–221. [Google Scholar]
  30. Faloye, O.; Alatise, M.; Ajayi, A.; Ewulo, B. Effects of biochar and inorganic fertiliser applications on growth, yield and water use efficiency of maize under deficit irrigation. Agric. Water Manag. 2019, 217, 165–178. [Google Scholar] [CrossRef]
  31. Kannan, P.; Paramasivan, M.; Marimuthu, S.; Swaminathan, C.; Bose, J. Applying both biochar and phosphobacteria enhances Vigna mungo L. growth and yield in acid soils by increasing soil pH, moisture content, microbial growth and P availability. Agric. Ecosyst. Environ. 2021, 308, 107258. [Google Scholar]
  32. Babalola, T.E.; Adabembe, B.A.; Faloye, O.T. Water use-yield relationship of maize as influenced by biochar and inorganic fertilizer applications in a tropical sandy clay loam soil. Agric. Water Manag. 2022, 271, 107801. [Google Scholar] [CrossRef]
  33. Li, Z.; Wu, P.; Feng, H.; Zhao, X.; Huang, J.; Zhuang, Z. Simulated experiment on effects of soil bulk density on soil water holding capacity. Acta Pedol. Sin. 2010, 47, 611–620. [Google Scholar]
  34. Günal, E.; Erdem, H.; Çelik, İ. Effects of three different biochars amendment on water retention of silty loam and loamy soils. Agric. Water Manag. 2018, 208, 232–244. [Google Scholar] [CrossRef]
  35. Werner, W.; Sanderman, J.; Melillo, J. Decreased soil organic matter in a long-term soil warming experiment lowers soil water holding capacity and affects soil thermal and hydrological buffering. J. Geophys. Res. Biogeosci. 2020, 125, e2019JG005158. [Google Scholar] [CrossRef]
  36. Zhu, Q.; Liu, X.; Hao, T.; Zeng, M.; Shen, J.; Zhang, F.; De Vries, W. Modeling soil acidification in typical Chinese cropping systems. Sci. Total Environ. 2018, 613, 1339–1348. [Google Scholar] [CrossRef]
  37. Houssou, A.A.; Jeyakumar, P.; Niazi, N.K.; Van Zwieten, L.; Li, X.; Huang, L.; Wei, L.; Zheng, X.; Huang, Q.; Huang, Y. Biochar and soil properties limit the phytoavailability of lead and cadmium by Brassica chinensis L. in contaminated soils. Biochar 2022, 4, 5. [Google Scholar] [CrossRef]
  38. Simmons, C.W.; Higgins, B.; Staley, S.; Joh, L.D.; Simmons, B.A.; Singer, S.W.; Stapleton, J.J.; VanderGheynst, J.S. The role of organic matter amendment level on soil heating, organic acid accumulation, and development of bacterial communities in solarized soil. Appl. Soil Ecol. 2016, 106, 37–46. [Google Scholar] [CrossRef]
  39. Pan, F.; Zhang, W.; Liang, Y.; Wang, K.; Jin, Z. Seasonal changes of soil organic acid concentrations in relation to available N and P at different stages of vegetation restoration in a karst ecosystem. Chin. J. Ecol. 2020, 39, 1112. [Google Scholar]
  40. Clarholm, M.; Skyllberg, U.; Rosling, A. Organic acid induced release of nutrients from metal-stabilized soil organic matter—The unbutton model. Soil Biol. Biochem. 2015, 84, 168–176. [Google Scholar] [CrossRef]
  41. Nuss, R.F.; Loewus, F.A. Further studies on oxalic acid biosynthesis in oxalate-accumulating plants. Plant Physiol. 1978, 61, 590–592. [Google Scholar] [CrossRef] [PubMed]
  42. Ma, X.; Liu, Z.; Liu, Z.; Xie, G.; Rookes, J.; An, F. Root secretion of oxalic and malic acids mitigates the rubber tree aluminum toxicity. J. Rubber Res. 2021, 24, 381–390. [Google Scholar] [CrossRef]
  43. Kulmatiski, A.; Beard, K.H.; Stevens, J.R.; Cobbold, S.M. Plant–soil feedbacks: A meta-analytical review. Ecol. Lett. 2008, 11, 980–992. [Google Scholar] [CrossRef] [PubMed]
  44. Ahmed, M.B.; Zhou, J.L.; Ngo, H.H.; Guo, W. Insight into biochar properties and its cost analysis. Biomass Bioenergy 2016, 84, 76–86. [Google Scholar] [CrossRef]
  45. Dari, B.; Nair, V.D.; Harris, W.G.; Nair, P.; Sollenberger, L.; Mylavarapu, R. Relative influence of soil- vs. biochar properties on soil phosphorus retention. Geoderma 2016, 280, 82–87. [Google Scholar] [CrossRef]
  46. Yang, W.; Qu, Z.Y.; Zhang, R.X.; Yang, Y.X.; Jia, Y.L.; Gao, X.Y.; Gao, L.H. Effects of Drip-irrigation Schedule Under Film-mulching and Biochar Amount on Corn Growth and Water-Nitrogen Use Efficiency. J. Soil Water Conserv. 2023, 37, 313–322. [Google Scholar]
  47. Geng, M.; Guan, S.; Meng, W.; Wang, X. Effects of straw returning and biochar application on soil organic matter and mitigate soil acidification of black soil. J. Jilin Agric. Univ. 2023, 45, 178–187. [Google Scholar]
  48. Acosta-Martinez, V.; Cano, A.; Johnson, J. Simultaneous determination of multiple soil enzyme activities for soil health-biogeochemical indices. Appl. Soil Ecol. 2018, 126, 121–128. [Google Scholar] [CrossRef]
  49. Li, Y.; Yang, Y.; Sun, Y.; Jiao, Y.; Wang, Y.; Chen, H.; Wu, Q.; Chi, D. Using nitrogen-loaded biochar for soil improvement to decrease applied nitrogen and stabilize rice yield under alternate wet-dry irrigation. Soil Tillage Res. 2022, 223, 105493. [Google Scholar] [CrossRef]
  50. Gömöryová, E.; Střelcová, K.; Škvarenina, J.; Gömöry, D. Responses of soil microorganisms and water content in forest floor horizons to environmental factors. Eur. J. Soil Biol. 2013, 55, 71–76. [Google Scholar] [CrossRef]
  51. Ogunkunle, C.O.; Falade, F.O.; Oyedeji, B.J.; Akande, F.O.; Vishwakarma, V.; Alagarsamy, K.; Ramachandran, D.; Fatoba, P.O. Short-term aging of pod-derived biochar reduces soil cadmium mobility and ameliorates cadmium toxicity to soil enzymes and tomato. Environ. Toxicol. Chem. 2021, 40, 3306–3316. [Google Scholar] [CrossRef] [PubMed]
  52. Han, S.; Li, H.; Rengel, Z.; Du, Z.; Hu, N.; Wang, Y.; Zhang, A. Biochar application promotes crops yield through regulating root development and the community structure of root endophytic fungi in wheat-maize rotation. Soil Tillage Res. 2023, 234, 105827. [Google Scholar] [CrossRef]
  53. Li, P.; Brutnell, T.P. Setaria viridis and Setaria italica, model genetic systems for the Panicoid grasses. J. Exp. Bot. 2011, 62, 3031–3037. [Google Scholar] [CrossRef] [PubMed]
Figure 1. Monthly and long-term averages of precipitation and temperature at the experimental site.
Agronomy 14 02465 g001
Figure 2. Effect of biochar application on soil bulk density (A), pH (B), and soil water content (C). ** indicates significant differences between year (Y), treatment (T), and interaction between year and treatment (Y × T) at p < 0.01. “ns” showed there was no significance. Data are shown as mean ± SD. Different letters indicate significant differences in the same year (p < 0.05).
Agronomy 14 02465 g002
Figure 3. Effect of biochar application on soil organic matter (A), total phosphorus (B), total nitrogen (C), available phosphorus (D) and available nitrogen (E). The legend of the histogram is shown in figure (F). * and ** indicate significant differences between year (Y), treatment (T), and interaction between year and treatment (Y × T) at p < 0.05 and p < 0.01, respectively. “ns” showed there was no significance. Data are shown as mean ± SD. Different letters indicate significant differences in the same year (p < 0.05).
Agronomy 14 02465 g003
Figure 4. Effect of biochar application on soil catalase (A), urease (B), and sucrase (C). * and ** indicate significant differences between year (Y), treatment (T), and interaction between year and treatment (Y × T) at p < 0.05 and p < 0.01, respectively. “ns” showed there was no significance. Data are shown as mean ± SD. Different letters indicate significant differences in the same year (p < 0.05).
Agronomy 14 02465 g004
Figure 5. Effect of biochar application on soil oxalic acid (A), acetic acid (B), and citric acid (C). ** indicates significant differences between year (Y), treatment (T), and interaction between year and treatment (Y × T) at p < 0.01, respectively. “ns” showed there was no significance. Data are shown as mean ± SD. Different letters indicate significant differences in the same year (p < 0.05).
Agronomy 14 02465 g005
Figure 6. A possible mechanism underlying the function of biochar in improving soil quality, plant growth, and grain yield. Biochar improved soil physical properties by decreasing soil bulk density, and due to its sorption, it could increase soil water content (SWC) and minerals in terms of increasing available nitrogen and phosphorus (AN and AP). On the other side, biochar could interact with root by stimulating the secretion of organic acids (oxalic and acetic acid), which might function in improving soil pH. In addition, biochar increased soil organic matter, which could play important roles in improving soil enzymatic activity.
Agronomy 14 02465 g006
Table 1. Primary physical properties of sandy and loess soil at the study site.
Material Soil TypeSand (%)Silt (%)Clay (%)pHBD (g/cm3)TN (‰)TP (‰)Organic Matter (%)
Aeolian
sandy soil
Sandy soil94.54.41.1\1.720.070.230.15
LoessLoessial soil8.869.122.1\1.620.120.320.25
Biochar\\\\8.550.35144.650.6
(Total C content)
Percentage of clay (<0.002 mm), silt (0.002–0.05 mm), and sand (0.05–2 mm) particles; BD, bulk density; TN, total nitrogen; TP, total phosphorus.
Table 2. Effect of biochar application on grain yield. *** indicates significant differences between year (Y), treatment (T), and interaction between year and treatment (Y × T) at p < 0.001, respectively. NS showed there was no significance. Data are shown as mean ± SD. Different letters indicate significant differences in the same year (p < 0.05).
Treatment2021 (kg ha−1)2022 (kg ha−1)
CK3410 ± 246 b3092 ± 175 c
B13827 ± 148 ab3931 ± 289 b
B24093 ± 458 a4246 ± 606 ab
B34250 ± 109 a4753 ± 433 a
YNS
T***
Y × TNS
Table 3. Pearson correlation coefficients of the pH, total nitrogen (TN), total phosphorus (TP), available nitrogen (AN), available phosphorus (AP), soil organic matter (SOM), acetic acid (AA), oxalic acid (OA), grain yield (GY), citric acid (CA), soil bulk density (SBD), catalase (Cat), urease (Ur), and sucrase (Su).
GYOAAACASBDpHCatUrSuANAPSOMTPTN
OA0.824 **
AA0.641 **0.752 **
CA0.553 **0.691 **0.947 **
SBD−0.612 **−0.742 **−0.706 **−0.664 **
pH−0.640 **−0.470 *−0.040.0340.263
Cat0.639 **0.856 **0.812 **0.725 **−0.741 **−0.232
Ur0.476 *0.691 **0.756 **0.661 **−0.593 **−0.040.820 **
Su0.519 **0.551 **0.062−0.003−0.216−0.727 **0.3630.065
AN0.712 **0.847 **0.869 **0.802 **−0.738 **−0.1740.852 **0.712 **0.324
AP0.679 **0.729 **0.2890.217−0.467 *−0.619 **0.551 **0.2410.777 **0.542 **
SOM0.699 **0.811 **0.628 **0.528 **−0.589 **−0.3270.786 **0.553 **0.427 *0.678 **0.686 **
TP0.633 **0.769 **0.678 **0.621 **−0.799 **−0.2450.788 **0.542 **0.456 *0.805 **0.647 **0.689 **
TN0.643 **0.811 **0.736 **0.639 **−0.600 **−0.1720.801 **0.617 **0.4020.760 **0.576 **0.884 **0.753 **
SWC0.617 **0.776 **0.900 **0.888 **−0.687 **−0.0010.811 **0.785 **0.0760.865 **0.3810.688 **0.753 **0.711 **
* and ** indicate that correlation is significant at the 0.05 and 0.01 levels, respectively.
Disclaimer/Publisher’s Note: The statements, opinions and data contained in all publications are solely those of the individual author(s) and contributor(s) and not of MDPI and/or the editor(s). MDPI and/or the editor(s) disclaim responsibility for any injury to people or property resulting from any ideas, methods, instructions or products referred to in the content.

