Article

Optimal Water and Nitrogen Regimes Increased Fruit Yield and Water Use Efficiency by Improving Root Characteristics of Drip-Fertigated Greenhouse Tomato (Solanum lycopersicum L.)

Key Laboratory of Agricultural Soil and Water Engineering in Arid and Semiarid Areas of the Ministry of Education, Northwest A&F University, Yangling 712100, China
*
Author to whom correspondence should be addressed.
Agronomy 2024, 14(10), 2439; https://doi.org/10.3390/agronomy14102439
Submission received: 12 September 2024 / Revised: 16 October 2024 / Accepted: 19 October 2024 / Published: 21 October 2024

Abstract

:
The growth of root system directly affects the absorption and utilization of soil water and nitrogen, and understanding the responses of root characteristics to water and nitrogen regimes is thus crucial for optimizing water and nitrogen management. The root characteristics of each soil layer, i.e., root length, root surface area, and root volume, as well as fruit yield and water use efficiency of greenhouse tomato under drip fertigation in response to different irrigation levels and nitrogen rates were explored in northwest China. There were four irrigation levels, i.e., 50% ETC (W1), 75% ETC (W2), 100% ETC (W3), and 125% ETC (W4), where ETC is the crop evapotranspiration, and four nitrogen rates, i.e., 0 kg ha−1 (N1), 150 kg ha−1 (N2), 250 kg ha−1 (N3), and 350 kg ha−1 (N4). The results showed that reasonable irrigation and nitrogen regimes (W3N3) significantly increased fruit yield by 31.64% and root length, root surface area, and root volume by 45.03%, 61.24%, and 148.21% compare to W3N1, respectively. The promoting effect of increasing irrigation level on root characteristics increased with soil depth and had the greatest increases in root volume by 27.07%, 123.43%, and 211.47% for the 0–10, 10–20, and 20–30 cm soil layers, respectively. In addition, reducing irrigation level significantly increased the percentages of roots in the top soil by 29.71%, 26.77%, and 18.53% for root length, root surface area, and root volume, respectively. The reasonable nitrogen rate (N3) significantly increased fruit yield by 41.11%, water use efficiency by 34.42%, and root length, root surface area, and root volume by 40.42%, 41.44%, and 112.76%, respectively. The over-application of nitrogen (N4) reduced root characteristics of all soil layers, fruit yield, and water use efficiency. The promoting effect of increasing nitrogen rate on root length of each soil layer decreased with soil depth, by 71.01%, 48.96%, and 15.71% for 0–10, 10–20, and 20–30 cm soil layers, respectively. Irrigation level was the main factor dominating the root growth of each soil layer. The correlation analysis showed that fruit yield had significantly positive correlations with root characteristics in all soil layers, while water use efficiency had significantly positive correlations with the percentages of root length and root surface area in the 0–10 cm soil layer. In conclusion, rational water and nitrogen regimes achieved better fruit yield by promoting root growth of greenhouse tomato, and the water use efficiency of greenhouse tomato was improved by increasing the root percentage in the topsoil layer to alleviate the adverse effects under water stress conditions. This study reveals how irrigation volume and nitrogen application can enhance tomato yield and water use efficiency by regulating root characteristics and vertical root distribution, providing support for understanding the response of root systems to changes in soil water and nitrogen conditions.

1. Introduction

Tomato (Solanum lycopersicum L.) is a nutritious fruit that protects against cardiovascular diseases, and it is one of the world’s most popular foods and widely grown vegetables [1,2]. In northwest China, tomatoes have become the dominant fruit produced in such facilities, where there is an abundance of light and warmth and a thriving solar greenhouse sector [3]. Freshwater is an essential element of food production, and the amount of freshwater directly determines human food production capacity. Agricultural production accounts for more than 70% of freshwater resources uses under current estimates. However, it is tough to satisfy the escalating demand for agricultural water, especially in arid and semiarid areas regions [4]. Greenhouse vegetable production systems are different from general food production systems, where they are often characterized by high nitrogen application rate, frequent irrigation, and high replanting index [5]. The only way to provide water to crops in greenhouse production systems is irrigation [6].
Unfortunately, long-term large-scale nitrogen application, which is a waste of nitrogen resources, also brings about environmental problems like soil acidification, groundwater pollution, and greenhouse gas emissions [7]. A proper irrigation schedule can transport water and fertilizer to the plant root activity area in a timely and adequate manner to improve WUE while achieving a balance between fruit yield and quality [8,9]. Numerous studies have demonstrated that mild water deficit can effectively enhance WUE without significantly compromising yield, but extreme drought stress will result in a reduction of yield and even WUE [10,11,12]. Increasing nitrogen application can effectively improve yield and WUE [13,14], but high nitrogen application may shift the balance between plant nutrient growth and reproductive growth towards excessive nutrient development, which delays plant maturation and thus reduces crop yield [15]. Therefore, optimizing water and nitrogen regimes is crucial for the sustainable development of greenhouse tomato.
The root system serves as a sensor for soil moisture and nutrient status, which is vital for plant growth and fruit production. The roots absorb water and nutrients through diffusion and mass flow. Given the inherent connection between water and nitrogen, a scientific approach to water and nitrogen management is essential for regulating the uptake and distribution of nutrients in plants. Elevated soil moisture can foster root growth, increasing the contact area with the soil and thus promoting nutrient absorption [14,16,17]. Conversely, water scarcity can diminish root characteristics but also prompts plants to allocate more photosynthates to the roots, steering them to seek water in deeper soil strata and adjusting root morphology by reducing lateral roots [6,16]. Yang’s research [18] indicates that augmenting nitrogen fertilizer application can significantly boost root traits, which in turn facilitates better water uptake and enhances the plant’s water use efficiency. Conversely, an overabundance of nitrogen can hinder root development, diminishing the roots’ ability to absorb water and nutrients and potentially leading to reduced crop yields. The vertical distribution of roots exhibits notable adaptability to variations in soil moisture and nutrient availability. Ma’s [19] findings reveal that augmented nitrogen fertilization significantly boosts the root presence in the topsoil, but Wang’s [10] study shows that increased nitrogen application substantially raises the root proportion in deeper soil layers. Research indicates that water deficiency predominantly stimulates the development of roots in deeper soil [20,21], while Merrill [22] posits that water scarcity leads to the emergence of more lateral roots in the topsoil, augmenting root characteristics there. Zhang’s [21] research uncovers a highly significant correlation between root traits in deeper soil and the water consumption of crops. Furthermore, in response to drought conditions, the root system synthesizes abscisic acid (ABA), a key hormone that triggers the closure of stomata. This physiological response effectively decreases the rate of transpiration and optimizes the plant’s water use efficiency. Therefore, it is crucial to study the response of tomato roots under different water and nitrogen regimes to realize high WUE and yield of tomato.
There have been many studies on the variations of greenhouse tomato yield and WUE under different water and nitrogen regimes. However, there are relatively few studies on the variations of root characteristics, especially in various soil layers, in response to different irrigation levels and nitrogen rates. The relationships between root characteristics, fruit yield, and WUE remains unclear. We hypothesize that there is a certain relationship between tomato yield, water use efficiency, and root characteristics and distribution. Accordingly, the aim of this study was to (1) evaluate the effects of different water and nitrogen regimes on root characteristics, fruit yield, and WUE, and (2) investigate the relationships between root distribution across various soil strata, fruit yield, and WUE.

2. Materials and Methods

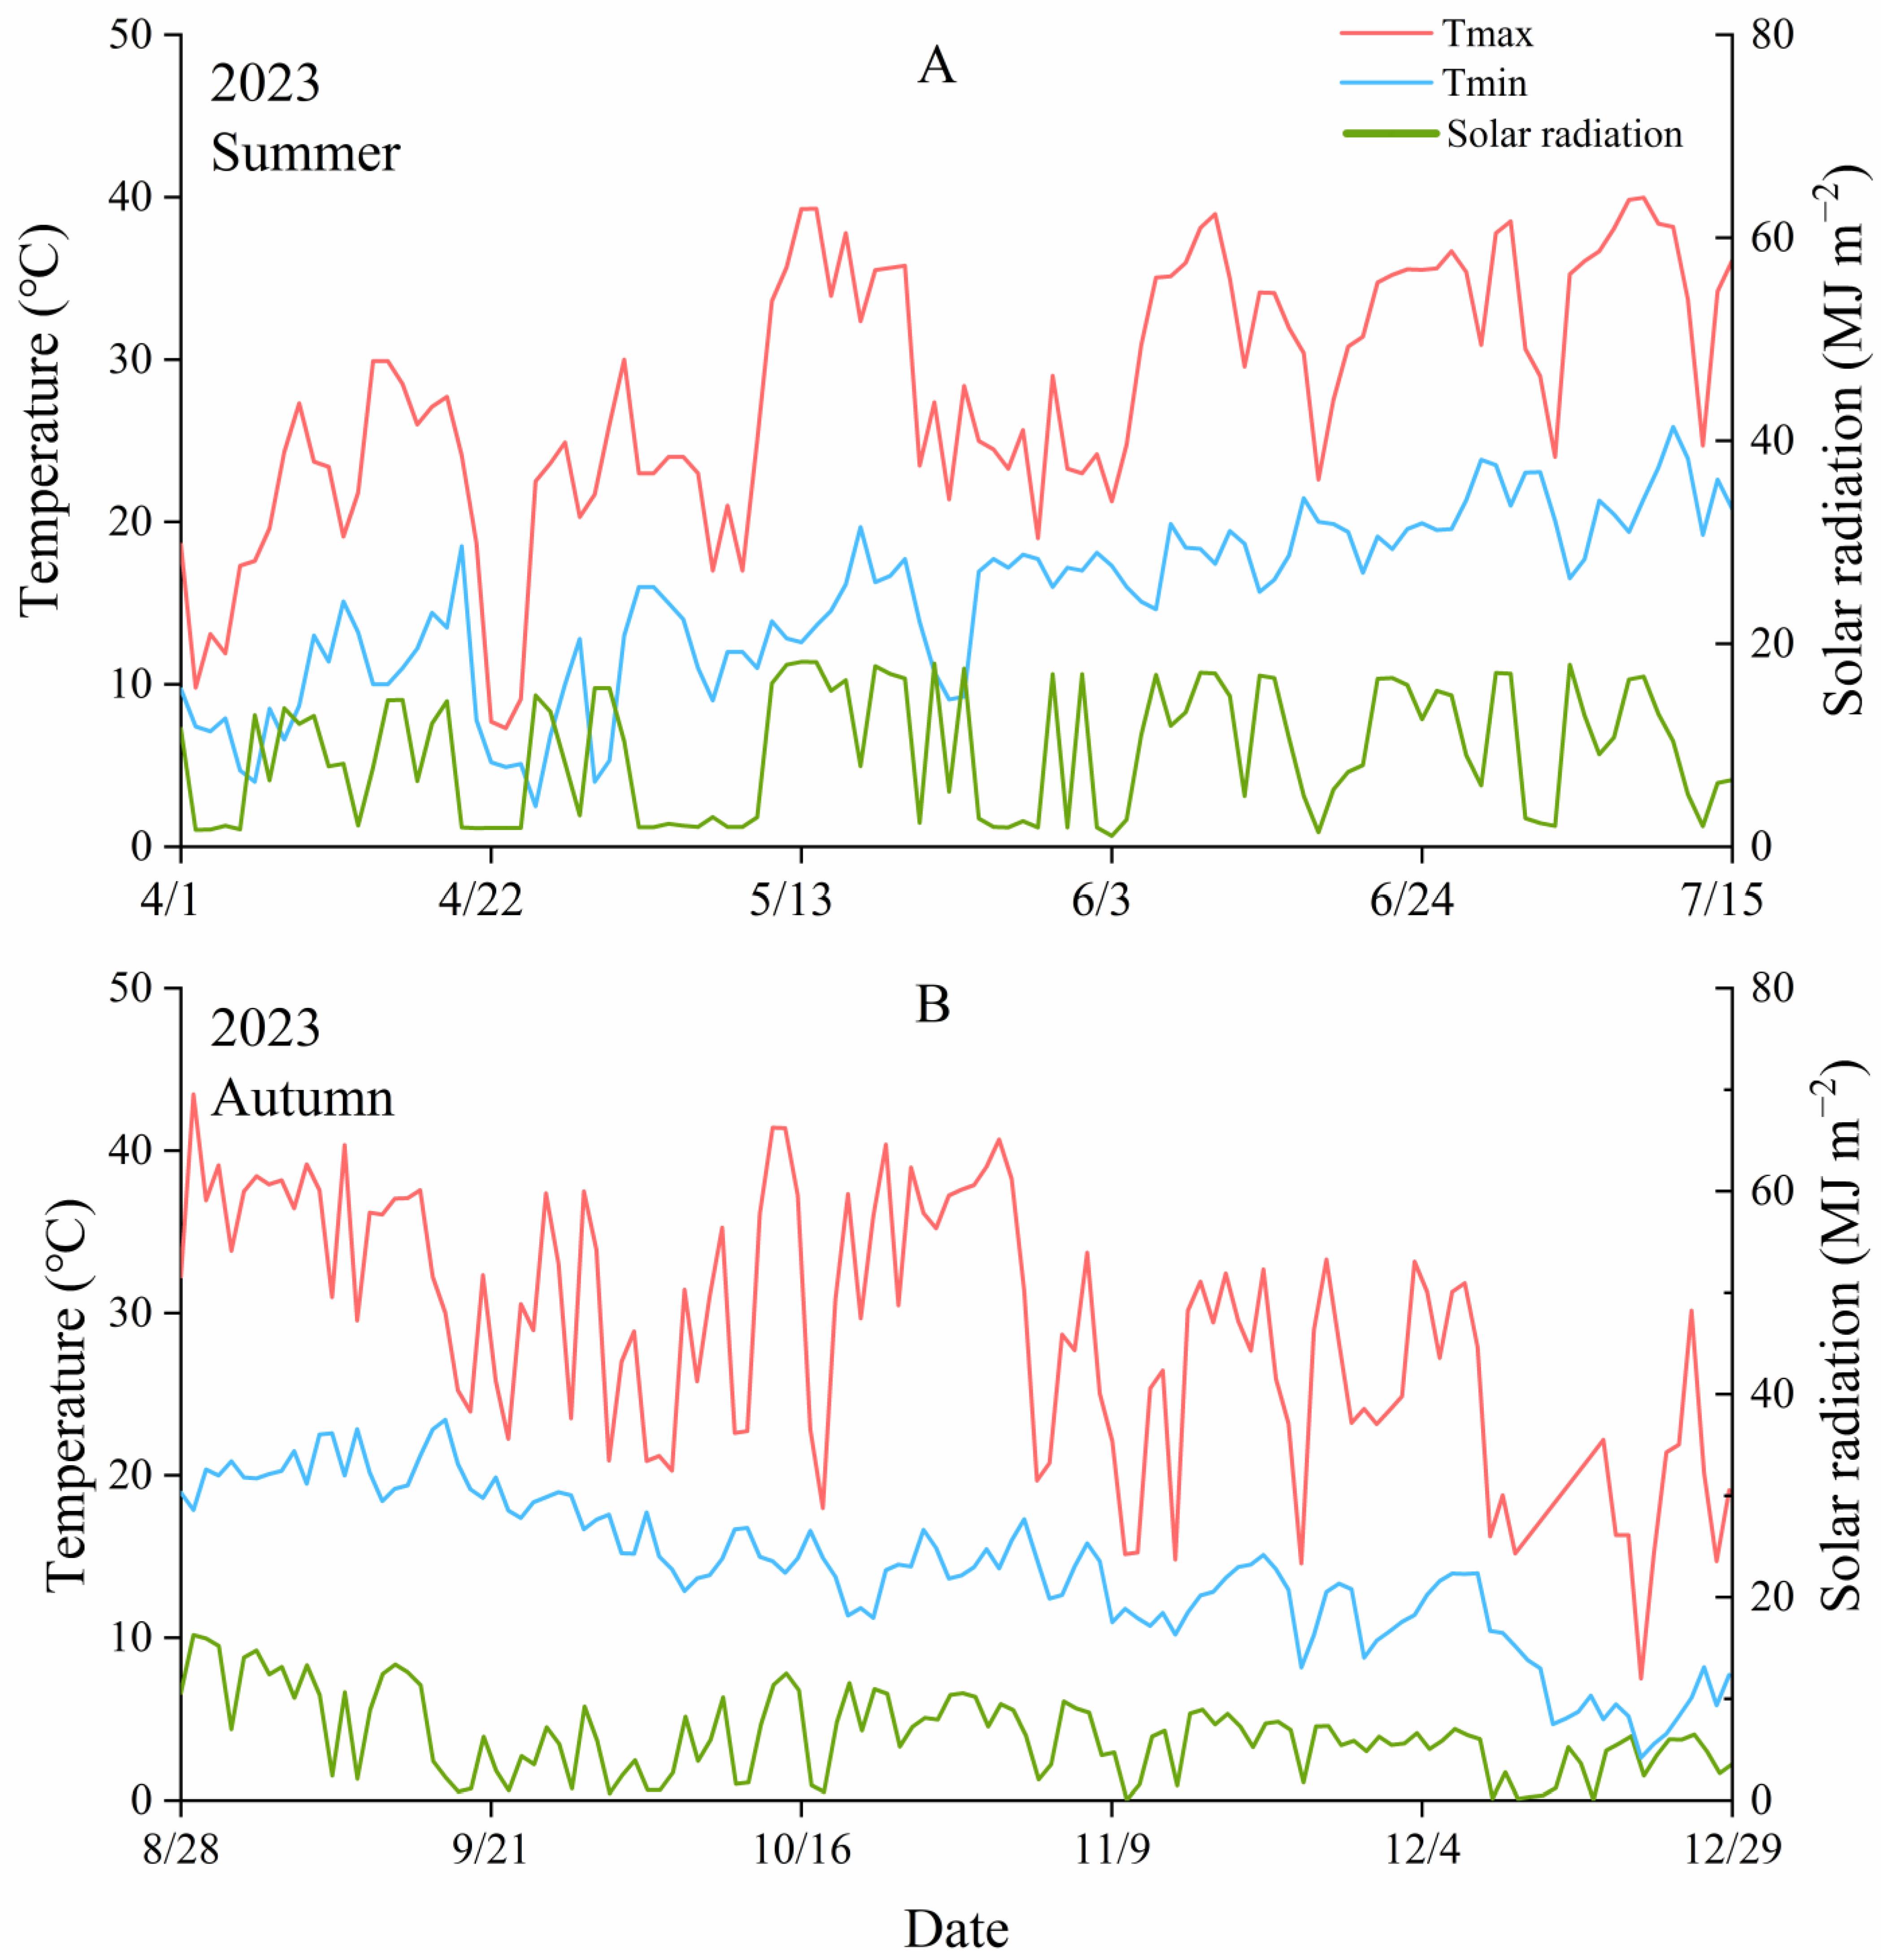
2.1. Description of Experimental Plots

Greenhouse experiments were undertaken from 1 April 2023 to 15 July 2023 (summer 2023) and from 25 August 2023 to 30 December 2023 (autumn 2023) at the Key Laboratory of Agricultural Soil and Water Engineering in Arid Zones (latitude 34°20′ N longitude 108°24′ E; elevation 521 m), Northwest A&F University. The mean yearly temperature is 13.6 °C, with a total yearly precipitation of about 590 mm and a pan evapotranspiration rate of 1500 mm. The soil type is clay loam, characterized by bulk density of 1.43 g/cm3, electrical conductivity of 0.32 ms cm−1, field holding capacity of 24.0% by weight, and pH level of 8.04. The soil contains available nutrients, including 33.19 mg/kg of nitrogen, 23.47 mg/kg of phosphorus, and 88.76 mg/kg of potassium. The greenhouse spans an area of 562.5 square meters, with a length of 75 m running east to west and a width of 7.5 m from north to south. The tomato plants are cultivated in rows aligned with the north-south axis.

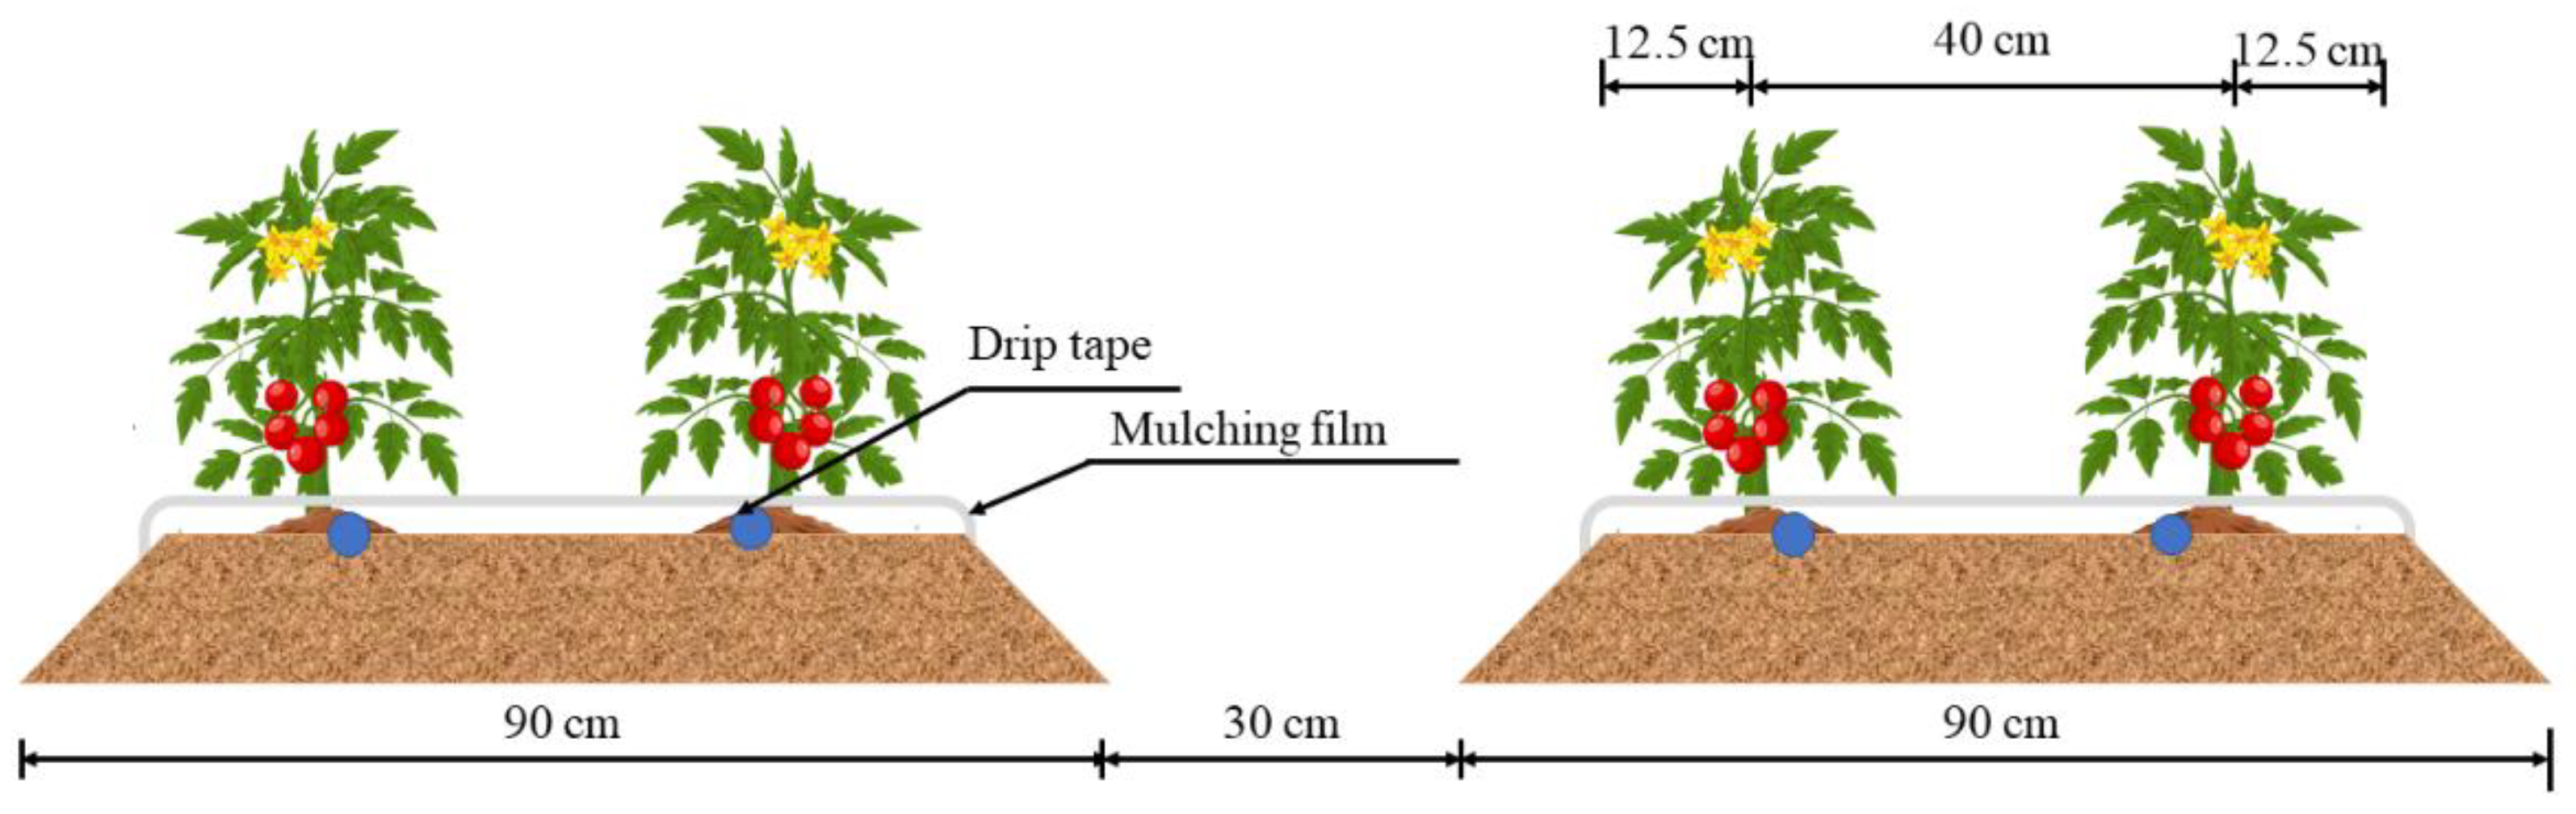
2.2. Experimental Design and Crop Management

The experiment in this study employs a randomized block split-plot design, with the main factor being irrigation amount (50% ETC (W1), 75% ETC (W2), 100% ETC (W3), 125% ETC (W4)) and the subplot factor being nitrogen application rate (0 kg ha−1 (N1), 150 kg ha−1 (N2), 250 kg ha−1 (N3), 350 kg ha−1 (N4)), totaling 16 combinations, replicated 3 times. Our experimental design table is shown in Table 1.
Crop evapotranspiration (ETC) is calculated in the following manner:
E T c = K c × E T 0
where K c is the crop coefficient determined from FAO-56, as 0.5 at seedling stage, 0.5 at flowering and fruiting stage, 1.1 at fruiting stage, and 0.8 at maturity stage; E T 0 is the reference evapotranspiration, which calculated by the Penman–Monteith model based on meteorological data (Figure 1).
Irrigation was conducted every seven days during two growing seasons. Nitrogen fertilizer uses urea with N ≥ 46% (mass fraction), phosphorus fertilizer uses superphosphate with P ≥ 16% (mass fraction), and potassium fertilizer uses potassium sulfate with K ≥ 46% (mass fraction). Phosphorus and potash fertilizers were basally applied at a rate of 120 kg ha−1. The amount of nitrogen fertilizer was based on experimental design at a ratio of 1 (seedling): 1 (flowering): 2 (first fruits expending): 2 (second fruit expending): 2 (ripening). Fertilizer and irrigation water are supplied to the crops through an automatic irrigation system.
The tomato variety was “Jingpeng 101”, which was transplanted from a local nursery. Each plot, measuring 0.9 m in width by 6.8 m in length, was separated by a 0.3 m wide buffer. Tomato seedlings were transplanted into these plots on 31 March 2023 and 25 August 2023 and were subsequently uprooted on 20 July 2023 (summer 2023) and 30 December 2023 (fall 2023), respectively. Each plot was cultivated with two rows of tomatoes, with drip irrigation tubes placed near the root zone. Both the row spacing and the plant spacing were set at 0.4 m. The drip irrigation tubes had drip emitters spaced 0.3 m apart, with a diameter of 16 mm and a flow rate of 2 L ha−1 (Figure 2). A plot contains 28 tomato plants with a planting density of 48,611 plants per hectare.

2.3. Sampling and Measurement

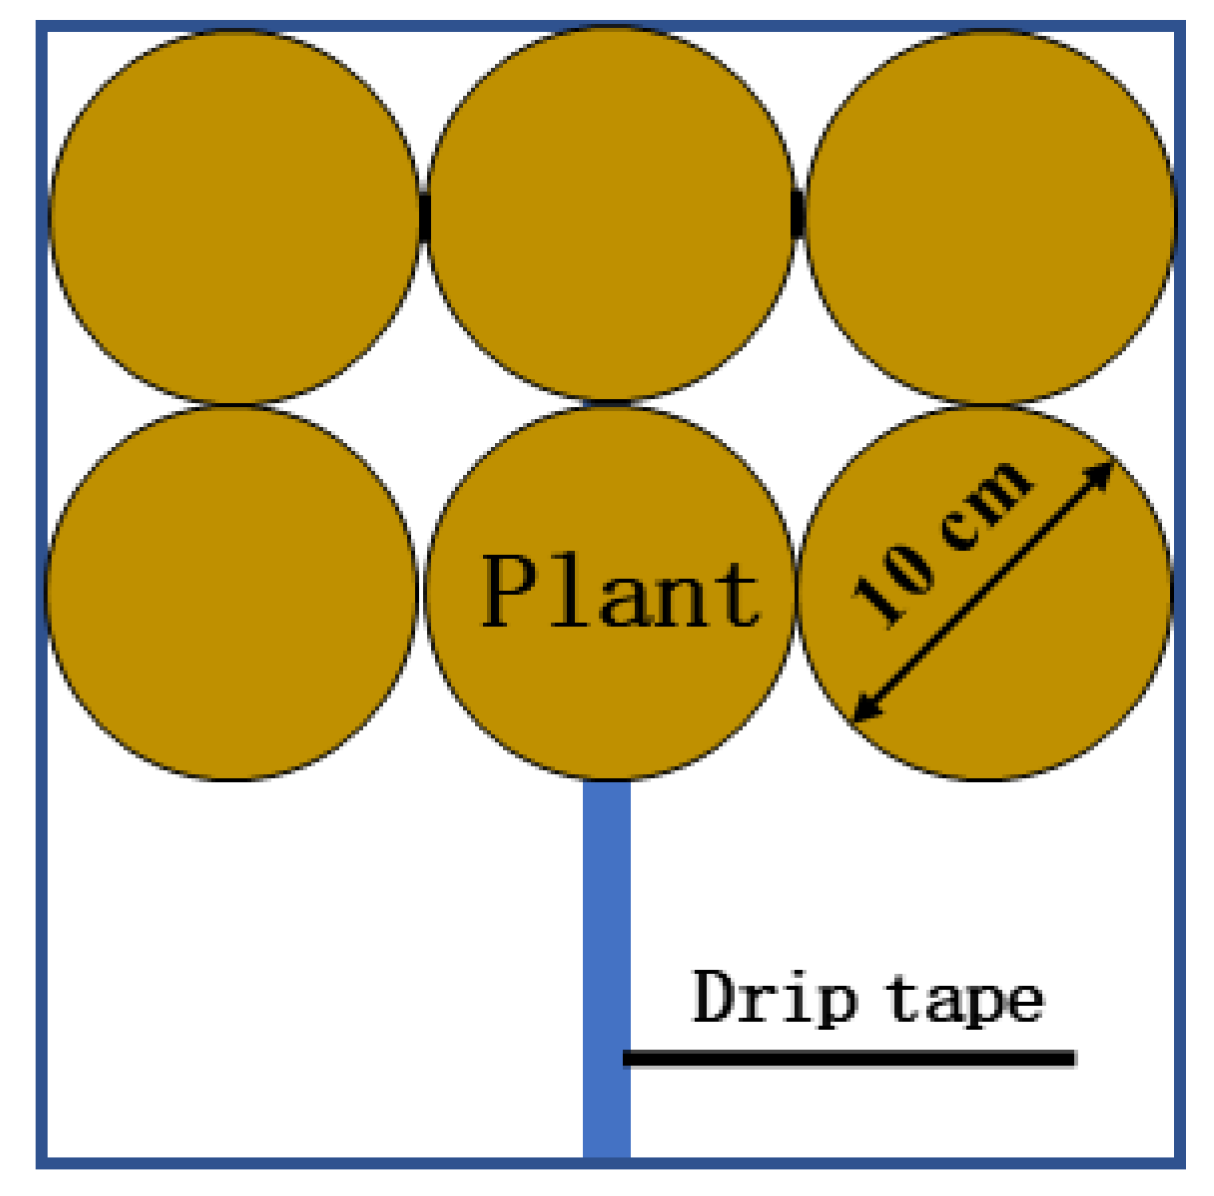
2.3.1. Root Characteristics

Root sampling was carried out at the maturity stage by using a 10 cm diameter root auger at depths of top (0–10 cm), middle (10–20 cm), and bottom (20–30 cm) (Figure 3). The roots were picked out from the soil samples, cleaned with water, and scanned into JPG images with a scanner (Epson Perfection V700 photo) for analysis by image analysis software (Win RHIZO Pro 2017a). RL, RS, RV, and other morphological parameters of the root system were obtained.

2.3.2. Fruit Yield (GY)

From each treatment (a total of 84 tomato plants), 15 tomato plants were randomly selected for assessing tomato yield. Mature fruits were harvested every five days during the ripening period, and the weight of each fruit was measured to obtain the total yield of the fifteen plants. Subsequently, the total yield was converted to fruit yield (t/ha) based on the planting density.

2.3.3. Water Use Efficiency

Evapotranspiration (ET) was determined using the soil moisture balance method [23].
E T = U + P + I D R S W 2 S W 1
where ET is crop water consumption (mm); U is groundwater recharge (mm); P is precipitation (mm); I is irrigation (mm); D is deep seepage (mm); R is surface runoff (mm); SW1 and SW2 represent the soil moisture content at a depth of 0–60 cm at the beginning and end of the entire growth period. Considering the profound groundwater table (over 40 m deep), level landscape, lack of precipitation inside the greenhouse, and the superficial penetration depth of water under drip irrigation, terms P, U, R, and D were omitted, reducing the equation to: E T = I S W S 2 S W S 1 .

2.3.4. Statistical Analysis

In this experiment, Duncan’s multiple range tests at 5% probability level for comparisons of treatment means, and tests for homogeneity of variances and normality of residuals were conducted using SPSS 18.0 software package (SPSS Inc., Chicago, IL, USA) before data analysis. The statistical analysis using a factorial design was employed to determine whether different water and nitrogen conditions have a significant impact on various indicators of tomatoes. The main factors considered include irrigation amount (W), nitrogen application amount (N), and the interaction between water and nitrogen (W × N), with p < 0.05 considered significant and p < 0.01 considered highly significant. We have explored the correlations between indicators using Pearson’s correlation coefficient, with each indicator having 48 samples. We used Origin 2022 (Northampton, MA, USA) for the calculation of the correlation coefficients and for plotting.

3. Results

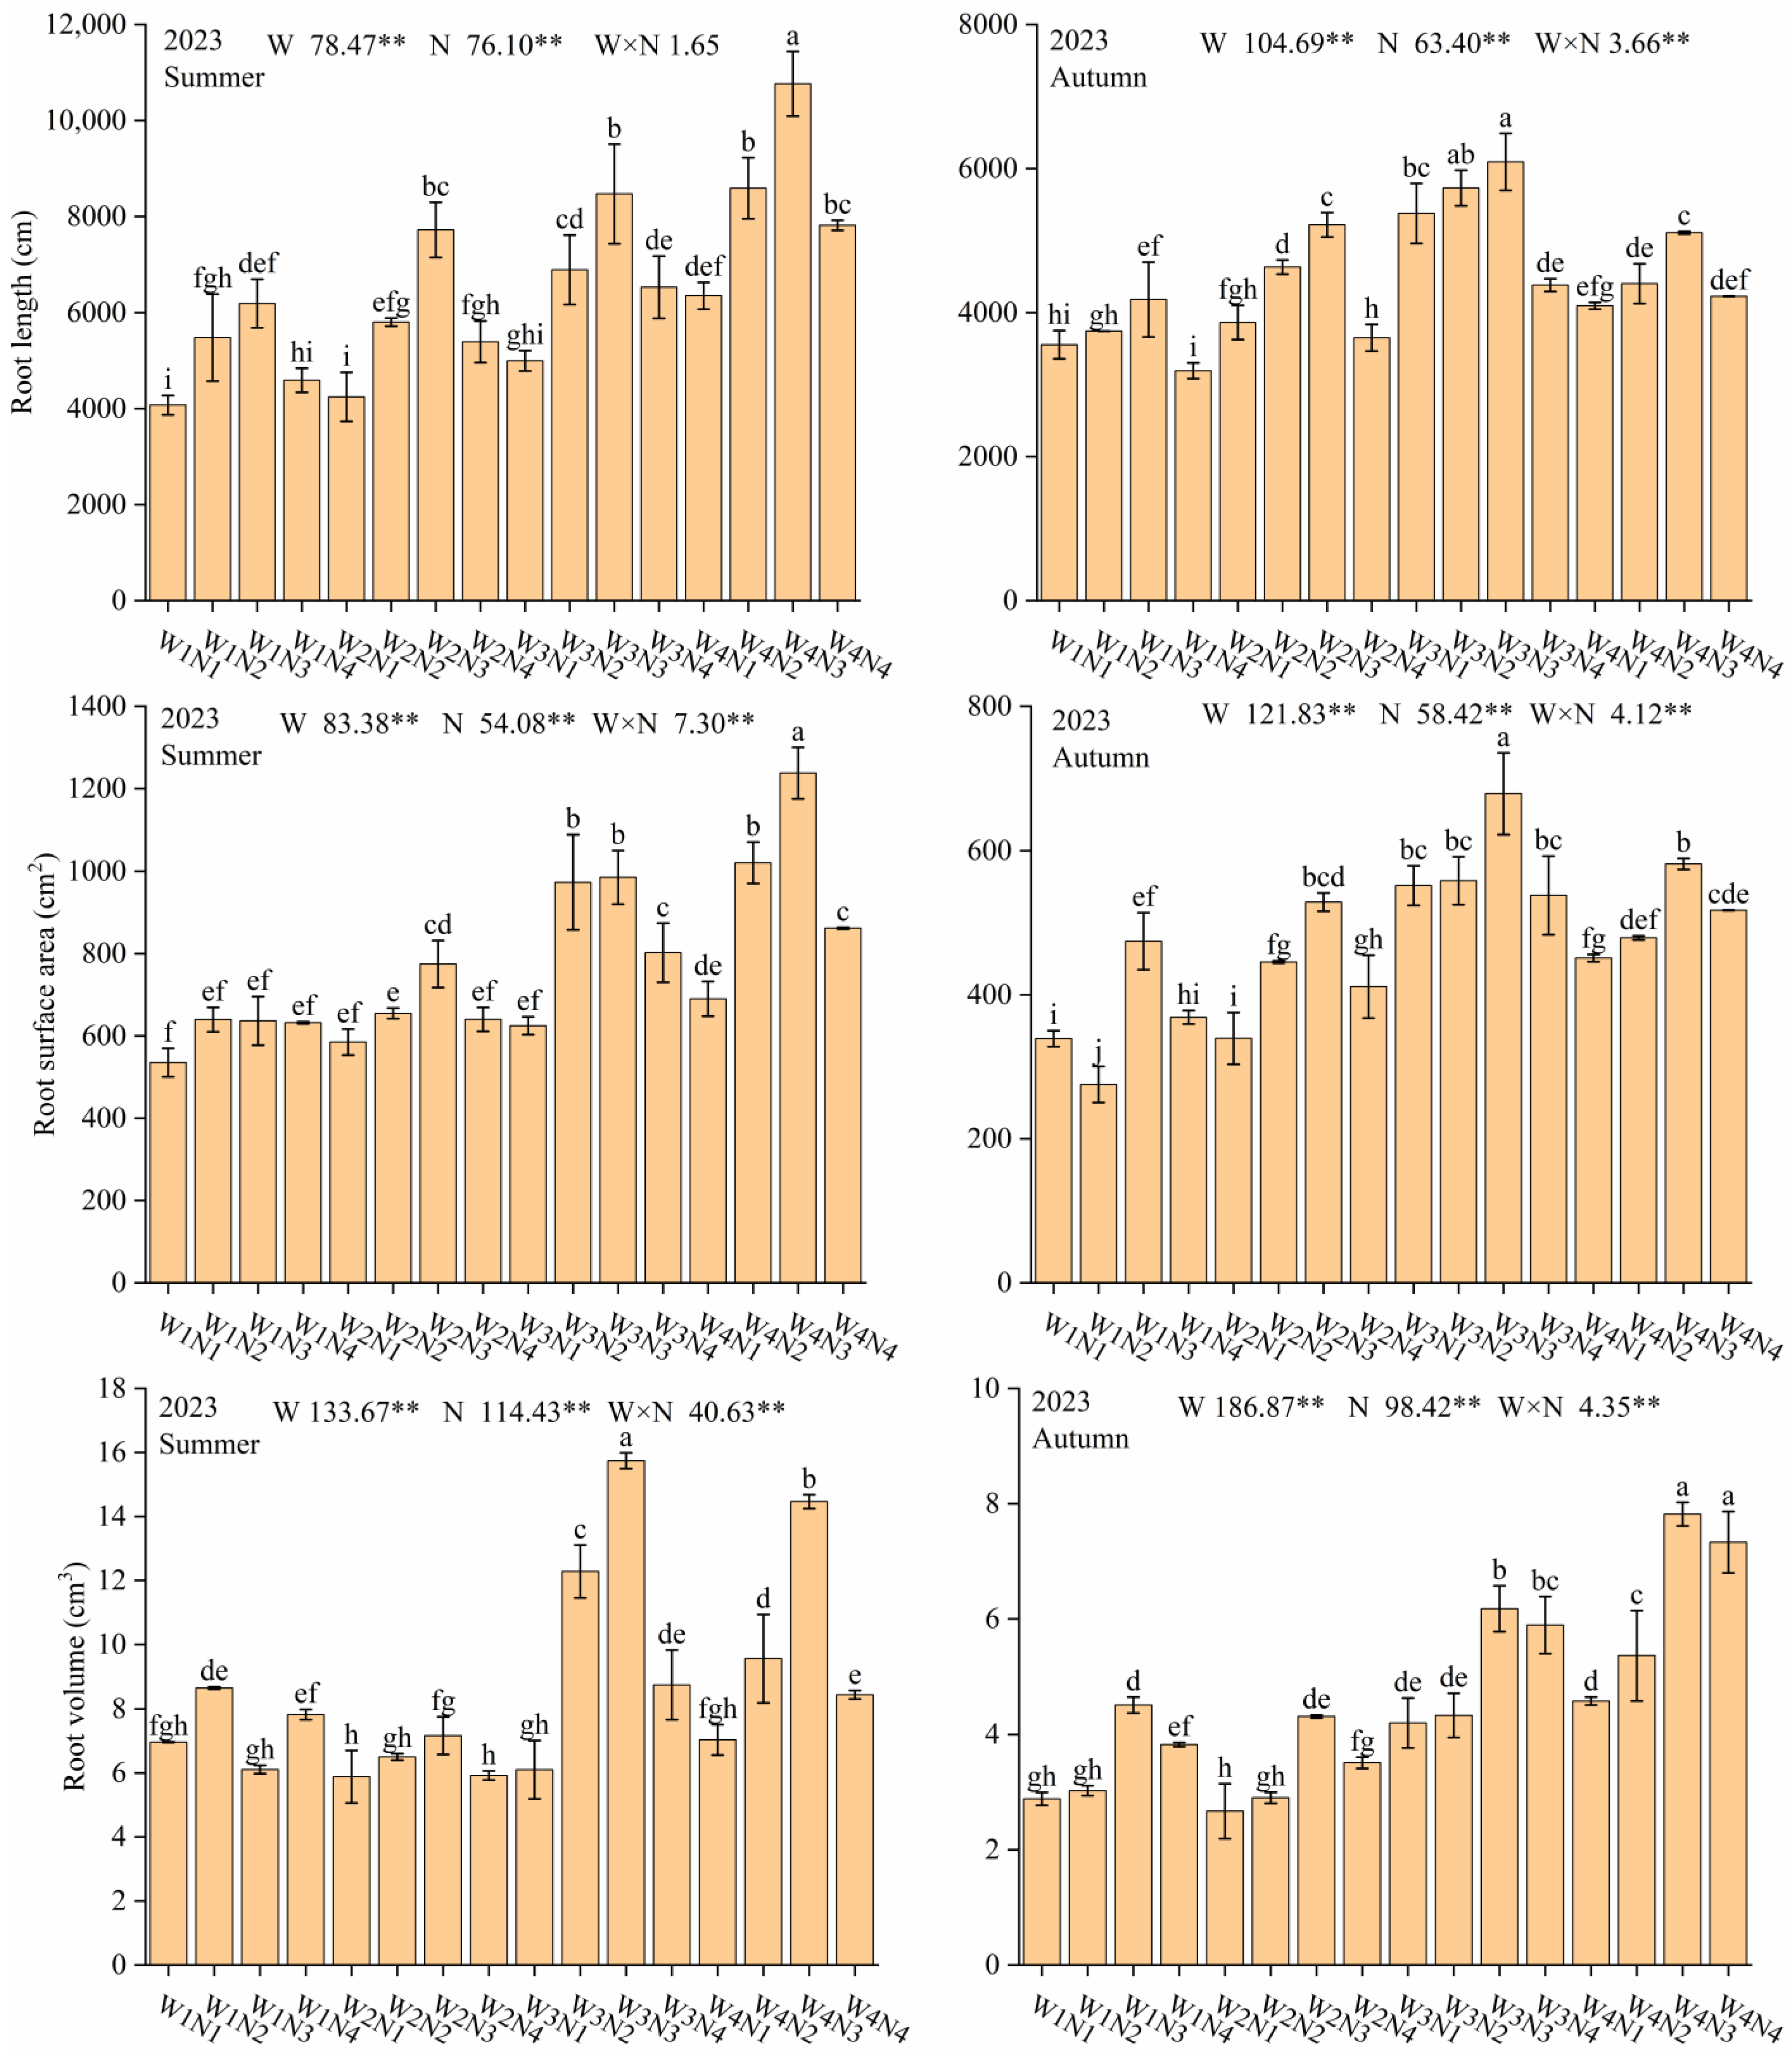
3.1. Total Root Characteristics

Irrigation levels and nitrogen fertilizer applications have a highly significant impact on root length (RL), root surface area (RS), and root volume (RV). The interaction between irrigation levels and nitrogen fertilizer rates (W × N) exerts a highly significant effect on RV and RL.
Within the same nitrogen application rate, an increase in irrigation levels (W1–W3) significantly enhances RL, RS, and RV. Compared to the W3 treatment, the W4 treatment shows an increase in RL and RS during the summer growing period but a decrease in RL and RS during the autumn growing period. Compared to W1N3, W3N3 treatment increases RL, RS, and RV by 40.46%, 49.80%, and 106.39%, respectively. In contrast to W3N3, W4N3 treatment increases RL and RS by 27.07% and 25.63% during the summer growing period but decreases them by 16.13% and 14.30% during the autumn growing period, respectively. Within the same irrigation level, increasing nitrogen application rates (N1–N3) significantly promotes root development. However, further increasing nitrogen application rates (N4) significantly reduces RL, RS, and RV. Compared to W3N1, W3N3 treatment increases RL, RS, and RV by 40.42%, 41.44%, and 112.76%, respectively. W3N4 treatment increases RL, RS, and RV by 5.17%, 13.92%, and 42.10%, respectively. This indicates that excessive nitrogen application (N4) inhibits plant root development. Under higher irrigation levels, increasing nitrogen application rates has a greater promoting effect on root RS and RV. Compared to W1N1, W1N3 treatment increases RS and RV by 27.03% and 7.85%, respectively. Compared to W3N1, W3N3 increases RS and RV by 41.44% and 112.76%, respectively (Figure 4).

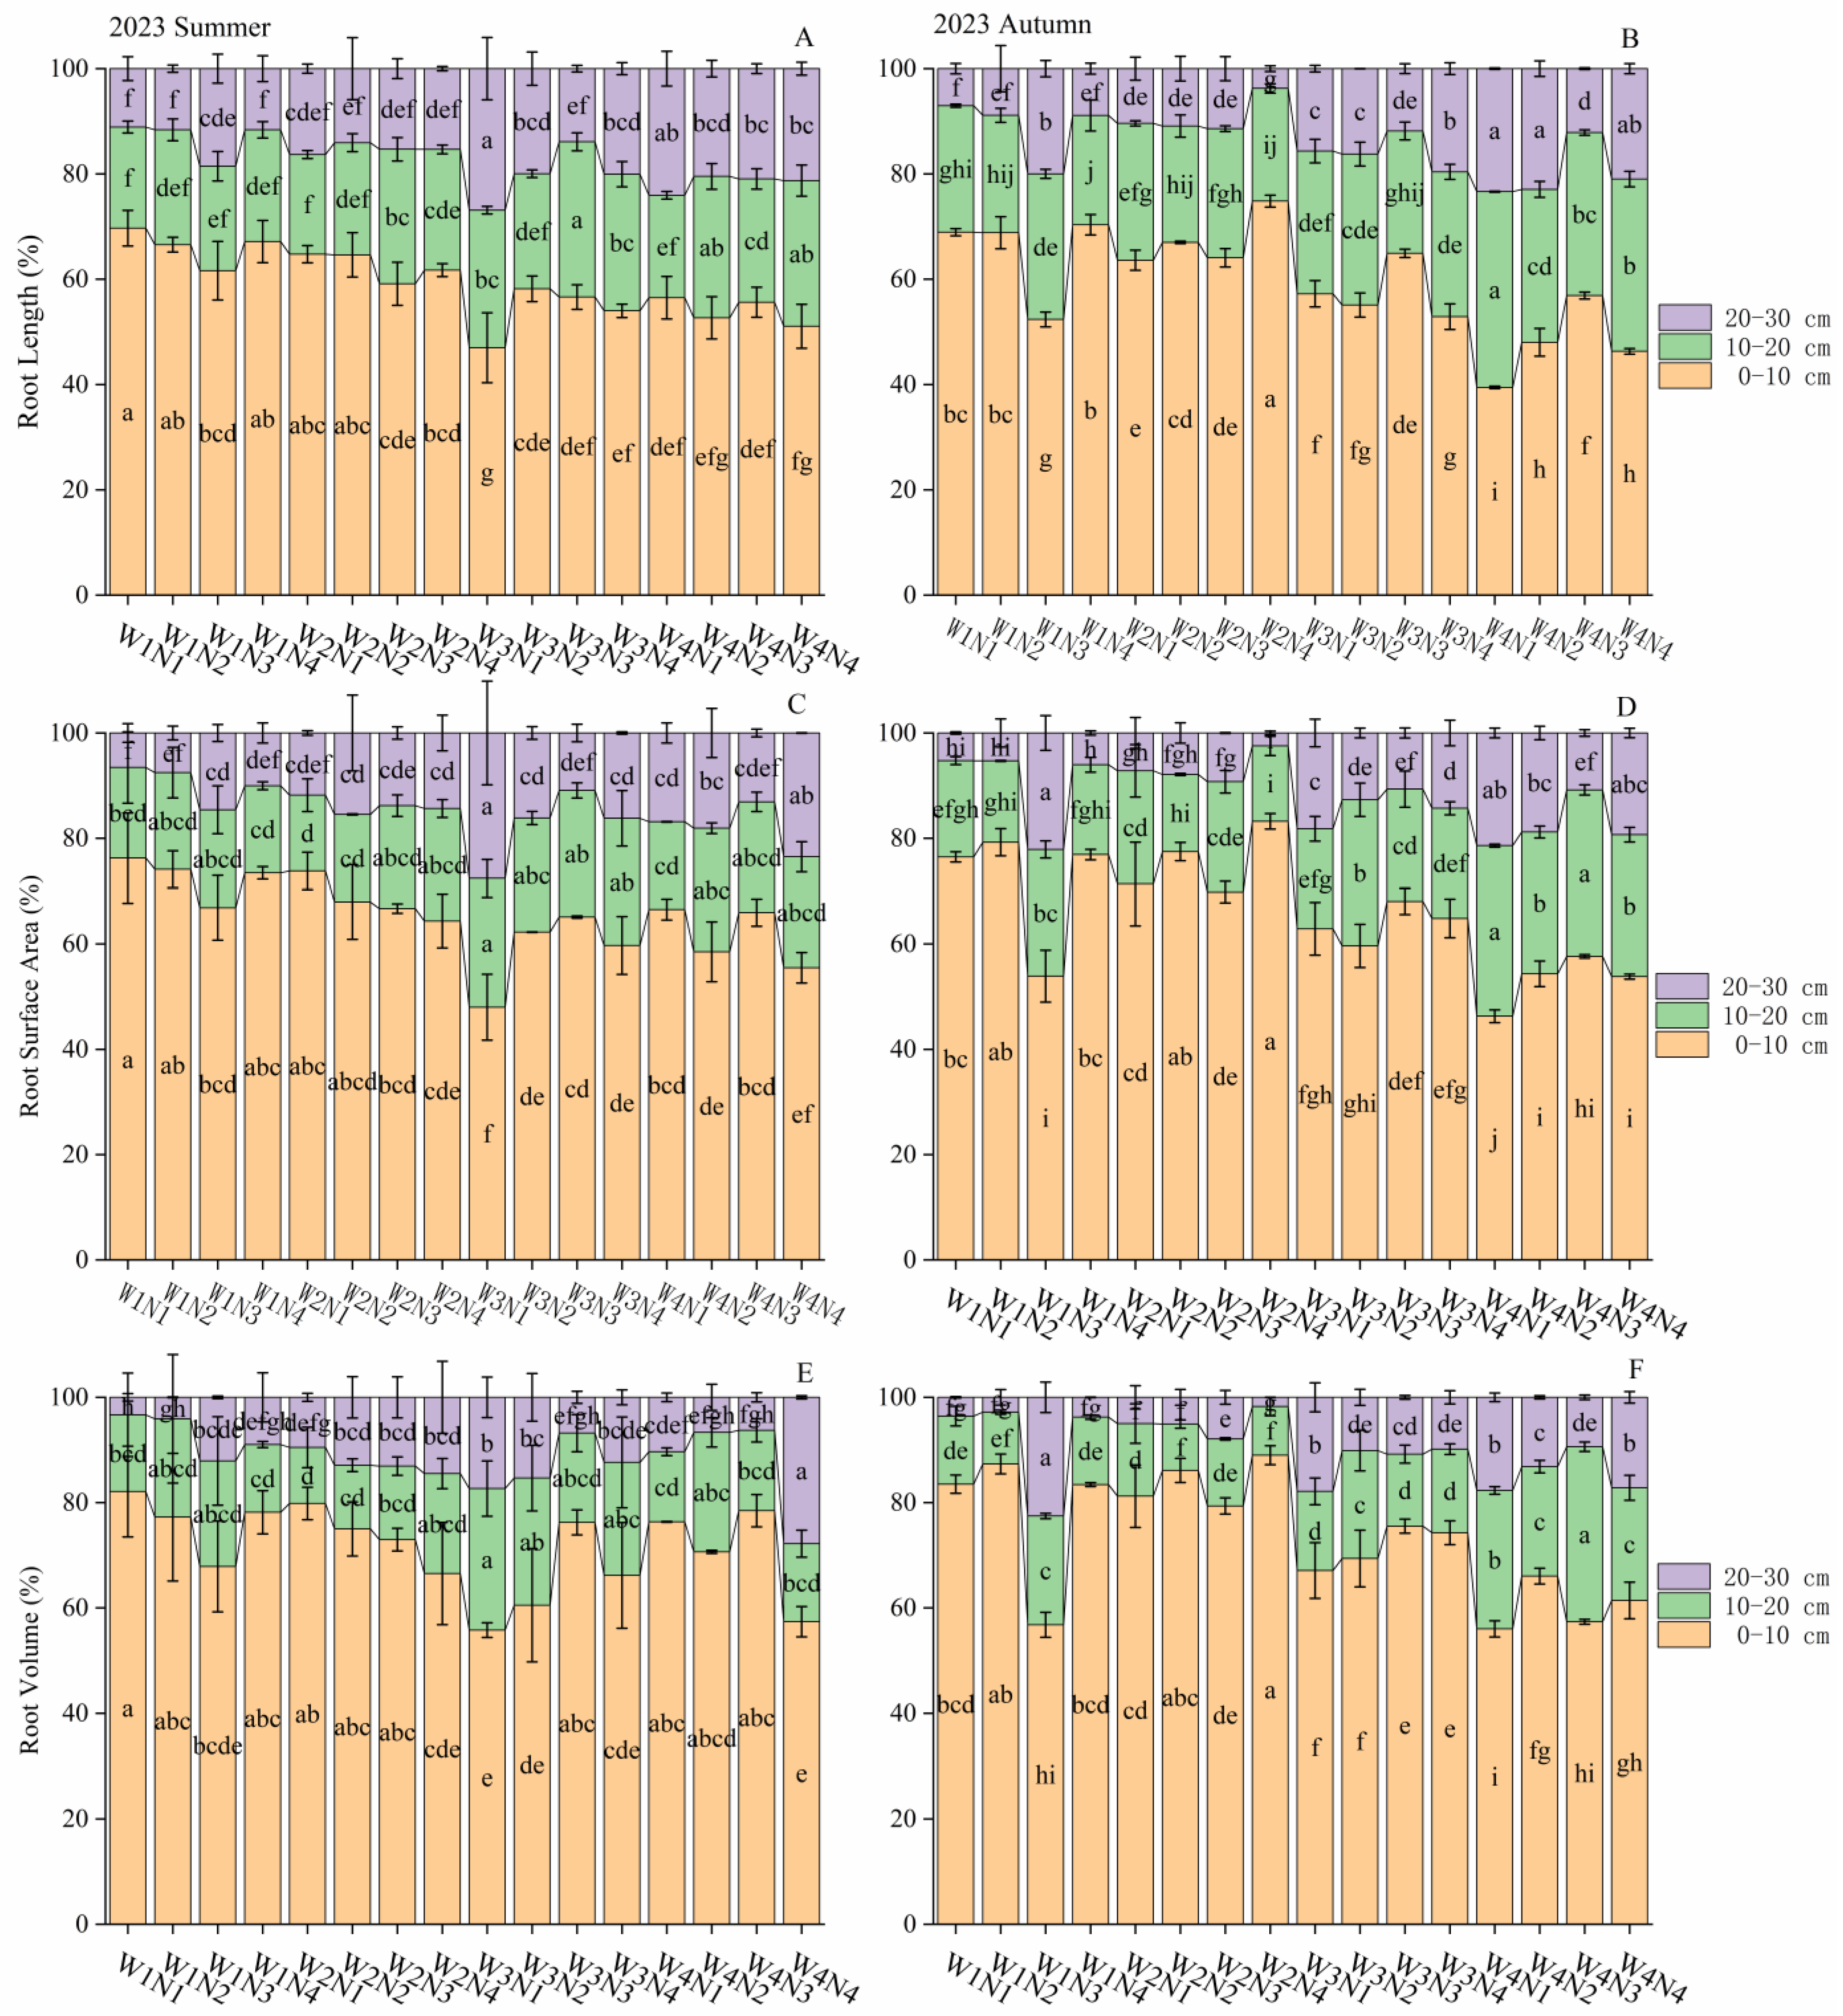
3.2. Root Characteristics in Each Soil Layer

Irrigation levels, nitrogen application rates, and their interactive effects significantly influence root length (RL), root surface area (RS), and root volume (RV) in the top (0–10 cm), middle (10–20 cm), and bottom (20–30 cm) soil layers.
In the topsoil layer (0–10 cm), under the same nitrogen application level, increasing irrigation levels (W1–W3) significantly enhanced the RL, RS, and RV of the root system. When the irrigation level reached W4, it promoted root development during the summer growing period but inhibited it during the autumn growing period. Compared to W1N3, W3N3 increased RL, RS, and RV by 45.03%, 61.24%, and 148.21%, respectively (Figure 5). In contrast, W4N3 increased RL and RS by 25.00% and 27.07% during the summer growing period but decreased them by 26.52% and 27.55% during the autumn growing period, respectively. Within the same irrigation level, increasing nitrogen application rates (N1–N3) significantly improved the RL, RS, and RV of the topsoil root system (0–10 cm). However, when nitrogen application reached N4 (350 kg/ha), it suppressed root growth and development. Compared to W3N1, W3N3 treatment increased RL, RS, and RV by 61.26%, 70.74%, and 167.69%, respectively. W3N4 treatment increased RL, RS, and RV by 7.93%, 28.62%, and 64.47%, respectively.
In the middle soil layer (10–20 cm), under the same nitrogen application level, increasing irrigation levels (W1–W4) significantly enhanced the RL, RS, and RV of the root system. Compared to W1N3, W4N3 increased RL, RS, and RV by 73.23%, 93.19%, and 123.43% (Figure 5), respectively. Within the same irrigation level, increasing nitrogen application rates (N1–N3) significantly improved the RL, RS, and RV of the topsoil root system (0–10 cm). However, when nitrogen application reached N4 (350 kg/ha), it suppressed root growth and development. Compared to W4N1, W4N3 treatment increased RL, RS, and RV by 48.96%, 70.37%, and 124.76%, respectively. W4N4 treatment increased RL, RS, and RV by 28.50%, 22.88%, and 31.44%, respectively.
In the bottom soil layer (20–30 cm), increasing irrigation levels significantly enhanced the RL, RS, and RV of the root system. Compared to W1N2, W4N2 increased RL, RS, and RV by 183.69%, 330.36%, and 211.47%, respectively. Increasing nitrogen application rates (N1–N3) significantly increased RL, with W4N3 treatment increasing RL by 15.71% compared to W4N1, and W4N4 treatment increasing it by 2.43%. This indicates that root development in deeper soils is primarily controlled by irrigation water.
Overall, increasing irrigation levels (W1–W3) significantly increased the RL, RS, and RV of roots in all soil layers. High irrigation levels (W4) suppressed roots in the topsoil (0–10 cm) during the autumn growing period but still promoted root development in the middle and bottom soil layers (10–30 cm). The promotional effect of increased irrigation levels on RL, RS, and RV increased with soil depth. The promotional effect of increasing nitrogen application rates (N1–N3) on RL, RS, and RV decreased with soil depth. On the other hand, excessive nitrogen application (N4) led to a reduction in all root characteristics across all soil layers.

3.3. Vertical Distribution of Roots
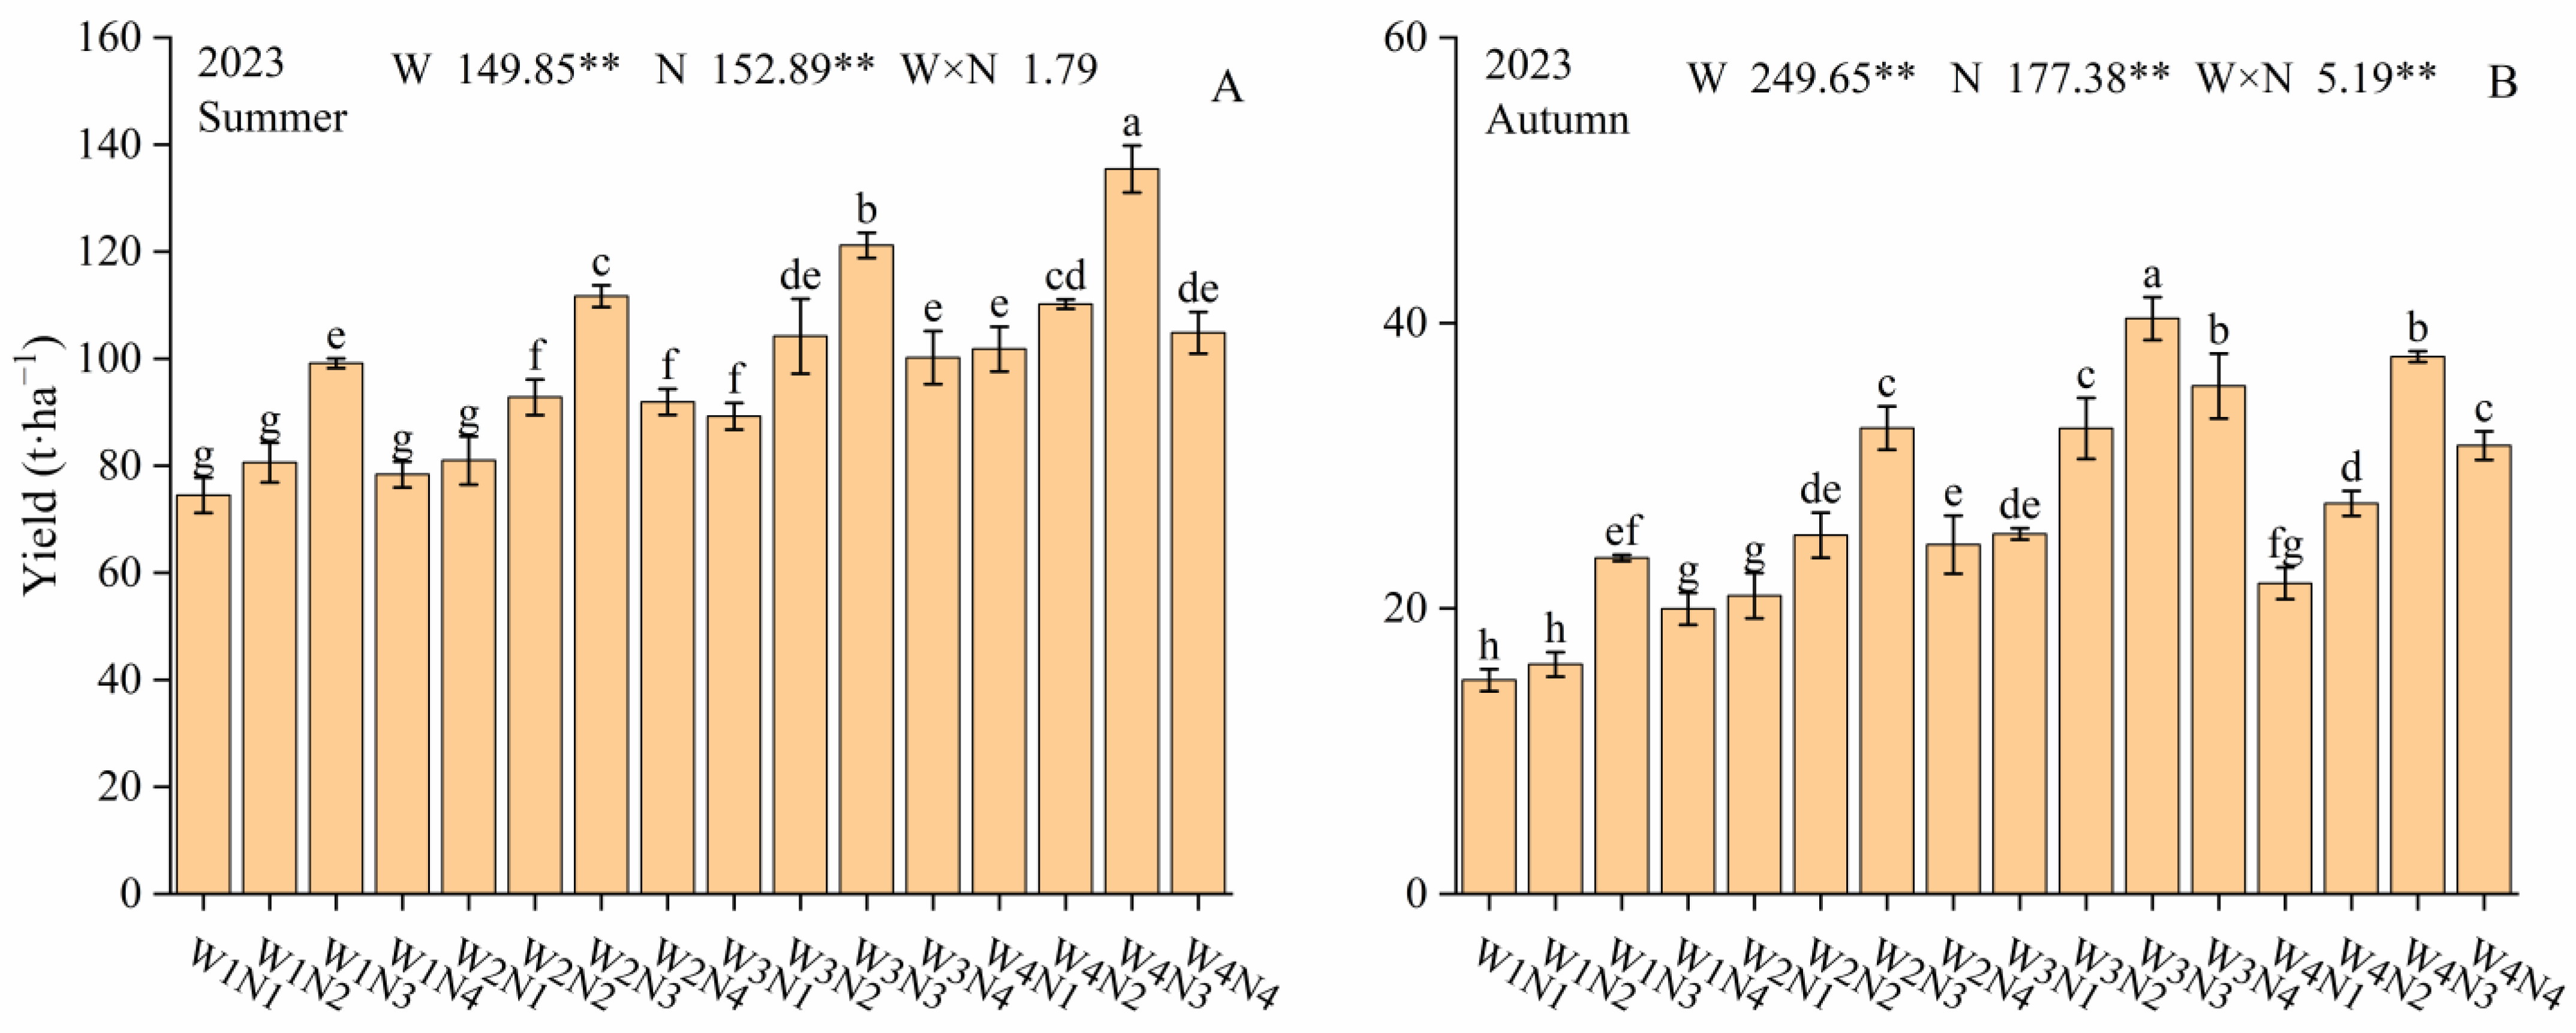
Irrigation levels have a highly significant impact on the proportion of root length (RL), root surface area (RS), and root volume (RV) in the top (0–10 cm), middle (10–20 cm), and bottom (20–30 cm) soil layers. The influence of irrigation volume on the vertical distribution of the root system is much greater than that of nitrogen application, and the patterns of change in the vertical distribution of the root system in response to nitrogen application are inconsistent (Figure 6).
In the topsoil layer (0–10 cm), the root system accounts for more than half of the total root system. RL, RS, and RV account for 59.29%, 65.68%, and 72.34% of the total root system, respectively. Contrary to the increase in RL, RS, and RV with increasing water application in the topsoil layer (0–10 cm), the proportion of RL, RS, and RV in the topsoil layer significantly decreases with increasing water application. Under the W4N4 treatment, the RL, RS, and RV proportions in the topsoil were 48.70%, 54.60%, and 59.40%, respectively, while under the W1N4 treatment, they were 68.80%, 75.20%, and 80.80%, respectively.
In the middle soil layer (10–20 cm), the root system accounts for about a quarter of the total root system. RL, RS, and RV account for 24.89%, 20.99%, and 17.03% of the total root system, respectively. With increasing irrigation levels (W1–W4), the proportions of RL, RS, and RV in the middle soil layer significantly increased. Under the W4N4 treatment, the RL, RS, and RV proportions in the middle soil layer were 30.20%, 23.90%, and 18.10%, respectively. Under the W1N4 treatment, they were 21.00%, 16.80%, and 12.80%, respectively.
In the bottom soil layer (20–30 cm), RL, RS, and RV account for 15.78%, 13.37%, and 10.61% of the total root system, respectively. Increasing irrigation levels significantly increased the proportion of the root system in the deeper soil layers. Under the W4N4 treatment, the RL, RS, and RV proportions in the bottom soil layer were 21.10%, 21.40%, and 22.50%, respectively. Under the W1N4 treatment, they were 10.30%, 8.00%, and 6.40%, respectively.
Overall, RL percentage, RS percentage, and RV percentage were mainly regulated by irrigation level, with increasing irrigation level significantly increasing the percentage of roots in the bottom soil layer (20–30 cm) and decreasing irrigation level increasing the percentage of roots in the topsoil layer (0–10 cm).

3.4. Fruit Yield

The application levels of water and nitrogen had a highly notable effect on fruit yield in both cultivation seasons, with their combined impact during the fall season being significantly pronounced (Figure 7). The mean yields of W1, W2, W3, and W4 were 50.84, 60.06, 68.56, and 71.30 t ha−1, respectively. The mean yields of N1, N2, N3, and N4 were 53.66, 61.11, 75.19, and 60.80 t ha−1, respectively. The highest yield was recorded at 80.75 t ha−1 under W3N3. Increasing irrigation levels (W1–W3) significantly enhanced fruit yield, while a high irrigation level (W4) increased fruit yield during the summer growing period but decreased it during the autumn growing period. Compared to W1N3, the yield under W3N3 increased by 31.64%. Compared to W3N3, W4N3 increased yield by 11.75% during the summer growing period but decreased it by 6.62% during the autumn growing period. Fruit yield initially increased and then decreased with the increase in nitrogen application; compared to W3N1, the yield under W3N3 treatment increased by 41.11%, while under W3N4 treatment, the yield increased by 18.63%.

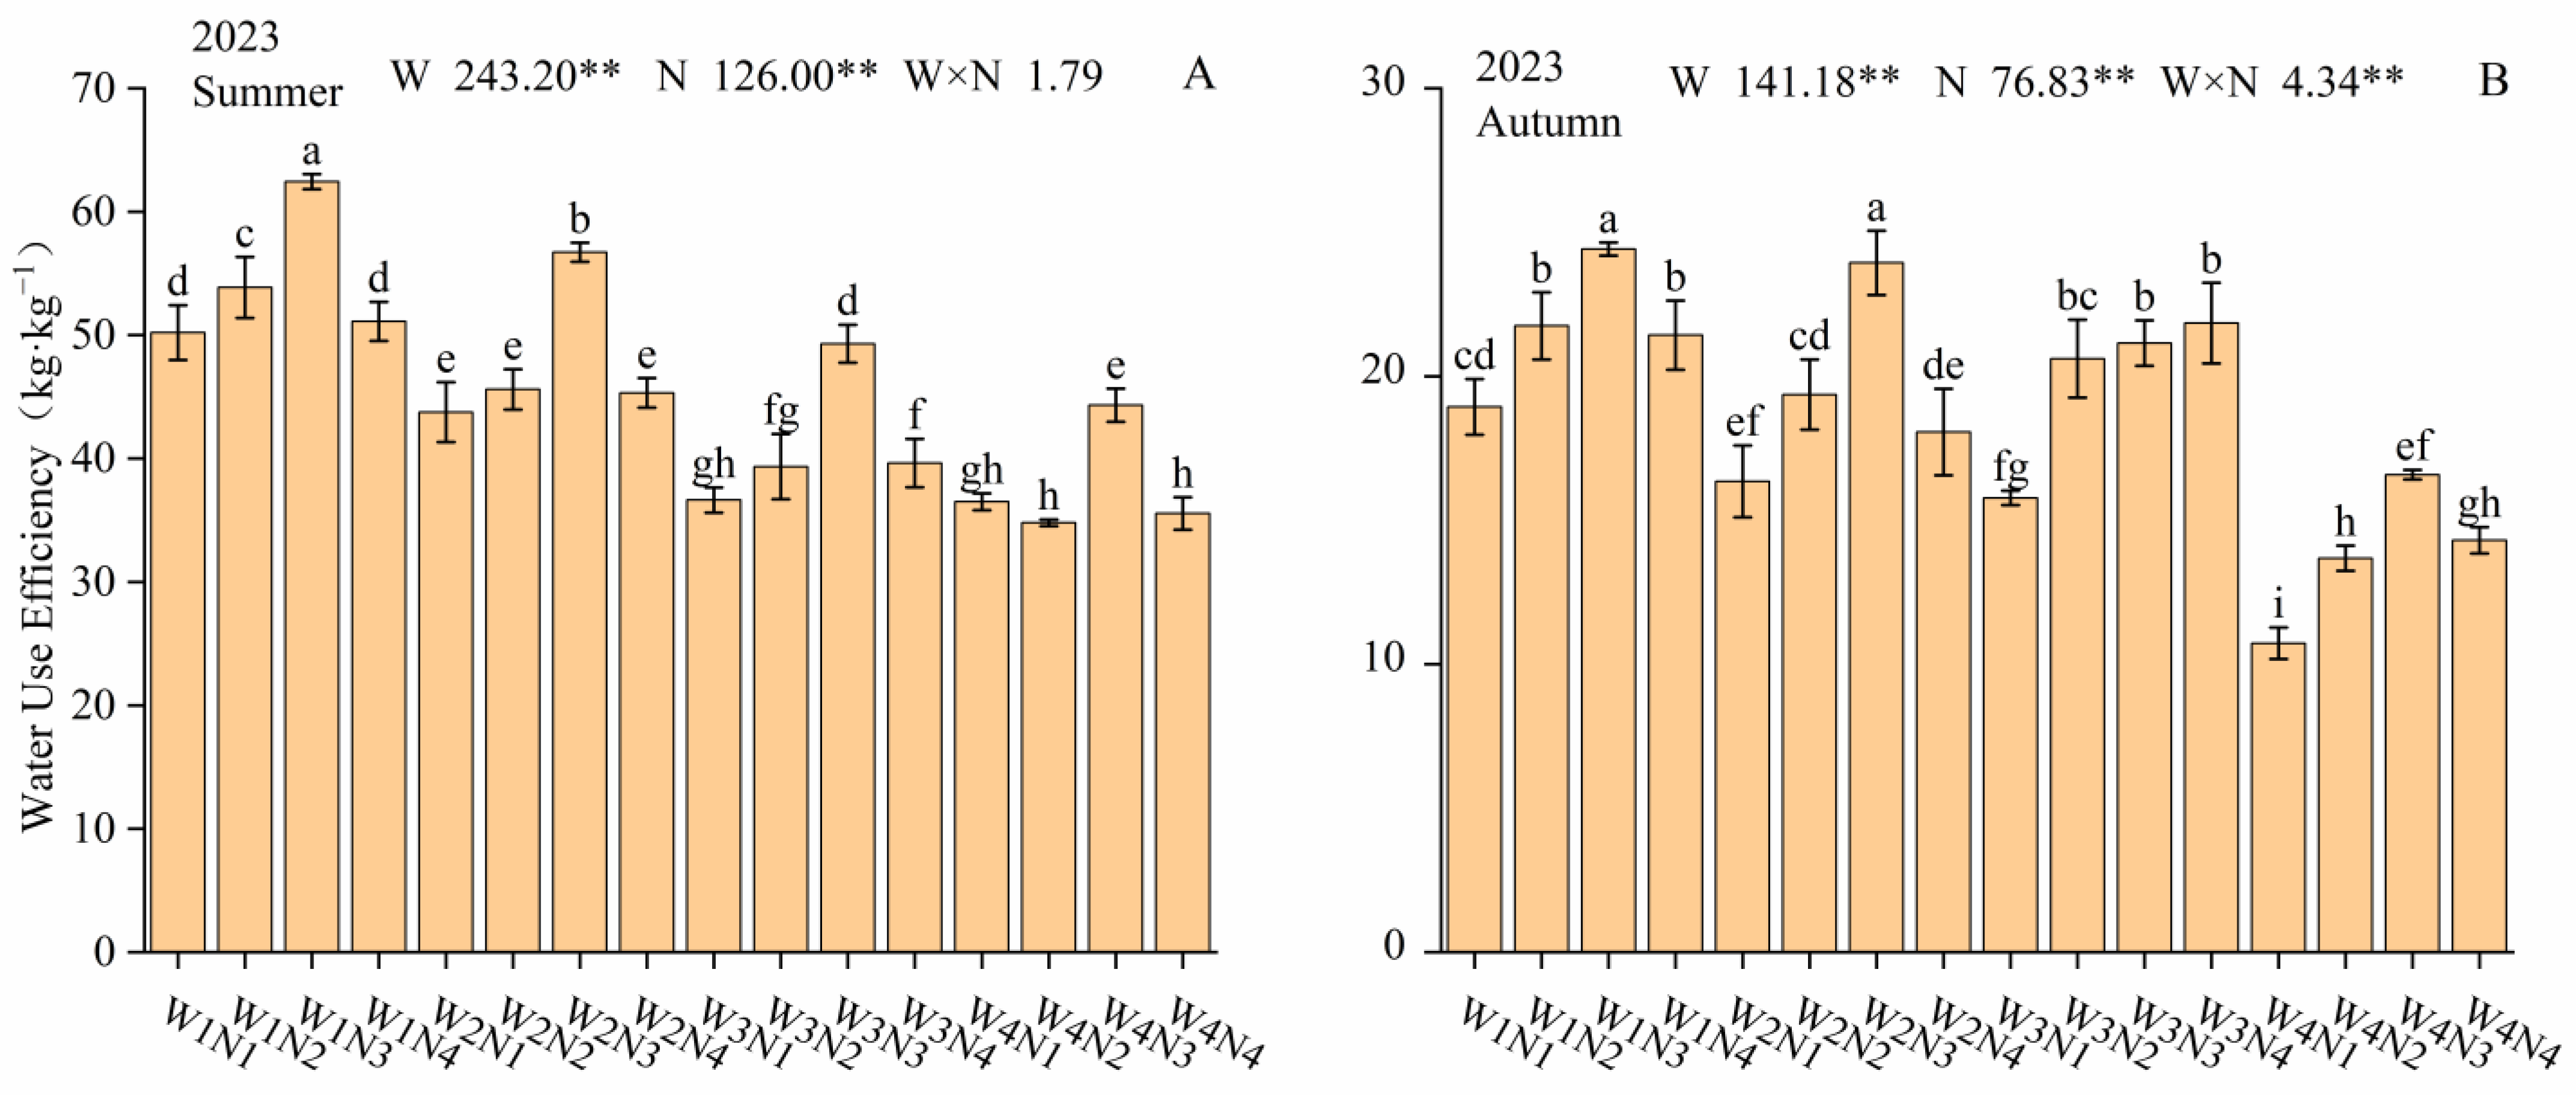
3.5. Water Use Efficiency

Reducing irrigation levels significantly improved Water Use Efficiency (WUE). Compared to the W4N3 treatment, the W1N3 treatment markedly enhanced WUE by 42.64%. WUE gradually increased with the increment of nitrogen application rates (N1–N3). However, when nitrogen application reached the N4 level, WUE was decreased due to the reduction in yield. Compared to the W3N1 treatment, the W3N3 treatment increased WUE by 34.42%, while the W3N4 treatment increased WUE by 17.29%. The maximum WUE was observed under the W3N3 treatment, reaching 35.22 kg kg−1 (Figure 8).

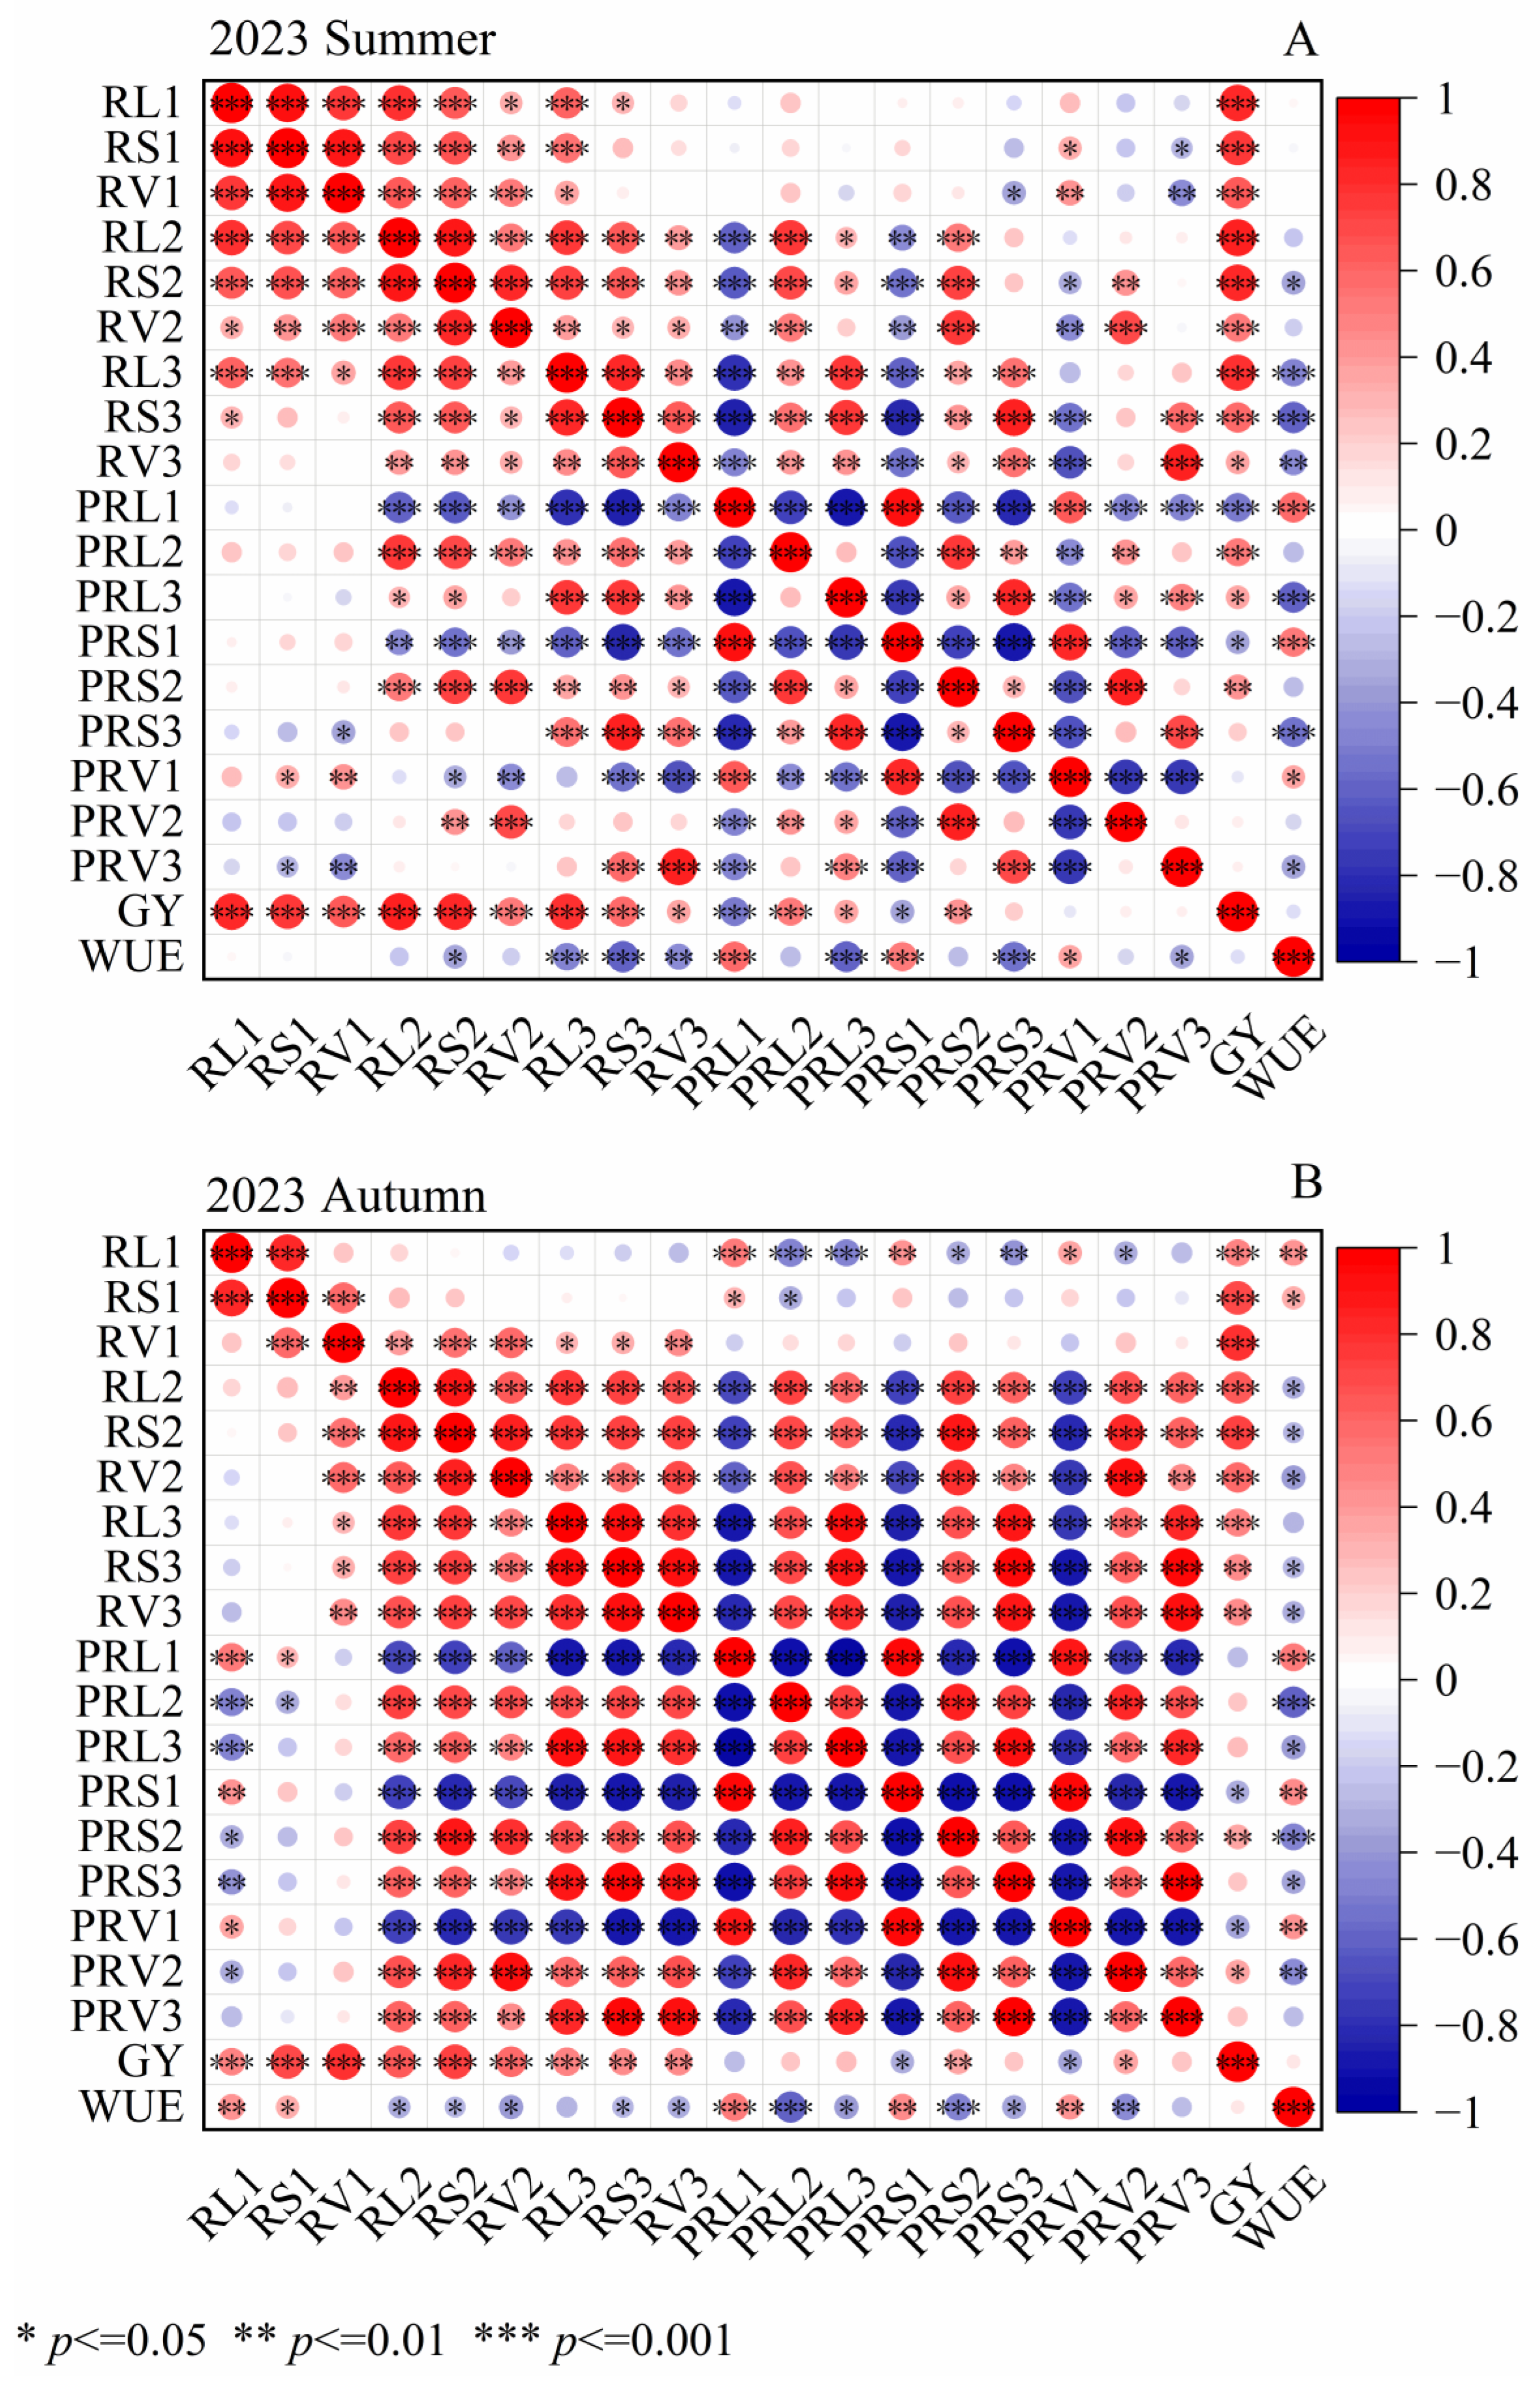
3.6. Correlation Analysis

A significant positive association was observed between the expansion of the root system and the fruit yield, along with a notable positive correlation between WUE and the percentage of RL and RS in the topsoil layer (Figure 9). This suggests that enhancing root development could substantially boost fruit yield. Increasing the proportion of roots in the 0–10 cm soil layer effectively improved the WUE. W1 and W2 significantly increased the root percentage in the topsoil layer (0–10 cm), suggesting that plants would raise WUE by changing the vertical distribution of the root system and increasing RL, RS, and RV in the topsoil layer (0–10 cm) to alleviate the adverse effects of water stress.

4. Discussion

4.1. Effect of Water and Nitrogen Regulation on Total Root Characteristics

Roots, as plant sensors of the soil environment, serve as a key factor in water and nutrient uptake as well as regulating aboveground growth, so it is essential to investigate the influences of water and nitrogen regulation on root characteristics. Numerous investigations have revealed that irrigation level and nitrogen rate significantly affect root characteristics [24,25,26]. Our analysis confirmed that increasing irrigation level (W1–W3) significantly increased root system characteristics, and the W3N3 treatment resulted in a significant increase in RL, RS, and RV by 40.46%, 49.80%, and 106.39% compared with W1N3, respectively. The significant increase in total RL, RS, and RV by elevating the irrigation level was due to the fact that increasing the irrigation level could effectively enhance soil moisture content, further promoting root growth and root hydraulic conductivity, which was favorable to root growth [27]. Appropriately increasing nitrogen rate (N1–N3) significantly increased root characteristics, while excessive nitrogen application (N4) significantly decreased root characteristics. RL, RS, and RV increased by 40.42%, 41.44%, and 112.76% in the W3N3 treatment compared to the W3N1 treatment, while they increased by only 5.17%, 13.92%, and 42.10% in the W3N4, respectively. Root trait enhancements, resulting from a judicious rise in nitrogen fertilization, are credited to the synergistic effect of water and nitrogen, facilitating nutrient absorption and photosynthetic activity, thereby boosting root biomass and yield, as noted by Badr et al. [13] and Chen et al. [28]. Meanwhile, the water-nitrogen coupling effect also exists in a margin, and excessive nitrogen application led to exceeding the water-nitrogen coupling margin, and the soil moisture could not meet the water required for plant nitrogen uptake, which led to a large accumulation of salts in the root zone and thus inhibited root growth [28]. This phenomenon suggests that to obtain good root morphology and fruit yield, irrigation level and nitrogen rate must be matched [14,18].

4.2. Impact of Water and Nitrogen Management on Root Distribution Each Soil Layers

Increasing the irrigation level significantly increased RL, RS, and RV in all soil layers, and the enhancement effect of irrigation level on RL, RS, and RV increased with the soil depth. This was due to the higher irrigation levels increased the soil wetting depth, and root biomass and soil water content were significantly and positively correlated [29]. Earlier research has confirmed that water deficit significantly encouraged the extension of roots into the deeper soil layer [20], but the present study demonstrated that increasing the irrigation level could also effectively increase RL, RS, and RV in deep soils. Compared with those of W1N3, RL, RS, and RV of the root system in the 20–30 cm soil layer of W3N3 increased by 73.23%, 93.19%, and 123.43%, respectively. The data suggest that a scientific irrigation level could also be instrumental in the advancement of root growth in the deeper soil layers, as shown in a study by Wang et al. [30].
Increasing the nitrogen rate could effectively enhance RL, RS, and RV of the root system in the 0–20 cm soil layers, and the enhancement effects of nitrogen application on RL, RS, and RV increased and then decreased with the increase of soil depth, which may be due to the fact that the effects of nitrogen rate on the characteristics of the root system in each soil layer varied with the change of soil water, and the increase in the nitrogen rate in the high soil water content was shown as a promoting effect, while increasing nitrogen rate at low soil water content showed an inhibiting effect [30].

4.3. Effect of Water and Nitrogen Regulation on Vertical Distribution of Roots

Feng et al. [31] showed that more than 95% of the tomato root system was distributed in the 0–40 cm soil layer under drip irrigation. This research further indicated that about 72% of RV of the tomato root system was distributed in the 0–10 cm soil layer under drip irrigation, about 17% of RV was distributed in the 10–20 cm, and about 10% of the root system was distributed around 20–30 cm. Decreasing the irrigation level was effective in increasing the percentage of plant roots in the top soil layer, which suggests that the plants will counteract water stress by increasing the distribution of roots in the top soil layer and improving the efficiency of water use in the top soil layer [22]. Ma et al. [19] demonstrated that increasing the nitrogen rate was effective in increasing the percentage of roots in the top soil layer (0–20 cm), had no significant effect on rhizosphere soil roots (20–100 cm), and significantly reduced the proportion of roots in deeper soils (100–300 cm) compared to no N application.

4.4. Effect of Water Nitrogen Regulation on Tomato Yield

The application of irrigation and nitrogen stands as a cornerstone for tomato growth and yield. Scientific irrigation level and nitrogen rate can effectively increase yields by promoting nutrients uptake by the root system, as well as reducing agro-environmental pollution [32,33]. Drought stress induced by lowering irrigation level can inhibit water uptake by the root system via reducing soil water potential in the root zone, leading to a concentrated closure of leaf stomata and reducing plant transpiration as well as photosynthesis. At the same time, reduced plant water uptake is often accompanied by reduced nitrogen uptake, leading to a significant reduction in the rate of plant photosynthesis and reduced dry matter synthesis, which in turn reduces yield [34]. Our findings indicate that increasing the irrigation level was effective in increasing tomato yield, which increased by 31.64% in W3N3 compared to W1N3, which is substantiated by the study of Li et al. [35]. About 50% of tomato nutrients are concentrated in the fruit, and the nutrient uptake status largely determines the final yield [36,37]. A significant boost in tomato harvest was observed with the progressive enhancement of nitrogen inputs from N1 to N3, but excessive nitrogen application caused a significant reduction in fruit yield, which increased by 19.53%, 41.11%, and 18.63% in W3N2, W3N3, and W3N4 compared to W3N1, respectively. This was because the appropriate amount of nitrogen input ensured the supply of nutrients to the tomato root zone, which favored the evolution of lateral roots, improved the quality of the root system, and facilitated the uptake of water and nutrients in the root system; as a result, the tomato yield increased consequently [4]. Excessive N application, on the other hand, significantly reduced fruit yield, which may be attributed to the increase in inter-root osmotic pressure due to excessive N application, weaker root water uptake capacity, and lower plant transpiration, which reduced the crop’s ability to absorb nutrients [38]. It has also been suggested that the high nitrogen application reduced inter-root soil microbial activity and soil biochemical properties, which then affected the uptake of nitrogen by tomato, ultimately leading to the yield reduction [39].

4.5. Effect of Water and Nitrogen Regulation on WUE

Improving WUE and reducing environmental impacts and resource waste in solar greenhouses in northwest China due to high replanting index and excessive water-nitrogen inputs are significant for sustainable agricultural development. Reducing the irrigation level significantly increased WUE for three reasons. (1) Reducing the irrigation level caused the root distribution to move upward, and more roots were distributed within the topsoil layer, reducing the leakage of irrigation water to the deeper layers. (2) Lowering the irrigation level induced stomatal closure in plants, leading to lower transpiration rate and higher WUE [28]. (3) Plants under severe stress prioritize water supply to fruits, weakening the effect of stress on yield and serving as a protective mechanism for reproduction [2]. The increase in WUE with increasing nitrogen rate was attributed to the fact that increasing nitrogen rate increased water and nitrogen uptake by the root system, which led to a significant rise in fruit yield. Nevertheless, the decrease in WUE was attributed to the increase in inter-root osmotic pressure due to excessive nitrogen application, which resulted in weaker water uptake by the root system and reduced plant transpiration, ultimately leading to decreased fruit yield [39], which is substantiated by the Zhang et al. [7].

5. Conclusions

An investigation was initiated to determine the consequences of assorted water and nitrogen treatments on the RL, RS, RV, fruit yield, and WUE. Reasonable irrigation levels and nitrogen application significantly promote the growth of root systems and increase fruit yield, but excessive irrigation and nitrogen application will limit root growth and fruit yield increasing. Water is a major factor affecting root growth, and root characteristics in bottom soil are more sensitive than topsoil to changing irrigation levels. Root characteristics in mid-soil are more sensitive to changes in nitrogen application, which may be related to the transport of soil water and nitrogen under different irrigation and nitrogen application levels. Changes in irrigation volume can significantly affect the vertical distribution of roots and reducing irrigation volume can effectively increase the proportion of root distribution in shallow soil, thereby effectively reducing the seepage of soil water to deeper layers and improving water use efficiency. Future research should focus on the relationship between soil water and nitrogen transport and root distribution to gain a deeper understanding of the impact of water and nitrogen regulation on plant nutrient absorption.

Author Contributions

Conceptualization, J.F.; methodology, H.F.; validation, H.F. and W.J.; formal analysis, H.F.; investigation, H.M. and Z.D.; resources, Z.L. (Zhijun Li) and J.F.; data curation, H.F.; writing—original draft preparation, H.F.; writing—review and editing, J.F.; visualization, Z.L. (Zhenqi Liao) and H.F.; supervision, J.F.; project administration, J.F.; funding acquisition, J.F. All authors have read and agreed to the published version of the manuscript.

Funding

This study was funded by the National Natural Science Foundation of China (51879226) and the Chinese Universities Scientific Fund (2452020018).

Data Availability Statement

All data will be made available on request to the correspondent author’s email with appropriate justification.

Conflicts of Interest

The authors declare no conflicts of interest.

References

  1. Wang, X.; Tian, W.; Zheng, W.; Shah, S.; Li, J.; Wang, X.; Zhang, X. Quantitative relationships between salty water irrigation and tomato yield, quality, and irrigation water use efficiency: A meta-analysis. Agric. Water Manag. 2023, 280, 108213. [Google Scholar] [CrossRef]
  2. Li, H.; Hou, X.; Bertin, N.; Ding, R.; Du, T. Quantitative responses of tomato yield, fruit quality and water use efficiency to soil salinity under different water regimes in Northwest China. Agric. Water Manag. 2023, 277, 108134. [Google Scholar] [CrossRef]
  3. Wu, Z.; Fan, Y.; Qiu, Y.; Hao, X.; Li, S.; Kang, S. Response of yield and quality of greenhouse tomatoes to water and salt stresses and biochar addition in Northwest China. Agric. Water Manag. 2022, 270, 107736. [Google Scholar] [CrossRef]
  4. Cheng, M.; Wang, H.; Fan, J.; Xiang, Y.; Tang, Z.; Pei, S.; Zeng, H.; Zhang, C.; Dai, Y.; Li, Z.; et al. Effects of nitrogen supply on tomato yield, water use efficiency and fruit quality: A global meta-analysis. Sci. Hortic. 2021, 290, 110553. [Google Scholar] [CrossRef]
  5. Ding, W.; Chang, N.; Zhang, J.; Li, G.; Zhang, J.; Ju, X.; Zhang, G.; Li, H. Optimized fertigation mitigates N2O and NO emissions and enhances NH3 volatilizations in an intensified greenhouse vegetable system. Agric. Water Manag. 2022, 272, 107797. [Google Scholar] [CrossRef]
  6. Zhang, Y.; Zhang, F.; Qiang, S.; Li, Z. Effects of irrigation and fertilization on growth, water and nitrogen use of tomato in greenhouse under fertigation. Agric. Res. Arid. Areas 2017, 35, 103–109. [Google Scholar]
  7. Zhang, Q.; Niu, W.; Du, Y.; Sun, J.; Cui, B.; Zhang, E.; Wang, Y.; Siddique, K.H. Effect of aerated drip irrigation and nitrogen doses on N2O emissions, microbial activity, and yield of tomato and muskmelon under greenhouse conditions. Agric. Water Manag. 2023, 283, 108321. [Google Scholar] [CrossRef]
  8. Cheng, M.; Wang, H.; Fan, J.; Xiang, Y.; Liu, X.; Liao, Z.; Abdelghany, A.E.; Zhang, F.; Li, Z. Evaluation of AquaCrop model for greenhouse cherry tomato with plastic film mulch under various water and nitrogen supplies. Agric. Water Manag. 2022, 274, 107949. [Google Scholar] [CrossRef]
  9. Gong, X.; Li, X.; Li, Y.; Bo, G.; Qiu, R.; Huang, Z.; Gao, S.; Wang, S. An improved model to simulate soil water and heat: A case study for drip-irrigated tomato grown in a greenhouse. Agric. Water Manag. 2023, 277, 108121. [Google Scholar] [CrossRef]
  10. Wang, C.; Gu, F.; Chen, J.; Yang, H.; Jiang, J.; Du, T.; Zhang, J. Assessing the response of yield and comprehensive fruit quality of tomato grown in greenhouse to deficit irrigation and nitrogen application strategies. Agric. Water Manag. 2015, 161, 9–19. [Google Scholar] [CrossRef]
  11. Zheng, J.; Huang, G.; Jia, D.; Wang, J.; Mota, M.; Pereira, L.S.; Huang, Q.; Xu, X.; Liu, H. Responses of drip irrigated tomato (Solanum lycopersicum L.) yield, quality and water productivity to various soil matric potential thresholds in an arid region of Northwest China. Agric. Water Manag. 2013, 129, 181–193. [Google Scholar] [CrossRef]
  12. Chen, J.; Kang, S.; Du, T.; Qiu, R.; Guo, P.; Chen, R. Quantitative response of greenhouse tomato yield and quality to water deficit at different growth stages. Agric. Water Manag. 2013, 129, 152–162. [Google Scholar] [CrossRef]
  13. Badr, M.A.; Abou-Hussein, S.D.; El-Tohamy, W.A. Tomato yield, nitrogen uptake and water use efficiency as affected by planting geometry and level of nitrogen in an arid region. Agric. Water Manag. 2016, 169, 90–97. [Google Scholar] [CrossRef]
  14. Xing, Y.Y.; Zhang, F.C.; Zhang, Y.; Li, J.; Qiang, S.C.; Wu, L.F. Effect of Irrigation and Fertilizer Coupling on Greenhouse Tomato Yield, Quality, Water and Nitrogen Utilization Under Fertigation. Trans. Chin. Soc. Agric. Eng. 2015, 31 (Suppl. S1), 110–121. [Google Scholar]
  15. Du, Y.-D.; Niu, W.-Q.; Gu, X.-B.; Zhang, Q.; Cui, B.-J. Water- and nitrogen-saving potentials in tomato production: A meta-analysis. Agric. Water Manag. 2018, 210, 296–303. [Google Scholar] [CrossRef]
  16. Wang, X.; Yun, J.; Shi, P.; Li, Z.; Li, P.; Xing, Y. Root Growth, Fruit Yield and Water Use Efficiency of Greenhouse Grown Tomato Under Different Irrigation Regimes and Nitrogen Levels. J. Plant Growth Regul. 2019, 38, 400–415. [Google Scholar] [CrossRef]
  17. Wang, Y.; Zhang, X.; Chen, J.; Chen, A.; Wang, L.; Guo, X.; Niu, Y.; Liu, S.; Mi, G.; Gao, Q. Reducing basal nitrogen rate to improve maize seedling growth, water and nitrogen use efficiencies under drought stress by optimizing root morphology and distribution. Agric. Water Manag. 2019, 212, 328–337. [Google Scholar] [CrossRef]
  18. Yang, H.; Du, T.; Qiu, R.; Chen, J.; Wang, F.; Li, Y.; Wang, C.; Gao, L.; Kang, S. Improved water use efficiency and fruit quality of greenhouse crops under regulated deficit irrigation in northwest China. Agric. Water Manag. 2017, 179, 193–204. [Google Scholar] [CrossRef]
  19. Ma, Y.X.; Wang, C.Y.; He, D.X. Root of Wheat; China Agriculture Press: Beijing, China, 1999; pp. 1–10 and 136–142. [Google Scholar]
  20. Xue, L.H.; Duan, J.J.; Wang, Z.M.; Guo, Z.W.; Lu, L.Q. Effects of different irrigation regimes on spatial-temporal distribution of roots, soil water use and yield in winter wheat. Acta Ecol. Sin. 2010, 30, 5296–5305, (In Chinese with English Abstract). [Google Scholar]
  21. Luo, L.; Mei, H.; Yu, X.; Liu, H.; Feng, F. Water-saving and drought-resistance rice and its development strategy. Chin. Sci. Bull. 2011, 56, 804–811. [Google Scholar] [CrossRef]
  22. Merrill, S.D.; Tanaka, D.L.; Hanson, J.D. Root Length Growth of Eight Crop Species in Haplustoll Soils. Soil Sci. Soc. Am. J. 2002, 66, 913–923. [Google Scholar] [CrossRef]
  23. Lai, Z.; Fan, J.; Yang, R.; Xu, X.; Liu, L.; Li, S.; Zhang, F.; Li, Z. Interactive effects of plant density and nitrogen rate on grain yield, economic benefit, water productivity and nitrogen use efficiency of drip-fertigated maize in northwest China. Agric. Water Manag. 2022, 263, 107453. [Google Scholar] [CrossRef]
  24. Ayankojo, I.T.; Morgan, K.T.; Kadyampakeni, D.M.; Liu, G.D. Tomato Growth, Yield, and Root Development, Soil Nitrogen and Water Distribution as Affected by Nitrogen and Irrigation Rates on a Florida Sandy Soil. HortScience 2020, 55, 1744–1755. [Google Scholar] [CrossRef]
  25. Ullah, I.; Mao, H.; Rasool, G.; Gao, H.; Javed, Q.; Sarwar, A.; Khan, M.I. Effect of Deficit Irrigation and Reduced N Fertilization on Plant Growth, Root Morphology and Water Use Efficiency of Tomato Grown in Soilless Culture. Agronomy 2021, 11, 228. [Google Scholar] [CrossRef]
  26. Zhang, H.; Khan, A.; Tan, D.K.Y.; Luo, H. Rational Water and Nitrogen Management Improves Root Growth, Increases Yield and Maintains Water Use Efficiency of Cotton under Mulch Drip Irrigation. Front. Plant Sci. 2017, 8, 912. Available online: https://www.frontiersin.org/articles/10.3389/fpls.2017.00912 (accessed on 27 December 2023). [CrossRef]
  27. Giuliani, M.M.; Nardella, E.; Gagliardi, A.; Gatta, G. Deficit Irrigation and Partial Root-Zone Drying Techniques in Processing Tomato Cultivated under Mediterranean Climate Conditions. Sustainability 2017, 9, 2197. [Google Scholar] [CrossRef]
  28. Chen, C.; Xu, F.; Zhu, J.R.; Wang, R.F.; Xu, Z.H.; Shu, L.Z.; Xu, W.W. Nitrogen forms affect root growth, photosynthesis, and yield of tomato under alternate partial root-zone irrigation. J. Plant Nutr. Soil Sci. 2016, 179, 104–112. [Google Scholar] [CrossRef]
  29. Wang, C.Y.; Ma, Y.X. Ecological and Physiological effects on root systems of wheat under different soil water conditions. Acta Agri. Boreali-Sin. 1992, 7, 1–8, (In Chinese with English Abstract). [Google Scholar]
  30. Wang, C.; Liu, W.; Li, Q.; Ma, D.; Lu, H.; Feng, W.; Xie, Y.; Zhu, Y.; Guo, T. Effects of different irrigation and nitrogen regimes on root growth and its correlation with above-ground plant parts in high-yielding wheat under field conditions. Field Crops Res. 2014, 165, 138–149. [Google Scholar] [CrossRef]
  31. Feng, D.; Ning, S.; Sun, X.; Zhang, J.; Zhu, H.; Tang, J.; Xu, Y. Agricultural use of deserted saline land through an optimized drip irrigation system with mild salinized water. Agric. Water Manag. 2023, 281, 108261. [Google Scholar] [CrossRef]
  32. Ji, X.; Deng, T.; Xiao, Y.; Jin, C.; Lyu, W.; Wu, Z.; Wang, W.; Wang, X.; He, Q.; Yang, H. Emerging Alternaria and Fusarium mycotoxins in tomatoes and derived tomato products from the China market: Occurrence, methods of determination, and risk evaluation. Food Control. 2023, 145, 109464. [Google Scholar] [CrossRef]
  33. Wu, Y.; Yan, S.; Fan, J.; Zhang, F.; Zhao, W.; Zheng, J.; Guo, J.; Xiang, Y.; Wu, L. Combined effects of irrigation level and fertilization practice on yield, economic benefit and water-nitrogen use efficiency of drip-irrigated greenhouse tomato. Agric. Water Manag. 2022, 262, 107401. [Google Scholar] [CrossRef]
  34. Dou, Z.; Feng, H.; Zhang, H.; Abdelghany, A.E.; Zhang, F.; Li, Z.; Fan, J. Silicon application mitigated the adverse effects of salt stress and deficit irrigation on drip-irrigated greenhouse tomato. Agric. Water Manag. 2023, 289, 108526. [Google Scholar] [CrossRef]
  35. Li, H.; Liu, H.; Gong, X.; Li, S.; Pang, J.; Chen, Z.; Sun, J. Optimizing irrigation and nitrogen management strategy to trade off yield, crop water productivity, nitrogen use efficiency and fruit quality of greenhouse grown tomato. Agric. Water Manag. 2021, 245, 106570. [Google Scholar] [CrossRef]
  36. Xing, Y.; Zhang, F.; Zhang, Y.; Li, J.; Qiang, S.; Li, Z.; Gao, M. Irrigation and fertilization coupling of drip irrigation under plastic film promotes tomato’s nutrient uptake and growth. Trans. Chin. Soc. Agric. Eng. 2014, 30, 70–80. [Google Scholar]
  37. Tang, M.; Zhang, Y.; Hu, W.; Hu, G.; Li, Q.; Yao, Y.; Gao, Y. Effects of different nitrogen rates on nutrition absorption, distribution and yield in tomato. J. Plant Nutr. Fertil. 2010, 16, 1238–1245. [Google Scholar]
  38. Lahoz, I.; Pérez-de-Castro, A.; Valcárcel, M.; Macua, J.I.; Beltrán, J.; Roselló, S.; Cebolla-Cornejo, J. Effect of water deficit on the agronomical performance and quality of processing tomato. Sci. Hortic. 2016, 200, 55–65. [Google Scholar] [CrossRef]
  39. Truu, M.; Truu, J.; Heinsoo, K. Changes in soil microbial community under willow coppice: The effect of irrigation with secondary-treated municipal wastewater. Ecol. Eng. 2009, 35, 1011–1020. [Google Scholar] [CrossRef]
Figure 1. Meteorological data during the two growing seasons of greenhouse tomato. (A) 2023 summer (B) 2023 autumn.
Agronomy 14 02439 g001
Figure 2. Planting pattern of greenhouse tomato.
Agronomy 14 02439 g002
Figure 3. Sampling locations of tomato roots.
Agronomy 14 02439 g003
Figure 4. Root system characteristics in different water and nitrogen treatments. W: Irrigation level; N: Nitrogen rate. The number before * is F value from the factor analysis. ** indicate significant differences at the level of p < 0.01. Different lower-case letters denote significant differences at p < 0.05 among treatments. W1: 50%ETC, W2: 75%ETC, W3: 100%ETC, W4: 125%ETC, N1: 0 kg ha−1, N2: 150 kg ha−1, N3: 250 kg ha−1, N4: 350 kg ha−1. ETC is crop evapotranspiration. The black vertical bars represent the standard deviation.
Agronomy 14 02439 g004
Figure 5. Effects of different water and nitrogen policies on tomato root characteristics in different soil layers. Different lower-case letters denote significant differences at p < 0.05 among treatments. W1: 50%ETC, W2: 75%ETC, W3: 100%ETC, W4: 125%ETC, N1: 0 kg ha−1, N2: 150 kg ha−1, N3: 250 kg ha−1, N4: 350 kg ha−1. ETC is crop evapotranspiration. The black vertical bars represent the standard deviation.
Agronomy 14 02439 g005
Figure 6. The proportion of root characteristics in each soil layer. Different lower-case letters denote significant differences at p < 0.05 among treatments. W1: 50%ETC, W2: 75%ETC, W3: 100%ETC, W4: 125%ETC, N1: 0 kg ha−1, N2: 150 kg ha−1, N3: 250 kg ha−1, N4: 350 kg ha−1. ETC is crop evapotranspiration. The black vertical bars represent the standard deviation.
Agronomy 14 02439 g006
Figure 7. Fruit yield of tomato in different water and nitrogen treatments. The number before * is F value from the factor analysis. ** indicate significant differences at the level of p < 0.01. Different lower-case letters denote significant differences at p < 0.05 among treatments. W1: 50%ETC, W2: 75%ETC, W3: 100%ETC, W4: 125%ETC, N1: 0 kg ha−1, N2: 150 kg ha−1, N3: 250 kg ha−1, N4: 350 kg ha−1. ETC is crop evapotranspiration. The black vertical bars represent the standard deviation. (A) Summer; (B) Autumn.
Agronomy 14 02439 g007
Figure 8. Water use efficiency of tomato in different water and nitrogen treatments. The number before * is F value from the factor analysis. ** indicate significant differences at the level of p < 0.01. Different lower-case letters denote significant differences at p < 0.05 among treatments. W1: 50%ETC, W2: 75%ETC, W3: 100%ETC, W4: 125%ETC, N1: 0 kg ha−1, N2: 150 kg ha−1, N3: 250 kg ha−1, N4: 350 kg ha−1. ETC is crop evapotranspiration. The black vertical bars represent the standard deviation. (A) Summer; (B) Autumn.
Agronomy 14 02439 g008
Figure 9. Correlation of root characteristics with fruit yield and water use efficiency. RL1: root length belong to the 0–10 cm soil layer, RS1: root surface area belong to the 0–10 cm soil layer, RV1: root volume belong to the 0–10 cm soil layer, RL2: root length belong to the 10–20 cm soil layer, RS2: root surface area belong to the 10–20 cm soil layer, RV2: root volume belong to the 10–20 cm soil layer, RL3: root length belong to the 20–30 cm soil layer, RS3: root surface area belong to the 20–30 cm soil layer, RV3: root volume belong to the 20–30 cm soil layer, PRL1: Radio of root length belong to the 0–10 cm soil layer to total root length, PRS1: Radio of root surface area belong to the 0–10 cm soil layer to total root surface, PRV1: Radio of root volume belong to the 0–10 cm soil layer to total root volume, PRL2: Radio of root length belong to the 10–20 cm soil layer to total root length, PRS2: Radio of root surface area belong to the 10–20 cm soil layer to total root surface, PRV2: Radio of root volume belong to the 10–20 cm soil layer to total root volume, PRL3: Radio of root length belong to the 20–30 cm soil layer to total root length, PRS3: Radio of root surface area belong to the 20–30 cm soil layer to total root surface, PRV3: Radio of root volume belong to the 20–30 cm soil layer to total root volume, GY: fruit yield, WUE: water use efficiency. (A) 2023 Summer (B) 2023 Autumn.
Agronomy 14 02439 g009
Table 1. Randomized Block Split-Plot Design Table.
Replication IReplication IIReplication III
W1W2W3W4W1W2W3W4W1W2W3W4
N4N1N3N2N2N2N1N3N4N4N1N3
N2N3N2N1N1N3N3N2N3N2N2N2
N1N4N1N4N4N1N4N4N2N1N3N1
N3N2N4N3N3N4N2N1N1N3N4N4
Disclaimer/Publisher’s Note: The statements, opinions and data contained in all publications are solely those of the individual author(s) and contributor(s) and not of MDPI and/or the editor(s). MDPI and/or the editor(s) disclaim responsibility for any injury to people or property resulting from any ideas, methods, instructions or products referred to in the content.

