Article

Non-Destructive Measurement of Rice Spikelet Size Based on Panicle Structure Using Deep Learning Method

1
School of Mechanical Engineering, Guangdong Ocean University, Zhanjiang 524088, China
2
Guangdong Engineering Technology Research Center of Ocean Equipment and Manufacturing, Zhanjiang 524088, China
3
School of Civil and Transportation Engineering, Guangdong University of Technology, Guangzhou 510006, China
*
Author to whom correspondence should be addressed.
Agronomy 2024, 14(10), 2398; https://doi.org/10.3390/agronomy14102398
Submission received: 14 August 2024 / Revised: 2 October 2024 / Accepted: 5 October 2024 / Published: 17 October 2024
(This article belongs to the Special Issue Advanced Machine Learning in Agriculture)

Abstract

:
Rice spikelet size, spikelet length and spikelet width, are very important traits directly related to a rice crop’s yield. The accurate measurement of these parameters is quite significant in research such as breeding, yield evaluation and variety improvement for rice crops. Traditional measurement methods still mainly rely on manual labor, which is time-consuming, labor-intensive and error-prone. In this study, a novel method, dubbed the “SSM-Method”, based on convolutional neural network and traditional image processing technology has been developed for the efficient and precise measurement of rice spikelet size parameters on rice panicle structures. Firstly, primary branch images of rice panicles were collected at the same height to build an image database. The spikelet detection model using convolutional neural network was then established for spikelet recognition and localization. Subsequently, the calibration value was obtained through traditional image processing technology. Finally, the “SSM-Method” integrated with a spikelet detection model and calibration value was developed for the automatic measurement of spikelet sizes. The performance of the developed SSM-Method was evaluated through testing 60 primary branch images. The test results showed that the root mean square error (RMSE) of spikelet length for two rice varieties (Huahang15 and Qingyang) were 0.26 mm and 0.30 mm, respectively, while the corresponding RMSE of spikelet width was 0.27 mm and 0.31 mm, respectively. The proposed algorithm can provide an effective, convenient and low-cost tool for yield evaluation and breeding research.

1. Introduction

Rice spikelet size is one of the main components for rice crop yields, as well as being a key agronomic trait for rice breeding [1,2]. Spikelet size is also a very important trait in determining rice quality [3,4]. Spikelet size is mainly under the polygenic control of the spikelet’s length and width [5]. In addition to breeding programs, rice research fields such as genetics, functional analysis and genomics-assisted crop improvement can also benefit from the quantitative assessment of spikelet lengths and widths. Therefore, information on spikelet lengths and spikelet widths is of great significance [6].
The traditional method of measuring a spikelet’s size mainly relies on manual labor, such as using calipers or micrometers [7], but this method is time-consuming, labor-intensive, error-prone and low in accuracy [8,9,10]. Therefore, it is imperative to develop a novel method for the efficient and precise measurement of spikelet lengths and spikelet widths.
Existing research on seed size measurement taking based on traditional image processing methods have made great progress; examples include the ImageJ [11], SmartGrain [12], GrainScan [13], Museed [14] and GridFree [9]. Moreover, researchers [15] have used blacklight image processing technology for rice grain size measurement taking and filled/unfilled grain detection. Although these methods have been developed for seed/grain size measurement taking with reasonable accuracies, they need to be threshed before measurement. The seeds will also be damaged during threshing process, thereby reducing the measurement’s accuracy. Direct measuring spikelet size on the panicle branch before threshing can avoid those deficiencies. However, little research has been done in this area.
Advances in computing power and the availability of large amounts of labeled images have promoted convolutional neural network (CNN)-based machine learning methods in the field of computer vision [16,17]. CNNs currently achieve impressive performances in image detection tasks [18,19]. Therefore, some methods using CNNs have been explored to measure object sizes. Wang et al. utilized a stereo camera system and a deep learning (VGG) method to detect fire regions and accurately measure flame heights [20]. Zhang et al. proposed a particle detection and size measurement algorithm using deep learning with a CNN [21]. Park et al. proposed a structural crack detection and quantification method using deep learning and a structured light [22]. Zhang et al. proposed a CNN-based algorithm for measuring the size distribution of microfluid droplets [23]. The aforementioned studies demonstrate that CNN-based image analysis holds great promises for accurately and efficiently detecting and measuring rice spikelet sizes. However, none of the above studies are aimed at measuring spikelet sizes of rice panicles. There is an urgent need for the development of an intelligent system that automatically measures the size of rice spikelets based on panicle structures.
The main objectives of this research were to: (a) establish a spikelet detection model using a convolutional neural network; (b) measure pixel sizes per mm under the fixed shooting height using traditional image process technology; (c) develop the spikelet size measurement method through integrating the spikelet detection model and pixel value per mm; and (d) evaluate the measurement stability and accuracy of the proposed method.

2. Materials and Methods

The spikelet detection and size measurement method, dubbed Spikelet Size Measurement Method (SSM-Method), proposed in this study is shown in Figure 1. The improved Faster R-CNN [24] object detection network and traditional image processing algorithm were used as the main framework to achieve the accurate measurement of spikelet sizes under the lighting box environment. The main process is as follows: Firstly, the improved Faster R-CNN network was used to recognize and locate the spikelet on the panicle branch structure. Subsequently, the traditional image processing method was taken to calculate the pixel size per millimeter of the image at the same height. Finally, based on the obtained spikelet position information, the actual size of spikelet was calculated using the pixel size per millimeter. The SSM-Method can not only automatically detect the rice spikelet on the panicle branch structure, but also intelligently measure seed length and width.

2.1. Materials and Dataset

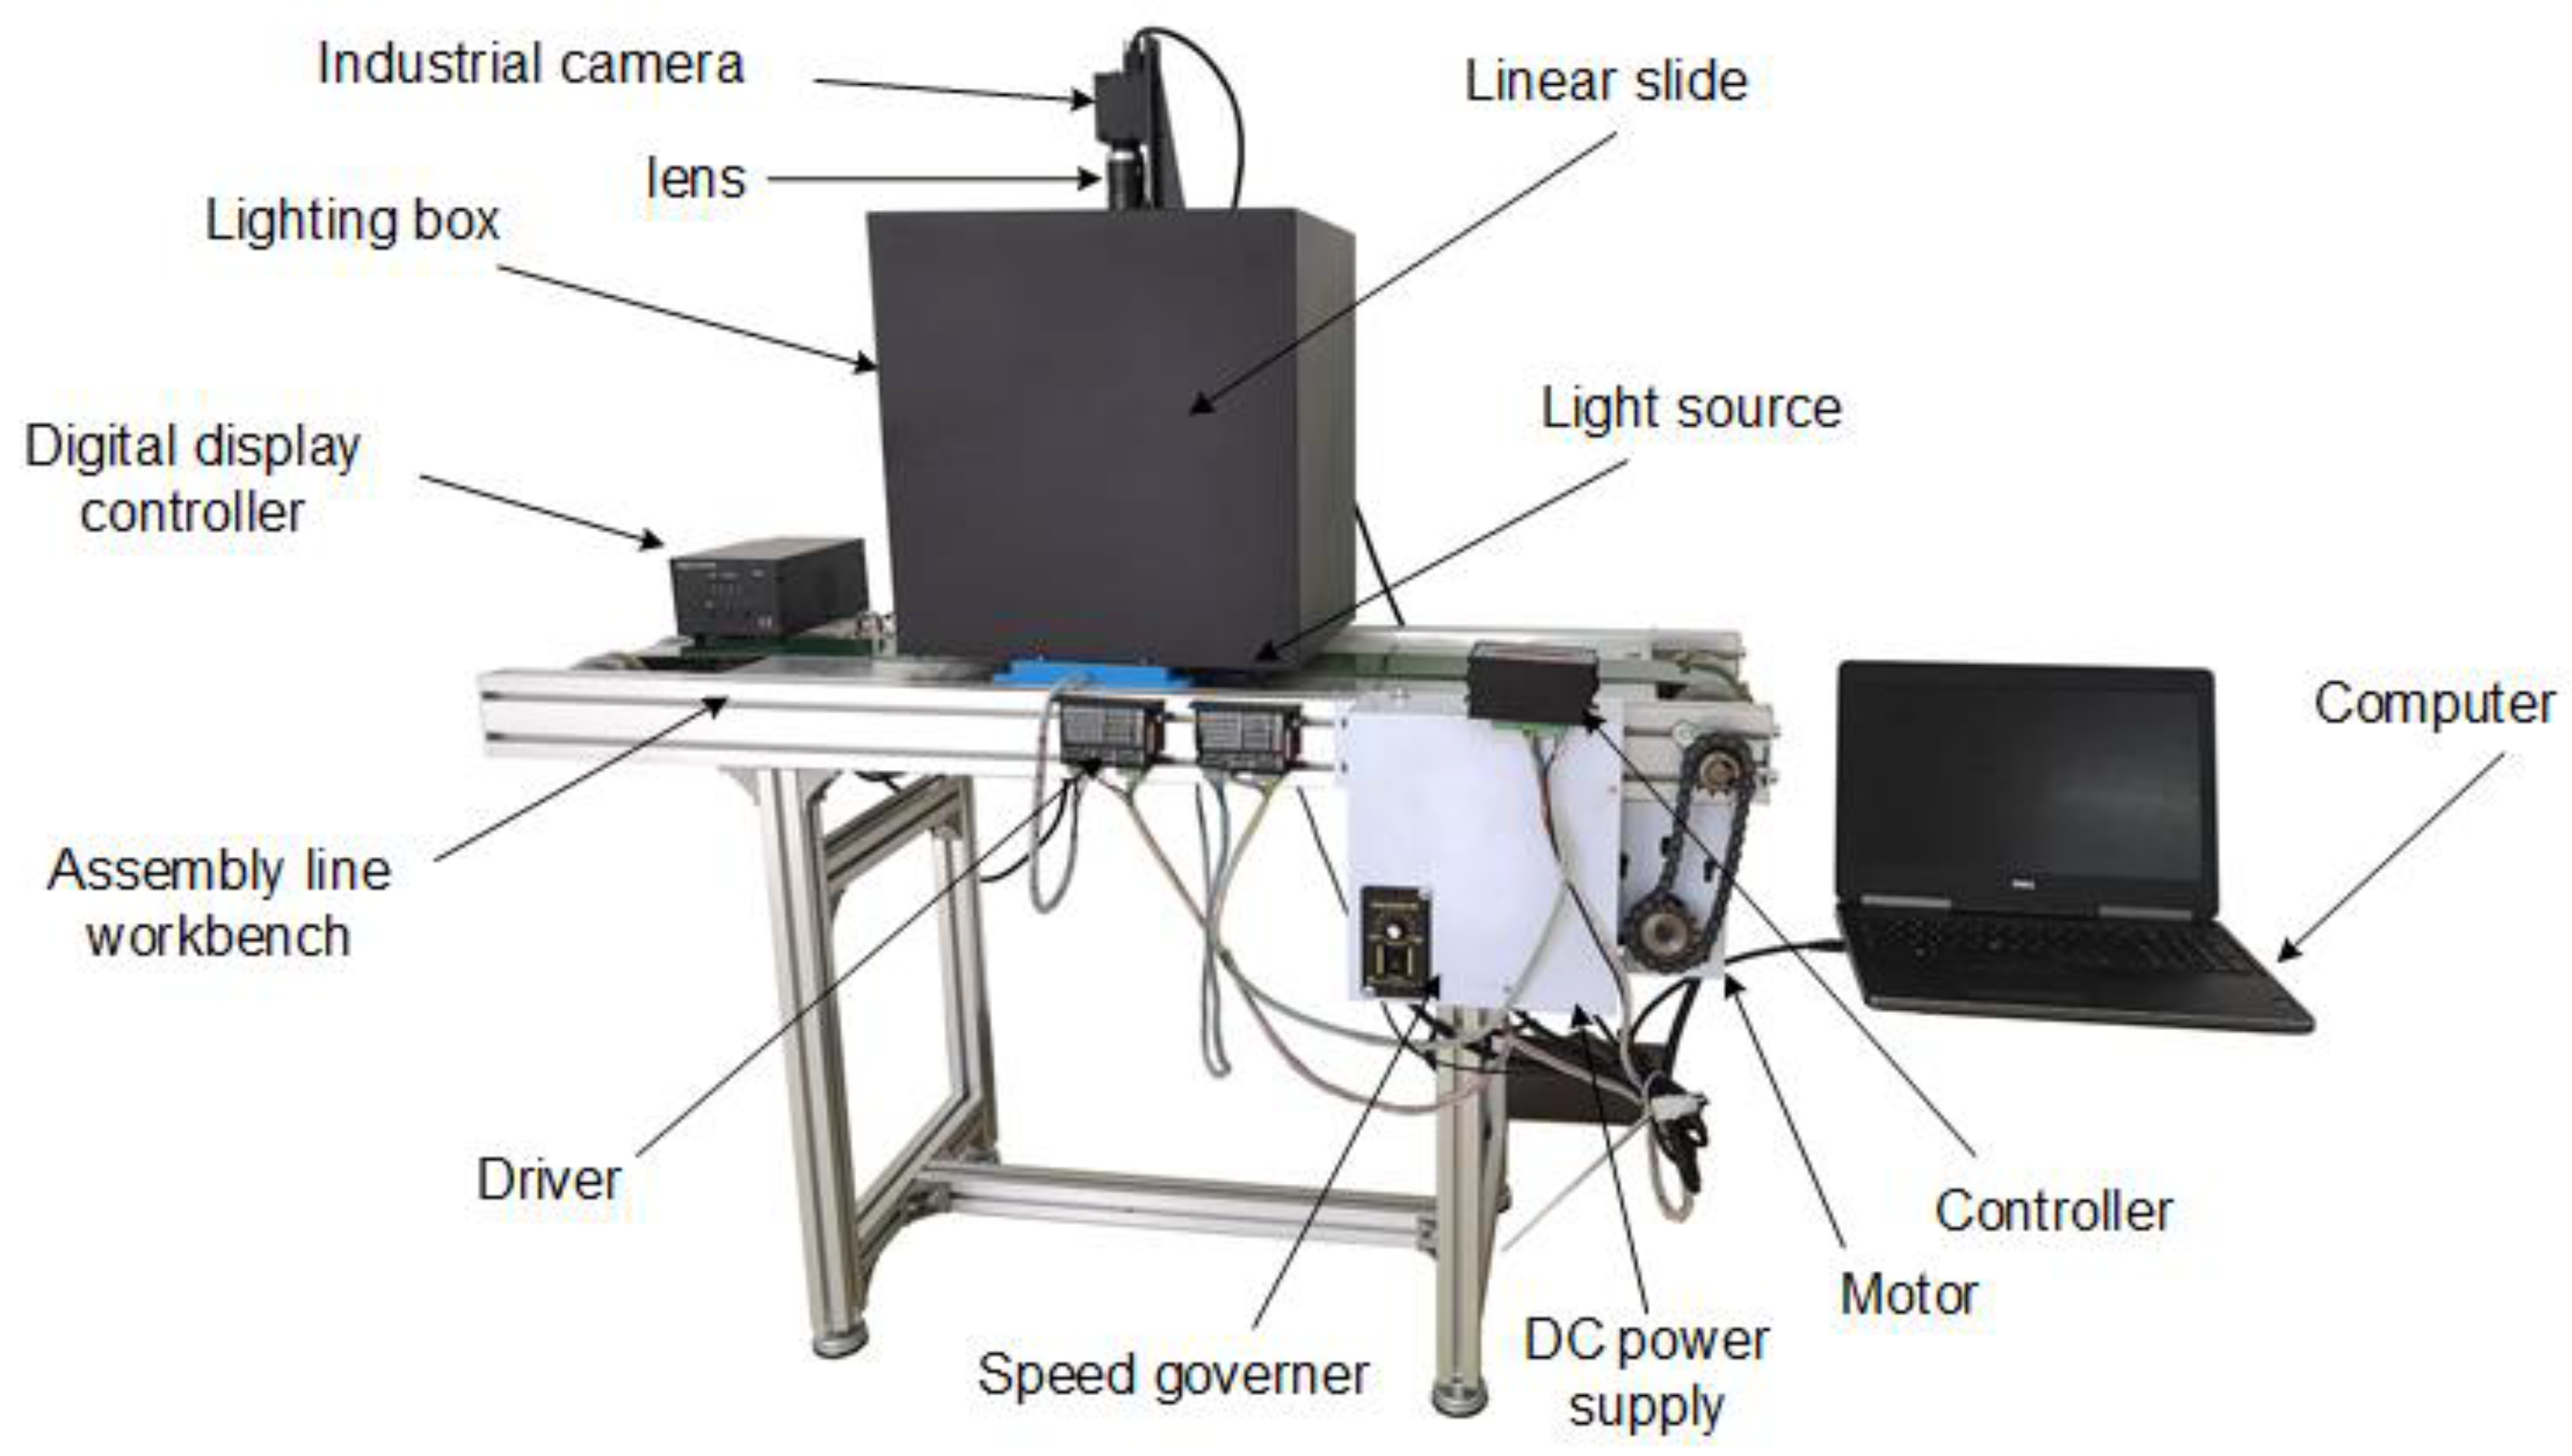
2.1.1. Description of Image Collecting Equipment
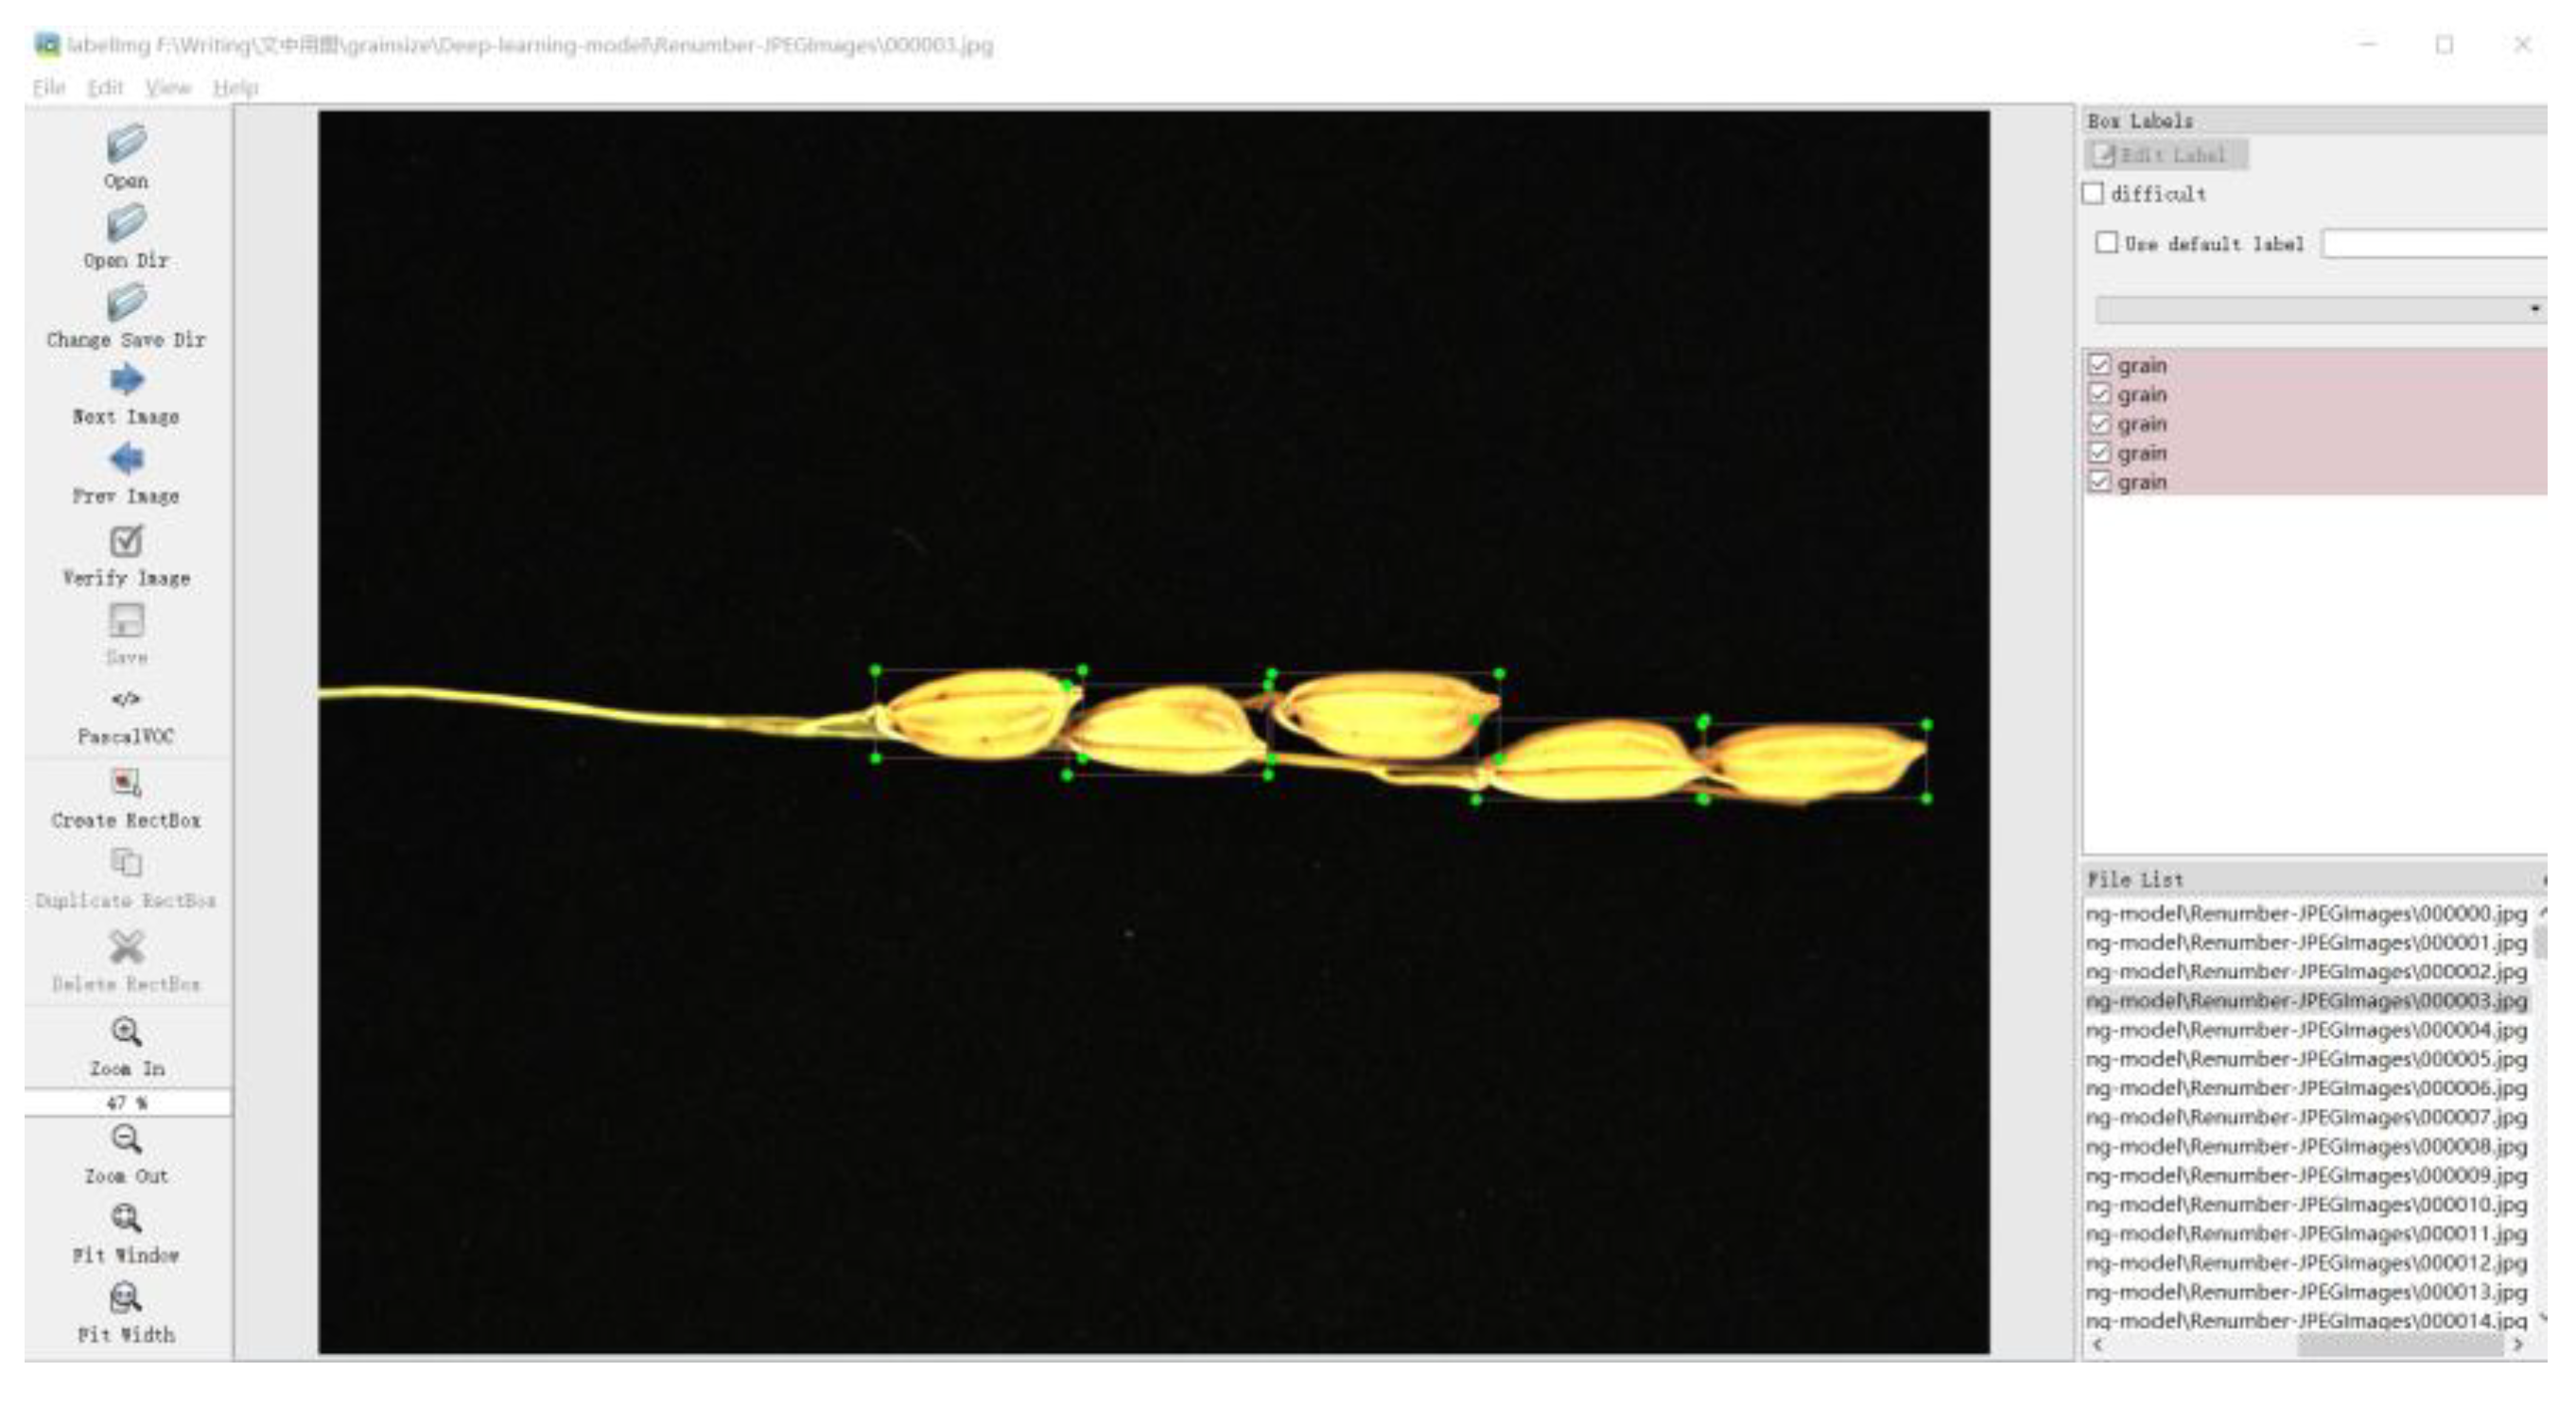
To automatically measure rice spikelet sizes on the panicle branches using a deep learning method, a lighting box embedded with an industrial camera and LED lens was used to collect the images of rice panicle branches under a fixed height. The image collecting equipment used in this study is shown in Figure 2. The collecting equipment consisted of an industrial camera (MV-CE200-10UC, Hikvision, Hangzhou, China) equipped with a short-focus lens (CST-D1628-20M-lens, Hikvision, China), a lighting box, an assembly line workbench, a sample presentation board and a computer workstation. The lighting box was equipped with four LED lamps and a digital display controller. The assembly line workbench was equipped with a conveyor belt, driver, speed regulator, DC power supply, motor and controller. To make the rice spikelet photographing process closer to a real-world situation, four LED lamps and white diffuse reflection paint were used to ensure uniform lighting. To show the spikelet on the rice panicle branch as clearly as possible, the sample presentation board was also painted black. The industrial camera was mounted on the lighting box panel, parallel to the conveyor belt. Furthermore, these details of image collection equipment can be seen in our previously published article [25]. The specifications for the industrial camera and lens are shown in Table 1 and Table 2, respectively.
The image collection steps and the parameter settings during the image collection process were as follows: The image collection process can be divided into five steps. Firstly, the assembly line workbench and lighting box controller were started. Subsequently, the rice panicles were divided into panicle branches and placed on the sample presentation board, which was placed at the entrance of conveyor belt. When the sample presentation board was transferred to a position below the industrial camera, it was lifted to a pre-set height by the linear slider and then stopped. Next, the startup software of industrial camera in the computer workstation was enabled to collect the image of the rice panicle branch. Finally, the sample presentation board was lowered by the linear slider and then transferred to the outlet by conveyor belt. Among them, the lifting height of lifting mechanism was 330 mm, the vertical distance between the industrial camera and rice spikelets was 72 mm, the residence time of lifting plate was 6 s, the conveying speed of conveyor belt was first gear and the brightness of digital controller was 186. The final collected images of the rice panicle branches in the lighting box is shown in Figure 3.

2.1.2. Image Set

Rice panicle samples were harvested in a paddy field, which was located at the Institute of Agricultural Sciences in Jiangmen, Guangdong province, China (22°34′49.404″ N, 113°4′48.036″ E). Since there are many overlapping spikelets on the whole rice panicle and not all spikelets are parallel to the long side of the sample presentation board, it is not conducive to the measurement of spikelet sizes. In addition, the spikelets on the panicle branch are arranged in the same direction and parallel to the long side of the sample presentation board, which is conducive to size determination. Therefore, the images of rice panicle branches were collected in this study to measure spikelet sizes on the panicle structure. The preparation of the rice panicle branch samples before image acquisition was as follows: Firstly, the rice panicle samples were harvested from a rice paddy field with a sickle. Then, the rice panicles were divided into panicle branches to be passed into the lighting box for photography. A total of 478 panicle branch images were collected, including two rice varieties, Qingyang and Huahang 15. These two rice varieties were chosen because of the obvious differences in morphological characteristics of their spikelets. The spikelet shape of Huahang 15 is slender (Figure 3a), while that of Qingyang is relatively shorter and oval shaped (Figure 3b). Among them, the image numbers of Qingyang and Huahang panicle branches were 252 and 226, respectively. Moreover, to test the accuracy of the SSM-Method, another 30 images of rice panicle branches for Huahang 15 and Qingyang rice varieties were collected for the experiment. The resolution of panicle branch images was 2688 pixels × 2000 pixels.

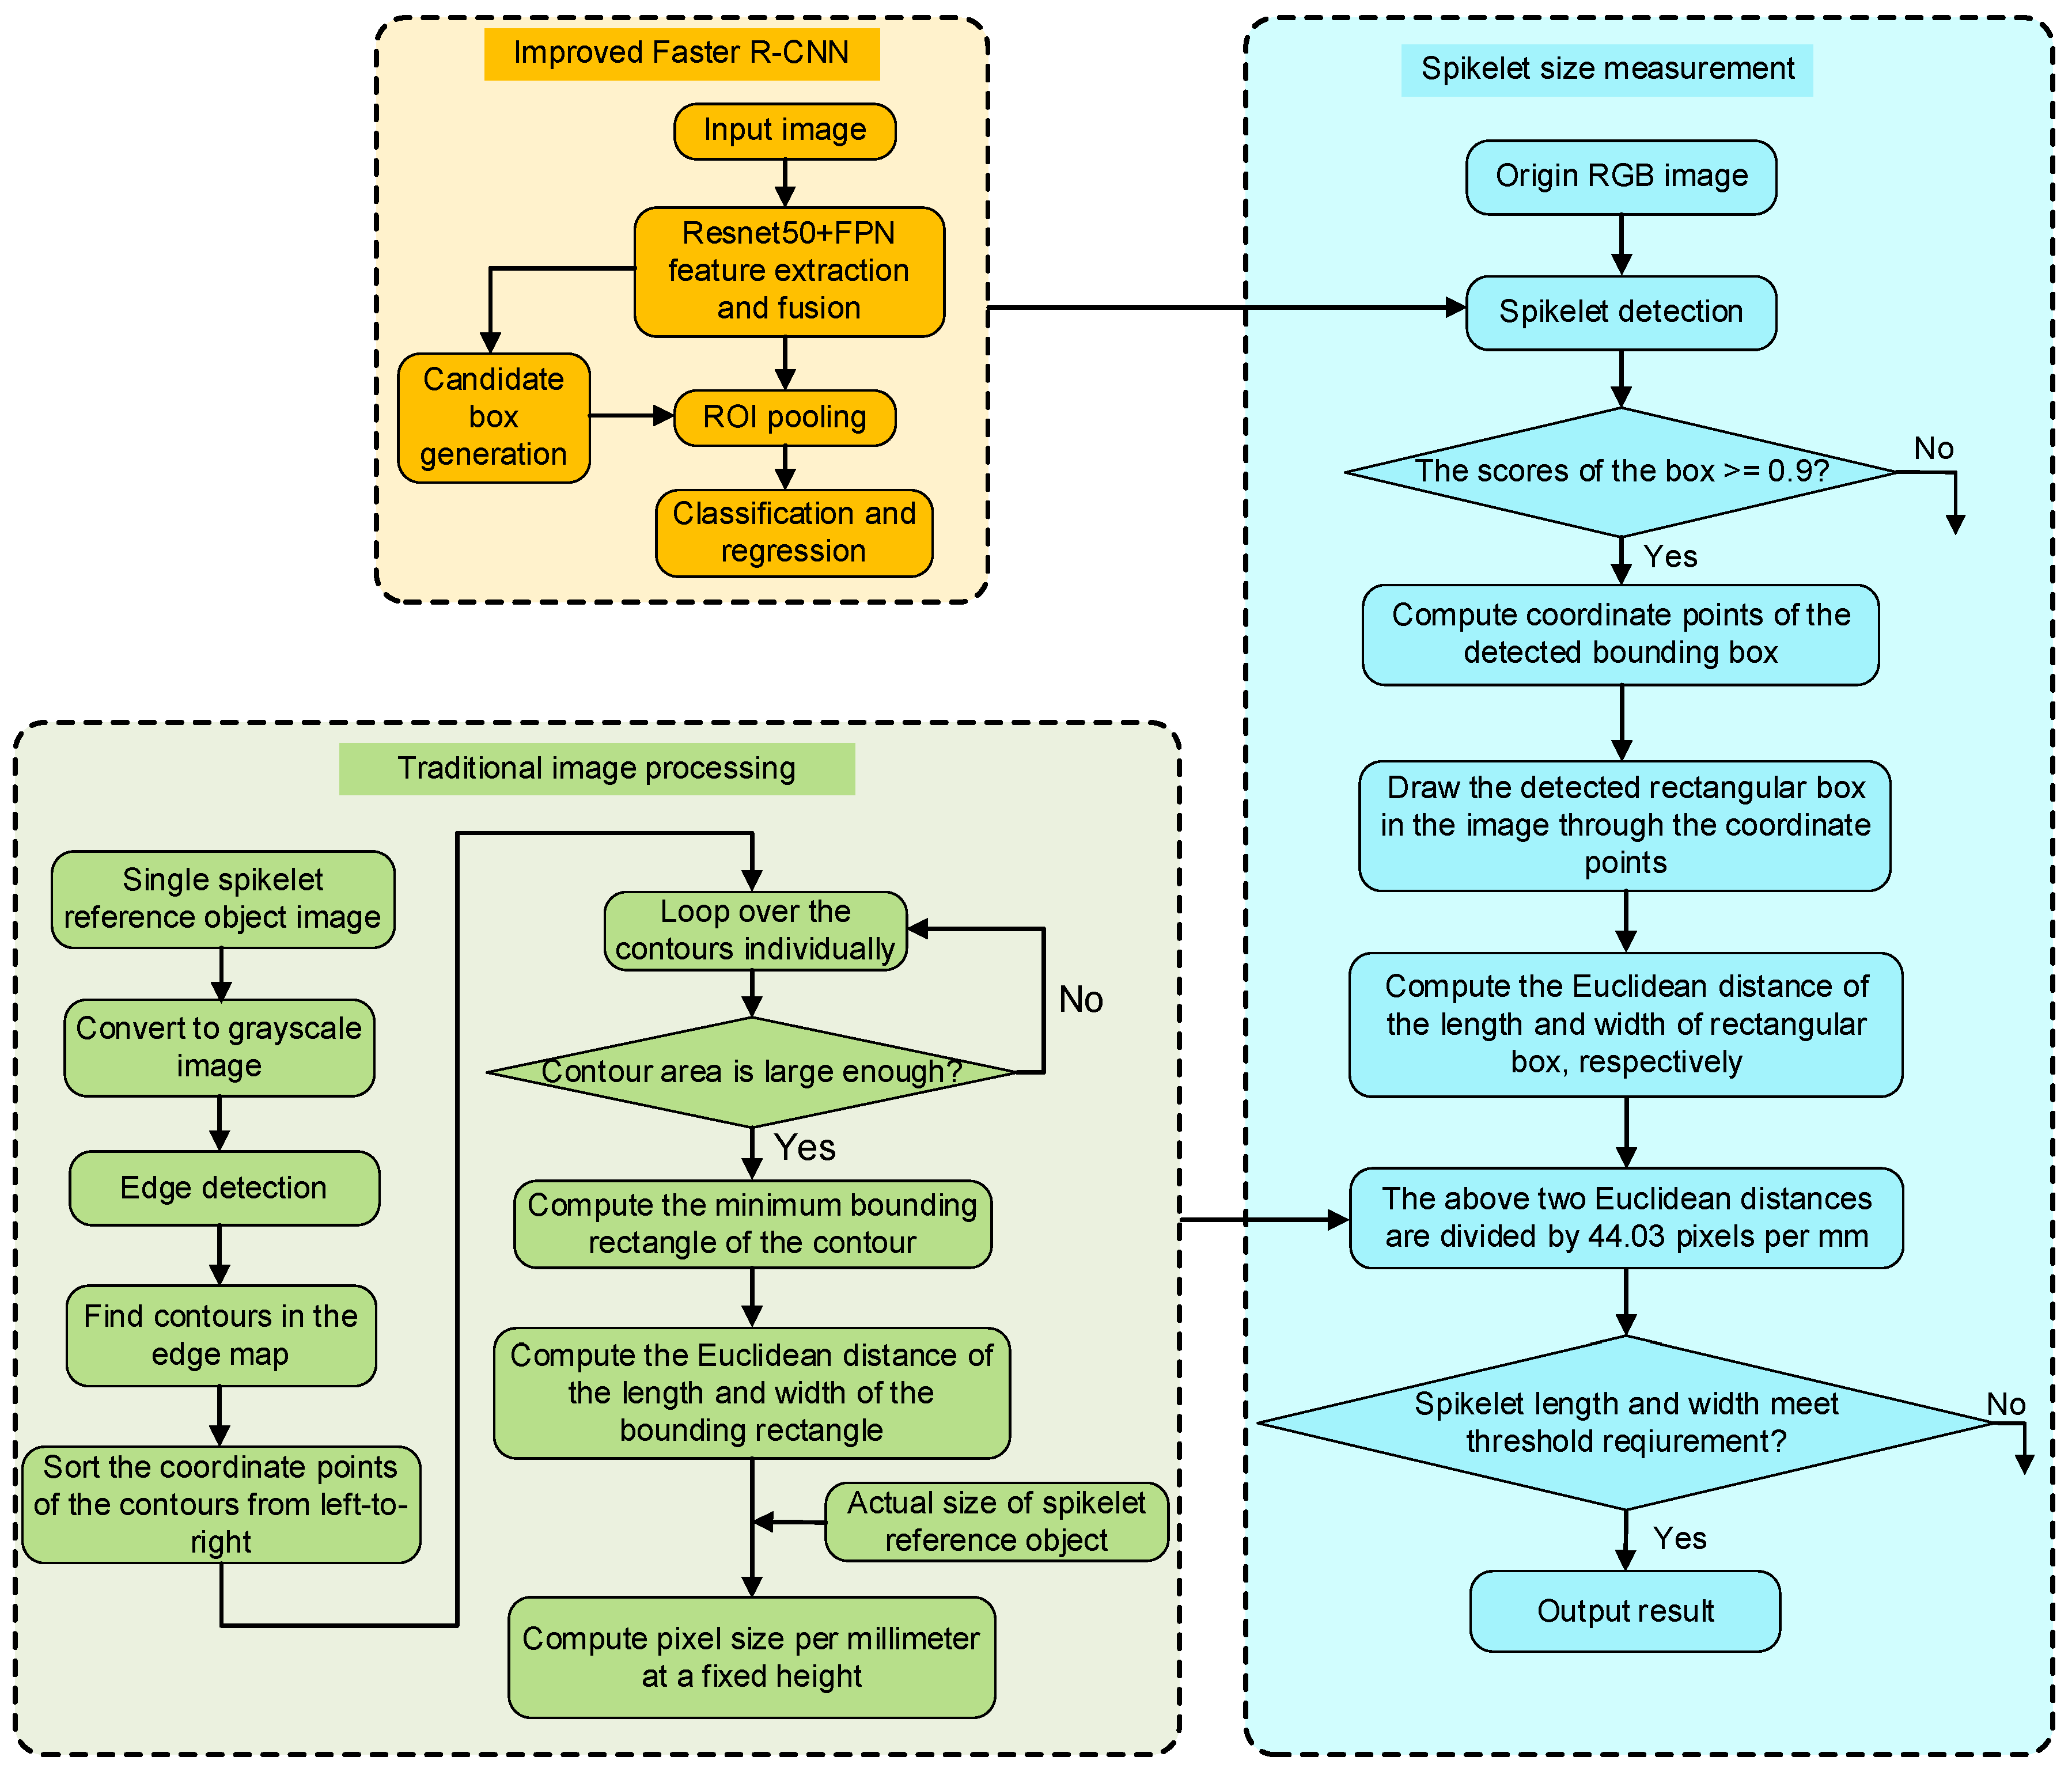
2.2. Spikelet Size Measurement Method

2.2.1. Image Preprocessing

The spikelet detection task based on deep learning relied on labeled data, so it was necessary to label the precise area containing spikelet in the collected panicle branch images. As shown in Figure 4, the LabelImg Open-Source software (v4.5.3) [26] was used to label the bounding box around spikelet, and the labeling format was PASCAL VOC. The PASCAL VOC annotation format consists of four values: the abscissa and ordinate of the upper-left and lower-right corners of bounding box. After the annotation was completed, the coordinates of the upper-left and lower-right corners of the bounding box and spikelet label would be stored in an XML document.
To improve the accuracy of the SSM-Method for the automatic measurement of rice spikelet sizes, the spikelets with special cases were not annotated in this study. Special cases included spikelets in a slanted position (Figure 5a), spikelets that had a narrow side up (Figure 5b) and spikelets that were mostly shaded at one end (Figure 5c). When the spikelet length direction deviates too much from the abscissa direction of the image, the measured spikelet length will be smaller than the actual value. The spikelet width with the wide side up is the true spikelet width. So, when the narrow side of spikelet faces up, the measured spikelet width will be less than the true value. Also, when most of the area at one end of the spikelet is shaded too much, the spikelet length will be smaller than the actual spikelet length. Finally, the collected 478 images were randomly separated into the training, validation and testing sub-sets with the ratio to the total images being 0.56, 0.24, and 0.2, respectively.

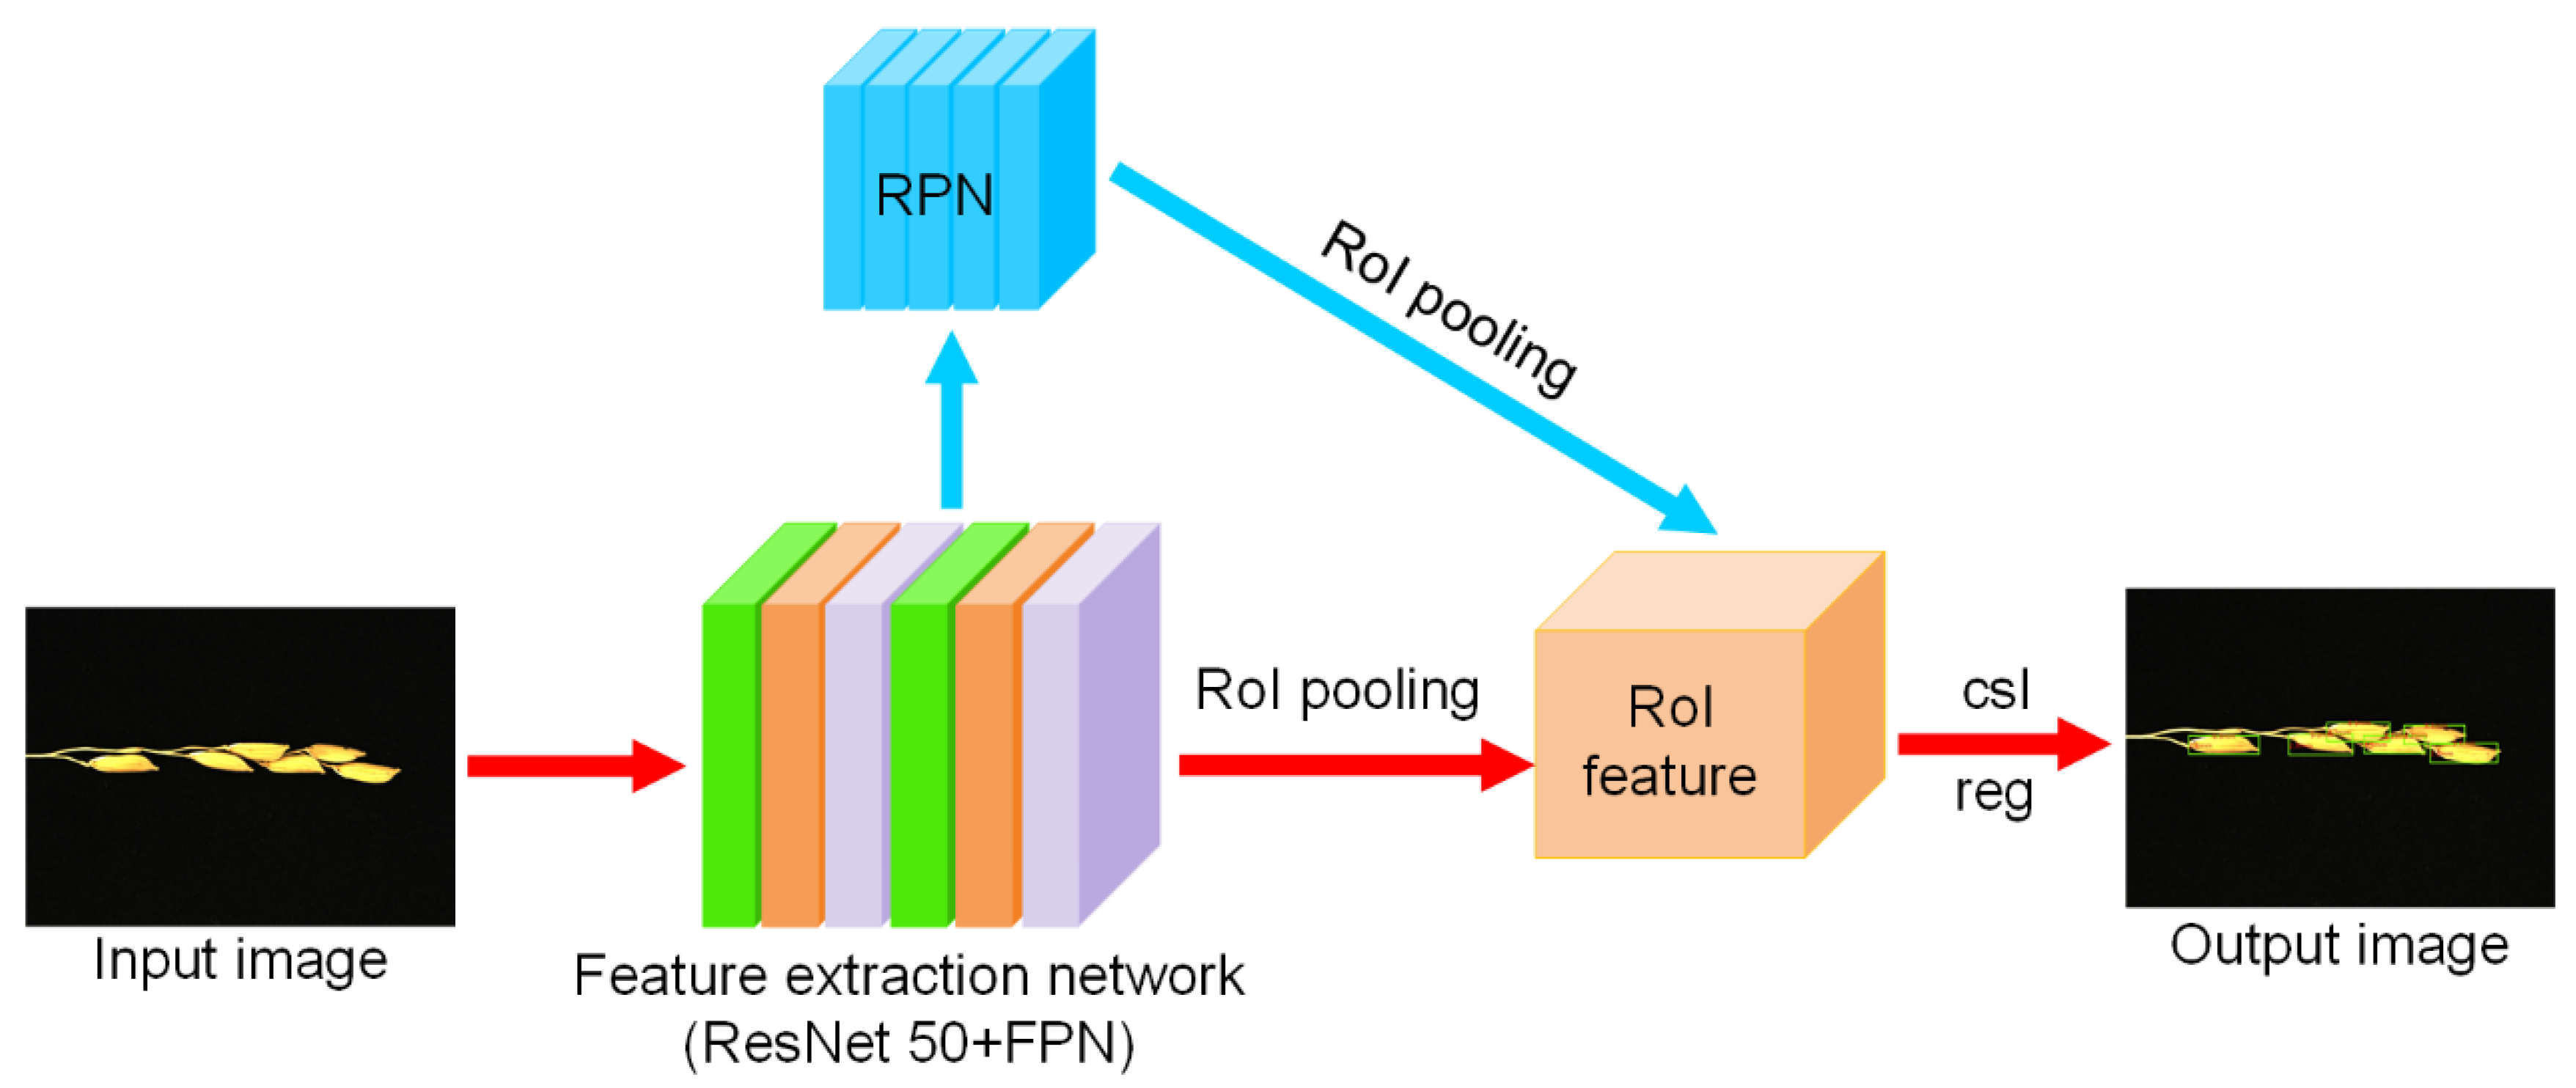
2.2.2. Spikelet Detection with Faster R-CNN

The object detection algorithm based on deep learning can be divided into two types: the single-stage and the multi-stage object detection algorithm according to the generation of candidate frames. The single-stage object detection network represented by YOLO [27], and SSD [28], etc. is characterized by fast detection speed, but has slightly lower detection accuracy. Faster R-CNN belongs to the representative of the multi-stage object detection network, which is characterized by a low recognition error rate and a low miss recognition rate. In this study, the detection accuracy of spikelet was required to be high, so it was reasonable to choose the Faster R-CNN network model to realize the recognition and location of spikelets.
Since a single grain occupies a small part of the entire image, the spikelet recognition by Faster R-CNN belongs to small object detection. After multiple pooling of feature extraction, the feature information of spikelets will be significantly weakened. Therefore, the Feature Pyramid Network (FPN) [29] was introduced, as shown in Figure 6. FPN consists of two parts: the first part is the bottom-up process, and the second part is the fusion process of top-down and lateral connection. In the bottom-up process, the CNN network is divided into different stages according to the size of the feature map, and the feature map scale ratio between each stage differs by two. Among them, each stage corresponds to a feature pyramid level, and the last layer of each stage feature is selected as the feature of the corresponding level in the FPN. Through the fusion of multi-layer feature information of different scales, the FPN provides the possibility for the generation of candidate frames and the classification and regression of detection frames, and thus effectively improves the detection accuracy of the Faster R-CNN model.
When there is no overlap between the predicted box and the real box, the value of IoU is 0, resulting in the gradient of optimization loss function being 0, which means that it cannot be optimized. Also, even if the IoU is the same, the predicted bounding box and ground truth bounding box will coincide in different ways, resulting in different detection results. Generalized Intersection over Union (GIoU) [30] is optimized for the problem that IoU cannot reflect the distance between two non-overlapping frames and the alignment of overlapping frames, thereby improving the detection accuracy. The spikelets on the rice panicle branch may overlap, so the GIoU algorithm was introduced to improve the detection accuracy of the spikelet model.
The above two methods were used to optimize the Faster R-CNN network structure and reasoning process. The ResNet 50 was used as the feature extraction network, and the structure of the spikelet detection model is shown in Figure 7. Anchor boxes of different sizes and ratios is used by Faster R-CNN to initialize region proposals. In this study, nine anchors were set, including three aspect ratios (1:1, 1:2 and 2:1) and three scales (8, 16 and 32).

2.2.3. Training of Spikelet Detection Model

The training and validation image subsets separated in Section 2.2.1 were used as an input for transfer learning using a pre-trained ResNet 50 network. The algorithm was implemented in Pytorch, a deep learning framework written in Python, developed primarily at Facebook’s Artificial Intelligence Research Lab (FAIR) and executed on a graphics workstation. The operating environment of the whole experiment was the Ubuntu 16.04 operating system, Anaconda 3, Pytorch 1.5.0, Python 3.6, CUDA 9.0 and Cudnn 7.0. The hardware environment was an Intel R Core TM i7-9700 K equipped with 3.6 GHz × 8 main frequency, 512 GB solid-state drivers, 4 TB mechanical hard drives, 62 GB memory and the graphics card NVIDIA GeForce GTX 1080 Ti with 11 GB. The training processes for the model were done under the conditions with an epoch of 225, a learning rate of 0.001, a momentum of 0.9, and a weight decay of 0.0001. When the loss function converged and stabilized, training was stopped, and the training model was saved.

2.3. Calculation of Unit Pixel Size Based on Traditional Image Processing

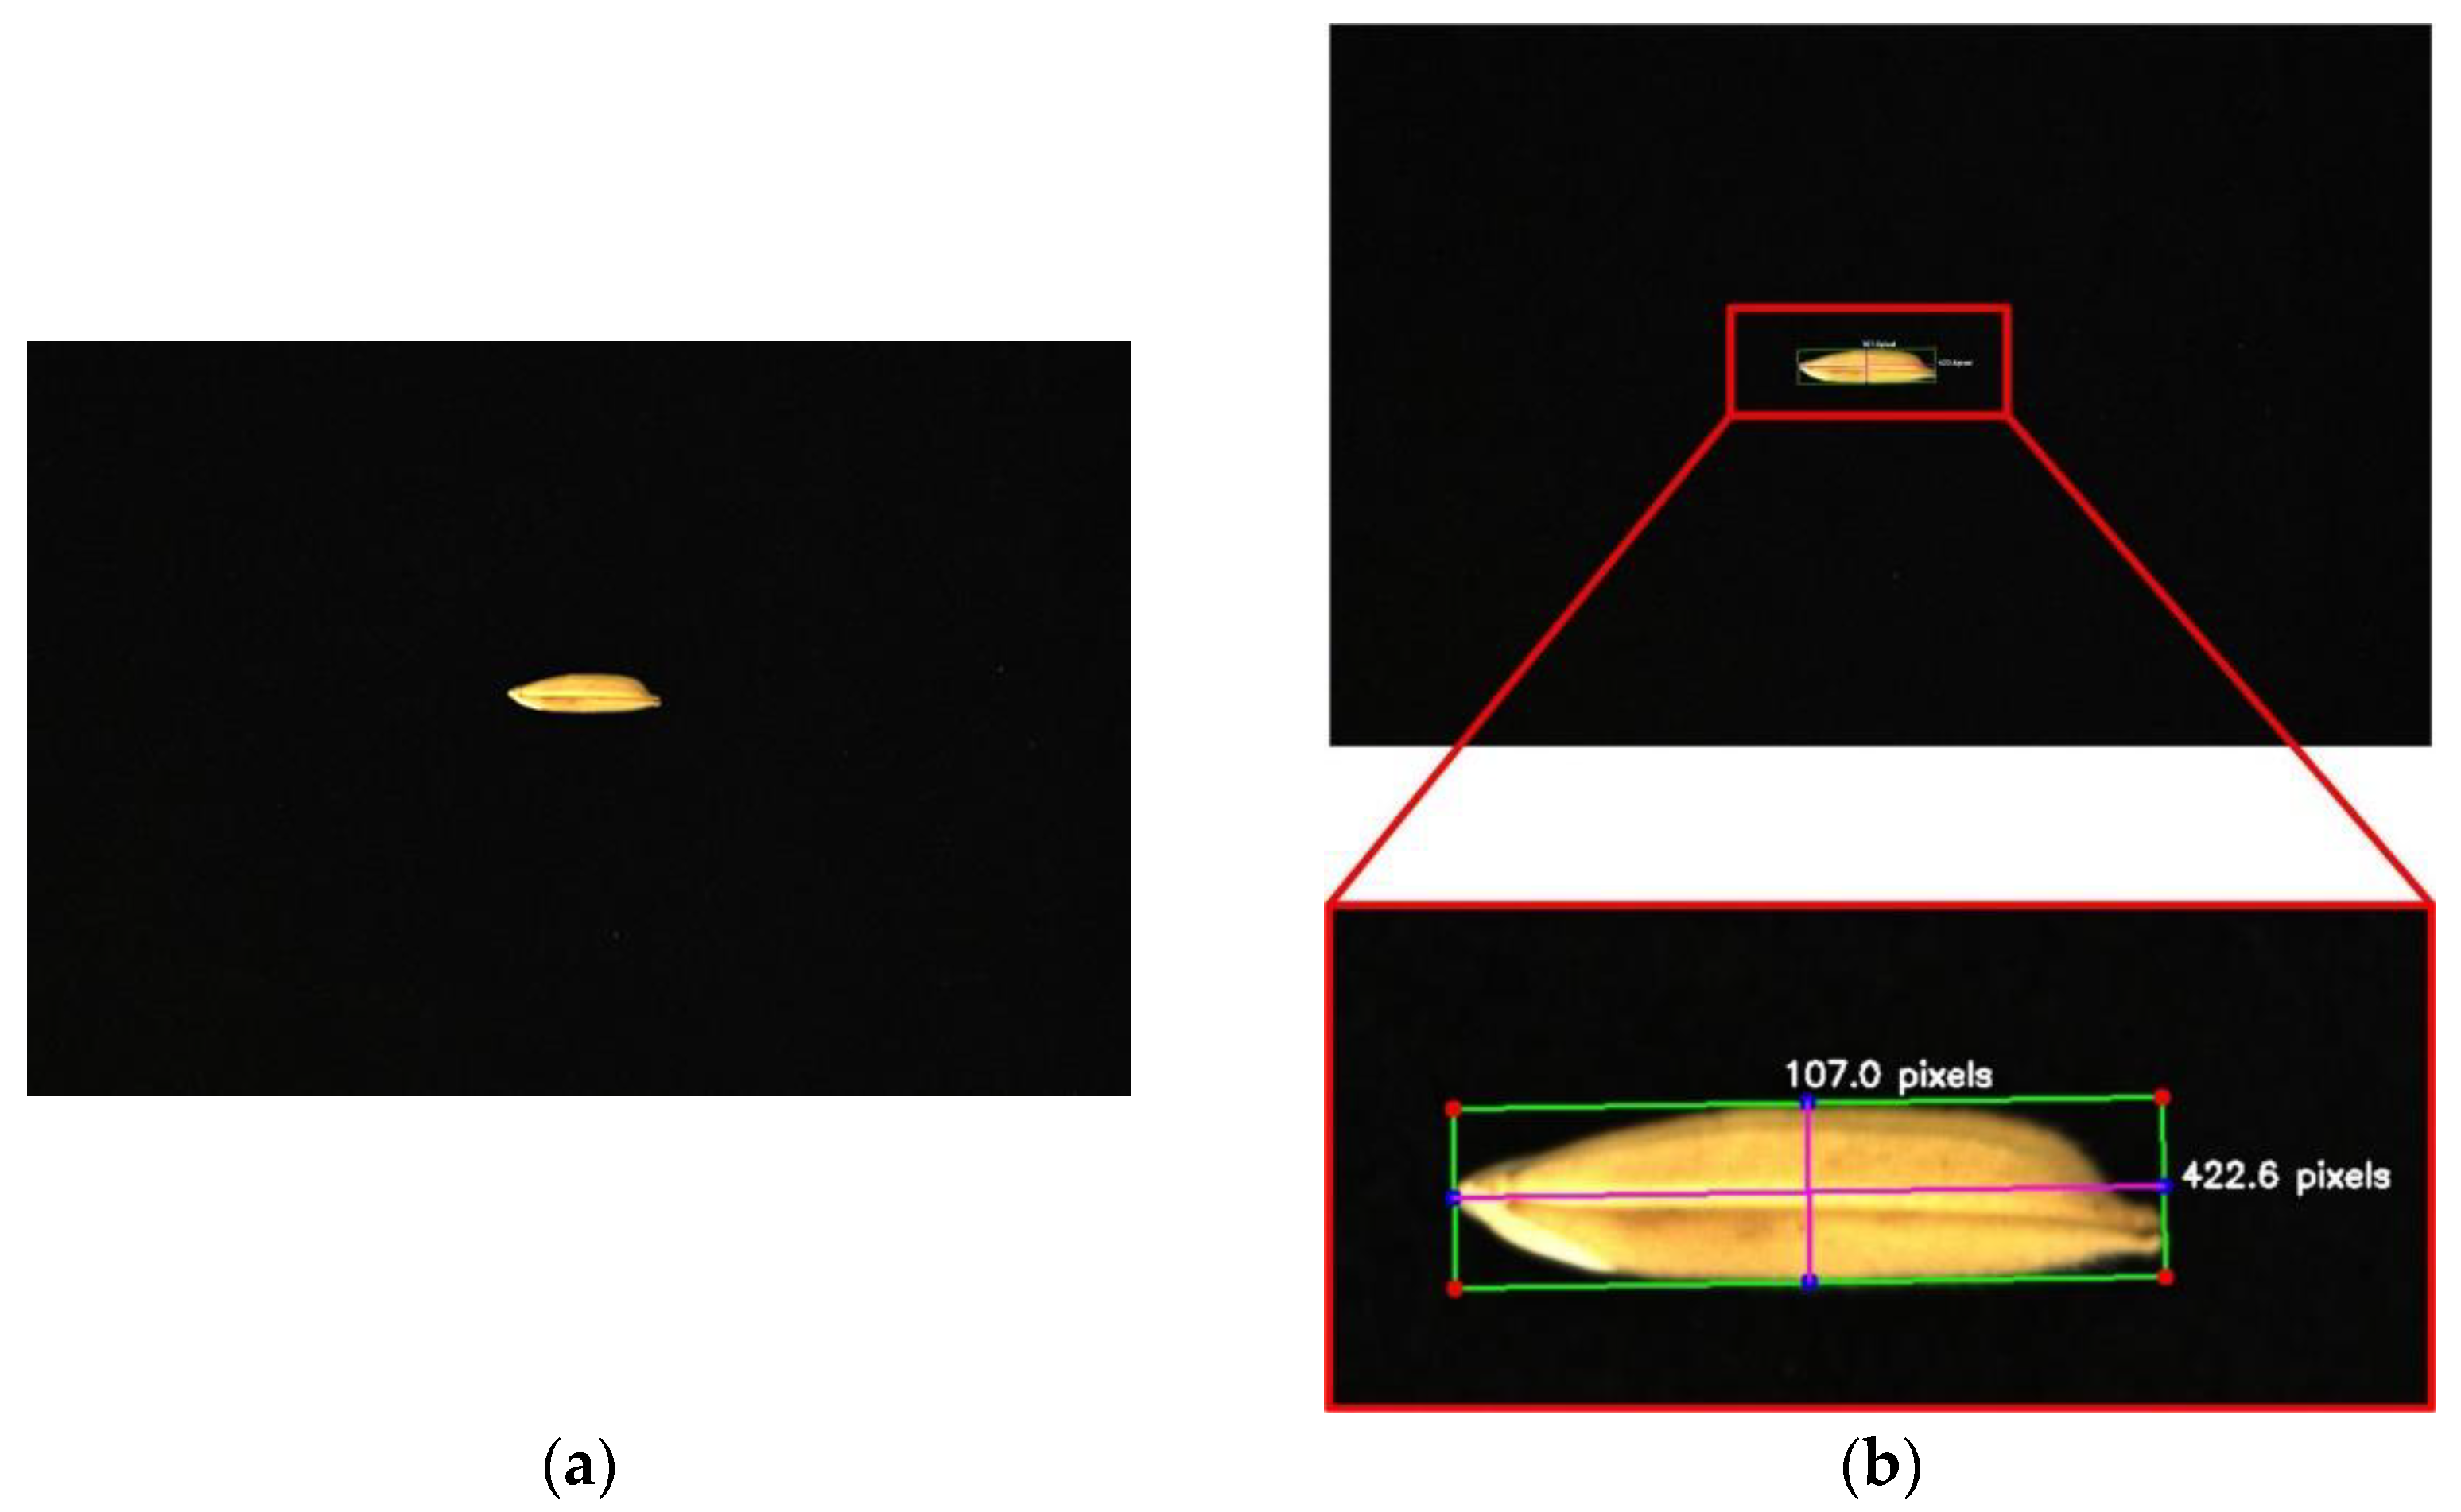
2.3.1. Image Acquisition of Spikelet Reference Object

Since the actual size of the spikelets was measured based on the panicle–branch structure using deep learning, the pixel value of the unit size of the spikelet image at the same height needed to be calculated first. In doing so, a single spikelet was selected as a reference object, where the actual length and width of the spikelet was manually measured by electronic vernier calipers in advance. The image of the single spikelet (Figure 8a) was captured using the equipment described in Section 2.1.1.

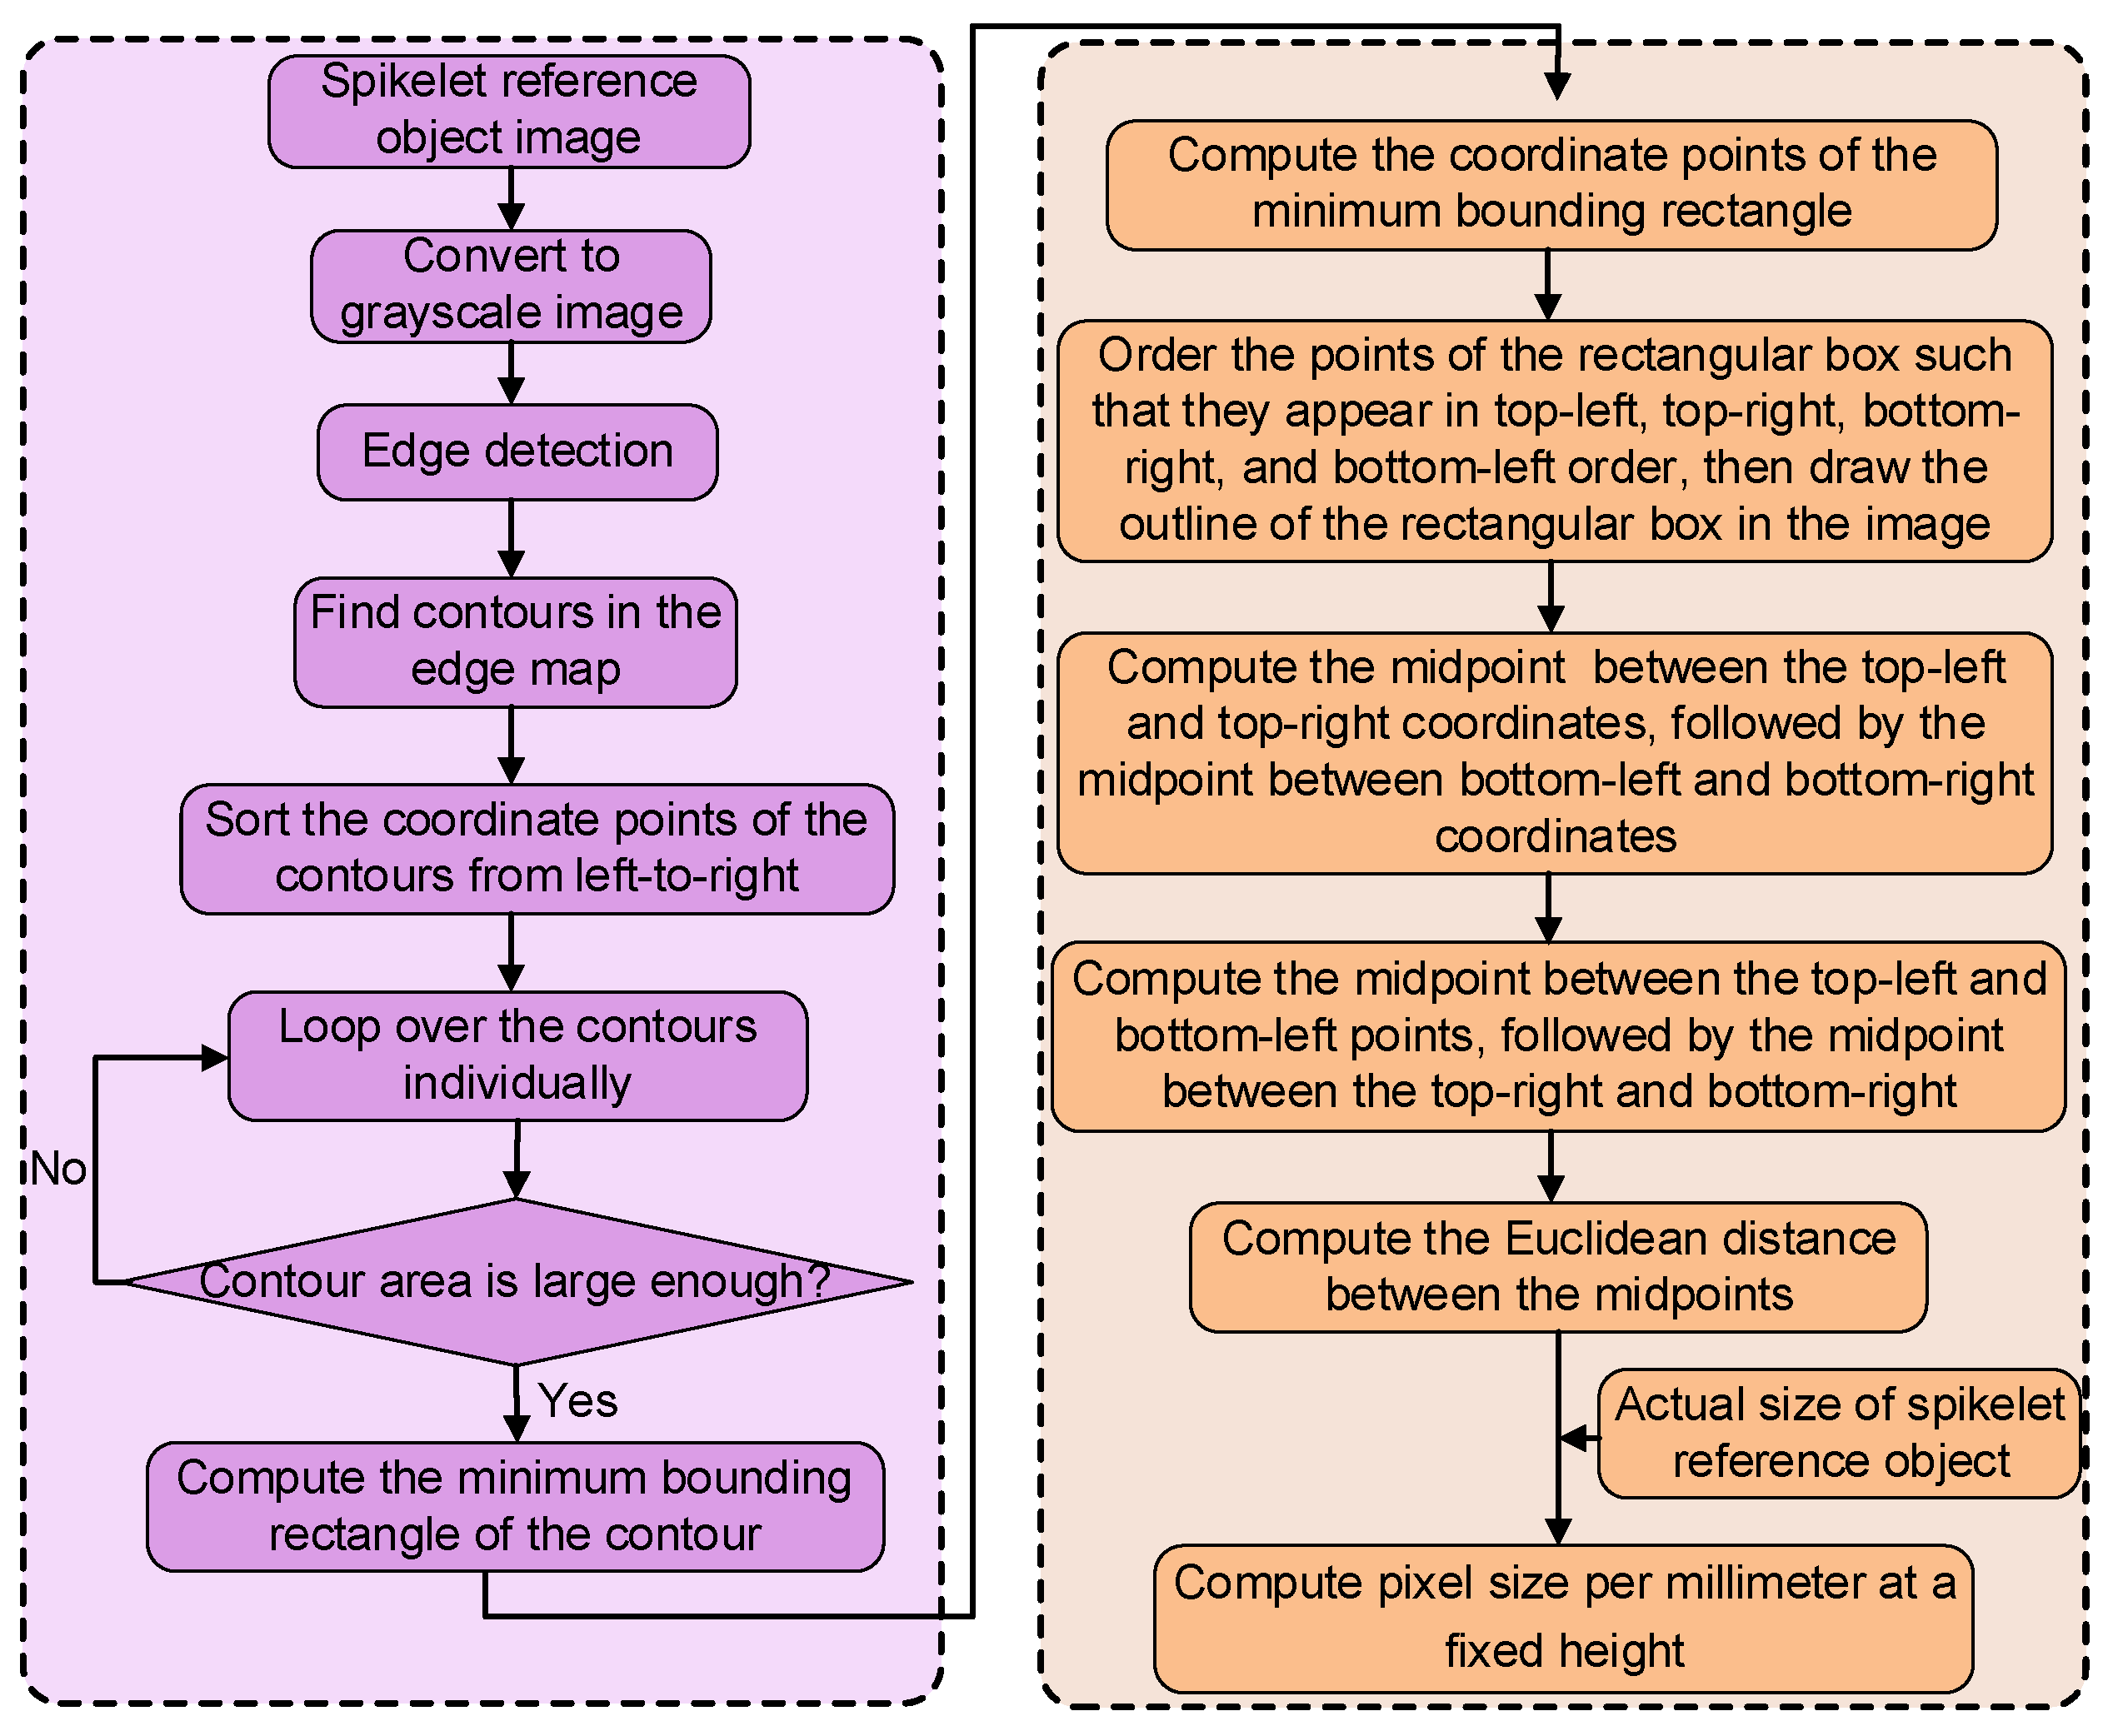
2.3.2. Measurement of Pixel Size for Spikelet Reference Object

The process of measuring the pixel size of the spikelet reference object using traditional image processing methods is shown in Figure 9. The programming language used was Python, and the main algorithms used were Opencv, Numpy, Scipy and Imutils. The specific measurement process (Figure 9) was as follows: Firstly, the RGB image of the spikelet reference object was read by the program and converted into a grayscale image. The Canny operator was used to perform edge detection on the grayscale image. Then, dilation and erosion were performed to close and refine the contours in the edge map. Subsequently, the coordinate points of the contour were sorted from left to right. The contours were looped individually. If the contour area was large enough, the minimum bounding rectangle of contour was computed, otherwise, the previous step was returned to continue. The coordinate points of the minimum bounding rectangle were computed and sorted in the order of upper left, upper right, lower right and lower left. The minimum bounding rectangle of the contour was drawn on the image. The midpoint between the upper-left and upper-right coordinates of the minimum bounding rectangle and the midpoint between the lower-left and lower-right coordinates of the minimum bounding rectangle were calculated. The midpoint between the upper-left and lower-left coordinates of the minimum bounding rectangle and the midpoint between the upper-right and lower-right coordinates of the minimum bounding rectangle were calculated. The midpoints and the lines between midpoints were respectively plotted on the image (Figure 8b). Finally, the Euclidean distances between the midpoints were calculated.
The calculated pixel size of the spikelet reference object is shown in Figure 8b. Figure 8b shows that the yellow spikelet was surrounded by a green rectangular frame, which was essentially the minimum bounding rectangle of the spikelet. Also, the four red points in the figure show the coordinate points of the minimum bounding rectangle. The four blue points show the midpoints of the four sides of the minimum bounding rectangle. The Euclidean distance between the purple lines connecting the upper and lower midpoints in Figure 8b was the spikelet’s width. Similarly, the Euclidean distance between the purple lines connecting the left and right midpoints was the spikelet’s length. Therefore, the finally obtained spikelet length and spikelet width were 422.6 pixels and 107.0 pixels, respectively.

2.3.3. Measurement of Actual Size for Spikelet Reference Object

In this study, a digital caliper was used to measure the actual size of the spikelet reference object. The measurement procedure was as follows: The spikelet length was obtained by clamping the left and right endpoints of the spikelet with a digital caliper. Similarly, the spikelet width was obtained by clamping the middle part of the widest surface of the spikelet with a digital caliper. Finally, the actual spikelet length and spikelet width were 9.60 mm and 2.43 mm, respectively. Therefore, by combining the spikelet pixel size measured through a traditional image processing method in Section 2.3, the image unit size under the fixed shooting height of the lighting box can be calculated to be 44.03 pixels/mm.

2.4. Evaluation Metrics

To verify the performance of the SSM-Method, the coefficient of determination (R2), the root mean square error (RMSE), the relative RMSE (rRMSE), the Bias (BIAS) and the mean absolute error (MAE) were used to evaluate the consistency between the SSM-Method measurement result and the manual measurement standard value. Also, the absolute error and the relative error were used to evaluate the accuracy of the SSM-Method. The above indicators were calculated using the Equations (1)–(7), respectively.
R 2 = 1 i = 1 n m i a i 2 i = 1 n m i m ¯ 2
R M S E = i = 1 n a i m i 2 n
r R M S E = 1 n i = 1 n m i a i m i 2
B I A S = 1 n i = 1 n m i a i
M A E = i = 1 n a i m i n
= a m
δ = m × 100 %
where n is the number of the tested sample images, a i and m i are respectively the automatic measurement result and the manual measurement result of image i, m ¯ is the average value of all manual measurement results for tested sample images, is the absolute error and δ is the relative error.

3. Results and Discussion

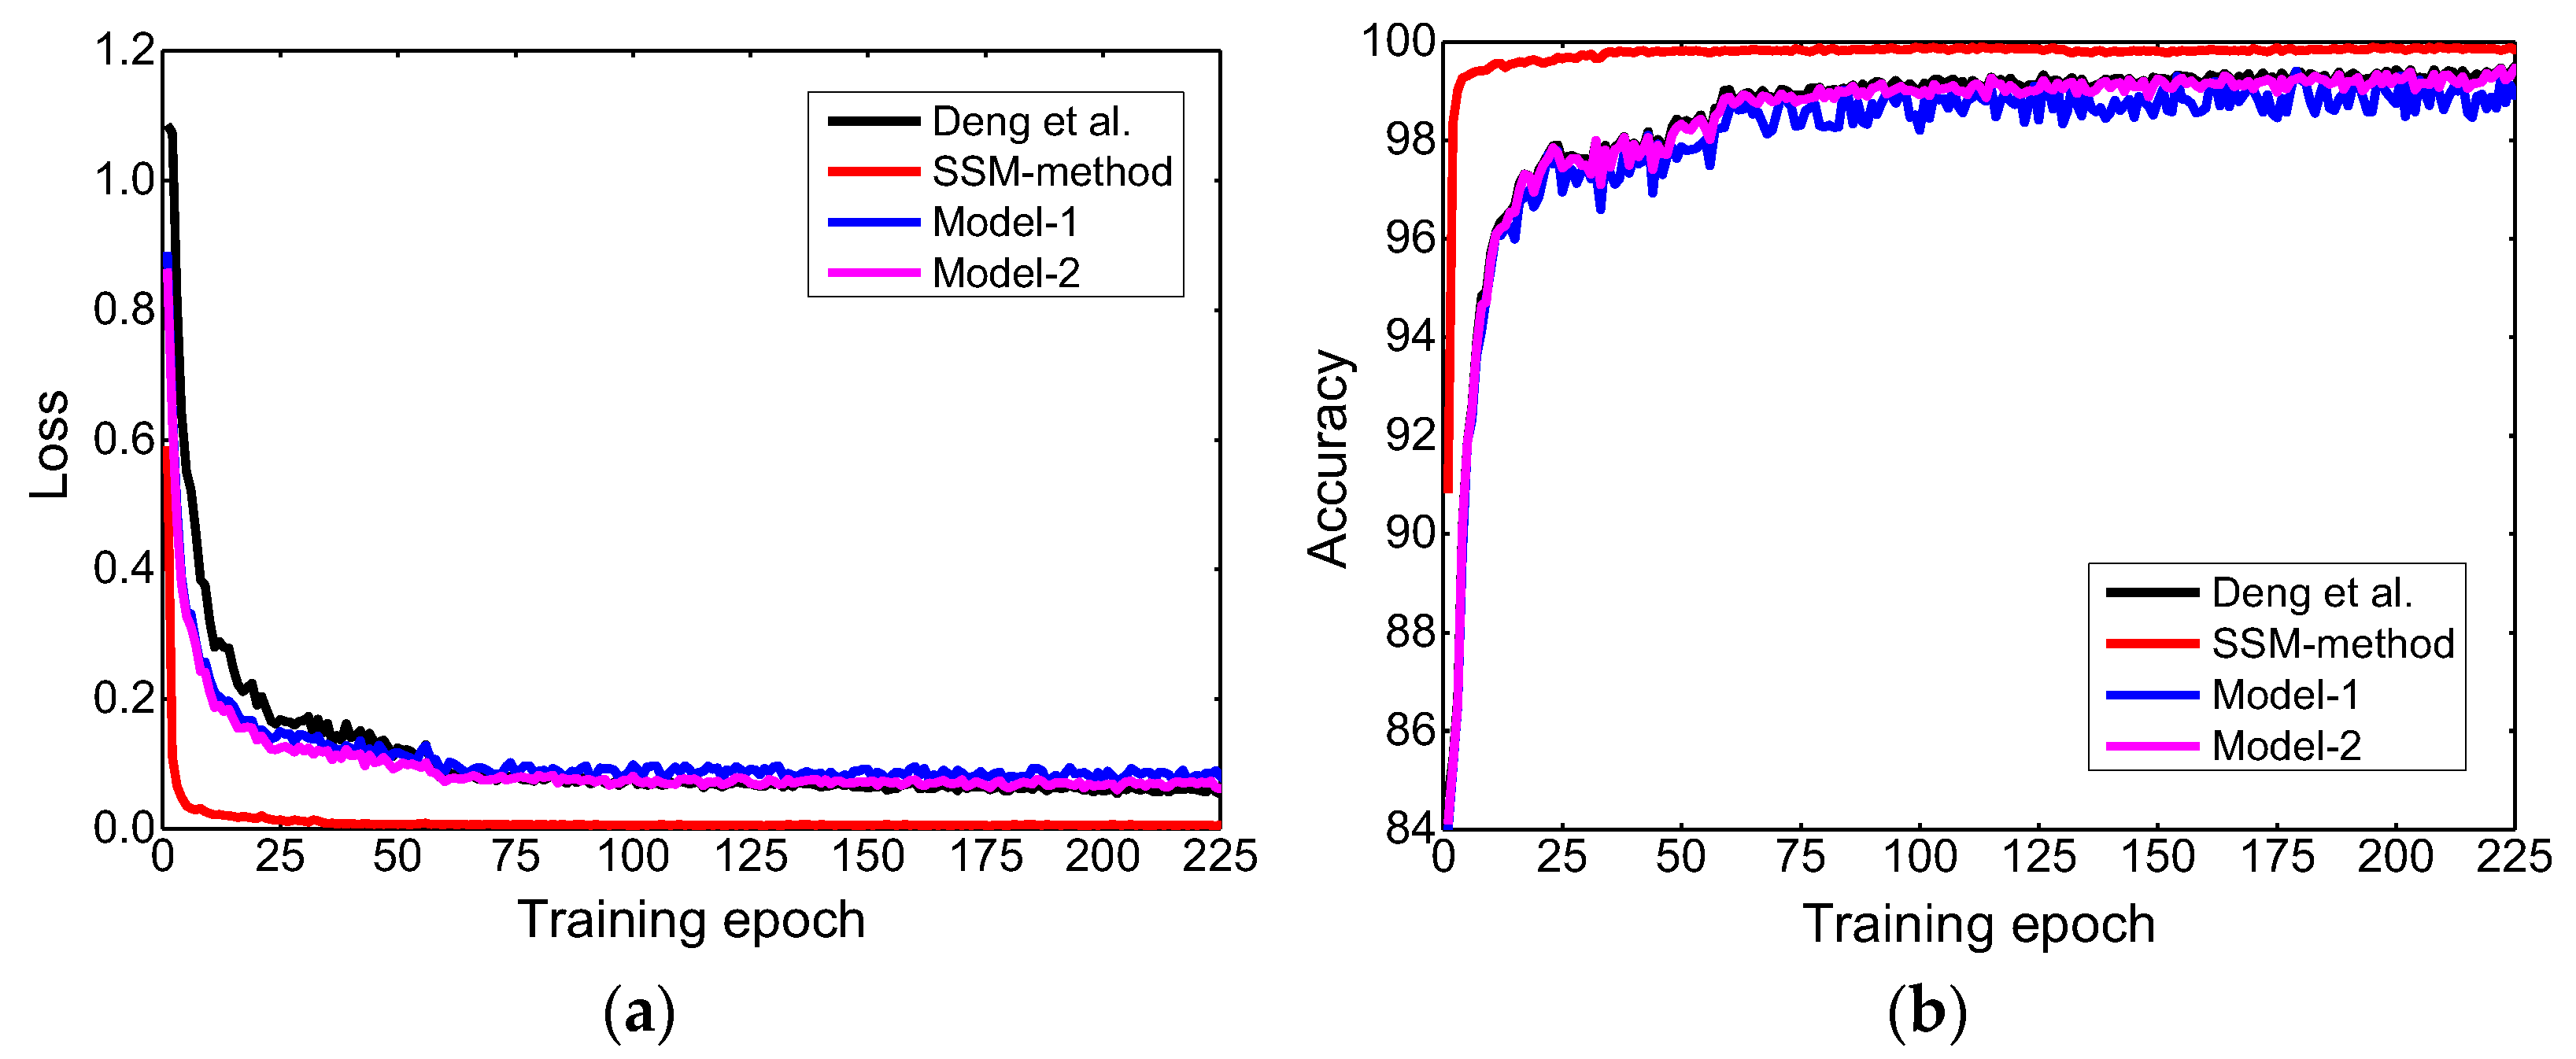
3.1. Training Results of the SSM-Method

The loss function and accuracy curves obtained through the SSM-Method were plotted and compared with other methods: Deng et al. [31], Model-1 and Model-2. Among them, Model-1 is a model established on the basis of the SSM-method by removing the FPN component, while Model-2 is a model established by replacing GIOU in the SSM-method with IOU. The results showed that as the number of epochs increased, the loss function values decreased (Figure 10a). The loss function values of the SSM-Method were generally lower than those of the other three methods. After approximately 8 epochs in training, the loss function of SSM-Method fluctuated less and less. After 33 epochs, the loss function converged. The accuracy curves showed that the SSM-Method had better accuracy consistently over the epoch range of 0 to 225 (Figure 10b). Considering all these performance indicators, the SSM-Method was used for spikelet size measurement in this study.

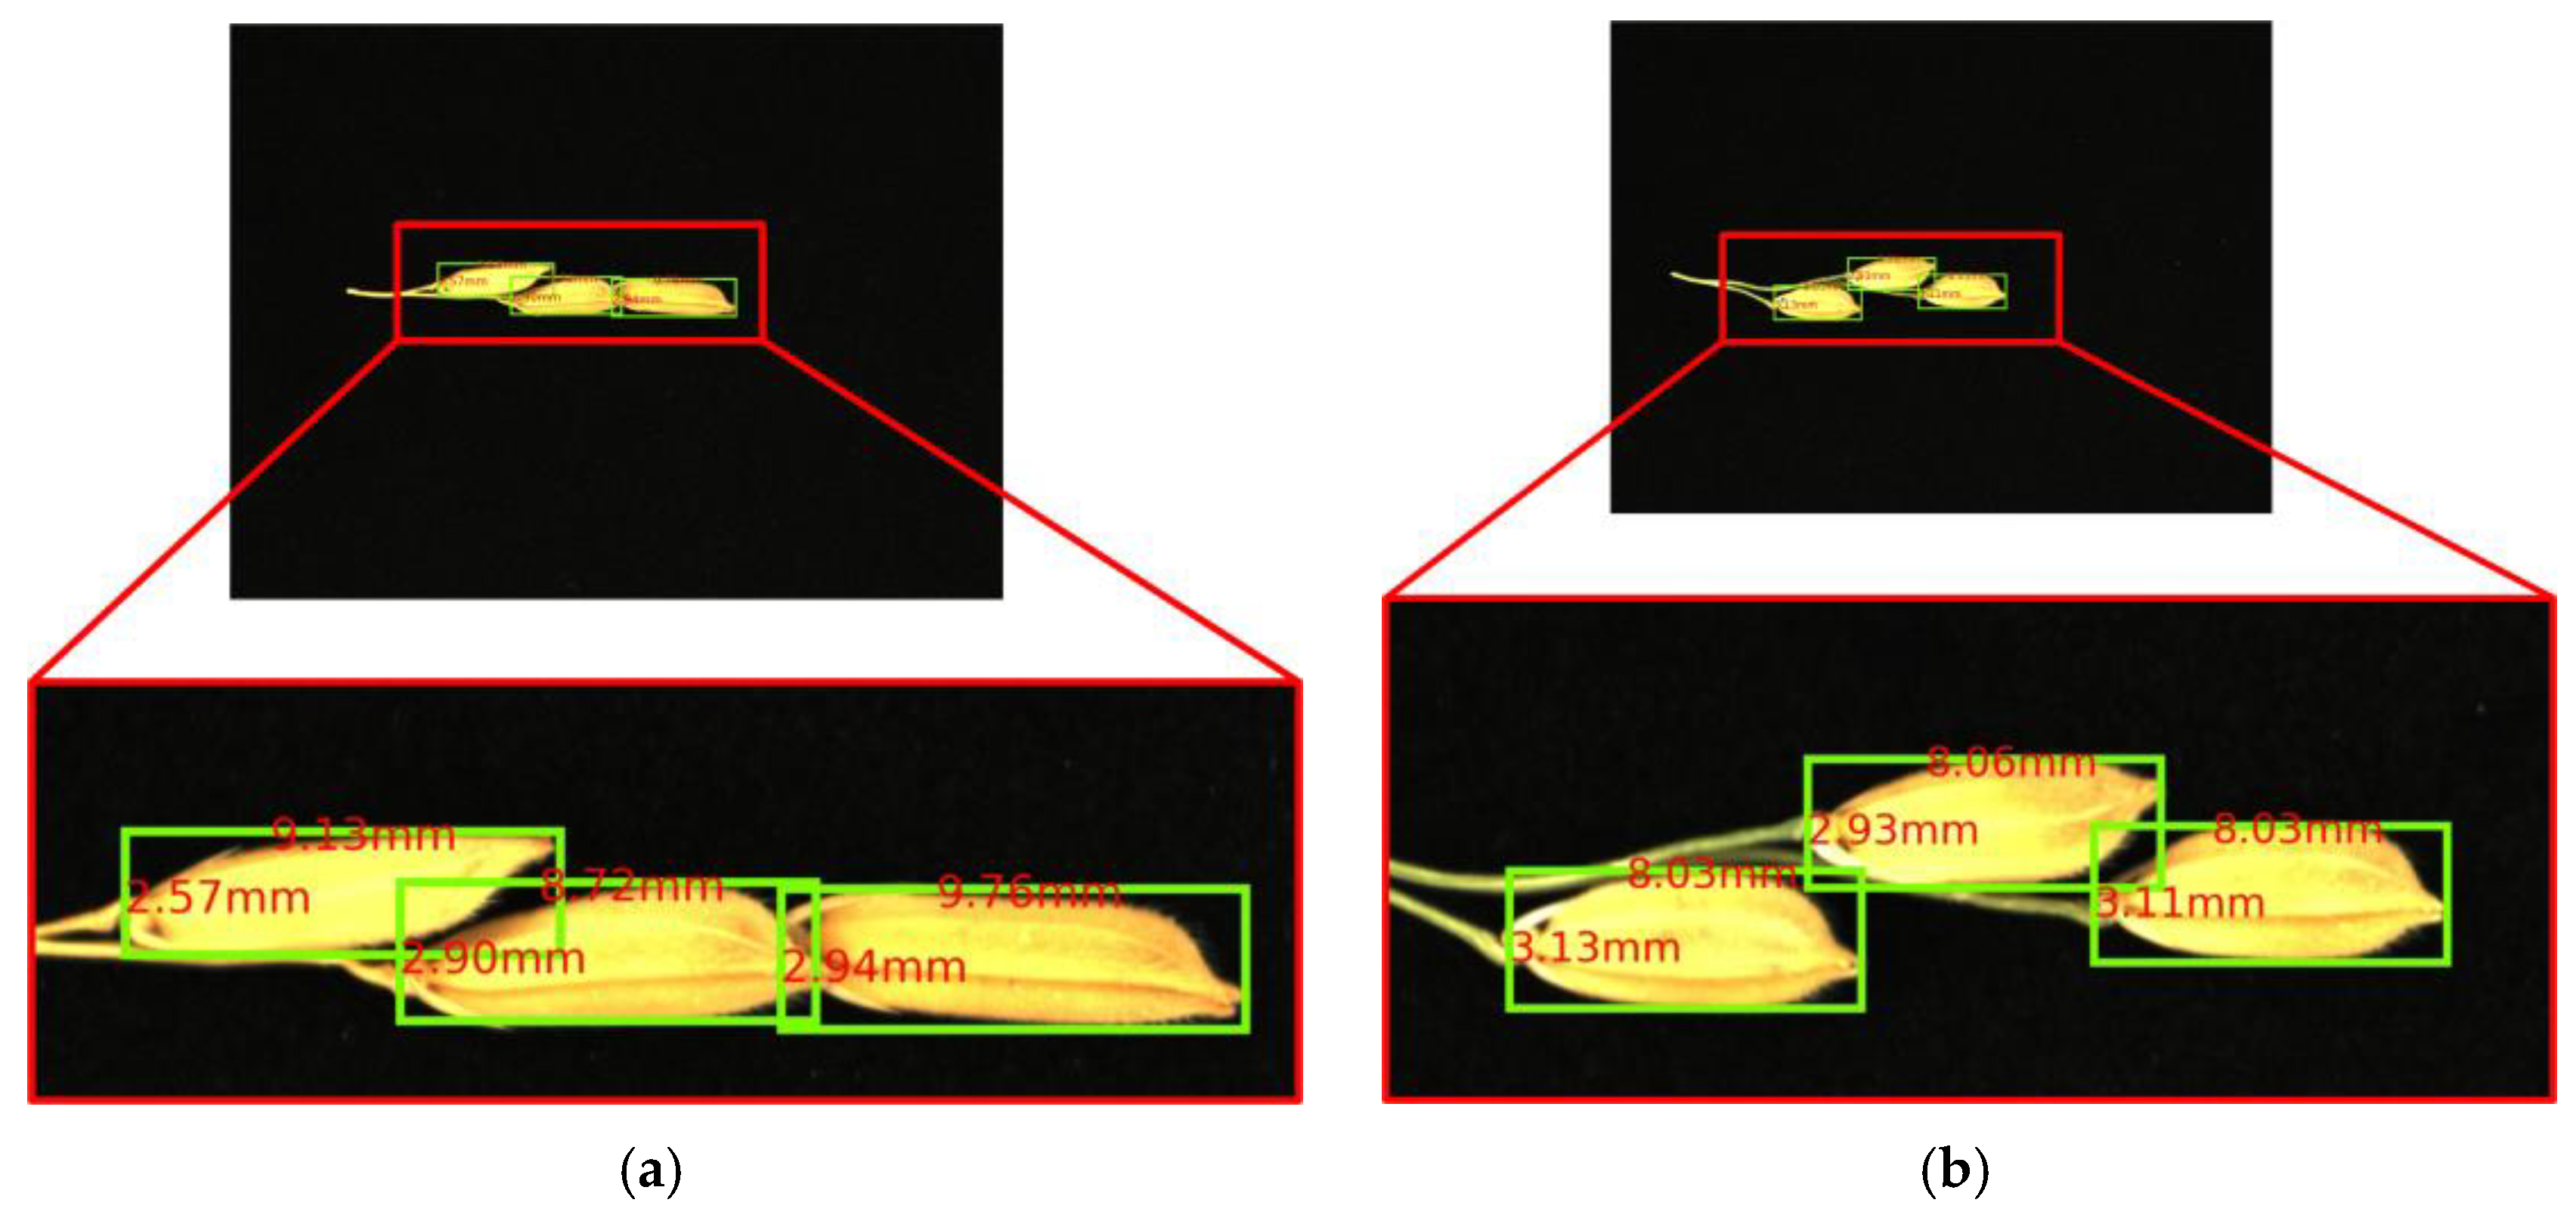
3.2. Measurement Results of the SSM-Method

The SSM-Method was tested on the RGB images of the testing set. Figure 11 showed some examples of the measured spikelet size with the green detection frame and the red number. The green rectangular frame tightly wrapped each spikelet on the panicle branch image, and the position of the rectangular frame was almost the same as the position of the smallest circumscribed rectangle of the spikelet. These results demonstrated that the proposed method could almost accurately detect and measure all spikelets at relative levels on the panicle branch image. Among them, the red number on the long side and short side represented the spikelet length and spikelet width, respectively. Due to the differences in the shape of rice varieties, the spikelet length of Huahang 15 (Figure 11a) was mostly larger than that of Qingyang (Figure 11b), while the opposite was true for spikelet width. Typically, measuring spikelet sizes using traditional image processing methods requires threshing first, and it is difficult to accurately measure spikelet sizes since contacting spikelets can easily be mistaken for a connected area. However, the spikelet sizes measured in our proposed method was not affected by inter-spikelet contact or the connection between spikelets and panicle branches. The above results showed the feasibility of the proposed method to directly measure spikelet sizes on the rice panicle.
Moreover, since spikelets in special situations (see Section 2.2.1 for details) were not labelled during image preprocessing, the SSM-Method can automatically filter the spikelets in special situations without measurement. Figure 12a showed that although the shape feature of the second spikelet from left to right was obvious, the SSM-Method can still correctly filter the spikelets in this situation. This was because the spikelet length direction deviated significantly from the abscissa direction of image, and was not in a relatively horizontal position. A similar situation can also be observed in Figure 12b. The above results showed that the SSM-Method developed in this paper can intelligently and accurately filter spikelets under special situations and only measure spikelet sizes at relatively horizontal positions.

3.3. Measurement Accuracy of SSM-Method

To verify the accuracy of the SSM-Method for measuring spikelet sizes on rice panicle branches, another set of panicle branch images were tested. Since spikelet morphology varies with rice variety, images taken for the experiment were of Huahang 15 and Qingyang, respectively. The corresponding numbers of images taken were 30, and 30, totaling 60 images. Among them, the length and width of 122 spikelets for Huahang 15 were measured, while those of 140 spikelets for Qingyang were measured. Meanwhile, the corresponding spikelet length and spikelet width were manually measured with a digital caliper for comparison (Figure 13). The spikelet length of Huahang 15 was between 8.0 and 10.5 mm (Figure 13a), and the spikelet width was between 2.0 and 3.0 mm (Figure 13b). The spikelet length of Qingyang was between 7.0 and 8.5 mm (Figure 13c), and the spikelet width was between 2.5 and 3.5 mm (Figure 13d).
No matter which rice variety it was, the measurement accuracy of spikelet length was slightly better than that of spikelet width. The reason for this can be attributed to the following points: Since the spikelets on panicle branch structure were all connected to the panicle branches, the wide surface position of spikelets was restricted by panicle branches and other spikelets. It was not easy to get the wide surface of each spikelet on the rice panicle branch pointing straight up. Therefore, the width of some spikelets in the panicle branch image was slightly smaller than the actual value. However, the overall results showed that the measurement accuracy of spikelet length and spikelet width was relatively consistent. The above deficiencies had little impact on the measurement accuracy of the SSM-Method and can be ignored. Moreover, the root mean square errors of spikelet length and spikelet width for Huahang 15 were 0.26 mm and 0.27 mm, respectively, while those of Qingyang were 0.30 mm and 0.31 mm, respectively, indicating that the measurement effect of the SSM-Method on Huahang 15 was better than that of Qingyang. But overall, the measurement error of the SSM-Method was relatively small, which proved that the SSM-Method had good stability in measuring spikelet sizes.
To more intuitively show the difference in measurement results between the SSM-Method and the manual method, the average values were also calculated for comparison (Table 3). In addition, the average absolute error and average relative error of the SSM-Method in measuring rice spikelet size were calculated. The average spikelet lengths of Huahang 15 and Qingyang measured manually were 9.38 mm and 7.79 mm, respectively, while that of the two rice varieties measured by SSM-Method were 9.42 mm and 7.85 mm, respectively. The absolute errors of the SSM-Method in measuring spikelet lengths of Huahang 15 and Qingyang were 0.14 mm and 0.19 mm, while the relative errors were 1.56% and 2.39%. The above results revealed that the SSM-Method had smaller measurement errors and a high accuracy for measuring the spikelet length of the two rice varieties, Huahang 15 and Qingyang.
Similarly, Table 4 indicated that the average spikelet widths of Huahang 15 and Qingyang measured manually were 2.72 mm and 3.15 mm, respectively, while that of the two rice varieties measured using the SSM-Method were 2.63 mm and 3.16 mm, respectively. The absolute errors of the SSM-Method in measuring the spikelet widths of Huahang 15 and Qingyang were 0.18 mm and 0.20 mm, while the relative errors were 7.18% and 6.40%. The above results showed that the SSM-Method had smaller measurement errors and a high accuracy for measuring the spikelet widths of two rice varieties, Huahang 15 and Qingyang.
The above results show that no matter which rice variety it was, the SSM-Method had a slightly smaller error rate when measuring rice spikelet lengths than when measuring spikelet widths. This is because the structure of the rice panicle branch cannot make the wide surface of each spikelet face vertically upwards. However, the overall error rate of the SSM-Method was relatively low, which proved the feasibility of the SSM-Method.

4. Conclusions

In this study, a high-precision and high-efficiency method, dubbed the “SSM-Method”, has been proposed based on a deep learning convolutional neural network (CNN) model and a traditional image processing method for automatically measuring rice spikelet lengths and spikelet widths. The following conclusion was drawn: The CNN-based SSM-Method was capable of measuring spikelet lengths and spikelet widths based on rice panicle branches. When compared to manual measurement results, the root mean square error (RMSE) of the spikelet lengths of two rice varieties (Huahang15 and Qingyang) were 0.26 mm and 0.30 mm, respectively, while the corresponding RMSE of spikelet widths was 0.27 mm and 0.31 mm, respectively. The accuracy of the SSM-Method was not affected by inter-spikelet contact, the connection between spikelets and panicle branches or the rice variety. The SSM-Method shows great promises as a robust tool for the computer-aided measurement of rice spikelet lengths and spikelet widths, which will help rice breeders collect large amounts of data and help agricultural researchers predict crop yield potentials. However, more tests may be required to further verify the SSM-Method.

Author Contributions

Conceptualization, R.D. and W.L.; methodology, R.D.; software, R.D.; validation, H.L., Q.L. and M.H.; formal analysis, J.Z.; investigation, R.D.; resources, Q.L.; data curation, W.L.; writing—original draft preparation, R.D.; writing—review and editing, R.D.; visualization, W.L.; supervision, Q.L.; project administration, H.L.; funding acquisition, R.D. All authors have read and agreed to the published version of the manuscript.

Funding

This research was funded by Guangdong Basic and Applied Basic Research Foundation (2022A1515110468) and the program for scientific research start-up funds of Guangdong Ocean University (060302062106).

Data Availability Statement

Data underlying the results presented in this paper are not publicly available at this time but may be obtained from the authors upon reasonable request.

Acknowledgments

The authors thank their partners, the Institution of Agricultural Sciences of Jiangmen, Guangdong Province, for providing the rice panicles for image collections. Also, the authors thank Long Qi, Ningxia Yin, and Xiaoming Xu for their valuable contributions to the research.

Conflicts of Interest

The authors declare no conflicts of interest.

References

  1. Li, N.; Xu, R.; Duan, P.; Li, Y. Control of grain size in rice. Plant Reprod. 2018, 31, 237–251. [Google Scholar] [CrossRef]
  2. Singh, U. Aromatic Rices; International Rice Research Institute: New Delhi, India, 2000. [Google Scholar]
  3. Fan, C.; Xing, Y.; Mao, H.; Lu, T.; Han, B.; Xu, C.; Li, X.; Zhang, Q. GS3, a major QTL for grain length and weight and minor QTL for grain width and thickness in rice, encodes a putative transmembrane protein. Theor. Appl. Genet. 2006, 112, 1164–1171. [Google Scholar] [CrossRef]
  4. Armstrong, B.; Aldred, G.; Armstrong, T.; Blakeney, A.; Lewin, L. Measuring rice grain dimensions with an image analyser. Quest 2005, 2, 2–35. [Google Scholar]
  5. Murthy, P.; Govindaswamy, S. Inheritance of grain size and its correlation with the hulling and cooking qualities. Oryza 1967, 4, 12–21. [Google Scholar]
  6. Mahale, B.; Korde, S. Rice quality analysis using image processing techniques. In Proceedings of the International Conference for Convergence for Technology-2014, Pune, India, 6–8 April 2014. [Google Scholar]
  7. Santos, M.V.; Cuevas, R.P.O.; Sreenivasulu, N.; Molina, L. Measurement of Rice Grain Dimensions and Chalkiness, and Rice Grain Elongation Using Image Analysis. In Rice Grain Quality: Methods Protocols; Humana Press: New York, NY, USA, 2019; Volume 1892, pp. 99–108. [Google Scholar] [CrossRef]
  8. Li, T.; Liu, H.; Mai, C.; Yu, G.; Li, H.; Meng, L.; Jian, D.; Yang, L.; Zhou, Y.; Zhang, H. Variation in allelic frequencies at loci associated with kernel weight and their effects on kernel weight-related traits in winter wheat. Crop J. 2019, 7, 30–37. [Google Scholar] [CrossRef]
  9. Hu, Y.; Zhang, Z. GridFree: A python package of image analysis for interactive grain counting and measuring. Plant Physiol. 2021, 186, 2239–2252. [Google Scholar] [CrossRef]
  10. Yin, C.; Li, H.; Li, S.; Xu, L.; Zhao, Z.; Wang, J. Genetic dissection on rice grain shape by the two-dimensional image analysis in one japonica x indica population consisting of recombinant inbred lines. Theor. Appl. Genet. 2015, 128, 1969–1986. [Google Scholar] [CrossRef]
  11. Rasband, W.S. Imagej; US National Institutes of Health: Bethesda, MD, USA, 2011. Available online: http://imagej.nih.gov/ij/ (accessed on 9 October 2020).
  12. Tanabata, T.; Shibaya, T.; Hori, K.; Ebana, K.; Yano, M. SmartGrain: High-throughput phenotyping software for measuring seed shape through image analysis. Plant Physiol. 2012, 160, 1871–1880. [Google Scholar] [CrossRef]
  13. Whan, A.P.; Smith, A.B.; Cavanagh, C.R.; Ral, J.-P.F.; Shaw, L.M.; Howitt, C.A.; Bischof, L. GrainScan: A low cost, fast method for grain size and colour measurements. Plant Methods 2014, 10, 23. [Google Scholar] [CrossRef]
  14. Gao, K.; White, T.; Palaniappan, K.; Warmund, M.; Bunyak, F. Museed: A mobile image analysis application for plant seed morphometry. In Proceedings of the 2017 IEEE International Conference on Image Processing (ICIP), Beijing, China, 17–20 September 2017; pp. 2826–2830. [Google Scholar]
  15. Feng, X.; Wang, Z.; Zeng, Z.; Zhou, Y.; Lan, Y.; Zou, W.; Gong, H.; Qi, L. Size measurement and filled/unfilled detection of rice grains using backlight image processing. Front. Plant Sci. 2023, 14, 1213486. [Google Scholar] [CrossRef]
  16. Lecun, Y.; Bengio, Y.; Hinton, G. Deep learning. Nature 2015, 521, 436–444. [Google Scholar] [CrossRef]
  17. Hinton, G.E.; Salakhutdinov, R.R. Reducing the dimensionality of data with neural networks. Science 2006, 313, 504–507. [Google Scholar] [CrossRef]
  18. Singh, A.; Ganapathysubramanian, B.; Singh, A.K.; Sarkar, S. Machine learning for high-throughput stress phenotyping in plants. Trends Plant Sci. 2016, 21, 110–124. [Google Scholar] [CrossRef]
  19. Krizhevsky, A.; Sutskever, I.; Hinton, G.E. Imagenet classification with deep convolutional neural networks. In Proceedings of the Advances in Neural Information Processing Systems, Lake Tahoe, NV, USA, 3–6 December 2012; Volume 25. [Google Scholar]
  20. Wang, Z.; Ding, Y.; Zhang, T.; Huang, X. Automatic real-time fire distance, size and power measurement driven by stereo camera and deep learning. Fire Saf. J. 2023, 140, 103891. [Google Scholar] [CrossRef]
  21. Zhang, H.; Li, Z.; Sun, J.; Fu, Y.; Jia, D.; Liu, T. Characterization of particle size and shape by an IPI system through deep learning. J. Quant. Spectrosc. Radiat. Transf. 2021, 268, 107642. [Google Scholar] [CrossRef]
  22. Park, S.E.; Eem, S.-H.; Jeon, H. Concrete crack detection and quantification using deep learning and structured light. Constr. Build. Mater. 2020, 252, 119096. [Google Scholar] [CrossRef]
  23. Zhang, S.; Liang, X.; Huang, X.; Wang, K.; Qiu, T. Precise and fast microdroplet size distribution measurement using deep learning. Chem. Eng. Sci. 2022, 247, 116926. [Google Scholar] [CrossRef]
  24. Ren, S.; He, K.; Girshick, R.; Sun, J. Faster R-CNN Towards Real-Time Object Detection with Region Proposal Network. IEEE Trans. Pattern Anal. Mach. Intell. 2017, 39, 1137–1149. [Google Scholar] [CrossRef]
  25. Deng, R.; Qi, L.; Pan, W.; Wang, Z.; Fu, D.; Yang, X. Automatic estimation of rice grain number based on a convolutional neural network. J. Opt. Soc. Am. A 2022, 39, 1034–1044. [Google Scholar] [CrossRef]
  26. Darrenl. Labelimg: Labelimg Is a Graphical Image Annotation Tool and Label Object Bounding Boxes in Images. 2017. Available online: https://github.com/tzutalin/labelImg (accessed on 20 October 2020).
  27. Joseph Redmon, A.F. Yolov3: An incremental improvement. arXiv 2018, arXiv:1804.02767. [Google Scholar]
  28. Liu, W.; Anguelov, D.; Erhan, D.; Szegedy, C.; Reed, S.; Fu, C.-Y.; Berg, A.C. Ssd: Single shot multibox detector. In Computer Vision–ECCV 2016: 14th European Conference, Amsterdam, The Netherlands, 11–14 October 2016; Proceedings, Part I 14; Springer: Berlin/Heidelberg, Germany, 2016. [Google Scholar]
  29. Lin, T.-Y.; Dollár, P.; Girshick, R.; He, K.; Hariharan, B.; Belongie, S. Feature pyramid networks for object detection. In Proceedings of the IEEE Conference on Computer Vision and Pattern Recognition, Honolulu, HI, USA, 21–26 July 2017. [Google Scholar]
  30. Rezatofighi, H.; Tsoi, N.; Gwak, J.; Sadeghian, A.; Reid, I.; Savarese, S. Generalized intersection over union: A metric and a loss for bounding box regression. In Proceedings of the IEEE/CVF Conference on Computer Vision and Pattern Recognition, Long Beach, CA, USA, 15–20 June 2019. [Google Scholar]
  31. Deng, R.; Tao, M.; Huang, X.; Bangura, K.; Jiang, Q.; Jiang, Y.; Qi, L. Automated Counting Grains on the Rice Panicle Based on Deep Learning Method. Sensors 2021, 21, 281. [Google Scholar] [CrossRef]
Figure 1. Illustration of SSM-Method.
Agronomy 14 02398 g001
Figure 2. Illustration of the equipment for collecting rice panicle branch images.
Agronomy 14 02398 g002
Figure 3. Samples of rice panicle branch for (a) Huahang 15 rice variety and (b) Qingyang rice variety.
Agronomy 14 02398 g003
Figure 4. Spikelet annotation using LabelImg software (v4.5.3).
Agronomy 14 02398 g004
Figure 5. Spikelets in special circumstances of (a) spikelet in slanted position, (b) spikelet with narrow side up and (c) spikelet that is mostly shaded at one end.
Agronomy 14 02398 g005
Figure 6. FPN structure.
Agronomy 14 02398 g006
Figure 7. Structure of spikelet detection model.
Agronomy 14 02398 g007
Figure 8. Single spikelet reference object of (a) origin image and (b) pixel size of single spikelet.
Agronomy 14 02398 g008
Figure 9. Flowchart for calculating pixel size per millimeter for spikelet reference object.
Agronomy 14 02398 g009
Figure 10. Comparison of training result between SSM-Method, Deng et al. [31], Model-1 and Model-2 for (a) loss curve and (b) accuracy curve.
Agronomy 14 02398 g010
Figure 11. Measurement results of spikelet size based on SSM-Method for (a) Huahang 15 rice variety and (b) Qingyang rice variety.
Agronomy 14 02398 g011
Figure 12. Schematic diagram of automatically filtering spikelets in special situations by the proposed method for (a) spikelets in slanted position and (b) spikelets in slanted position with narrow side up.
Agronomy 14 02398 g012
Figure 13. Measurement accuracy of SSM-Method of (a) spikelet length of Huahang 15, (b) spikelet width of Huahang 15, (c) spikelet length of Qingyang and (d) spikelet width of Qingyang.
Agronomy 14 02398 g013
Table 1. Specification of industrial camera.
SupplierResolutionSensor TypeSensor ModelPixel Size
Hikvision, China5472 × 3648CMOS, Rolling ShutterSony IMX1832.4 μm × 2.4 μm
Table 2. Specification of lens.
SupplierFocal lengthApertureSensor sizeDistortionMount
Hikvision, China16 mm2.81.1″<0.5%C-Mount
Table 3. Comparison of measurement results of SSM-Method and manual method for the average rice spikelet length.
Rice VarietySSM-MethodManual MethodAbsolute ErrorRelative Error
Huahang 159.42 mm9.38 mm0.14 mm1.56%
Qingyang7.85 mm7.79 mm0.19 mm2.39%
Table 4. Comparison of measurement results of SSM-Method and manual method for the average rice spikelet width.
Rice VarietySSM-MethodManual MethodAbsolute ErrorRelative Error
Huahang 152.63 mm2.72 mm0.18 mm7.18%
Qingyang3.16 mm3.15 mm0.20 mm6.40%
Disclaimer/Publisher’s Note: The statements, opinions and data contained in all publications are solely those of the individual author(s) and contributor(s) and not of MDPI and/or the editor(s). MDPI and/or the editor(s) disclaim responsibility for any injury to people or property resulting from any ideas, methods, instructions or products referred to in the content.

