Article

Genome-Wide Identification and Expression Profiling of the BES1 Gene Family in Medicago sativa

Key Laboratory of Biohazard Monitoring, Green Prevention and Control for Artificial Grassland, Ministry of Agriculture and Rural Affairs, Institute of Grassland Research of Chinese Academy of Agricultural Sciences, Hohhot 010010, China
*
Authors to whom correspondence should be addressed.
Agronomy 2024, 14(10), 2287; https://doi.org/10.3390/agronomy14102287
Submission received: 19 August 2024 / Revised: 1 October 2024 / Accepted: 2 October 2024 / Published: 4 October 2024
(This article belongs to the Section Crop Breeding and Genetics)

Abstract

:
Brassinosteroid (BR) signaling is regulated by BRI1-EMS SUPPRESSOR 1 (BES1) transcription factors, which are crucial for plant growth, development, and stress responses. Despite their importance, BES1 gene studies in Medicago sativa L. are limited, hindering our understanding of the BR signaling in this species. This study identified four BES1 genes in M. sativa; characterized their properties, conserved motifs, cis-regulatory elements, and chromosomal location; and explored their functions in development and stress responses. A phylogenetic analysis grouped these genes into two subfamilies. Transcript profiling showed widespread and tissue-specific expression patterns. A qRT-PCR analysis unveiled that most MsBESI genes were upregulated under salt and drought treatments, except MsG0280009980, which was suppressed. This research lays the groundwork for enhancing M. sativa stress resistance and understanding the BES1 gene family’s function.

1. Introduction

Brassinosteroids (BRs) are crucial in plant development, growth, pathogens, and environmental stress responses [1,2,3,4,5]. In Arabidopsis thaliana, BRs are recognized by the cell surface receptor Brassinosteroid-Insensitive 1 (BRI1), along with its homologs BRI1-Like 1 (BRL1) and BRI1-Like 3 (BRL3), as well as the coreceptor BRI1-Associated Receptor Kinase 1 (BAK1) [6,7]. The activated BRI1 dephosphorylates and inactivates the GSK3-like kinase brassinosteroids-insensitive 2 (BIN2), then the BR signaling pathway master positive transcription factors brassinazole-resistant 1 (BZR1) and BRI1-EMS suppressor 1 (BES1) cannot be phosphorylated by BIN2. The dephosphorylated BES1 and BZR1 target BR-responsive elements to modulate target gene expression, thereby activating BR signaling [8,9,10]. In the absence of BRs, the activated BIN2 phosphorylates BES1 and BZR1, leading them to be sequestered in the cytoplasm by 14-3-3 proteins [11].
BES1 contains a putative nuclear localization sequence (NLS), a conserved N terminus, a BIN2 phosphorylation domain, a PEST motif, and a C-terminal structure [12]. As core members of BR signaling, BES1 binds to the CANNTG sequence (E box) to regulate thousands of responsive genes [13], thereby influencing plant growth, development, stress adaptation, and signal transduction pathways, such as those for phytohormones and light [14,15,16,17]. BES1 genes impact root growth, hypocotyl elongation, apical hook development, chlorophyll biosynthesis, cotyledon opening, fruit ripening, flowering, and seed size [18,19,20,21,22,23,24,25]. In Arabidopsis thaliana, BES1 interacts with WRKY and HSFA1 to modulate drought and heat stress tolerance [26,27], respectively, and BZR1 enhances freezing tolerance [28]. However, the function of BES1 family members in M. sativa remains underexplored.
The BES1s family exists in about 80 species [29] and has been studied in various plants, including Arabidopsis thaliana, tomato, maize, grapevine, apple, soybean, and rice [29,30,31,32,33]. In Arabidopsis thaliana, BEH3 (BES1/BZR1 Homolog 3) modulates ABA responses and dehydration by regulating proline metabolism [34], while AtBES1 inhibits JA-induced insect defense metabolite biosynthesis by interacting with MYB proteins [35]. AtBES1 also interacts with phytochrome-interacting factor 4 (PIF4) to augment cell elongation and plant growth by targeting about 2000 genes [36]. In tomatoes, BES1 boosts BR signaling and salt tolerance [37]. ZmBES1/BZR1-5 expression in Arabidopsis thaliana promotes kernel size and improves osmotic and salt tolerance [38]. In Marchantia polymorpha, changes in the BES1 level significantly impact cell division and differentiation, leading to delayed thalli development and an inability to differentiate into adult tissues and reproductive organs [39].
M. sativa, commonly referred to as the “queen of forage grasses”, is a perennial legume prized for its palatability, nutritional content, and high yield [40,41]. Sequencing M. sativa cultivar Zhongmu No. 1 genome [42] enables identifying stress response genes in M. sativa [42,43,44,45]. Transcription factors (TFs) play a crucial role by binding to specific target proteins through their DNA-binding domain (DBD), recognizing a 6–12 bp motif in both promoter-proximal regions and distal enhancers [46]. Those TFs modulate structural genes involved in responsible for plant growth, development, and stress responses [47,48]. Approximately 60 TF families have been identified, including MYB, bHLH, WRKY, ERF, and BES1 [49,50,51,52,53]. In our study, we focused on the potential regulatory functions of BES1 genes in the stress responses of M. sativa. We identified four BES1 genes and conducted systematic analyses of gene structure, motif composition, phylogenetic, and chromosome localization. Additionally, we analyzed the expression patterns of BES1 genes under conditions of drought and salt stress. Our research provides a theoretical foundation for further investigating BES1 genes’ function in M. sativa.

2. Materials and Methods

2.1. Identification and Phylogenetic Analysis of MsBES1 Genes in M. sativa

M. sativa genome sequence was obtained from the Zhongmu No. 1 genome assembly files (https://figshare.com/articles/dataset/Medicago_sativa_genome_and_annotation_files/12623960, accessed on 11 June 2024). To identify the MsBES1 gene family members, we used the hidden Markov model (HMM) data for the BES1_N domain (PF05687) from the PFAM database (http://pfam.xfam.org/, accessed on 11 June 2024). MsBES1 protein sequences were retrieved using the HMMER 3.0 software, and candidate BES1 domains were validated using the NCBI CDD database. Protein sequences for 8 AtBES1s, 17 GmBES1s, and 9 SlBES1s were from the genome assembly phytozome (https://phytozome-next.jgi.doe.gov/, accessed on 11 June 2024), and the 5 OsBES1 protein sequences were from the rice genome assembly v6 (http://rice.plantbiology.msu.edu/, accessed on 11 June 2024). A phylogenetic tree was prepared with MEGA 11 using the neighbor-joining method with 1000 bootstrap replicates.

2.2. Characteristics, Gene Structure, Conserved Motifs, and Cis-Elements of MsBES1s

The pI value, molecular weight, CDS length, amino acid residue count, and average hydrophilicity (GRAVY) of the four MsBES1s were projected using Ex-PASy (https://prosite.expasy.org/, accessed on 12 June 2024). The conserved motifs were revealed using Multiple Expectation Maximization for Motif Elicitation (MEME Suite) (http://meme-suite.org/, accessed on 12 June 2024) with maximum of six patterns. Gene structures were visualized using the TBtools (v2.083) based on the Zhongmu No. 1 genome annotation. The 2000 bp promoter regions upstream of the MsBES1 start codon (ATG) were examined for cis-elements using the PlantCARE website (http://bioinformatics.psb.ugent.be/webtools/plantcare/html/, accessed on 12 June 2024), and the results were illustrated using the TBtools.

2.3. Chromosomal Location, Subcellular Localization, and 3D Structure Prediction of MsBES1 Genes in M. sativa

MsBES1 genes’ chromosomal localization was visualized using the TBtools based on genome annotation files. Subcellular localization of the four MsBES1 genes was projected using BUSCA (http://busca.biocomp.unibo.it/, accessed on 12 June 2024). The 3D structures of the four MsBES1 proteins were projected using ExPaSy SWISS-MODEL (https://swissmodel.expasy.org/interactive, accessed on 24 June 2024).

2.4. Planting and Stress Treatment

M. sativa cultivar Zhongmu No. 1 (purchased from Jiuquan Daye Seed Company, Jiuquan, China) was planted in nutrient soil under a 16 h light/8 h dark photoperiod at 25 °C/22 °C. We irrigated all plants with nutrient solution once a week. MsBES1 expression pattern was analyzed using root, stem, leaf, and flower samples from two-month-old plants. Abiotic stress treatments with 20% PEG-6000 and 350 mmol/L NaCl were conducted on four-week-old whole plants with uniform growth, and samples were collected at 0 h (CK), 3 h, 6 h, 12 h, and 24 h post-treatment with three biological replicates, snap-frozen in liquid nitrogen, and stored at −80 °C for later analysis.

2.5. Transcriptome Data Collection and Analysis

Transcriptomic data for the MsBES1 genes from the M. sativa plants subjected to cold treatment were obtained from the MODMS database (https://modms.lzu.edu.cn/, accessed on 27 September 2024). Gene expression levels were calculated based on the Transcripts Per Kilobase of exonmodel per Million mapped reads (TPM) value; differentially expressed genes were retrieved to generate heatmaps. The results were presented using the TBtools.

2.6. RNA Isolation and qRT-PCR Detection

Total RNA from different tissues and treatments was isolated using a Transzol Up Plus RNA Kit (Transgene ER501, Beijing, China), and 1 µg of total RNA was converted into cDNA using HiScript II Q RT SuperMix for qPCR (+gDNA wiper) Kit (Vazyme R223, Nanjing, China). Specific primers were designed using Primer Premier 6 software, and qRT-PCR was executed on a QuantStudio 5 PCR system (Thermo Fisher Scientific Inc., Waltham, MA, USA) with MsActin gene as an internal control. All primers are shown in Supplementary Table S4. Each reaction mixture contained 10 µL of Hieff® qPCR SYBR® Green Master Mix (Yeasen 11202ES03, Shanghai, China), 0.4 µL forward primer (10 uM), 0.4 µL reverse primer (10 uM), 1 µL diluted cDNA, and 8.2 µL RNase free water for a total of 20 µL. The qRT-PCR amplification procedure was as follows: stage 1 was initial denaturation for 5 min at 95 °C; stage 2 was circular reaction 40 cycles for 10 s at 95 °C, 20 s at 55 °C, and 20 s at 72 °C; stage 3 was melting curve for 15 s at 95 °C, 60 °C for 1 min, and 95 °C for 15 s. Finally, the average threshold cycle (Ct) was calculated per each sample. The experiments were conducted with three replicates, and relative expression was examined using the 2−ΔΔCt method [54,55].

2.7. RNA-Seq Analysis

Total RNA was isolated using a Trizol reagent kit (Invitrogen, Waltham, MA, USA), as previously reported [56]. Enriched mRNA was fragmented, converted into cDNA using NEBNext Ultra RNA Library Prep Kit for Illumina (NEB, Ipswich, MA, USA), end-repaired after purification, A-tailed, ligated to Illumina sequencing adapters, and sequenced on an Illumina Novaseq6000 system at the Guangzhou Gene Denovo Technology (Guangzhou, China). Low-quality reads and adapters were removed using cutadapt software (version v 1.18) to obtain clean reads with 18 to 26 nucleotide (nt) sizes. The clean reads were assembled using velvet software (version 1.1.07). Finally, clean reads were mapped to the genome of reference genome files by bwa software (version 0.7.17-r1188).

3. Result

3.1. MsBES1 Gene Identification and Characterization

We identified four MsBES1 genes in M. sativa by conducting a comprehensive search using the hidden Markov model (HMM) profile of the BES1_N domain (PF05687), along with conserved structural domain evaluation. Their coding sequences ranged from 951 to 2100 bp, encoding proteins of 316–699 amino acid residues with a molecular weight of 34.141 to 78.120 kDa and pI values between 5.31 and 8.65. The MsG0780039688 sequence was the longest, and the MsG0280009980 was the shortest. Supplementary Table S1 lists the validated MsBES1 gene IDs, protein sequences, and nucleotide sequences. All four MsBES1 proteins were hydrophilic, as indicated by the negative grand average of hydropathicity (GRAVY) values, and projected to be nuclear (Table 1). These genes locate chr2 (MsG0280009981 and MsG0280009980), chr5 (MsG0580025311), and chr7 (MsG0780039688), as shown in Supplementary Figure S1. These results indicated significant differences in protein size, molecular weight, pI, and other physicochemical properties among different MsBES1 subfamilies, while members of the same subfamily showed high similarity, suggesting functional differentiation during the evolution.

3.2. Phylogenetic Classification of MsBES1s in M. sativa

To elucidate the evolutionary relationship of BES1s among species, we created an unrooted phylogenetic tree (Figure 1) using MEGA 11 software with a neighbor-joining method based on the complete protein sequences of four MsBES1s, eight AtBES1s, seventeen GmBES1s, nine SlBES1s, and five OsBES1s (Supplementary Table S2). The results revealed that these 43 BES1 proteins were in three groups. Among the three groups, subfamily I contained the most BES1 proteins, with 19 members, including two MsBES1s (MsG0280009981 and MsG0280009980), four AtBES1s, four SlBES1s, and nine GmBES1s; subfamily II contained two MsBES1s (MsG0580025311 and MsG0780039688), two AtBES1s, two SlBES1s, four GmBES1s, and three OsBES1s; and subfamily III had the fewest BES1 members, including two AtBES1s, three SlBES1s, four GmBES1s, and two OsBES1s. The same subfamily members usually have similar biological functions, which provides valuable information for studying the biological functions of MsBES1 proteins.

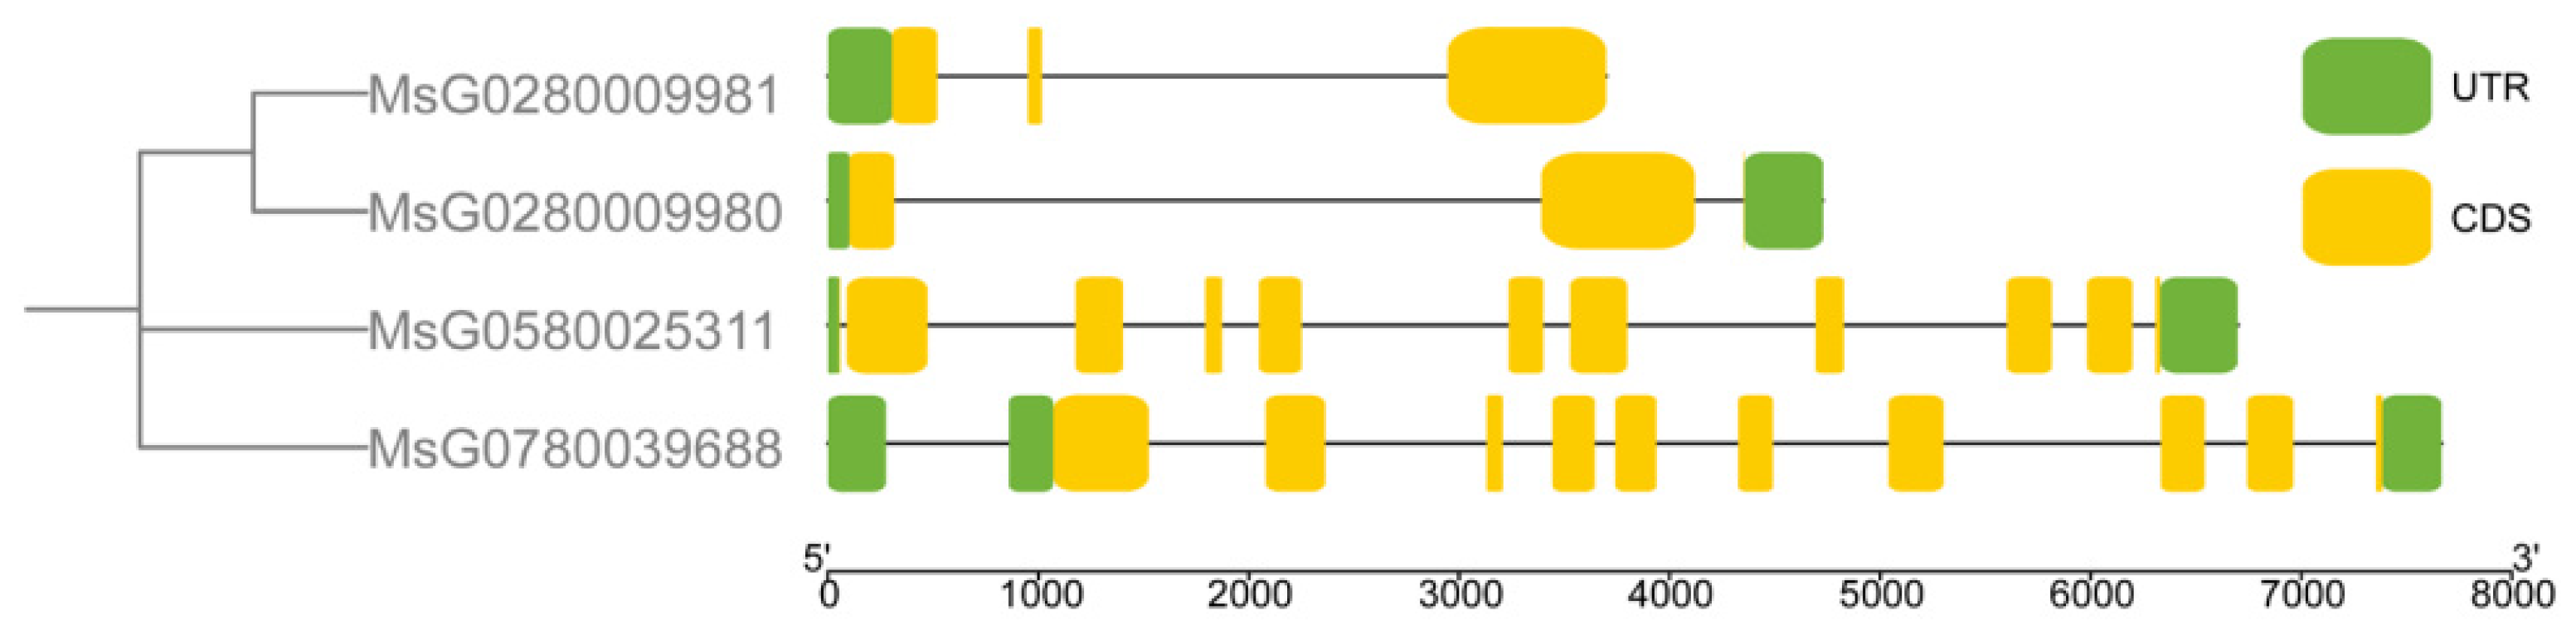
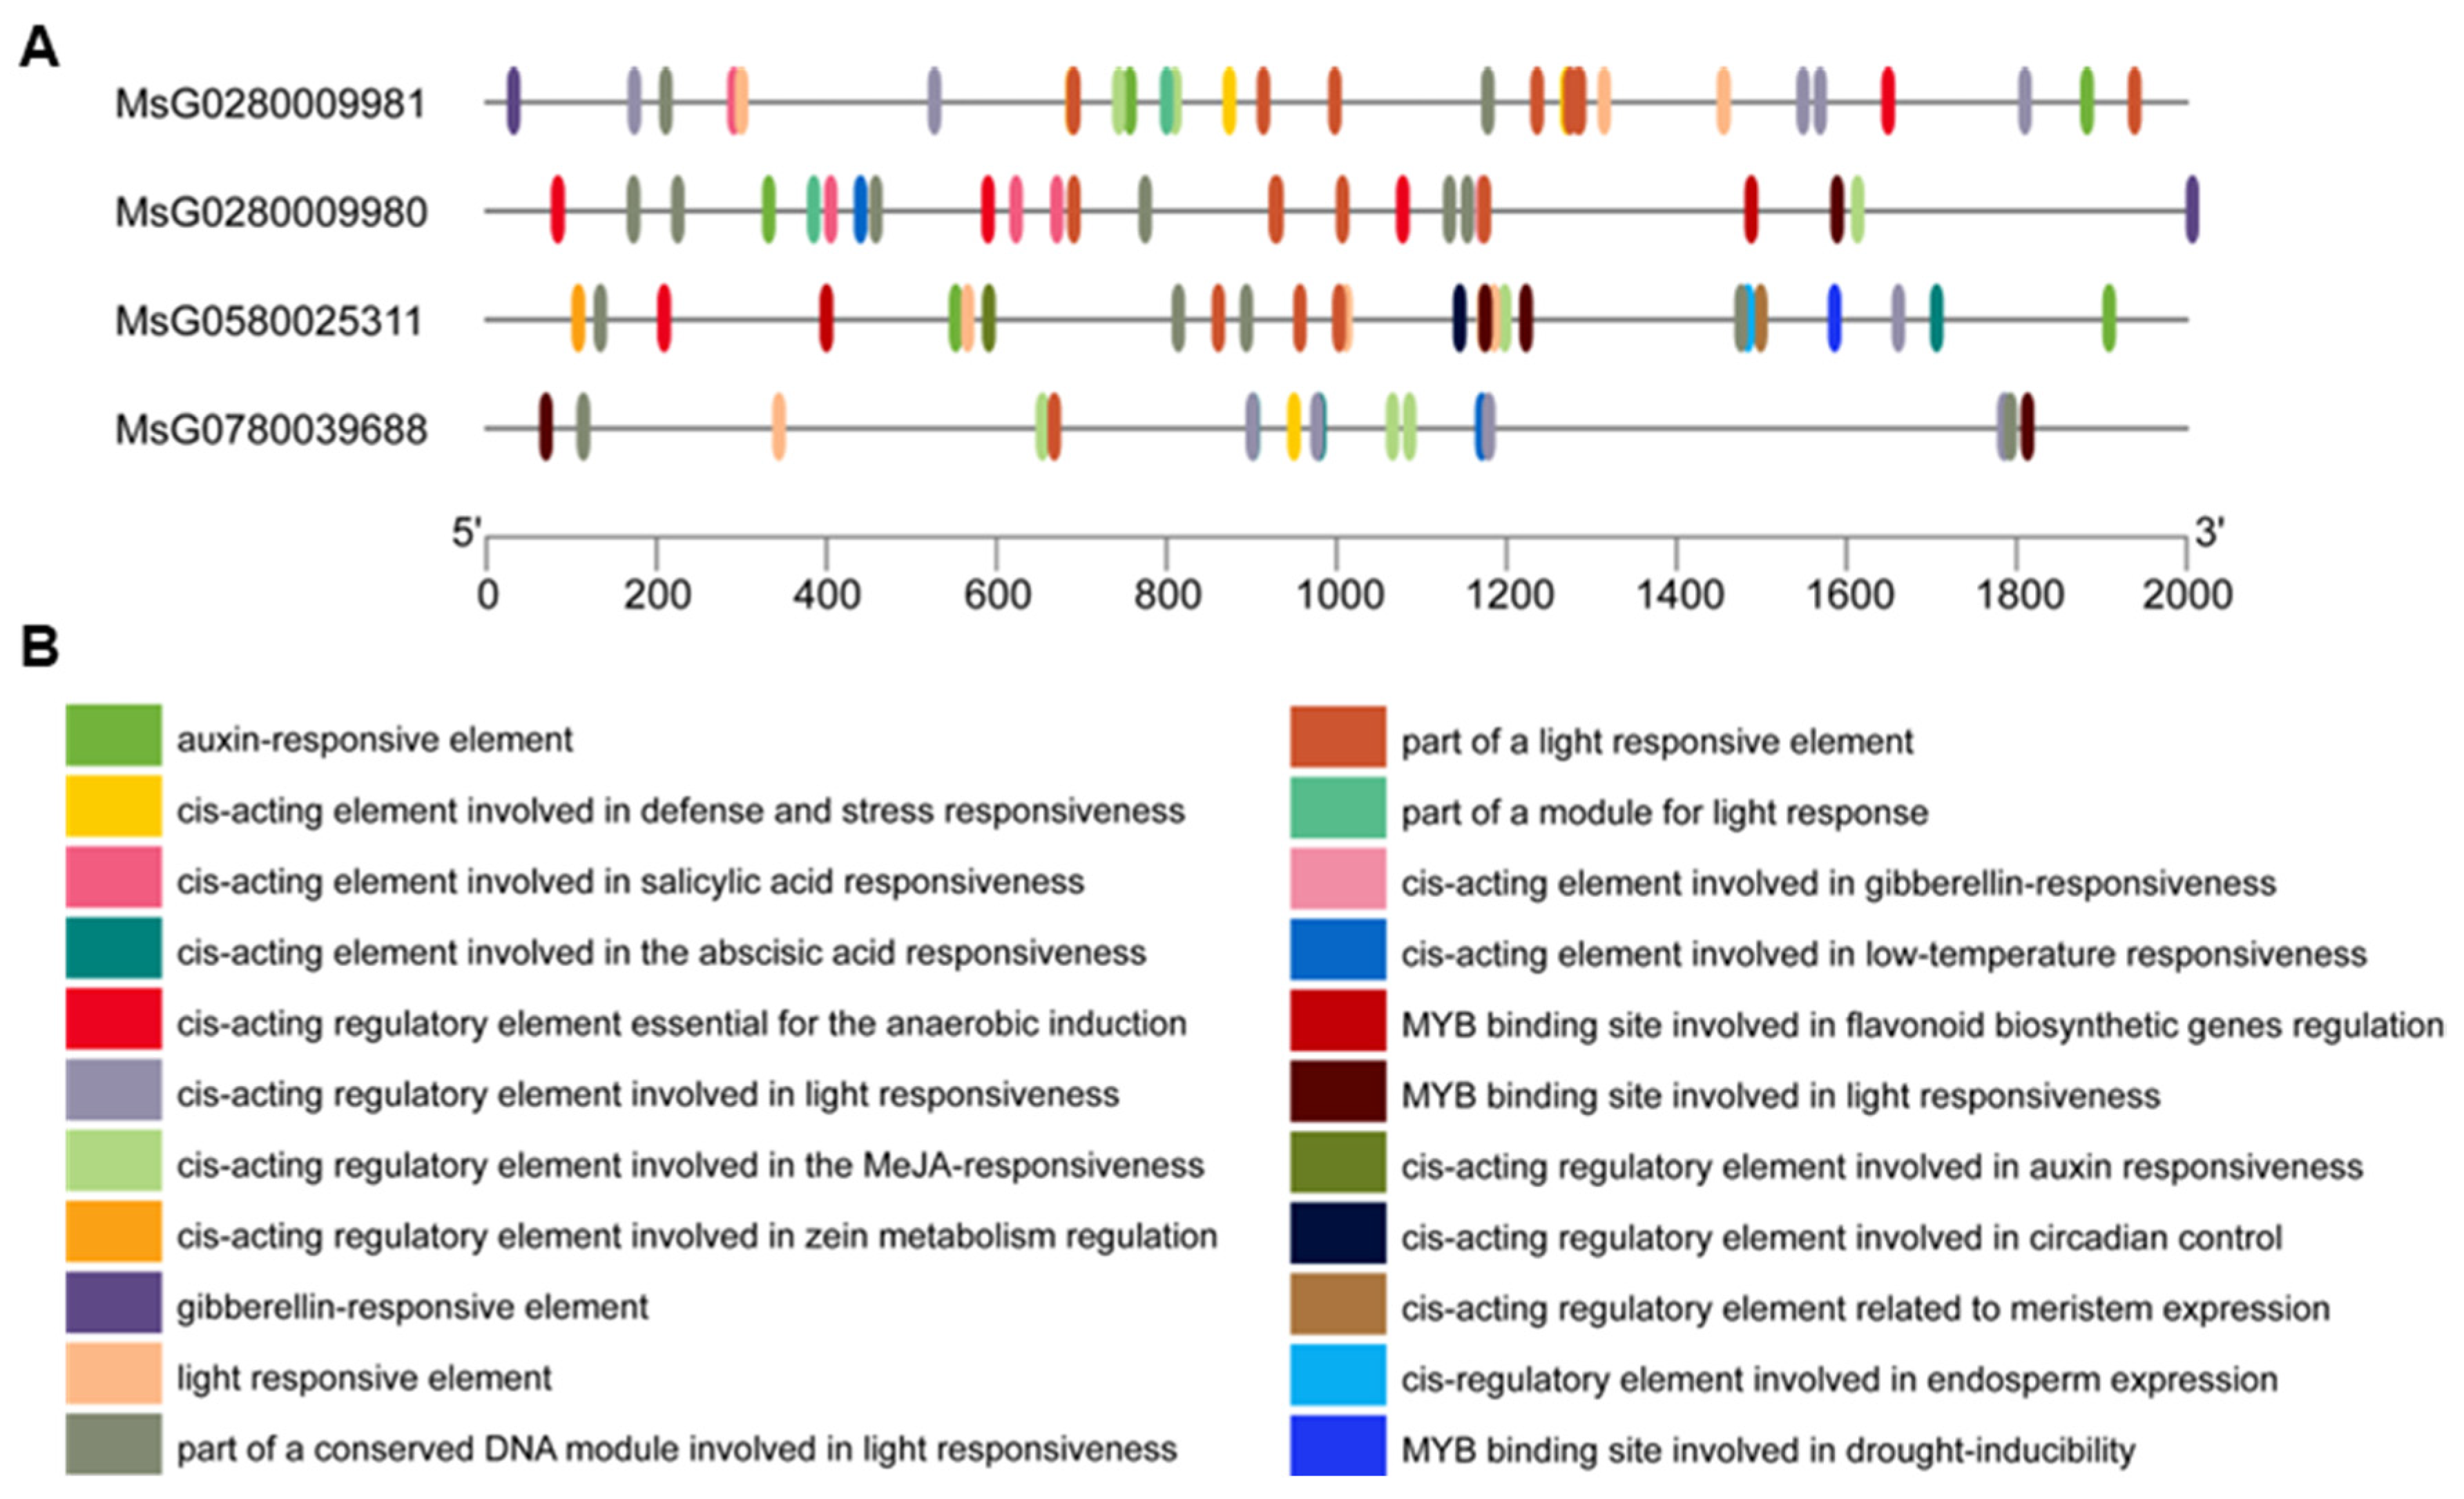
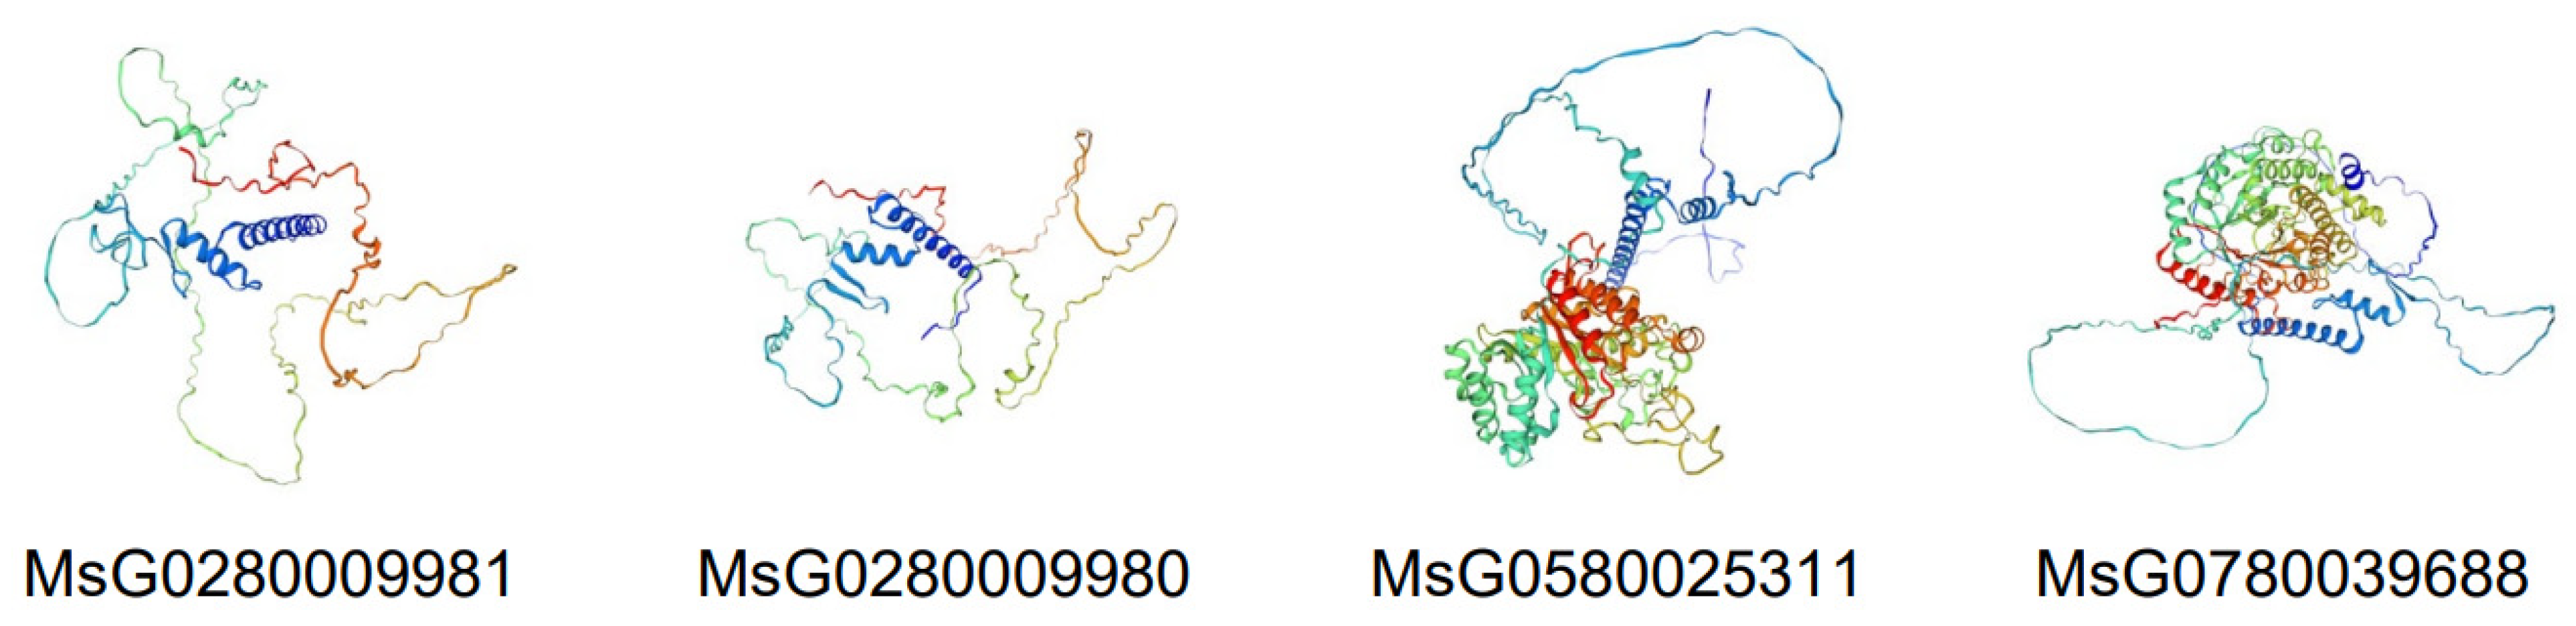
3.3. Conserved Motifs, Gene Structure, Cis-Regulatory Elements, and Three-Dimensional Structure Prediction of MsBES1s

To fully understand MsBES1 proteins’ structure, we analyzed the motif distribution of the four MsBES1s using the MEME (Multiple Em for Motif Elicitation) tool and identified six conserved motifs (Figure 2). The number of conserved motifs in four MsBES1 proteins varied from three to five. Motif 1 was highly conserved across all MsBES1s, while motifs 2, 3, and 5 were specific to subfamily II members MsG0580025311 and MsG0780039688. Motifs 4 and 6 were found only in subfamily I members MsG0280009981 and MsG0280009980. A gene structure analysis revealed 2 to 10 coding sequences (CDSs) and 1 to 3 untranslated regions (UTRs) in MsBES1 genes (Figure 3). The gene structure of the same subfamily was very close. All the genes in subfamily II (MsG0580025311 and MsG0780039688) had the highest (10) CDS number and the largest intron regions, and subfamily I members MsG0280009981 and MsG0280009980 had only 2 or 3 CDS numbers. The members in the same subfamily consist of similar conserved motifs and gene structures, indicating that they may play similar roles.
To further understand the potential regulatory mechanism of MsBES1 genes, a 2.0 kb promoter sequence upstream of MsBES1 genes’ start codon was analyzed to reveal potential cis-elements regulating MsBES1 transcription (Figure 4). Most cis-regulatory elements regulate phytohormone response, while others modulate light and abiotic stress responses. These findings indicated that MsBES1 gene expression is regulated by various phytohormones, light, and abiotic stresses. Similar cis-acting elements among different MsBES1 genes indicated evolutionary conservation within the gene family. In addition, we noted that there were defense and stress responsiveness elements in the promoter of MsG0280009981 and MsG0780039688, low-temperature responsiveness elements in the promoter of MsG0280009980 and MsG0780039688, and drought-inducibility element in the promoter of MsG058002531. Different cis-acting elements among different MsBES1 genes indicated that BES1s play roles in M. sativa defense against various environmental stresses.
The 3D structures of the four MsBES1 proteins were projected using ExPaSy SWISS-MODEL (Figure 5). The proteins were mainly constructed by α-helices and extended strands, with 8–24 α-helices distributed relatively evenly.

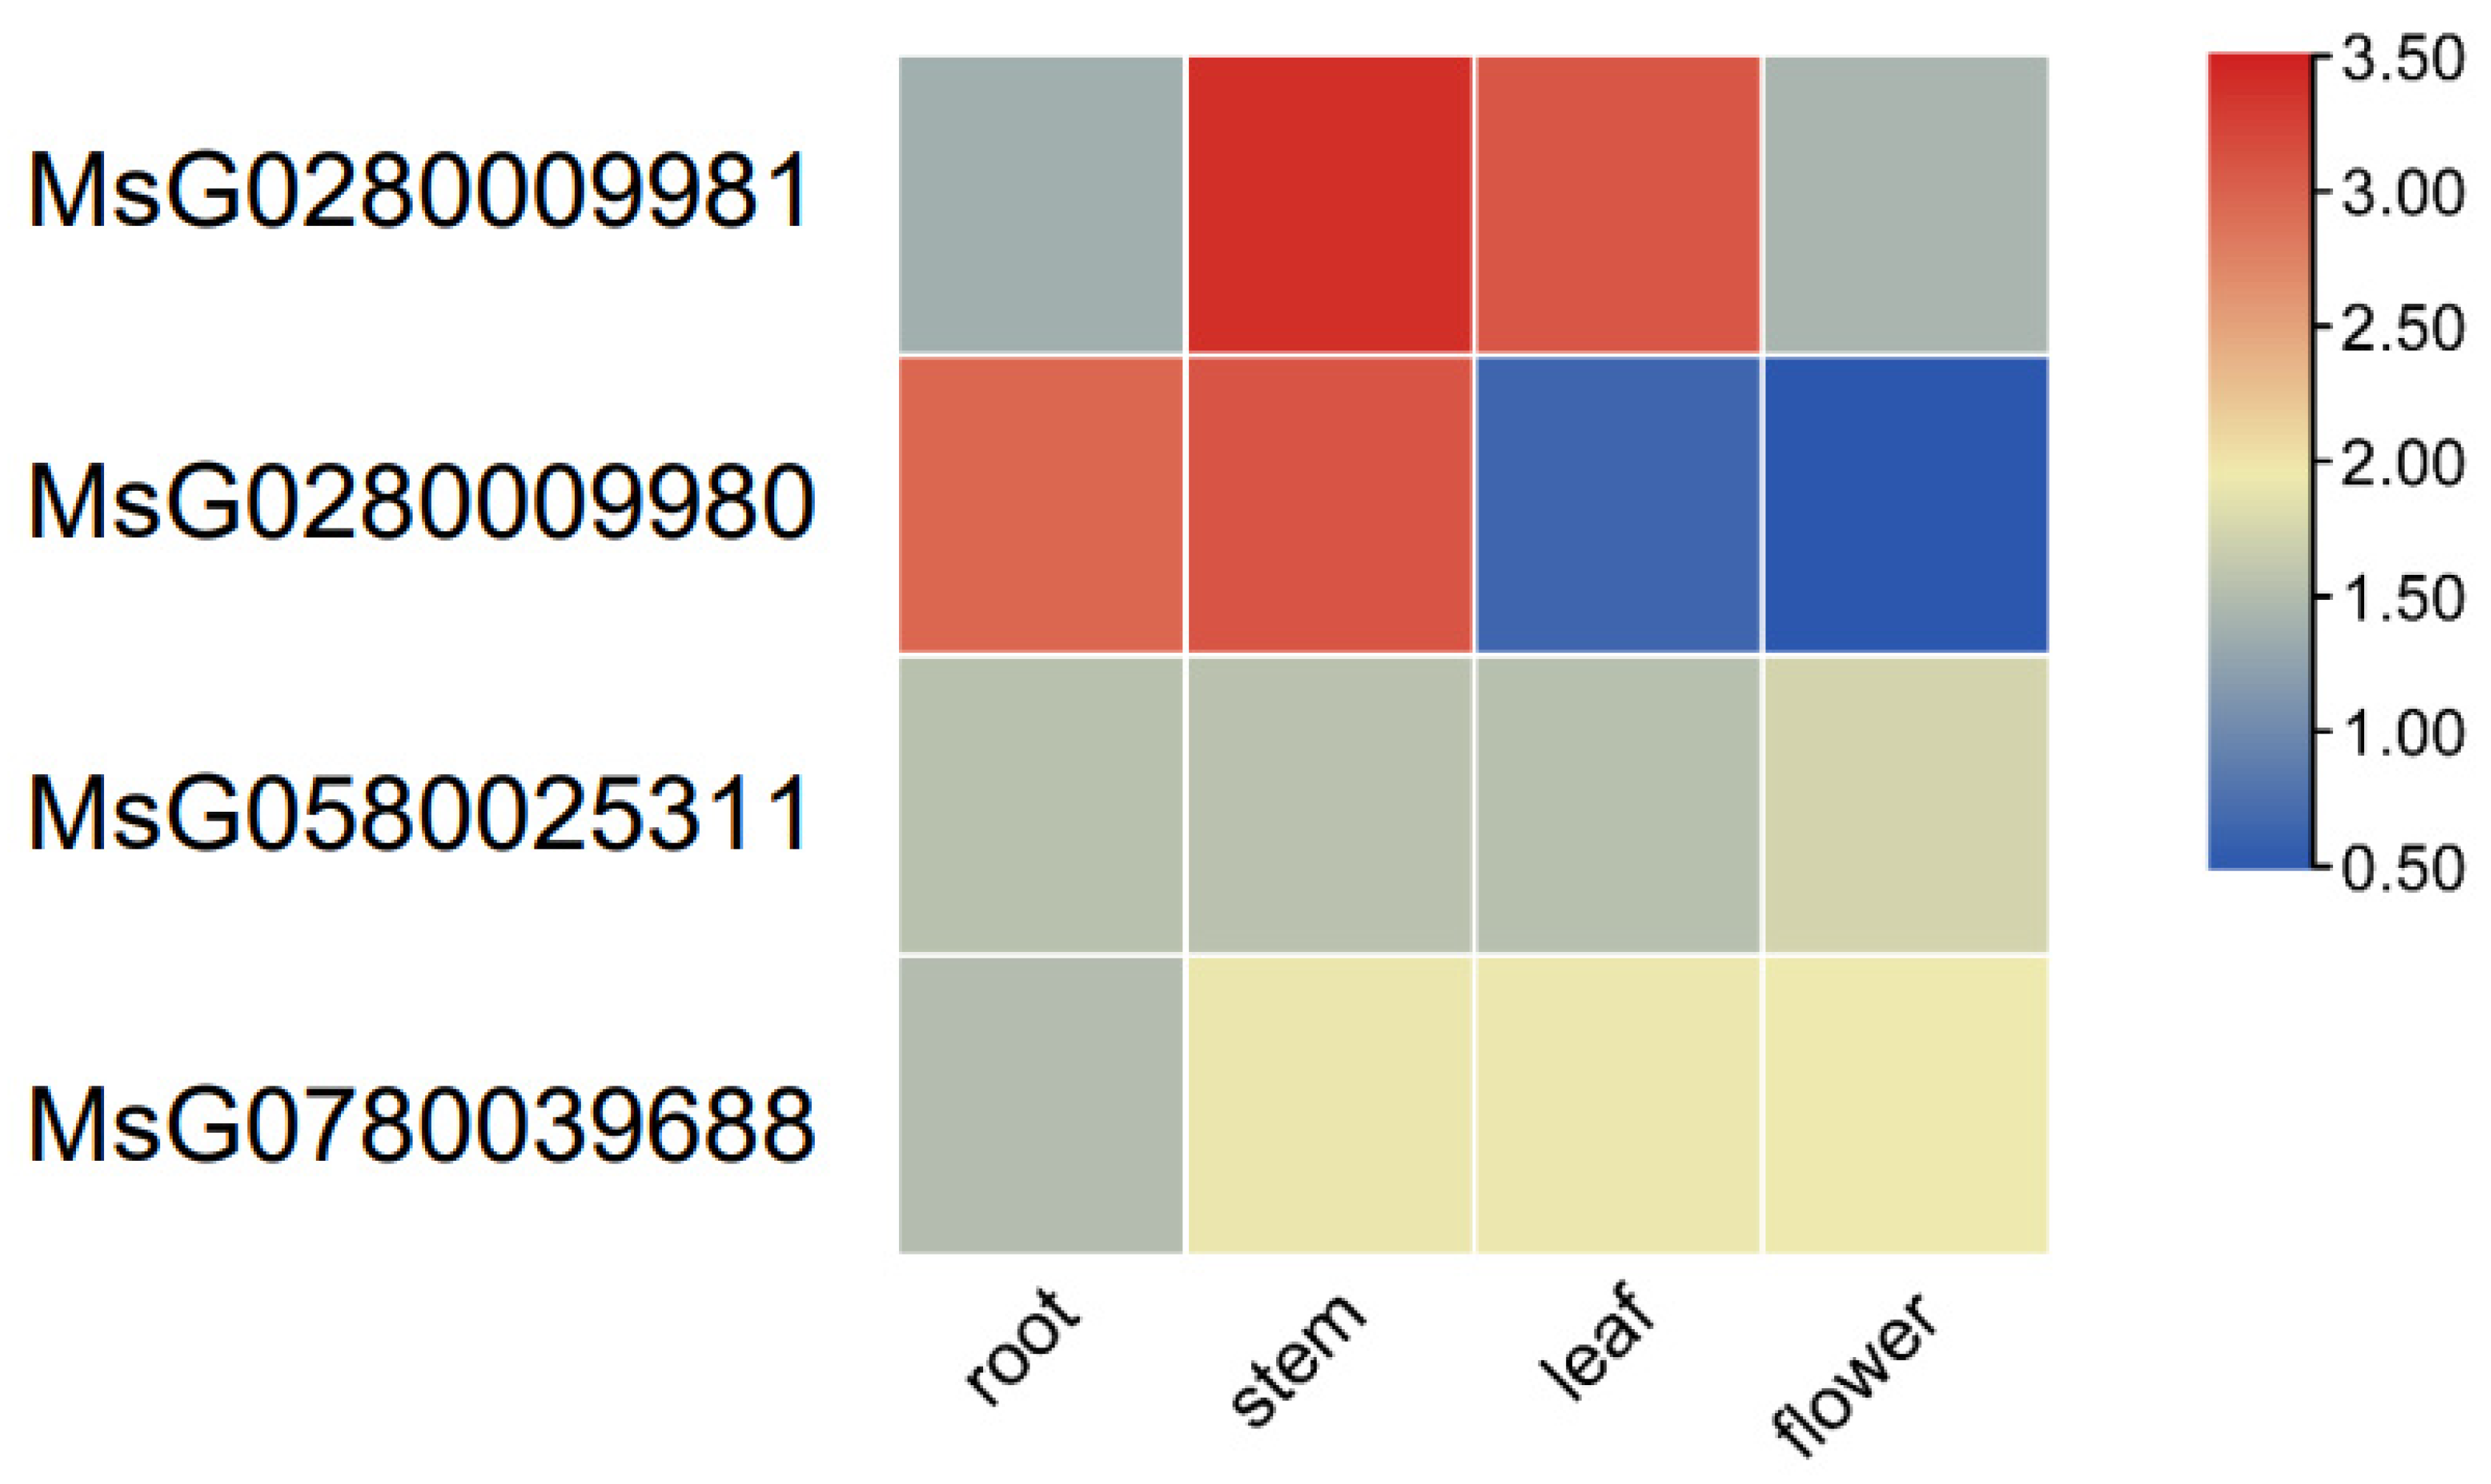
3.4. Transcriptome Analysis of MsBES1 Genes in Various Tissues

Analysis of gene expression is the basis of studying gene functions. To explore MsBES1 gene expression patterns, we examined their levels in M. sativa roots, stems, leaves, and flowers based on transcriptome sequencing (Figure 6). All four MsBES1 genes were expressed in these tissues. MsG0280009981 exhibited preferential expression in stems and leaves, while MsG0280009980 was predominantly expressed in stems and roots. MsG0580025311 and MsG0780039688 exhibited similar expression patterns across tissues. Members of subfamily I showed higher expression patterns compared to subfamily II. This suggests sub-functionalization or functional diversification among the MsBES1 paralogs, with subfamily II showing similar regulation patterns, unlike subfamily I.

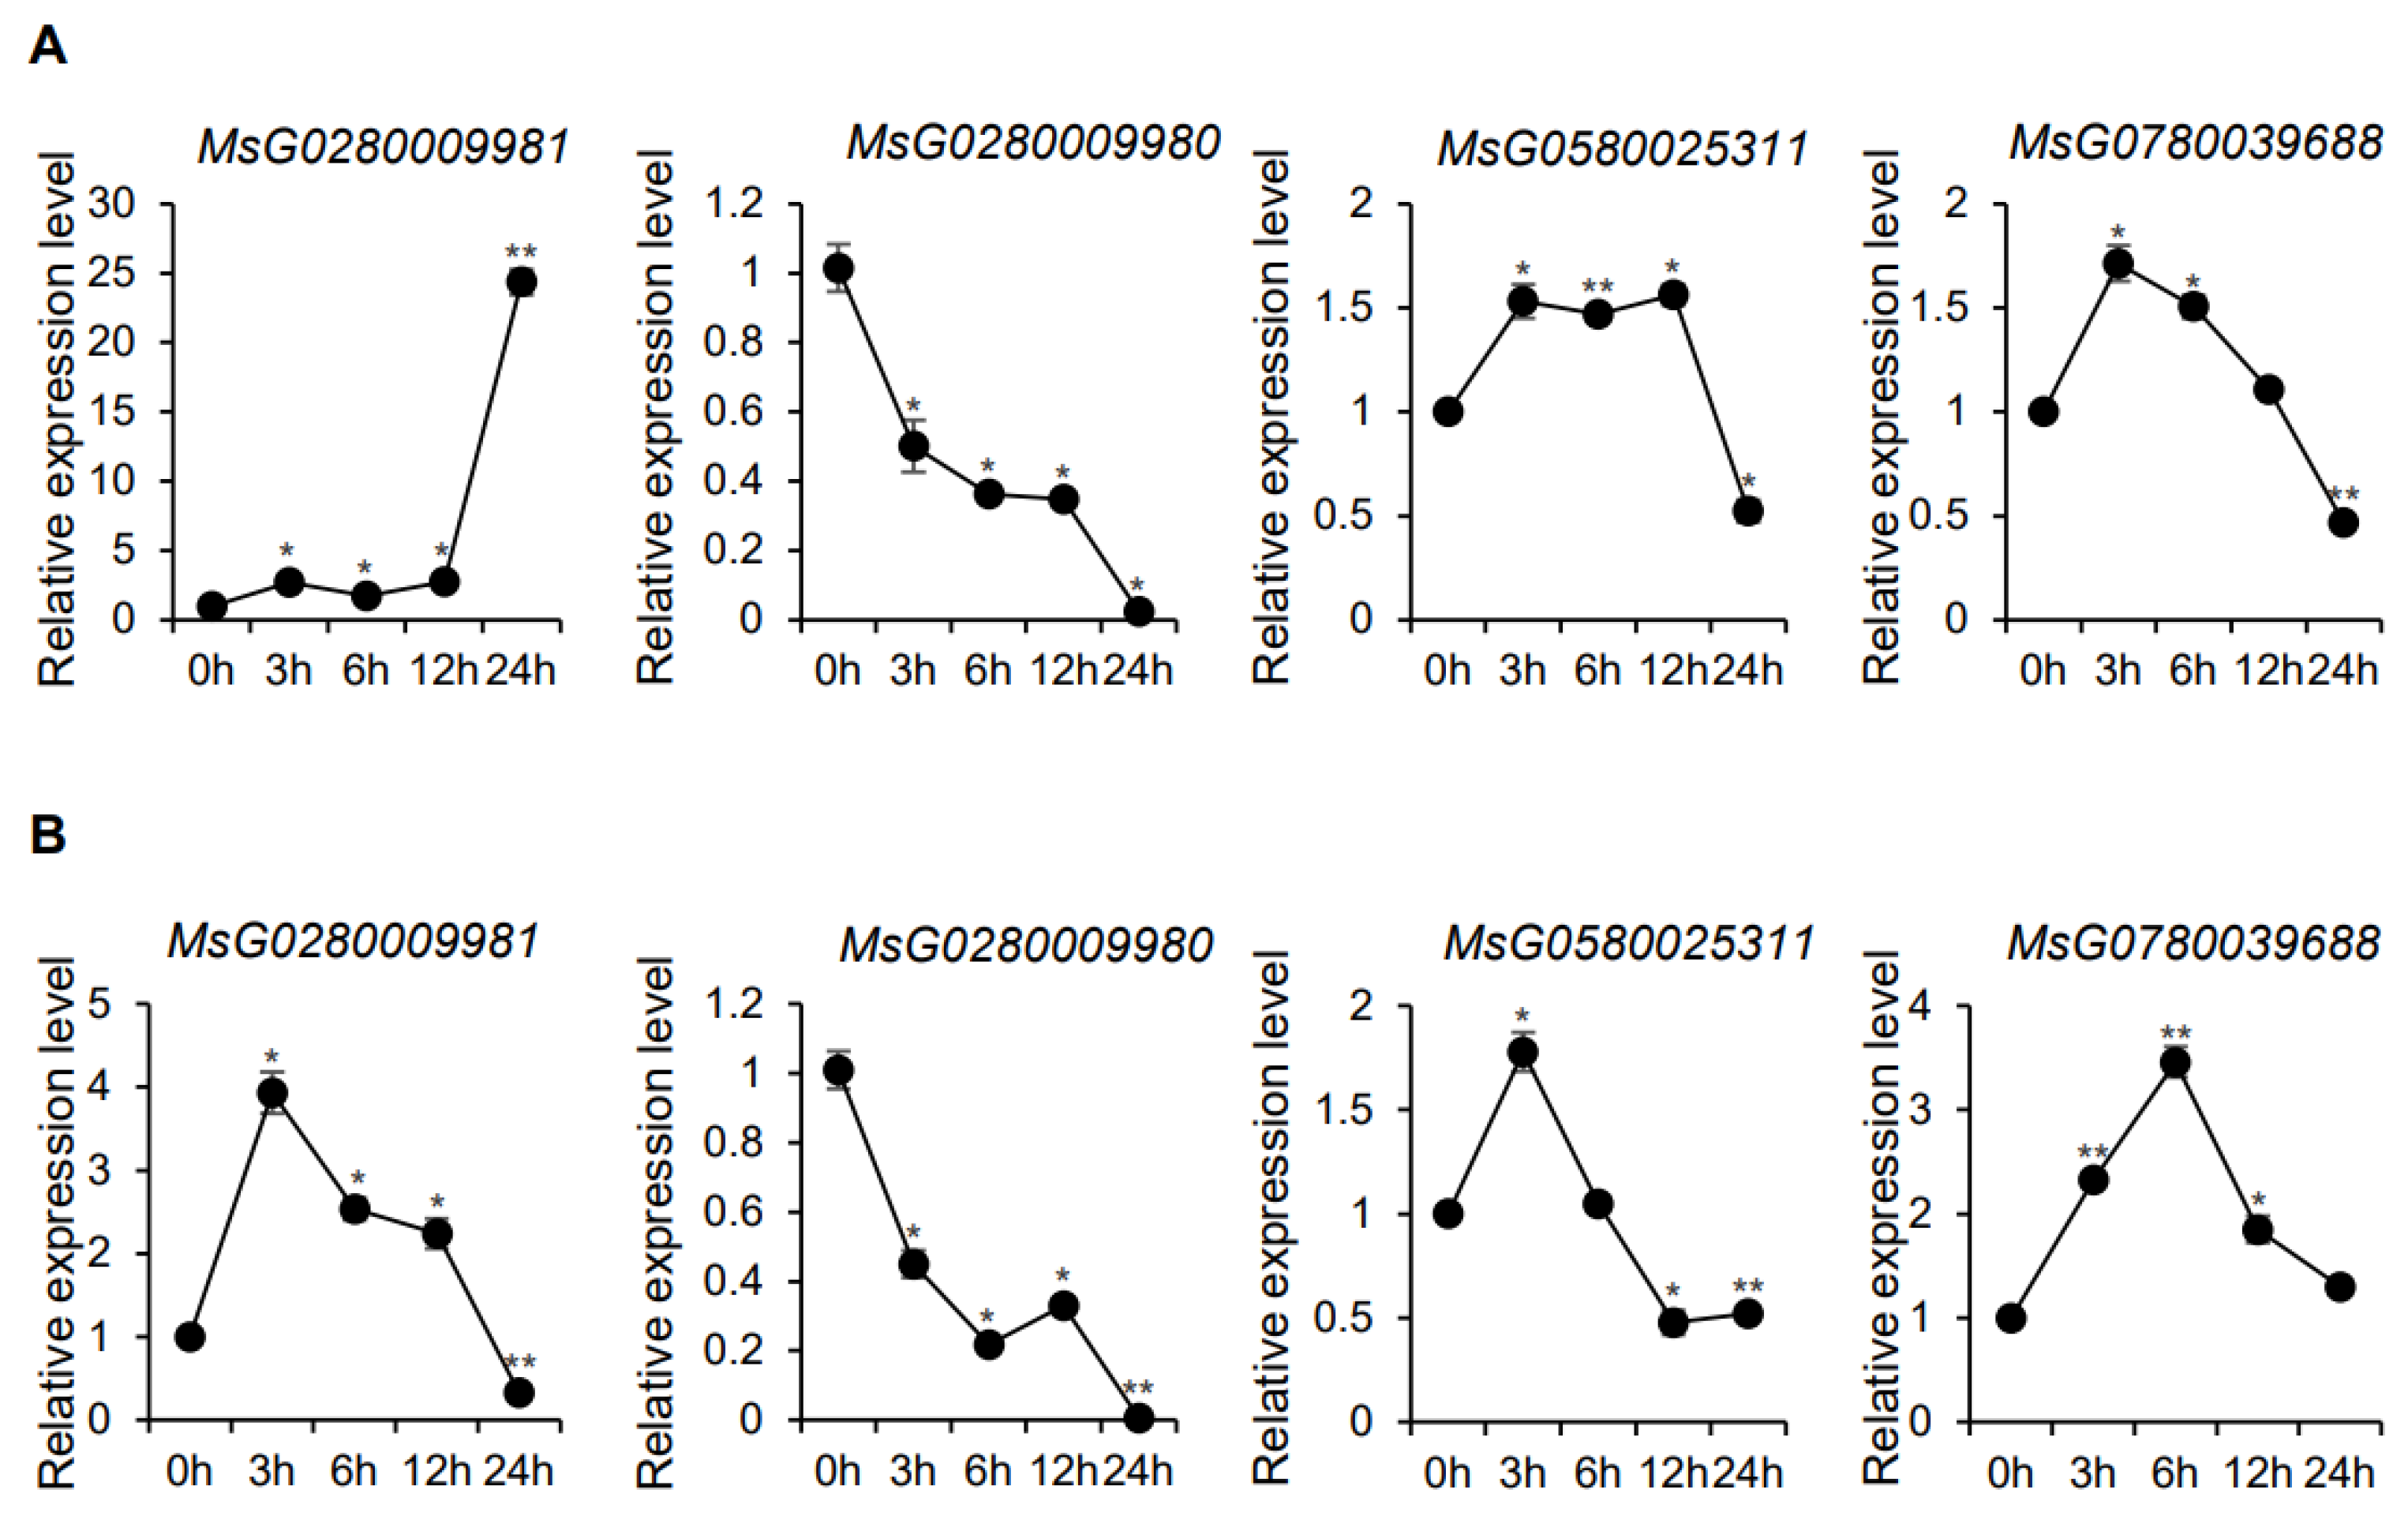
3.5. Expression of MsBES1 Genes under Different Abiotic Stress

Abiotic stresses pose a significant threat to the growth, survival, distribution, and productivity of plants. Among these, salt stress is one of the main abiotic factors affecting plant growth and development in nature environments and destroys the absorption of water and nutrients by plants [57]. To clarify the role of MsBES1s’ role under salt stress, we analyzed MsBES1 expression in M. sativa treated with 300 mM NaCl using qRT-PCR (real-time quantitative PCR); the primers are listed in Supplementary Table S3. As shown in Figure 7A, MsG0580025311 and MsG0780039688 showed significant early-stage increases, followed by decreases after 24 h. MsG0280009981 was upregulated, while MsG0280009980 was significantly suppressed, indicating different roles under salt stress. We also tested the expression of the four MsBES1 genes in untreated leaves to show mock expression patterns (Supplementary Figure S3), and the results showed MsG0780039688 had the highest expression level in leaves, and MsG0280009981 had the lowest expression level.
Drought stress affects plant growth by significantly reducing water absorption [58]. M. sativa was treated with 20% (w/v) PEG 6000 for drought stress, and MsBES1s expression in leaves was analyzed using qRT-PCR (Figure 7B). Most MsBES1s (MsG0280009981, MsG0580025311, and MsG0780039688) showed an initial increase, reaching their peaks at different times (3 h for MsG0280009981 and MsG0580025311 and 6 h for MsG0780039688), followed by a decrease. MsG0280009980 showed a continuous downregulation pattern under the PEG 6000 treatment. These results indicated that MsBES1 genes exhibit different expression patterns under abiotic stress, likely due to functional differentiation during evolution.
Low temperatures may damage vacuoles, leading to dehydration and death of the plant [59]. For further understanding of the function of MsBES1 genes, the expression patterns of low-temperatures treatment were analyzed based on MODMS database (Supplementary Figure S2). In these results, the expression level of MsG0280009981 was relatively higher, while the expression level of the same subfamily gene MsG0280009980 was relatively low. The expression levels of MsG0580025311 and MsG0780039688 from another subfamily were in the middle range. In general, all MsBES1 genes exhibit similar expression patterns under cold treatment for 0~48 h.

4. Discussion

The BES1 gene family is a group of plant-specific TFs that are involved in plant growth, development, stress adaptation, and responses to phytohormone and light [10,28,60,61]. To date, numerous BES1 gene family members have been identified in different plants. For example, 22 BES1 genes were identified in apples, nine in tomatoes, eight in grapevines, and six in rice [27,28,29,30,31]. However, the BES1 family in M. sativa has not been thoroughly studied. This research identified and characterized four MsBES1 genes in M. sativa. The phylogenetic analysis based on structural differences revealed that these genes are divided into two subfamilies, each containing two genes (Figure 1). Members within the same subfamily possess similar sequence lengths and physicochemical properties (Supplementary Table S2). These MsBES1 genes cluster closely with BES1 genes from Arabidopsis thaliana, soybean, tomato, and rice, indicating that they share a common ancestral origin.
The chromosome location analysis showed that two genes, MsG0280009981 and MsG0280009980, were closely positioned on the same chromosome. However, the positions of MsG0280009981 and MsG0280009980 on chromosomes were 62,283,844–62,287,544 and 62,273,143–62,277,871, respectively. Therefore, this it is not an alternative splicing event but may be due to the gene duplication.
The conserved-motif analysis identified six motifs across the MsBES1 proteins (Figure 2). All four MsBES1s possessed the conserved BES1_N domain. Members of subfamily I, MsG0280009981 and MsG0280009980, contained motifs 4 and 6, while members of subfamily II, MsG0580025311 and MsG0780039688, contained motifs 2, 3, and 5. Within the same subfamily, MsBES1s generally shared conserved motifs, indicating that they have similar functions. In contrast, different subfamilies had distinct conserved motifs, suggesting functional diversity through evolution. The gene structure analysis unveiled varying numbers of CDSs and intron regions for MsBES1s, with subfamily I and subfamily II exhibiting similar counts within their respective subfamilies (Figure 3). Subfamily I MsBES1s contained only 2 or 3 CDSs and intron regions, while subfamily II MsBES1 genes contained 10 CDSs and intron regions. The differences in CDSs and intron numbers suggested that MsBES1s may have undergone greater differentiation within subfamilies over long-term evolution.
Cis-regulatory elements are crucial for fine-tuning gene expression [62]. Feng et al. showed that maize ZmBES1 expression decreases drought tolerance when expressed in Arabidopsis thaliana, highlighting the role of BES1/BZR1s in crops [63]. Our study found that MsG0280009981 and MsG0780039688 genes had cis-elements for defense and stress responsiveness, MsG0280009980 and MsG0780039688 genes had cis-elements for low-temperature responsiveness element, and the MsG0580025311 had a drought-inducibility element (Figure 4). These findings suggested that MsBES1 genes may be abiotic-regulated genes and can respond to abiotic-regulation-related genes. In addition, most MsBES1 gene promoters have hormone-responsive elements and low temperature, anaerobic induction, and flavonoid biosynthetic gene regulation elements. Plant phytohormones, ABA and JA, take part in the stress-responsiveness in some plant species [64,65,66]. These results indicated that MsBES1 genes are essential in abiotic stress, hormone modulation, and flavonoid biosynthesis.
The tissue-specific expression analysis revealed that the four MsBES1 genes were expressed in roots, stems, leaves, and flowers, albeit with different levels in each tissue (Figure 6). MsG0280009981 had highly expressed in leaves and stems, suggesting its role in M. sativa’s stress responsiveness, as it was induced by stress hormones, ABA and JA, with corresponding cis-elements in its promoter. The MsG0280009980 gene was mainly expressed in the roots and stems, indicating a specific function in these tissues. MsG0580025311 and MsG0780039688 showed similar expression patterns across different tissues, indicating systematic functions. These findings underscored the significance of MsBES1 genes in M. sativa development and stress responsiveness.
Drought and salt are significant environmental stresses that limit the growth, development, and distribution of M. sativa [67,68]. To investigate the response of MsBES1 genes to these stresses, we analyzed the expression levels of those genes in leaves under treatments with 20% PEG-6000 and 350 mM NaCl. The results showed that MsG0280009981 was significantly upregulated under both treatments, indicating that it plays a positive regulatory role under these stresses (Figure 7). In contrast, MsG0280009980, as a member of the same subfamily, shows significantly suppressed, suggesting it may have an opposite function. During the early stages of drought and salt stress, the expression levels of MsG0580025311 and MsG0780039688 increased. We identified a drought-inducibility element in the promoter of the MsG0580025311 gene, which is consistent with its role in drought defense. We tested the expression levels of the MsBES1 genes in untreated leaves, and the results showed that MsG0780039688 had the highest expression level in leaves, while MsG0280009981 had the lowest, and MsG0280009980 and MsG0580025311 had intermediate levels (Supplementary Figure S3). The lower expression of MsG0280009981 might be due to different growth periods of M. sativa. We also tested the expression patterns of MsBES1 genes under low temperature treatment based on the MODMS database (Supplementary Figure S2). There was no significant difference for each MsBES1s after 48 h of cold treatment. Further functional validation for MsBES1 genes is needed to better understand their roles and mechanisms under abiotic stress.

5. Conclusions

This study identified four putative MsBES1 genes containing the typical BES1_N domain using whole-genome sequence datasets from Zhongmu No. 1. These genes were divided into two subfamilies, each with similar structural features, motif numbers, and CDSs. The MsBES1 genes contain abundant cis-elements in their upstream promoter regions, responsive to light, hormones, low temperatures, anaerobic inductions, and flavonoid biosynthesis. Each MsBES1 gene showed distinct tissue-specific expression patterns, with MsG0280009981 primarily expressed in leaves and organs, while MsG0280009980 was mainly expressed in roots and stems. All four genes (MsG0280009981, MsG0280009980, MsG0580025311, and MsG0780039688) likely play critical roles in salt and drought stress responses. Our study enhances our understanding of the BES1 gene family’s function in M. sativa.

Supplementary Materials

The following supporting information can be downloaded at: https://www.mdpi.com/article/10.3390/agronomy14102287/s1. Supplementary Table S1. Protein sequence of the BES1 gene family in M. Sativa. Supplementary Table S2. Gene IDs of the BES1 gene family members from four plant species. Supplementary Table S3. Primers used in qRT-PCR. Supplementary Table S4. The raw data of MsBES1s expression levels in different tissues. Supplementary Figure S1. Chromosomal location of identified MsBES1 genes on the 3 chromosomes of M. sativa. The right part bars represent the different chromosomes of M. sativa, and the left part showed a scale for chromosome length. Supplementary Figure S2. Expression analysis of MsBES1s under low temperature. Supplementary Figure S3. Expression analysis of MsBES1s in untreated leaves of M. sativa. Quantitative RT-PCR analysis of the expression of MsBES1s mRNA in the untreated leaves of M. sativa. The MsActin gene was used as internal reference gene. Different letters on top of each column indicate significant differences (Student’s t-test).

Author Contributions

Methodology, Z.C.; Validation, Y.Q.; Formal analysis, F.C.; Resources, R.J.; Data curation, K.L.; Writing—original draft, Z.C.; Writing—review & editing, Y.Z. All authors have read and agreed to the published version of the manuscript.

Funding

The author(s) declare financial support was received for the research, authorship, and/or publication of this article. This research was funded by the 2022 High Level Talents Project of Inner Mongolia (Grant No. 2023NMRC002), the Natural Science Foundation of Inner Mongolia Autonomous Region (Grant No. 2023QN03034), and the Central Public-interest Scientific Institution Basal Research Fund (Grant No. 1610332023003).

Data Availability Statement

The original contributions presented in the study are included in the article/Supplementary Material, further inquiries can be directed to the corresponding authors.

Conflicts of Interest

The authors declare no conflicts of interest.

References

  1. Wei, Z.Y.; Li, J. Brassinosteroids regulate root growth, development, and symbiosis. Mol. Plant 2016, 9, 86–100. [Google Scholar] [CrossRef] [PubMed]
  2. Kim, E.J.; Russinova, E. Brassinosteroid signalling. Curr. Biol. 2020, 30, R294–R298. [Google Scholar] [CrossRef] [PubMed]
  3. Oklestkova, J.; Rárová, L.; Kvasnica, M.; Strnad, M. Brassinosteroids: Synthesis and biological activities. Phytochem. Rev. 2015, 14, 1053–1072. [Google Scholar] [CrossRef]
  4. Saini, S.; Sharma, I.; Pati, P.K. Versatile roles of brassinosteroid in plants in the context of its homoeostasis, signaling and crosstalks. Front. Plant Sci. 2015, 6, 950. [Google Scholar] [CrossRef]
  5. Fridman, Y.; Savaldi-Goldstein, S. Brassinosteroids in growth control: How, when and where. Plant Sci. 2013, 209, 24–31. [Google Scholar] [CrossRef]
  6. Yin, Y.; Wang, Z.Y.; Mora-Garcia, S.; Li, J.; Yoshida, S.; Asami, T.; Chory, J. BES1 accumulates in the nucleus in response to brassinosteroids to regulate gene expression and promote stem elongation. Cell 2002, 109, 181–191. [Google Scholar] [CrossRef]
  7. Cao, X.; Wei, Y.; Shen, B.; Liu, L.; Mao, J. Interaction of the Transcription Factors BES1/BZR1 in Plant Growth and Stress Response. Int. J. Mol. Sci. 2024, 25, 6836. [Google Scholar] [CrossRef]
  8. Manghwar, H.; Hussain, A.; Ali, Q.; Liu, F. Brassinosteroids (BRs) Role in Plant Development and Coping with Different Stresses. Int. J. Mol. Sci. 2022, 23, 1012. [Google Scholar] [CrossRef]
  9. Qiao, S.; Sun, S.; Wang, L.; Wu, Z.; Li, C.; Li, X.; Wang, T.; Leng, L.; Tian, W.; Lu, T.; et al. The RLA1/SMOS1 Transcription Factor Functions with OsBZR1 to Regulate Brassinosteroid Signaling and Rice Architecture. Plant Cell 2017, 29, 292–309. [Google Scholar] [CrossRef]
  10. Ye, H.; Li, L.; Guo, H.; Yin, Y. MYBL2 is a substrate of GSK3-like kinase BIN2 and acts as a corepressor of BES1 in brassinosteroid signaling pathway in. Proc. Natl. Acad. Sci. USA 2012, 109, 20142–20147. [Google Scholar] [CrossRef]
  11. Gampala, S.S.; Kim, T.W.; He, J.X.; Tang, W.; Deng, Z.; Bai, M.Y.; Guan, S.; Lalonde, S.; Sun, Y.; Gendron, J.M.; et al. An essential role for 14-3-3 proteins in brassinosteroid signal transduction in Arabidopsis. Dev. Cell 2007, 13, 177–189. [Google Scholar] [CrossRef] [PubMed]
  12. Song, X.; Ma, X.; Li, C.; Hu, J.; Yang, Q.; Wang, T.; Wang, L.; Wang, J.; Guo, D.; Ge, W.; et al. Comprehensive analyses of the BES1 gene family in Brassica napus and examination of their evolutionary pattern in representative species. BMC Genom. 2018, 19, 346. [Google Scholar] [CrossRef]
  13. Ryu, H.; Cho, H.; Bae, W.; Hwang, I. Control of early seedling development by BES1/TPL/HDA19-mediated epigenetic regulation of. Nat. Commun. 2014, 5, 4138. [Google Scholar] [CrossRef]
  14. Yu, X.; Li, L.; Zola, J.; Aluru, M.; Ye, H.; Foudree, A.; Guo, H.; Anderson, S.; Aluru, S.; Liu, P.; et al. A brassinosteroid transcriptional network revealed by genome-wide identification of BESI target genes in. Plant J. 2011, 65, 634–646. [Google Scholar] [CrossRef] [PubMed]
  15. Nolan, T.M.; Vukašinović, N.; Liu, D.; Russinova, E.; Yin, Y. Brassinosteroids: Multidimensional Regulators of Plant Growth, Development, and Stress Responses. Plant Cell 2020, 32, 295–318. [Google Scholar] [CrossRef]
  16. Lv, M.; Li, J. Molecular Mechanisms of Brassinosteroid-Mediated Responses to Changing Environments in Arabidopsis. Int. J. Mol. Sci. 2020, 21, 2737. [Google Scholar] [CrossRef] [PubMed]
  17. Li, Q.F.; Lu, J.; Yu, J.W.; Zhang, C.Q.; He, J.X.; Liu, Q.Q. The brassinosteroid-regulated transcription factors BZR1/BES1 function as a coordinator in multisignal-regulated plant growth. Biochim. Biophys. Acta Gene Regul. Mech. 2018, 1861, 561–571. [Google Scholar] [CrossRef]
  18. González-García, M.P.; Vilarrasa-Blasi, J.; Zhiponova, M.; Divol, F.; Mora-García, S.; Russinova, E.; Caño-Delgado, A.I. Brassinosteroids control meristem size by promoting cell cycle progression in Arabidopsis roots. Development 2011, 138, 849–859. [Google Scholar] [CrossRef]
  19. Yang, R.; Liu, P.; Zhang, T.; Dong, H.; Jing, Y.; Yang, Z.; Tang, S.; Zhang, Y.; Lv, M.; Liu, J.; et al. Plant-specific BLISTER interacts with kinase BIN2 and Brassinazole Resistant1 during skotomorphogenesis. Plant Physiol. 2023, 193, 1580–1596. [Google Scholar] [CrossRef]
  20. Zhao, N.; Zhao, M.; Tian, Y.; Wang, Y.; Han, C.; Fan, M.; Guo, H.; Bai, M.Y. Interaction between BZR1 and EIN3 mediates signalling crosstalk between brassinosteroids and ethylene. New Phytol. 2021, 232, 2308–2323. [Google Scholar] [CrossRef]
  21. Wang, L.; Tian, Y.; Shi, W.; Yu, P.; Hu, Y.; Lv, J.; Fu, C.; Fan, M.; Bai, M.Y. The miR396-GRFs Module Mediates the Prevention of Photo-oxidative Damage by Brassinosteroids during Seedling De-Etiolation in Arabidopsis. Plant Cell 2020, 32, 2525–2542. [Google Scholar] [CrossRef]
  22. Ravindran, N.; Ramachandran, H.; Job, N.; Yadav, A.; Vaishak, K.P.; Datta, S. B-box protein BBX32 integrates light and brassinosteroid signals to inhibit cotyledon opening. Plant Physiol. 2021, 187, 446–461. [Google Scholar] [CrossRef]
  23. Ji, Y.; Qu, Y.; Jiang, Z.; Yan, J.; Chu, J.; Xu, M.; Su, X.; Yuan, H.; Wang, A. The mechanism for brassinosteroids suppressing climacteric fruit ripening. Plant Physiol. 2021, 185, 1875–1893. [Google Scholar] [CrossRef]
  24. Zhang, Y.; Li, B.; Xu, Y.; Li, H.; Li, S.; Zhang, D.; Mao, Z.; Guo, S.; Yang, C.; Weng, Y.; et al. The cyclophilin CYP20-2 modulates the conformation of Brassinazole-Resistant1, which binds the promoter of Flowering Locus D to regulate flowering in Arabidopsis. Plant Cell 2013, 25, 2504–2521. [Google Scholar] [CrossRef]
  25. Tian, X.; He, M.; Mei, E.; Zhang, B.; Tang, J.; Xu, M.; Liu, J.; Li, X.; Wang, Z.; Tang, W.; et al. WRKY53 integrates classic brassinosteroid signaling and the mitogen-activated protein kinase pathway to regulate rice architecture and seed size. Plant Cell 2021, 33, 2753–2775. [Google Scholar] [CrossRef]
  26. Chen, J.; Nolan, T.M.; Ye, H.; Zhang, M.; Tong, H.; Xin, P.; Chu, J.; Chu, C.; Li, Z.; Yin, Y. Arabidopsis WRKY46, WRKY54, and WRKY70 Transcription Factors Are Involved in Brassinosteroid-Regulated Plant Growth and Drought Responses. Plant Cell 2017, 29, 1425–1439. [Google Scholar] [CrossRef]
  27. Albertos, P.; Dündar, G.; Schenk, P.; Carrera, S.; Cavelius, P.; Sieberer, T.; Poppenberger, B. Transcription factor BES1 interacts with HSFA1 to promote heat stress resistance of plants. EMBO J. 2022, 41, e108664. [Google Scholar] [CrossRef]
  28. Li, H.; Ye, K.; Shi, Y.; Cheng, J.; Zhang, X.; Yang, S. BZR1 Positively Regulates Freezing Tolerance via CBF-Dependent and CBF-Independent Pathways in Arabidopsis. Mol. Plant 2017, 10, 545–559. [Google Scholar] [CrossRef]
  29. Cao, X.; Khaliq, A.; Lu, S.; Xie, M.; Ma, Z.; Mao, J.; Chen, B. Genome-wide identification and characterization of the BES1 gene family in apple (Malus domestica). Plant Biol. 2020, 22, 723–733. [Google Scholar] [CrossRef]
  30. Su, D.; Xiang, W.; Wen, L.; Lu, W.; Shi, Y.; Liu, Y.; Li, Z. Genome-wide identification, characterization and expression analysis of BES1 gene family in tomato. BMC Plant Biol. 2021, 21, 161. [Google Scholar] [CrossRef]
  31. Li, J.; Wang, L.; Leng, F.; Ma, C.; Zhang, C.; Wang, S. Genome-wide identification, characterization and gene expression of BES1 transcription factor family in grapevine (Vitis vinifera L.). Sci. Rep. 2023, 13, 240. [Google Scholar] [CrossRef]
  32. Cheng, M.; Yuan, H.; Wang, R.; Wang, W.; Zhang, L.; Fan, F.; Li, S. Identification and characterization of BES1 genes involved in grain size development of Oryza sativa L. Int. J. Biol. Macromol. 2023, 253 Pt 6, 127327. [Google Scholar] [CrossRef]
  33. Yan, Q.; Wang, L.; Li, X. GmBEHL1, a BES1/BZR1 family protein, negatively regulates soybean nodulation. Sci. Rep. 2018, 8, 7614. [Google Scholar] [CrossRef]
  34. Park, C.R.; Nguyen, V.T.; Min, J.H.; Sang, H.; Lim, G.H.; Kim, C.S. Isolation and Functional Characterization of Soybean BES1/BZR1 Homolog 3-Like 1 (GmBEH3L1) Associated with Dehydration Sensitivity and Brassinosteroid Signaling in Arabidopsis thaliana. Plants 2022, 11, 2565. [Google Scholar] [CrossRef]
  35. Liao, K.; Peng, Y.J.; Yuan, L.B.; Dai, Y.S.; Chen, Q.F.; Yu, L.J.; Bai, M.Y.; Zhang, W.Q.; Xie, L.J.; Xiao, S. Brassinosteroids Antagonize Jasmonate-Activated Plant Defense Responses through BRI1-EMS-SUPPRESSOR1 (BES1). Plant Physiol. 2020, 182, 1066–1082. [Google Scholar] [CrossRef]
  36. Oh, E.; Zhu, J.Y.; Wang, Z.Y. Interaction between BZR1 and PIF4 integrates brassinosteroid and environmental responses. Nat. Cell Biol. 2012, 14, 802–809. [Google Scholar] [CrossRef]
  37. Jia, C.; Zhao, S.; Bao, T.; Zhao, P.; Peng, K.; Guo, Q.; Gao, X.; Qin, J. Tomato BZR/BES transcription factor SlBZR1 positively regulates BR signaling and salt stress tolerance in tomato and Arabidopsis thaliana. Plant Sci. 2021, 302, 110719. [Google Scholar] [CrossRef]
  38. Sun, F.; Ding, L.; Feng, W.; Cao, Y.; Lu, F.; Yang, Q.; Li, W.; Lu, Y.; Shabek, N.; Fu, F.; et al. Maize transcription factor ZmBES1/BZR1-5 positively regulates kernel size. J. Exp. Bot. 2021, 72, 1714–1726. [Google Scholar] [CrossRef]
  39. Mecchia, M.A.; García-Hourquet, M.; Lozano-Elena, F.; Planas-Riverola, A.; Blasco-Escamez, D.; Marquès-Bueno, M.; Mora-García, S.; Caño-Delgado, A.I. The BES1/BZR1-family transcription factor MpBES1 regulates cell division and differentiation in Marchantia polymorpha. Curr. Biol. 2021, 31, 4860–4869.e8. [Google Scholar] [CrossRef]
  40. Lorenzo, C.D.; García-Gagliardi, P.; Antonietti, M.S.; Sánchez-Lamas, M.; Mancini, E.; Dezar, C.A.; Vazquez, M.; Watson, G.; Yanovsky, M.J.; Cerdán, P.D. Improvement of alfalfa forage quality and management through the down-regulation of MsFTa1. Plant Biotechnol. J. 2020, 18, 944–954. [Google Scholar] [CrossRef]
  41. Wang, Q.; Hu, J.; Lou, T.; Li, Y.; Shi, Y.; Hu, H. Integrated agronomic, physiological, microstructure, and whole-transcriptome analyses reveal the role of biomass accumulation and quality formation during Se biofortification in alfalfa. Front. Plant Sci. 2023, 14, 1198847. [Google Scholar] [CrossRef]
  42. Shen, C.; Du, H.; Chen, Z.; Lu, H.; Zhu, F.; Chen, H.; Meng, X.; Liu, Q.; Liu, P.; Zheng, L.; et al. The Chromosome-Level Genome Sequence of the Autotetraploid Alfalfa and Resequencing of Core Germplasms Provide Genomic Resources for Alfalfa Research. Mol. Plant 2020, 13, 1250–1261. [Google Scholar] [CrossRef]
  43. Sun, S.; Ma, W.; Jia, Z.; Ou, C.; Li, M.; Mao, P. Genomic Identification and Expression Profiling of Lesion Simulating Disease Genes in Alfalfa (Medicago sativa) Elucidate Their Responsiveness to Seed Vigor. Antioxidants 2023, 12, 1768. [Google Scholar] [CrossRef]
  44. Yu, A.; Jiang, X.; Sun, Y.; Hu, Q.; Zhu, X.; Kang, J.; Chen, L.; Liu, L.; Hao, L.; Yang, Q.; et al. Genome-wide identification, characterization, and expression analysis of UDP-glycosyltransferase genes associated with secondary metabolism in alfalfa (Medicago sativa L.). Front Plant Sci. 2022, 13, 1001206. [Google Scholar] [CrossRef]
  45. Du, W.; Yang, J.; Li, Q.; He, C.; Pang, Y. Identification and Characterization of Abiotic Stress-Responsive NF-YB Family Genes in Medicago. Int. J. Mol. Sci. 2022, 23, 6906. [Google Scholar] [CrossRef]
  46. Wagh, K.; Stavreva, D.A.; Upadhyaya, A.; Hager, G.L. Transcription Factor Dynamics: One Molecule at a Time. Annu. Rev. Cell Dev. Biol. 2023, 39, 277–305. [Google Scholar] [CrossRef]
  47. Diao, P.; Chen, C.; Zhang, Y.; Meng, Q.; Lv, W.; Ma, N. The role of NAC transcription factor in plant cold response. Plant Signal Behav. 2020, 15, 1785668. [Google Scholar] [CrossRef]
  48. Franco-Zorrilla, J.M.; López-Vidriero, I.; Carrasco, J.L.; Godoy, M.; Vera, P.; Solano, R. DNA-binding specificities of plant transcription factors and their potential to define target genes. Proc. Natl. Acad. Sci. USA 2014, 111, 2367–2372. [Google Scholar] [CrossRef]
  49. Wang, X.; Niu, Y.; Zheng, Y. Multiple Functions of MYB Transcription Factors in Abiotic Stress Responses. Int. J. Mol. Sci. 2021, 22, 6125. [Google Scholar] [CrossRef]
  50. Edwards, H.E.; Gorelick, D.A. The evolution and structure/function of bHLH-PAS transcription factor family. Biochem. Soc. Trans. 2022, 50, 1227–1243. [Google Scholar] [CrossRef]
  51. Wang, H.; Chen, W.; Xu, Z.; Chen, M.; Yu, D. Functions of WRKYs in plant growth and development. Trends Plant Sci. 2023, 28, 630–645. [Google Scholar] [CrossRef]
  52. Feng, K.; Hou, X.L.; Xing, G.M.; Liu, J.X.; Duan, A.Q.; Xu, Z.S.; Li, M.Y.; Zhuang, J.; Xiong, A.S. Advances in AP2/ERF super-family transcription factors in plant. Crit. Rev. Biotechnol. 2020, 40, 750–776. [Google Scholar] [CrossRef]
  53. Shi, H.; Li, X.; Lv, M.; Li, J. BES1/BZR1 Family Transcription Factors Regulate Plant Development via Brassinosteroid-Dependent and Independent Pathways. Int. J. Mol. Sci. 2022, 23, 10149. [Google Scholar] [CrossRef]
  54. Wu, Q.; Tong, C.; Chen, Z.; Huang, S.; Zhao, X.; Hong, H.; Li, J.; Feng, M.; Wang, H.; Xu, M.; et al. NLRs derepress MED10b-and MED7-mediated repression of jasmonate-dependent transcription to activate immunity. Proc. Natl. Acad. Sci. USA. 2023, 120, e2302226120. [Google Scholar] [CrossRef]
  55. Zhao, X.; Chen, Z.; Wu, Q.; Cai, Y.; Zhang, Y.; Zhao, R.; Yan, J.; Qian, X.; Li, J.; Zhu, M.; et al. The Sw-5b NLR nucleotide-binding domain plays a role in oligomerization, and its self-association is important for activation of cell death signaling. J. Exp. Bot. 2021, 72, 6581–6595. [Google Scholar] [CrossRef]
  56. Zhang, M.; Zhao, K.; Xu, X.; Yang, Y.; Yan, S.; Wei, P.; Liu, H.; Xu, J.; Xiao, F.; Zhou, H.; et al. A peptide encoded by circular form of LINC-PINT suppresses oncogenic transcriptional elongation in glioblastoma. Nat. Commun. 2018, 9, 4475. [Google Scholar] [CrossRef]
  57. Kaushal, M. Insights Into Microbially Induced Salt Tolerance and Endurance Mechanisms (STEM) in Plants. Front. Microbiol. 2020, 11, 1518. [Google Scholar] [CrossRef]
  58. Raza, A.; Mubarik, M.S.; Sharif, R.; Habib, M.; Jabeen, W.; Zhang, C.; Chen, H.; Chen, Z.H.; Siddique, K.H.M.; Zhuang, W.; et al. Developing drought-smart, ready-to-grow future crops. Plant Genome. 2023, 16, e20279. [Google Scholar] [CrossRef]
  59. Klemens, P.A.W.; Patzke, K.; Trentmann, O.; Poschet, G.; Büttner, M.; Schulz, A.; Marten, I.; Hedrich, R.; Neuhaus, H.E. Overexpression of a proton-coupled vacuolar glucose exporter impairs freezing tolerance and seed germination. New Phytol. 2014, 202, 188–197. [Google Scholar] [CrossRef]
  60. Yu, H.Q.; Feng, W.; Sun, F.; Zhang, Y.Y.; Qu, J.T.; Liu, B.; Lu, F.; Yang, L.; Fu, F.; Li, W. Cloning and characterization of BES1/BZR1 transcription factor genes in maize. Plant Growth Regul. 2018, 86, 235–249. [Google Scholar] [CrossRef]
  61. Tian, Y.; Zhao, N.; Wang, M.; Zhou, W.; Guo, J.; Han, C.; Zhou, C.; Wang, W.; Wu, S.; Tang, W.; et al. Integrated regulation of periclinal cell division by transcriptional module of BZR1-SHR in Arabidopsis thaliana roots. New Phytol. 2022, 233, 795–808. [Google Scholar] [CrossRef]
  62. Cui, Y.; Cao, Q.; Li, Y.; He, M.; Liu, X. Advances in cis-element- and natural variation-mediated transcriptional regulation and applications in gene editing of major crops. J. Exp. Bot. 2023, 74, 5441–5457. [Google Scholar] [CrossRef]
  63. Feng, W.; Liu, Y.; Cao, Y.; Zhao, Y.; Zhang, H.; Sun, F.; Yang, Q.; Li, W.; Lu, Y.; Zhang, X.; et al. Maize ZmBES1/BZR1-3 and -9 Transcription Factors Negatively Regulate Drought Tolerance in Transgenic Arabidopsis thaliana. Int. J. Mol. Sci. 2022, 23, 6025. [Google Scholar] [CrossRef]
  64. Waadt, R.; Seller, C.A.; Hsu, P.K.; Takahashi, Y.; Munemasa, S.; Schroeder, J.I. Plant hormone regulation of abiotic stress responses. Nat. Rev. Mol. Cell. Biol. 2022, 23, 680–694. [Google Scholar] [CrossRef]
  65. Wang, J.; Wu, D.; Wang, Y.; Xie, D. Jasmonate action in plant defense against insects. J. Exp. Bot. 2019, 70, 3391–3400. [Google Scholar] [CrossRef]
  66. Xu, J.; Lu, X.; Liu, Y.; Lan, W.; Wei, Z.; Yu, W.; Li, C. Interaction between ABA and NO in plants under abiotic stresses and its regulatory mechanisms. Front. Plant Sci. 2024, 15, 1330948. [Google Scholar] [CrossRef]
  67. Zhou, Z.; Li, J.; Gao, Y.; Wang, X.; Wang, R.; Huang, H.; Zhang, Y.; Zhao, L.; Wang, P. Research on drought stress in Medicago sativa L. from 1998 to 2023: A bibliometric analysis. Front Plant Sci. 2024, 15, 1406256. [Google Scholar] [CrossRef]
  68. Ma, L.; Li, X.; Zhang, J.; Yi, D.; Li, F.; Wen, H.; Liu, W.; Wang, X. MsWRKY33 increases alfalfa (Medicago sativa L.) salt stress tolerance through altering the ROS scavenger via activating MsERF5 transcription. Plant Cell Environ. 2023, 46, 3887–3901. [Google Scholar] [CrossRef]
Figure 1. Phylogenetic tree of BES1 transcription factors from Medicago sativa, Arabidopsis thaliana, Oryza sativa, Glycine max, and Solanum lycopersicum. The phylogenetic tree was constructed using a total of 43 BES1 amino acid sequences by the neighbor-joining method with 1000 bootstrap replicates. The phylogenetic tree was divided into three groups, which were shown in different colors: subfamily I (blue), subfamily II (yellow), and subfamily III (green).
Agronomy 14 02287 g001
Figure 2. Conserved motifs analysis of BES1 proteins of M. sativa. (A) Six types of conserved motifs were predicted in the MsBES1 protein sequences. The different motifs are shown in different color boxes. (B) The information for six conserved motifs. The left part is the logo of the discovered motifs; the right part contains the multilevel consensus sequences of the discovered motifs.
Agronomy 14 02287 g002
Figure 3. The gene structure of MsBES1 members. (Left) Phylogenetic analysis of the MsBES1 gene family constructed using MEGA 11 with the NJ method; (right) gene structures were analyzed of four MsBES1 genes. UTR regions, CDS regions, and introns were shown as green boxes, yellow boxes, and horizontal lines, respectively.
Agronomy 14 02287 g003
Figure 4. Prediction of cis-acting elements in the MsBES1 promoter regions. (A) Distribution of cis-elements in MsBES1 promoter sequences. (B) The boxes with different colors represent different cis-elements’ responses to various stresses.
Agronomy 14 02287 g004
Figure 5. Three-dimensional structures of four MsBES1 proteins predicted by ExPaSy SWISS-MODEL.
Agronomy 14 02287 g005
Figure 6. Expression levels of MsBES1 in different tissues. Transcriptome sequencing was used to analyze the samples of roots, stems, leaves, and flowers collected from two-month-old M. sativa. The mean expression values were calculated from three independent biological replicates. The color scale at the right of the heatmap refers to the relative expression level. Red represents a high expression level, and blue represents a low expression level. The raw data are provided in Supplementary Table S4.
Agronomy 14 02287 g006
Figure 7. Expression analysis of MsBES1s after NaCl and PEG 6000 (0–24 h) treatments. (A) Quantitative RT-PCR analysis of the expression of MsBES1s mRNA in the leaves of M. sativa plants at 0 h, 3 h, 6 h, 12 h, and 24 h after 350 mM NaCl treatment. (B) Quantitative RT-PCR analysis of the expression of MsBES1s mRNA in the M. sativa leaves at 0 h, 3 h, 6 h, 12 h, and 24 h after 20% PEG 6000 treatment. The MsActin gene was used as internal reference gene. Asterisks indicate significant differences (Student’s t-test, * p < 0.05, ** p < 0.01).
Agronomy 14 02287 g007
Table 1. Nomenclature and characteristics of MsBES1 family genes in Medicago Sativa L.
Gene IDCDS Length
(bp)
AAPIMw(kDa)Locations on ChromosomeGRAVYSubcellular Localization
MsG028000998110383458.5937.316Chr2: 62,283,844–62,287,544−0.633Nucleus
MsG02800099809513168.6534.141Chr2: 62,273,143–62,277,871−0.628Nucleus
MsG058002531119236405.9872.661Chr5: 16,822,237–16,828,937−0.424Nucleus
MsG078003968821006995.3178.120Chr7: 67,576,707–67,584,373−0.451Nucleus
Gene ID, from the Zhongmu No.1 genome assembly files; CDS, length of coding sequence; AA, number of amino acids; PI, theoretical isoelectric point; Mw, molecular weight, KDa; GRAVY, grand average of hydropathicity; MsBES1 genes’ chromosomal localization was determined based on genome annotation files. The subcellular location of the four MsBES1 genes was predicted using BUSCA (http://busca.biocomp.unibo.it/, accessed on 12 June 2024).
Disclaimer/Publisher’s Note: The statements, opinions and data contained in all publications are solely those of the individual author(s) and contributor(s) and not of MDPI and/or the editor(s). MDPI and/or the editor(s) disclaim responsibility for any injury to people or property resulting from any ideas, methods, instructions or products referred to in the content.

