Article

Effects of Organic Selenium and Nanoselenium on Drought Stress of Pak Choi (Brassica chinensis var. pekinensis. cv. ‘Suzhouqing’) and Its Transcriptomic Analysis

1
School of Land Resource and Environment, Jiangxi Agricultural University, Nanchang 330045, China
2
Resource Protection and Development Center, Forestry Bureau, Nanfeng 344500, China
*
Author to whom correspondence should be addressed.
Agronomy 2024, 14(1), 78; https://doi.org/10.3390/agronomy14010078
Submission received: 13 November 2023 / Revised: 12 December 2023 / Accepted: 27 December 2023 / Published: 28 December 2023
(This article belongs to the Section Soil and Plant Nutrition)

Abstract

:
In order to investigate physiological and molecular mechanisms underlying the impacts of organic selenium and nanoselenium on the drought stress of pak choi (Brassica chinensis var. pekinensis. cv. ‘Suzhouqing’), we sprayed 20 mL of 0, 5, 10, 20 mg L−1 concentrations of organic selenium (DCK, DO5, DO10, DO20) and nanoselenium (DN5, DN10, DN20). We measured photosynthetic pigment, antioxidant and nutritional quality, performed transcriptome sequencing of leaves using RNA-seq technology, obtained 297,176,114 clean sequences, and identified differential expressed genes. Organic selenium and nanoselenium increased the photosynthetic capacity by upregulating light-trapping pigment proteins, regulated reactive oxygen species homeostasis by activating the antioxidant system through the upregulation of glutathione S-transferase, and maintained water homeostasis through glutathione oxidase activity, thus enhancing weight. They contributed to the elevated total selenium content by increasing expression levels of ABC transporter, adenylate kinase, and cysteine desulphurase. Additionally, hub genes related to these metabolic pathways were identified using a weighted gene coexpression network analysis. The consistent results with the upregulated genes identified in the Kyoto Encyclopedia of Genes and Genomes pathway confirmed the accuracy and reliability of the transcriptome sequencing data. This study provides scientific reference to further in-depth research on the molecular effect of selenium on crops under drought stress conditions.

1. Introduction

‘Suzhouqing’ (Brassica chinensis var. pekinensis) plays a crucial role in the annual vegetable supply due to its low crude-fiber content, delightful texture, and abundant nutritional value [1]. However, the frequent occurrence of severe drought in China has emerged as a significant constraint on the growth of Suzhouqing. Drought stress directly weakens photosynthetic intensity and triggers an excessive production of reactive oxygen species within cells, disrupting the balance of the oxidative metabolism and leading to intensified membrane lipid peroxidation damage or even plant mortality [2,3,4].
Selenium is an important element for crop growth and plays a vital regulatory role in crop development. It actively participates in the formation of antioxidant enzymes (GSH-PX) and facilitates the conversion of harmful peroxides into harmless hydroxyl compounds, thereby safeguarding biofilms against oxidative degradation [5]. An exogenous application of selenium is a key approach to enhance crop drought resistance, which not only increases the selenium content in the entire food chain but also improves crop yield and quality. Previous studies have demonstrated that selenium can promote crop growth rate, mitigate oxidative damage caused by ultraviolet radiation, increase chlorophyll and carotenoid content in plant leaves, as well as boost antioxidant enzyme activity and osmoregulatory substance content [6,7,8,9]. It also contributes to the increased selenium content and yield of fruits, effectively enhancing fruit quality and improving stress resistance in crops [10]. Moreover, research has shown that applying selenium fertilizer under drought stress effectively improves plant tolerance to drought. The detrimental impacts of drought stress on wheat [11], barley [12], and rape [13] were alleviated through enhanced photosynthesis capacity, increased antioxidant capacity, and elevated osmoregulatory substance content in plants.
However, there is limited research on the regulation of exogenous selenium on the physiological, biochemical, and metabolic growth of pak choi under drought stress. Most studies focusing on the effects of selenium on plant growth and nutritional quality primarily measure physiological indicators, with few reports considering the molecular mechanisms involved. Van Hoewyk et al. treated Arabidopsis thaliana with 20 μmol of selenium and conducted a transcriptomic analysis to investigate the gene expression changes associated with selenium tolerance in plants. They observed an upregulation of genes involved in the sulfur absorption and metabolism, despite a decrease in sulfur content within the plants. Additionally, they found that the ethylene and jasmonic acid signaling pathways exhibited a significant responsiveness to selenium tolerance [14]. The transcriptomic analysis of Astragalus chrysochlorus calluses unveiled significant changes in gene expression profiles primarily involving ABC transporters, defense-related proteins against plant pathogens, as well as secondary metabolic pathways for plants’ responses to stressors such as diseases or environmental cues like glucose availability [15]. By employing RNA-seq technology on the degraded calluses from Astragalus chrysochlorus samples under investigation here, we detected the presence of various microRNAs including but not limited to miR167a, miR319, miR1507a, miR4346, miR7767-3p, miR7800, and miR9748. Furthermore, it was noted that specific microRNAs such as miR-n93 along with their target transcription factors played crucial roles in regulating key processes like signal transduction, sulfur metabolism, and interactions between plants and pathogens via disease-resistance proteins alongside cysteine synthesis enzymes. This limitation hampers our comprehensive understanding of the physiological function and mechanism of selenium in plants and impedes the utilization of selenium-rich plant resources and development of selenium-enriched agricultural products.
The main types of selenium fertilizers include inorganic selenium, organic selenium, and nanoselenium. In terms of inorganic selenium fertilizers, such as sodium selenate or sodium selenite, they exhibit a low absorption and utilization conversion at low concentrations and a high toxicity at high concentrations when applied through foliage or soil. As a nutrient element, the safe dosage range of selenium is relatively narrow, making it difficult to control its effective dosage. Currently, organic selenium and nanoselenium fertilizers are predominantly utilized. Nanoselenium refers to protein-dispersed selenium nanoparticles with a particle size less than 60 nm, which possess a large specific surface area and demonstrate a high catalytic activity, biological functionality, antioxidant properties, and absorptivity. Research has indicated that inorganic selenium not only enhances the effects of low-temperature stress but also increases the content of selenium in plants; however, there is limited research investigating the impacts of organic selenium and nanoselenium on pak choi.
In order to investigate physiological and molecular mechanisms underlying the impacts of organic selenium and nanoselenium on the drought stress of pak choi (Brassica chinensis var. pekinensis. cv. ‘Suzhouqing’), we sprayed 20 mL of 0, 5, 10, 20 mg L−1 concentrations of organic selenium (DCK, DO5, DO10, DO20) and nanoselenium (DN5, DN10, DN20), photosynthetic pigment, antioxidant, nutritional quality and other physiological indexes were determined, and the molecular mechanism of the effects of organic selenium and nanoselenium on leaves was analyzed by transcriptomics in this study.

2. Materials and Methods

2.1. Experimental Site and Experimental Design

The test material was Suzhouqing, and the seeds were purchased from Jiangxi Ruibao Seed Co., LTD (Jiujiang, Jiangxi, China). The breeding process of Suzhouqing was as follows: the maternal Ogu-CMS0173, a male cytoplasmic sterile Ogura line derived from the light-leaved Suzhouqing, exhibited characteristics such as a light-green leaf color, a medium tree type, a reduced fiber content, and a high combining ability. The male parent 9960 was an inbred line obtained through extensive breeding of Suzhouqing with dark green leaves and a large tree type.
Nanoselenium, a tiny red elemental nanoparticle of selenium with a particle diameter ranging from 20 to 60 nm, was developed by the Zhongnong Selenium-rich Agricultural Technology Research Institute in Beijing, China. On the other hand, organic selenium, mainly consisting of malt selenium ((CH3)2Se), was developed by Northwest A&F University in Yangling, Shaanxi, China.
The experiment was conducted from November 2022 to January 2023 in the laboratory of the College of Land Resources and Environment, Jiangxi Agricultural University, Nanchang, Jiangxi Province, China. After 10 days of sowing, the seedlings were selected and transplanted into pots (33.00 × 24.40 × 13.50 cm) with 2 plants per pot. The medium was organotrophic soil, and its physical and chemical properties are shown in Table 1.
The evening watering process involved fully saturating three pots until water began to flow from the bottom, followed by weighing them at 9:00 the next day. The mass of saturated soil was determined by subtracting the weight of the pot. To obtain the dry soil weight, the soil was dried and weighed. Throughout the experiment, daily measurements were taken at 9:00 to determine soil quality, with values obtained by subtracting the weight of the basin from each measurement. Using a calculation formula, the soil relative humidity was calculated as (soil mass—soil dry weight)/(soil saturation mass—soil dry weight) [16]. The daily matrix water content was then derived based on this information. Soil relative humidity (R) was categorized according to the drought grade index as follows: no drought for R > 60%, light drought for 50% < R ≤ 60%, moderate drought for 40% < R ≤ 50%, and severe drought for 30% < R ≤ 40%. When seedlings reached four leaves in growth stage (22 December 2022), watering ceased, and drought treatment commenced. Daily weighings were conducted at 9:00, and watering resumed when the matrix water content reached approximately 30% (severe drought).
Three levels of exogenous selenium were applied as shown in Table 2. Foliar spraying was conducted on 9 December and 16 December 2022 (before drought treatment), as well as on 27 December 2022 (during drought treatment).
After 10 days of drought treatment (1 January 2023), the plants with identical growth were chosen from each treatment group as the source of a biological duplicate sample. The samples were gently wiped with PBS/RNase-free water and subsequently dried using absorbent paper. Part of them were immediately tested for relevant physiological indexes in vitro, and part of the samples were placed in a refrigerator at −80 °C.

2.2. Determination of Physiological and Biochemical Indexes

The concentrations of chlorophyll a, b, and carotenoids were determined using an ultraviolet spectrophotometer (UV-2450, Shimadzu, Kyoto, Japan) at wavelengths of 665 nm, 649 nm, and 470 nm, respectively. An acetone–ethanol mixed extraction was employed for the analysis, and the approach was cited in the publication authored by Wang and Huang [17]. The LCpro T portable photosynthetic measurement system was utilized to determine various photosynthetic indices including the net photosynthetic rate (Pn), stomatal conductance (Gs), transpiration rate (Tr), and intercellular CO2 concentration (Ci) during the peak functional period of leaves from 9:00 am to 11:00 am on sunny days. The average value was obtained by conducting measurements on 7 blades for each trial.
The activity of superoxide dismutase (SOD) was determined using a novel highly water-soluble tetrazolium salt, WST-8 (4-[3-(2-methoxy-4-nitrophenyl)-2-(4-nitrophenyl)-2h-5-tetrazolium]-1,3-benzenesulfonate), as described by Ukeda et al. in 1999 [18]. Superoxide ions generated by xanthine oxidase were able to reduce WST-8 to water-soluble formaldehyde, resulting in a maximum absorbance at 460 nm.
The activity of peroxidase (POD) was assessed by monitoring the oxidation rate of guaiacol. The reaction was initiated by adding 200 μL of enzyme solution to a centrifuge tube containing 10 mM H2O2, 25 mM sodium phosphate buffer, and 0.05% guaiacol. After thorough mixing, the change in absorbance at 470 nm was measured over a period of 90 s and subsequently used to calculate the POD activity [19].
We utilized the peroxidatic function of catalase to determine catalase (CAT) activity. The method was based on the enzymatic reaction with methanol in the presence of an optimal concentration of hydrogen peroxide [20]. The resulting formaldehyde was quantified spectrophotometrically using 4-amino-3-hydrazino-5-mercapto-1,2,4-triazole (Purpald) as a chromogen.
The malondialdehyde (MDA) content was determined using the thiobarbituric acid reaction method [21]. We measured 0.10 g of the sample, added 1 mL of the extract, and homogenized it at room temperature. Subsequently, we centrifuged the mixture at 10,000× g rpm for 10 min at room temperature to obtain a supernatant volume of 100 μL. This supernatant was then combined with 300 μL of malondialdehyde (MDA) content kit reagent and incubated in tightly covered water at a temperature of 92 °C for 30 min to prevent water loss. After cooling down by centrifuging again at 12,000× g rpm for another 10 min at a temperature of 25 °C, we transferred an aliquot containing 200 μL of supernatant into a well on a standard microplate and measured its absorbance values A532 and A600. The difference between these two absorbance values was denoted as ΔA = A532 − A600.
Precisely measured by Nishimoto et al., the content of reduced glutathione (GSH) was observed [22]. Approximately 0.10 g of samples was weighed, and 1 mL of extraction liquid was added. Following homogenization in an ice bath, the resulting supernatant was centrifuged at a speed of 12,000× g rpm and a temperature of 4 °C for a duration of 10 min. The obtained supernatant was then transferred to an ice-filled container for subsequent measurement. Distilled water, superserum, and two reagents from the reduced glutathione (GSH) kit were introduced into a 96-well plate, thoroughly mixed, and allowed to stand for a period of 2 min. Absorbance values at a wavelength of 412 nm were recorded for both the assay tube and blank tube. Finally, the GSH content was determined based on the difference in absorbance values.
The determination of soluble sugar content was conducted following the method described by Buysse and Merckx [23]. Briefly, 0.10 g of leaf sample was weighed and mixed with 1 mL of 80% ethanol. The resulting supernatant was then heated in a water bath at 80 °C for 30 min. This process was repeated twice, and the combined supernatants were used as the extraction solution. Subsequently, a volume of 50 μL of extract was diluted by a factor of 40 and mixed with 5 mL of anthrone sulfuric acid reagent. After boiling for 10 min, the mixture was removed from heat and cooled to room temperature using tap water before measuring its absorbance at a wavelength of 620 nm. Finally, the total soluble sugar content was determined based on a standard curve.
The bicinchoninic acid (BCA) assay, which involved two reactions, was employed for the determination of the soluble protein content [24]. In the initial reaction, a copper ion complex with amide bonds was formed, resulting in the reduction of copper in an alkaline solution. Subsequently, the BCA reagent was primarily reduced by the copper–amide bond complex and also by tyrosine and tryptophan residues.
The amino acid content was determined according to the method described by Chen et al. [25]. Approximately 0.10 g of leaves was extracted with 10 mL of distilled water in a boiling water bath for 45 min. After centrifugation for 10 min, 1 mL of supernatant was collected and mixed with 0.5 mL of a 2% ninhydrin reagent and 0.5 mL of a pH 8.0 phosphate buffer solution. The reaction mixture was heated in a boiling-water bath for 15 min and then cooled to room temperature before adding an additional volume of distilled water (8 mL). After standing for another 10 min, the absorbance at a wavelength of 562 nm was measured using a MetashUV-5200 UV–vis spectrophotometer.
The average values of physiological and biochemical indexes were obtained by measuring 3 samples each time.

2.3. RNA Extraction and RNA-Seq Sequencing

The leaf tissue from each treatment (consisting of 3 blades) was rapidly ground using liquid nitrogen, and 0.1 g of the tissue was transferred into a 2 mL RNA-free centrifuge tube. Subsequently, 1 mL of TRIzol was added to the homogenate and mixed thoroughly by shaking. The mixture was left at room temperature for 5 min. Following this, 200 μL of chloroform was added, shaken for 15 s, and allowed to settle for 2–3 min. The high-speed centrifuge was then used to spin the sample at 12,000× g rpm for 15 min, after which the supernatant (600 μL) was carefully collected in a new centrifuge tube. To precipitate RNA, an equal volume (300 μL) of isopropyl alcohol was added to the supernatant and mixed well before incubating for 10 min. After another round of centrifugation at 12,000× g rpm for 10 min, the supernatant was discarded. Next, RNA precipitation was washed with anhydrous ethanol (750 μL), followed by resuspension in DEPC water (250 μL). Centrifugation at a speed of 7500× g for 5 min facilitated the removal of any remaining impurities in the supernatant which were subsequently discarded as well. Finally, drying at room temperature concluded this process before dissolving the RNA precipitation in DEPC water (350 μL).
The quality assessment involved agarose gel electrophoresis to determine degradation levels and contamination status, while RNA concentration was quantified using Qubit2.0 fluorometer (Thermo Scientific, Waltham, MA, USA) technology. The integrity of the RNA samples was precisely evaluated with the Agilent 2100 system (Agilent Technologies Co., Ltd., Santa Clara, CA, USA) before proceeding to library construction for subsequent Illumina sequencing, which followed a Nanodrop analysis to determine sample purity [26].

2.4. Identification of Gene Differential Expression

To ensure the quality and reliability of the data analysis, we utilized Trimmomatic 0.39 software (version: Trimmomatic 0.39) to filter the sequencing data. Specifically, we removed a subset of reads from the original data that contained adapters and exhibited a low sequencing quality [27]. Subsequently, Trinity was employed to concatenate the clean reads, resulting in the generation of Unigene sequences which served as reference sequences (Ref) [28]. RSEM v1.2.28 software was then applied to compare each sample’s clean reads with Ref. Any reads with a comparative quality lower than 10 were filtered out accordingly. Additionally, any unpaired reads were aligned to multiple regions of the genome. Finally, RSEM v1.2.28 software was used to calculate the TPM value (transcripts per kilobase million) for each sample in order to estimate gene expression levels. Ultimately, genes exhibiting significant differences in expression levels between nanoselenium and organic selenium were identified using statistical methods based on a criterion q-value < 0.05 [26].

2.5. GO and KEGG Enrichment Analysis of DEGs

The analysis of Gene Ontology (GO) enhances our understanding of the biological functions associated with differentially expressed genes by identifying significant enrichments compared to the genomic background. Initially, we mapped all differentially expressed genes to terms in the GO database and calculated their respective gene counts [29]. We then observed a significant enrichment of genes when compared to the entire genome background. To identify significantly enriched terms (Padj ≤ 0.05), clusterProfiler’s enricher function employs a hypergeometric distribution test as part of its GO enrichment analysis method.
A pathway enrichment analysis allows for the identification of crucial biochemical metabolic pathways and signal transduction pathways associated with differentially expressed genes. KEGG (Kyoto Encyclopedia of Genes and Genomes) serves as the primary public database for pathway information, integrating data on genome chemistry and system function. The unit of analysis in a pathway significant enrichment analysis is the KEGG Pathway [30]. A hypergeometric test was used to identify pathways where differentially expressed genes were significantly enriched compared to all annotated genes. Similarly, a padj threshold less than 0.05 was employed to determine a significant enrichment in the KEGG pathway analysis.

2.6. WGCNA

The weighted gene coexpression network analysis (WGCNA) algorithm was used to define the correlation matrix of gene coexpression and the adjacency function formed by the gene network. Subsequently, various coefficients were calculated for different nodes, and a hierarchical clustering tree was constructed with distinct branches representing different gene modules [31]. Then, genes were identified based on their connectivity degree within each module, followed by an investigation into the relationship between these core genes and the effects of nanoselenium and organic selenium on leaves.

2.7. Quantitative Real-Time PCR

To ensure the reliability of RNA-seq results, we validated nine differentially expressed genes (DEGs) identified by RNA-seq through quantitative real-time polymerase chain reaction (qRT-PCR). We confirmed the expression patterns of these DEGs in leaves treated with organic selenium and nanoselenium by using SiActin as an internal reference and designing primers based on the sequences of DEGs. The RNA from the constructed library was reverse-transcribed into cDNA using the PrimeScript TM 1st strand cDNA Synthesis Kit, followed by incorporating fluorescent dyes into the PCR reaction system. The real-time detection of fluorescence signals for each cycle product in the PCR amplification generated a fluorescence amplification curve that underwent a quantitative analysis [30]. Finally, gene expression levels were calculated and analyzed using the 2−ΔΔCt method [32].

2.8. Statistical Analysis

The data were sorted, and graphs were generated using Excel 2019 software. A statistical analysis was conducted utilizing SPSS 16.0 software (SPSS Inc., Chicago, IL, USA). The significant differences between the groups were determined using a one-way ANOVA, followed by Duncan’s multiple range test.

3. Results

3.1. Photosynthetic Pigments and Photosynthetic Indexes of Suzhouqing Leaves

The results presented in Table 3 demonstrate that DN5, DN10, and DN20 increased chlorophyll a content by 68.97%, 41.38%, and 21.84%, respectively, compared to DCK. Additionally, DO5, DO10, and DO20 resulted in an increase in chlorophyll a content by 1.15%, 20.69%, and 6.90%, respectively. Furthermore, DN5, DN10, DN20, DO5, and DO10 led to an increase in chlorophyll b content by 46.65%, 23.91%, 6.52%, 2.17%, and 13.04%, respectively; however, there was a decrease of 8.70% observed with the application of the DO20 treatment. Moreover, DN5 and DN10 showed an increase in carotenoid content observed with the DN20, DO5, and DO10 treatments. Conversely, a significant decrease of 39.38% was noted with the application of DO20. The contents of chlorophyll a, b, and carotene in the nanoselenium treatment were higher than those in the organic selenium treatment and control group.
The stomatal conductance (Gs) of leaves initially increased and subsequently decreased with the increase in nanoselenium concentration, yet they remained consistently higher than those of CK, exhibiting an increase of 59.51%, 4.03%, and 4.08%, respectively (Table 4). The impact of nanoselenium on intercellular CO2 concentration (Ci) was consistent with its effect on Gs. These findings suggest that selenium application enhances stomatal conductance, reduces stomatal resistance, and elevates intercellular carbon dioxide concentration in leaves. In comparison to CK, the net photosynthetic rate (Pn) of leaves exhibited a significant increase by 50.37%, 106.83%, and 108.11%, respectively, while the transpiration rate (Tr) experienced a rise of 37.44% (DN5), followed by decreases of 2.10% (DN10) and 2.43% (DN20). Notably, these differences reached their maximum value during the DN5 treatment. In general, the photosynthetic efficiency of the nanoselenium treatment was higher than that of the organic selenium treatment and neutral water treatment (DCK).

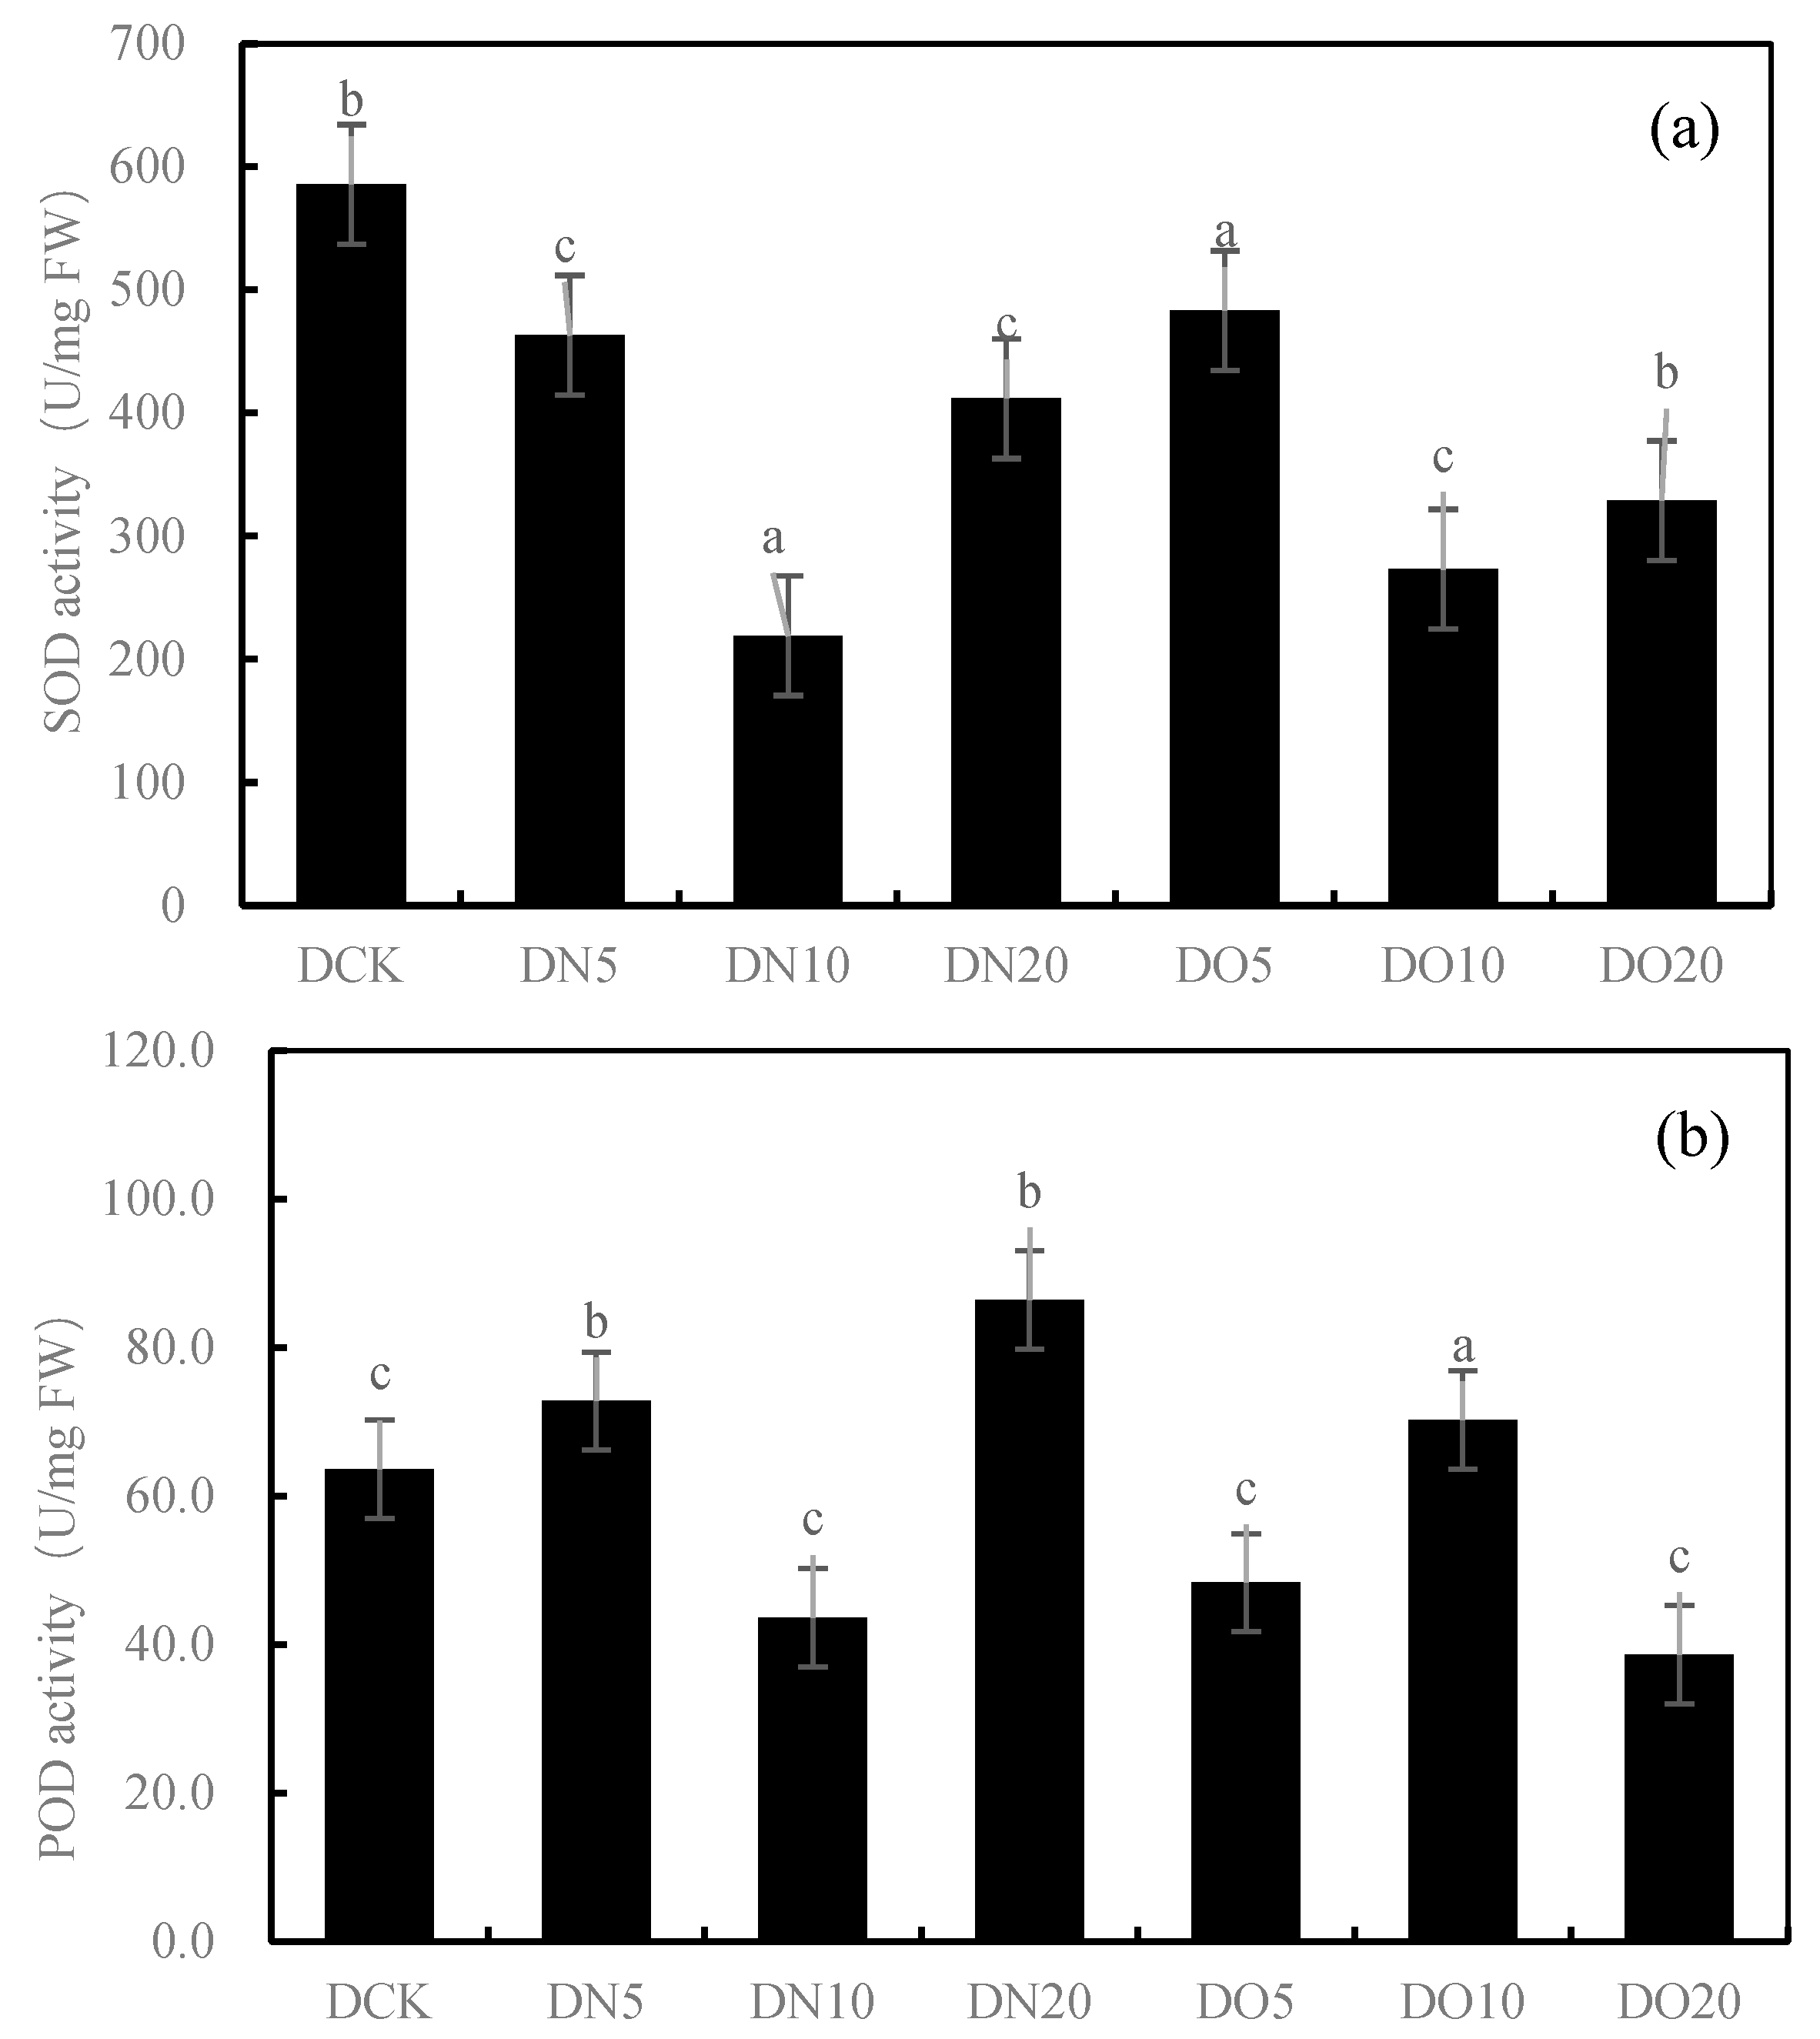
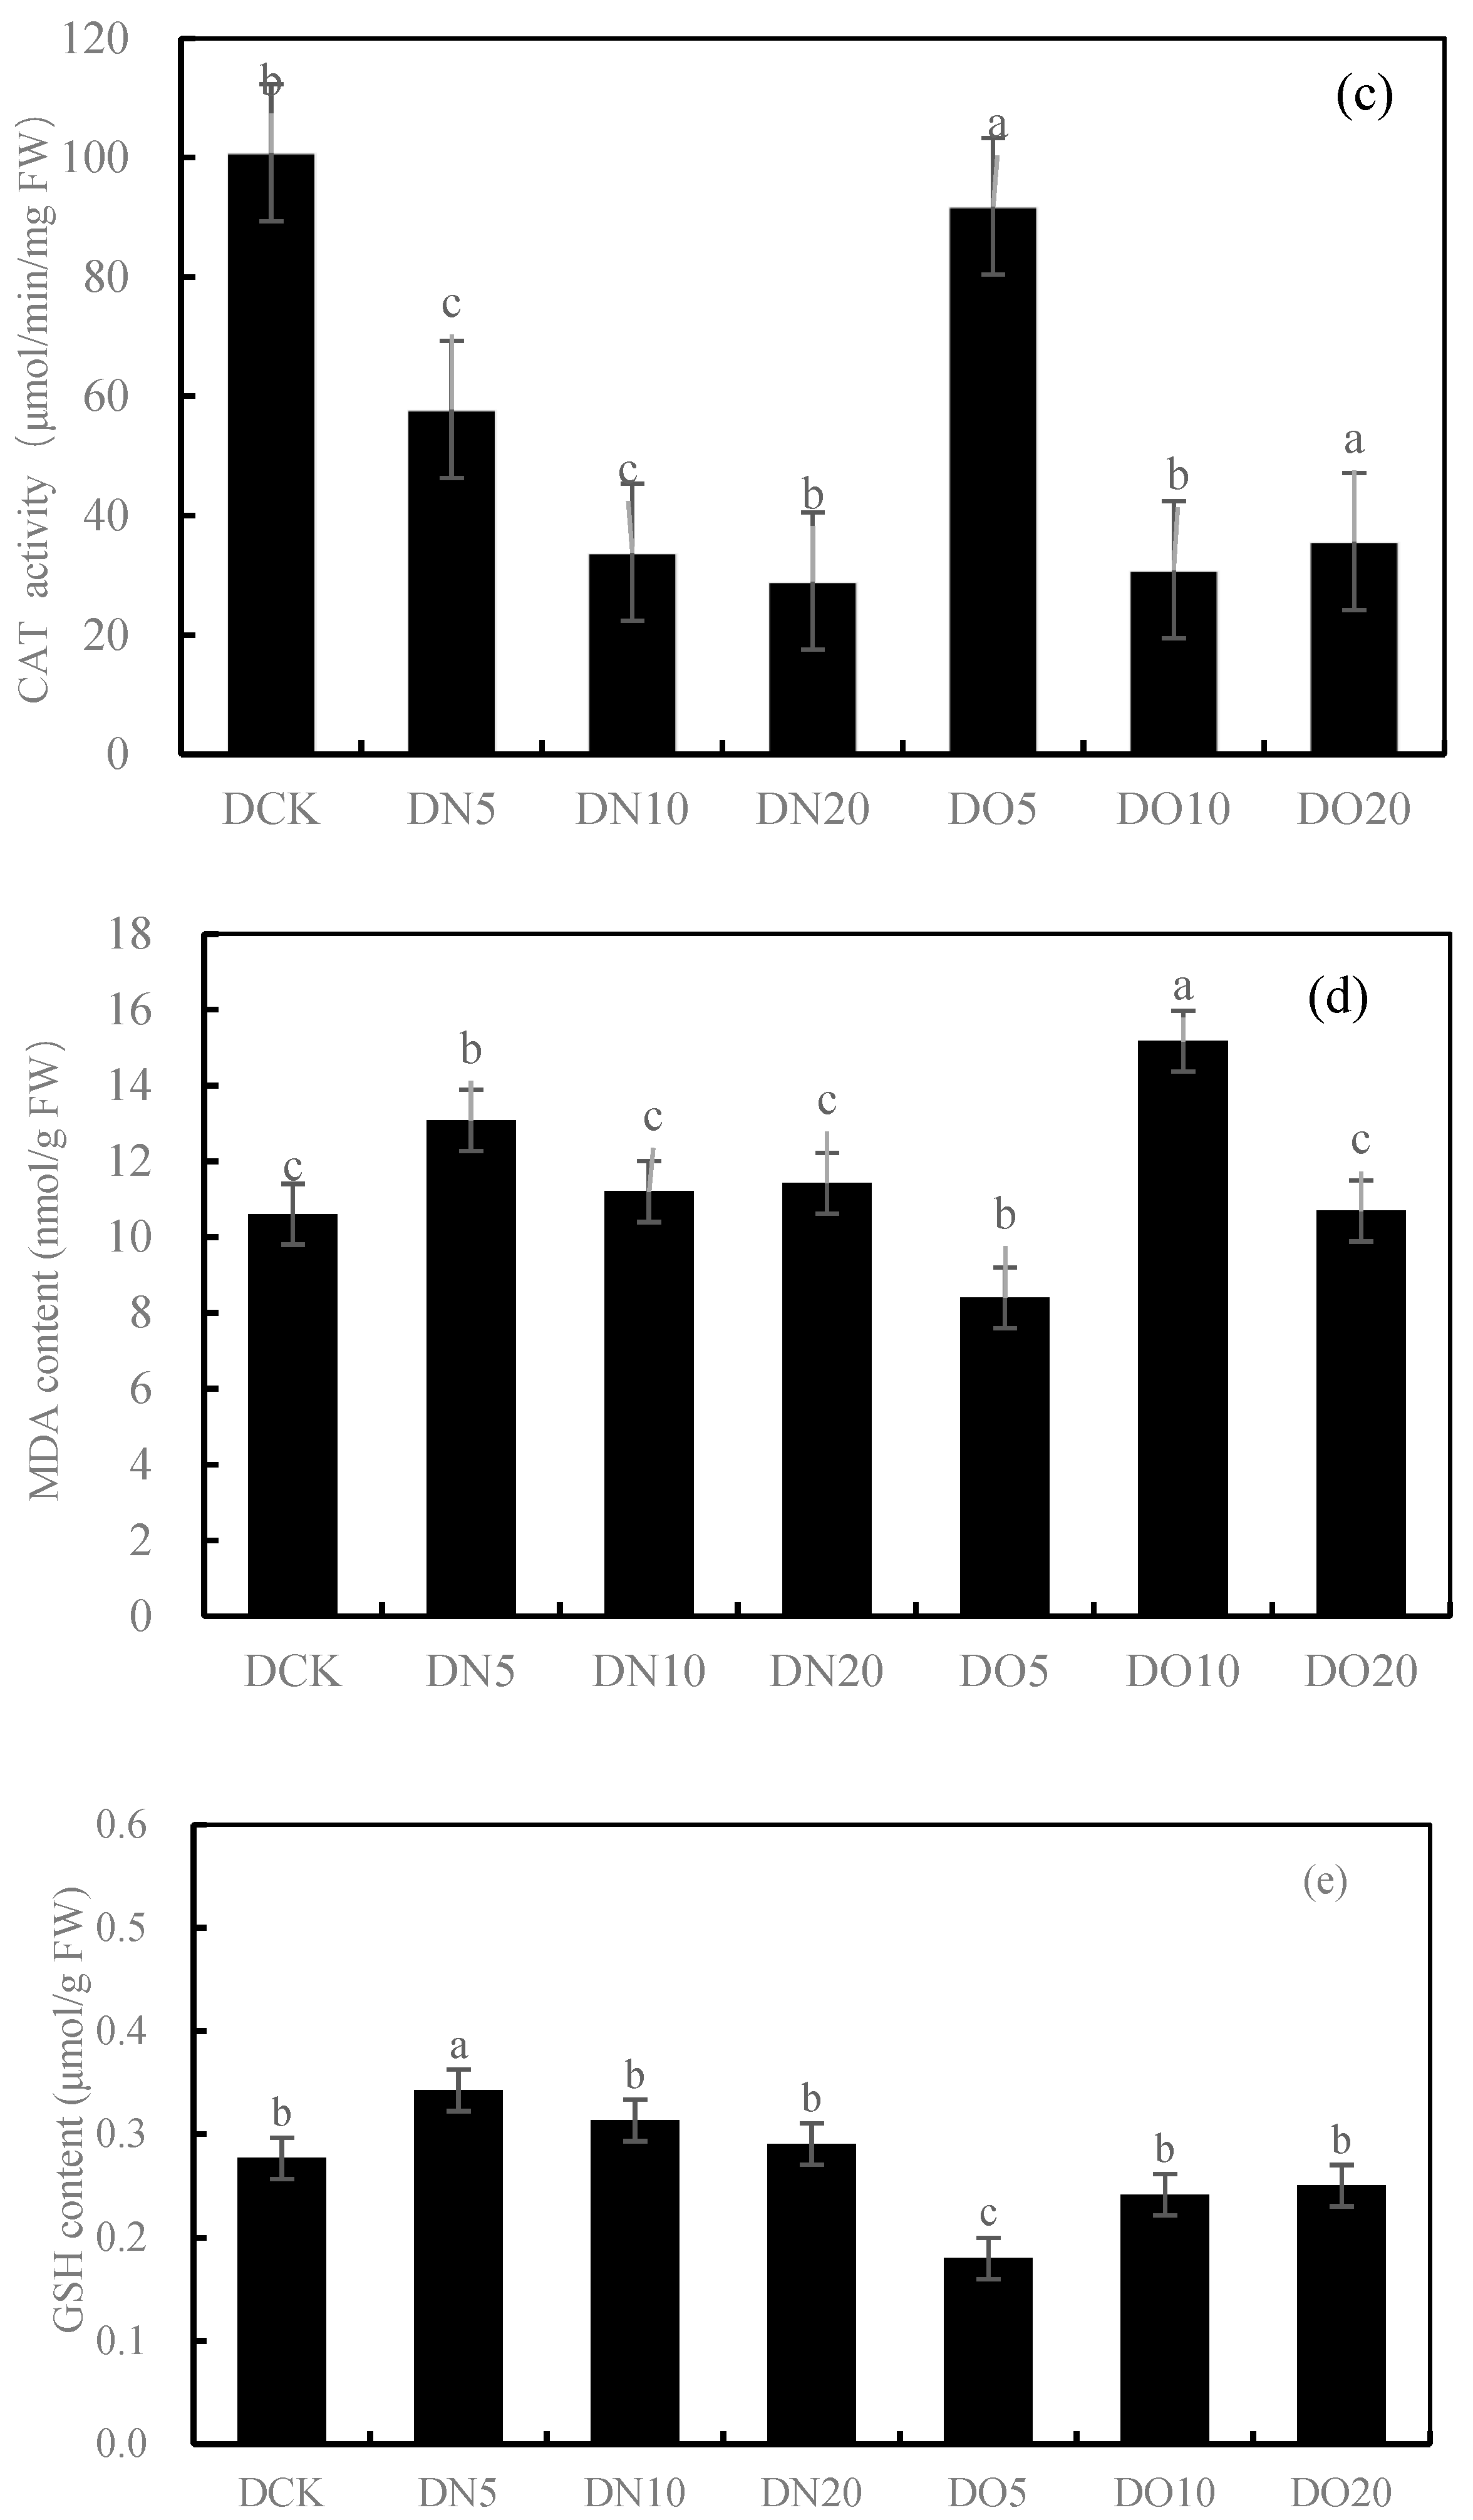
3.2. Antioxidant Properties of Leaves

Figure 1 shows that the SOD activity was reduced by spraying nanoselenium, with DN5, DN10, and DN20 decreasing by 20.91%, 62.57%, and 29.68%, respectively. Similarly, the SOD activity decreased when organic selenium was sprayed, with DO5, DO10, and DO20 decreasing by 17.47%, 53.36%, and 43.82%, respectively. The POD activity increased by 14.42% and 35.79% under DN5 and DN20, respectively, while it decreased by 31.42% under DN10. Compared to CK, the three groups treated with the organic selenium spray showed a wider range of changes: DO5 and DO20 decreased by 23.99%, respectively, while DO10 increased by 10.43%. The CAT activity of the three groups sprayed with nanoselenium was reduced by 42.66%, 66.44%, and 71.22%, respectively, compared to CK. Additionally, there was a decrease in CAT activity of 8.92%, 69.36%, and 64.60% with organic selenium. The MDA content showed significant increases of 22.33%, 5.63%, and 7.71% with the DN5, DN10, and DN20 treatments, respectively. Additionally, the application of organic selenium resulted in a wide range of changes: it decreased by 20.78% under the DO5 treatment but increased by 43.03% and 0.81% under the DO10 and DO20 treatments, respectively. Spraying nanoselenium increased the GSH content by percentages of 23.82%, 28.00%, and 4.98%, respectively, compared to CK. The content of GSH also increased with the application of organic selenium by percentages of 34.89%, 12.77%, and 9.55%, respectively, compared to CK. Spraying low-concentration and medium-concentration (DN5 and DN10) nanoselenium decreased the GSH content by 37.87% and 10.49%, respectively, while a high concentration (DN20) increased it by 63.77%. However, spraying organic selenium resulted in an increase in GSH content by 26.78%, 3.91%, and 0.73%, respectively. The results showed that the antioxidant activity of the nanoselenium treatment was better than that of the organic selenium treatment and control group.

3.3. Weight and Total Selenium Content of Suzhouqing Leaves

The results presented in Table 5 demonstrate that all treatments significantly increased the weight and total selenium content of Suzhouqing leaves. Notably, the DN10 treatment exhibited the highest values, with 67.30 g and a total selenium content of 42.37 μg kg−1. These values were, respectively, 1.38 times and 4.15 times higher than those observed in the control group.

3.4. Nutritional Quality of Suzhouqing Leaves

The soluble sugar content was increased by 70.43%, 9.43%, and 76.72% in comparison with CK, while it decreased by 49.94%, 10.28%, and increased by 43.16% when treated with organic selenium (Table 6). The soluble protein content in DN5 and DN10 increased by ratios of 54.61% and 3.51%. Spraying organic selenium resulted in an increase in soluble protein content by 9.10% and 38.88% (DO5 and DO20). A low concentration of nanoselenium (DN5) led to an increase in amino acid content by 7.51%; however, DN10 and DN20 increased it by 20.81% and 98.84%. DO5 and DO10 caused decreases of 6.36% and increased 5.78%, respectively, whereas DO20 increased it by 16.76%. Treatment with DN5 increased the flavonoid content by 100.00%; however, both DN10 and DN20 increased it by 27.42% and 1.61%. After spraying organic selenium, the flavonoid content decreased by 8.06%, 11.29% and 70.97%, respectively. On the whole, the nutritional quality of the nanoselenium treatment was better than that of the organic selenium treatment and neutral water treatment.

3.5. Analysis of the Transcriptomic Changes of Nanoselenium and Organic Selenium in Response to Drought Stress

3.5.1. Sequencing Results and Quality Analysis

Transcriptome sequencing has been demonstrated in numerous species as a highly effective strategy for unraveling their global expression networks under stress conditions. To investigate the molecular mechanisms associated with nanoselenium and organic selenium in response to drought stress, transcriptome sequencing was conducted on collected samples, and transcriptome libraries were constructed using the total RNA extracted from the leaves of both the control group and treatment groups. The transcriptome libraries underwent Illumina sequencing, with treatments including a control group, organic selenium, and nanoselenium. Subsequently, data filtering was performed on the raw data resulting in 297,176,114 clean sequences obtained for the analysis. Each sample had a sequencing volume exceeding 5.50 G. Notably, over 99.80% of the total base count consisted of Q30 bases as presented in Table 7.

3.5.2. Correlation Examination between Samples

The correlation of gene expression levels between samples serves as a crucial indicator for assessing the experiment’s reliability and the rationality of sample selection. A higher correlation coefficient, closer to one, signifies a greater similarity in expression patterns among the samples. Intragroup and intergroup correlation coefficients were computed based on the TPM values of all genes within each sample, followed by the generation of a heat map to visually represent intergroup differences and intragroup duplications. With a minimum squared Pearson correlation coefficient value of 0.85, it is evident that gene expression levels across replicates within each group exhibited a high consistency.

3.5.3. Differentially Expressed Genes (DEGs) Statistics

The differential significance analysis was conducted for each comparison combination, resulting in the identification of a list of differentially expressed genes (DEGs) based on the criteria of |log2(fold change)| ≥ 1 and an adjusted p-value ≤0.05. This list is presented in Table 8. A total of 58,852 DEGs were identified between DN5 and DCK, with 21,358 upregulated DEGs (log2(fold change) ≥ 1) and 21,530 downregulated DEGs (log2(fold change) ≤ −1).

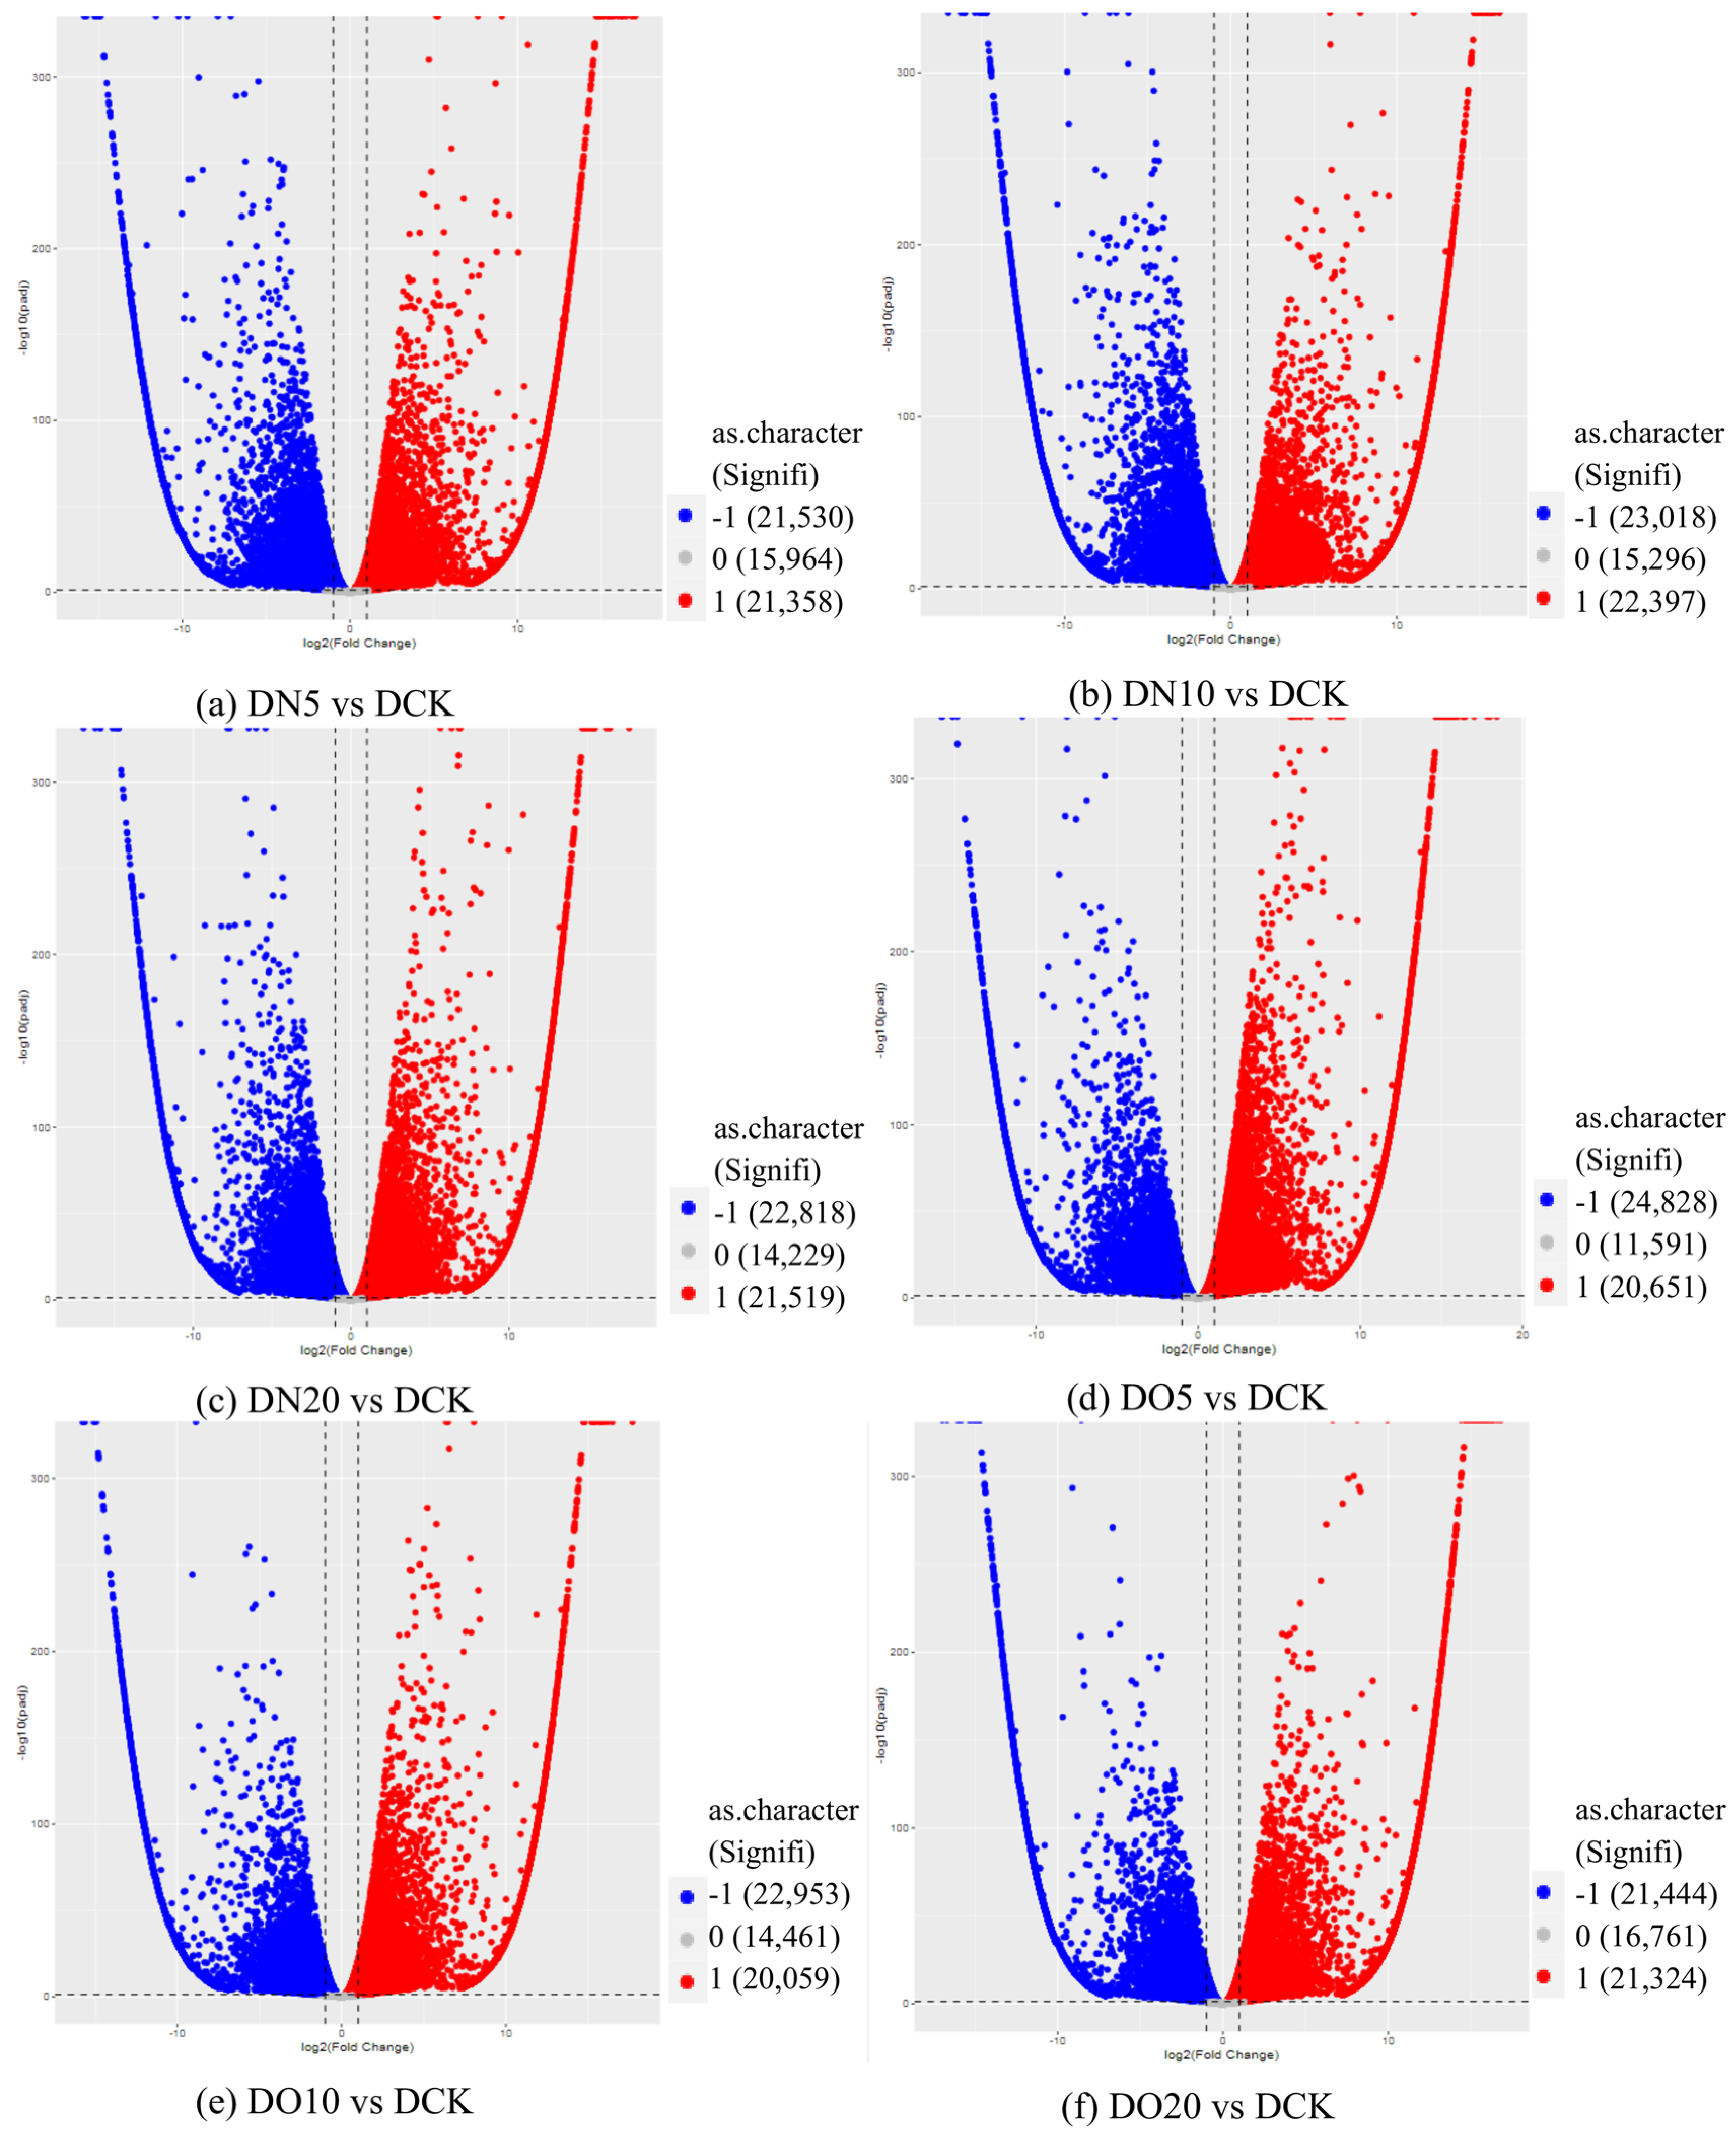
3.5.4. Volcano Map of DEGs

The differential expression analysis focuses on identifying genes that are differentially expressed (DEGs) between samples and subsequently functionally analyzing these genes. Based on the criteria of |log2(fold change)| ≥ 1 and FDR < 0.05 for significant DEGs, our results revealed a total of 58,852, 60,711, and 58,566 significantly differentially expressed genes between DN5, DN10, and DN20 compared to DCK, respectively (Figure 2a–c). Additionally, we observed a significant differential expression in 57,070, 57,473, and 59,529 genes between DO5, DO10, and DO20 compared to DCK, respectively (Figure 2d–f).

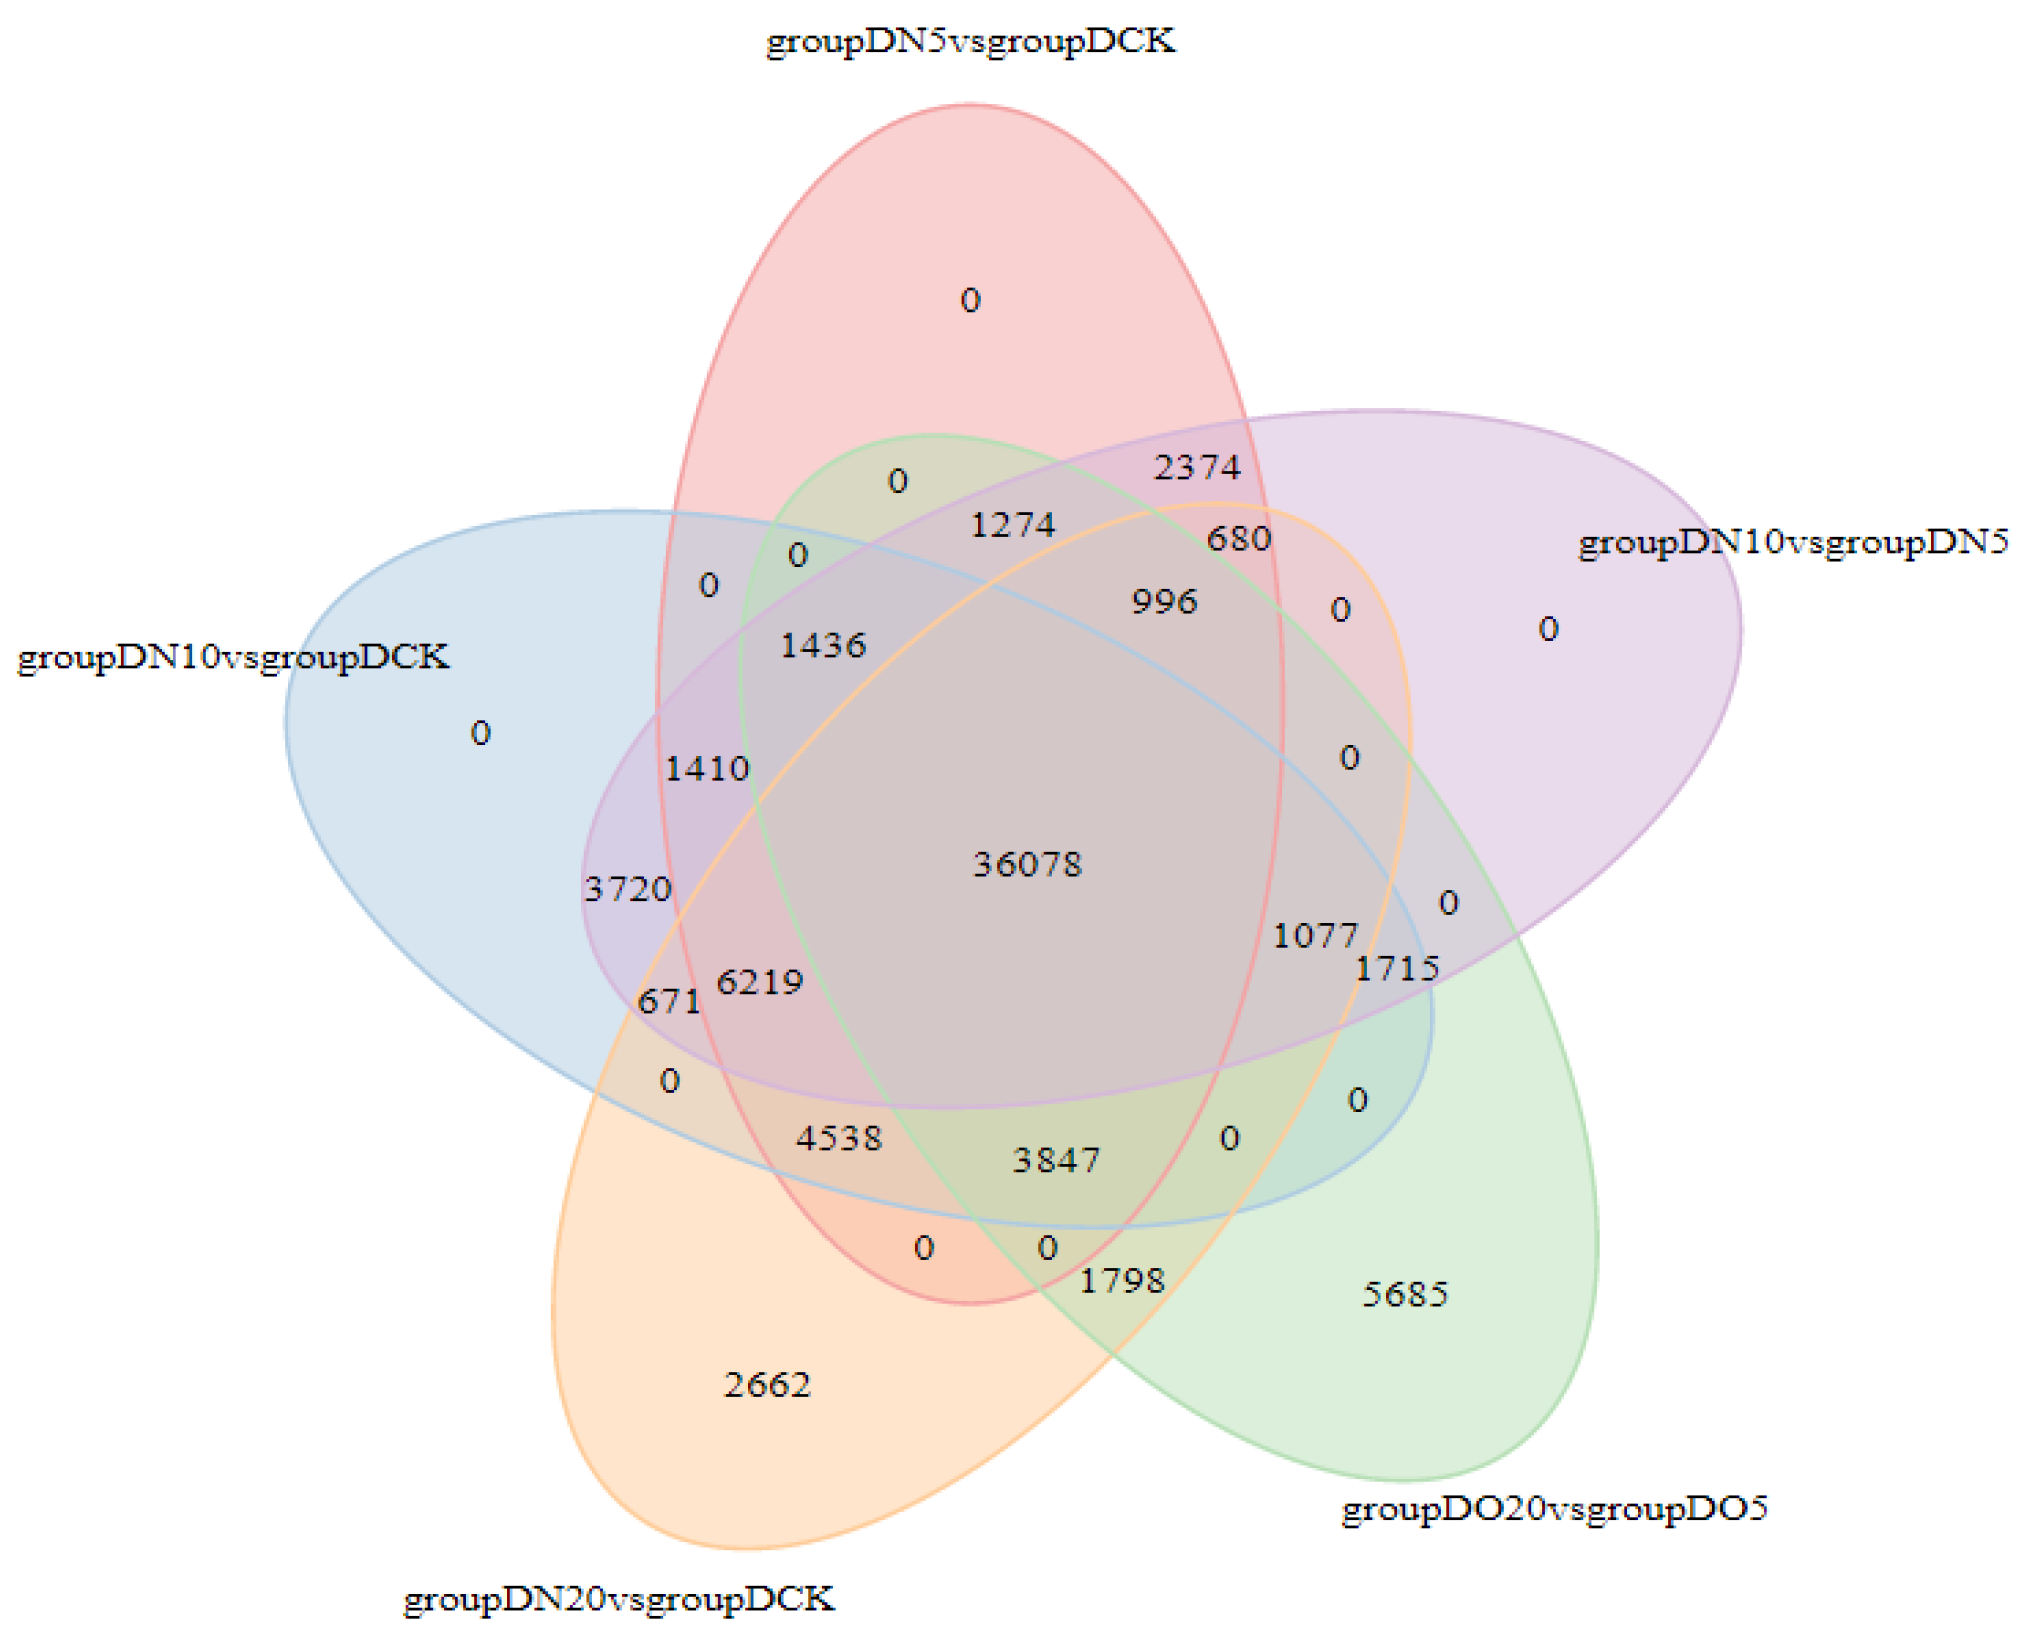
3.5.5. Venn Diagram of DEGs

The Venn diagram illustrates the intersection of differentially expressed genes across various comparison combinations, enabling the identification of common or unique differential genes within specific comparisons. The 36,078 DEGs that are common exhibit a consistent expression across all combinations, as illustrated in Figure 3.

3.5.6. GO Annotation and Enrichment Analysis of Differentially Expressed Genes

The functional annotation of DEGs between the nanoselenium and organic selenium treatment groups was conducted. Subsequently, a GO functional enrichment analysis was separately performed for the upregulated and downregulated DEGs. Statistical tests were carried out using corrected p-values, and a histogram depicting the distribution of GO terms was generated (Figure 4).
In terms of biological processes, it was observed that upregulated genes tended to be involved in photosynthesis-related processes such as light harvesting (GO: 0009765), photosynthetic electron transport chain (GO: 0009767), green metabolic system process (GO: 0015994), cellular divalent inorganic cation homeostasis (GO: 0072503), green metabolic process (GO: 0072503), and the regulation of chlorophyll biosynthetic process (GO: 0010380). On the other hand, downregulated genes were primarily associated with the regulation of protein localization to nucleus (GO: 1900180) and the regulation of dephosphorylation events (GO: 0035303). Regarding cellular components, major upregulated genes were found to be related to chloroplast thylakoid membrane protein complex formation (GO: 0098807), chloroplast thylakoid lumen organization (GO: 0009543), and transcriptionally active chromatin maintenance (GO: 0035327), whereas downregulated genes mainly belonged to Cajal body organization (GO: 0015030) and tubulin complex assembly (GO: 0045298). In terms of molecular functions, significant expression changes were observed for pigment binding activity (GO: 0031409), the structural constituent of cytoskeleton (GO: 000520) and poly(U) RNA binding activity (GO: 000826). On the contrary, downregulated gene sets mainly included snoRNA binding activity (GO: 003051) and acid-thiol ligase activity (GO: 0016878).

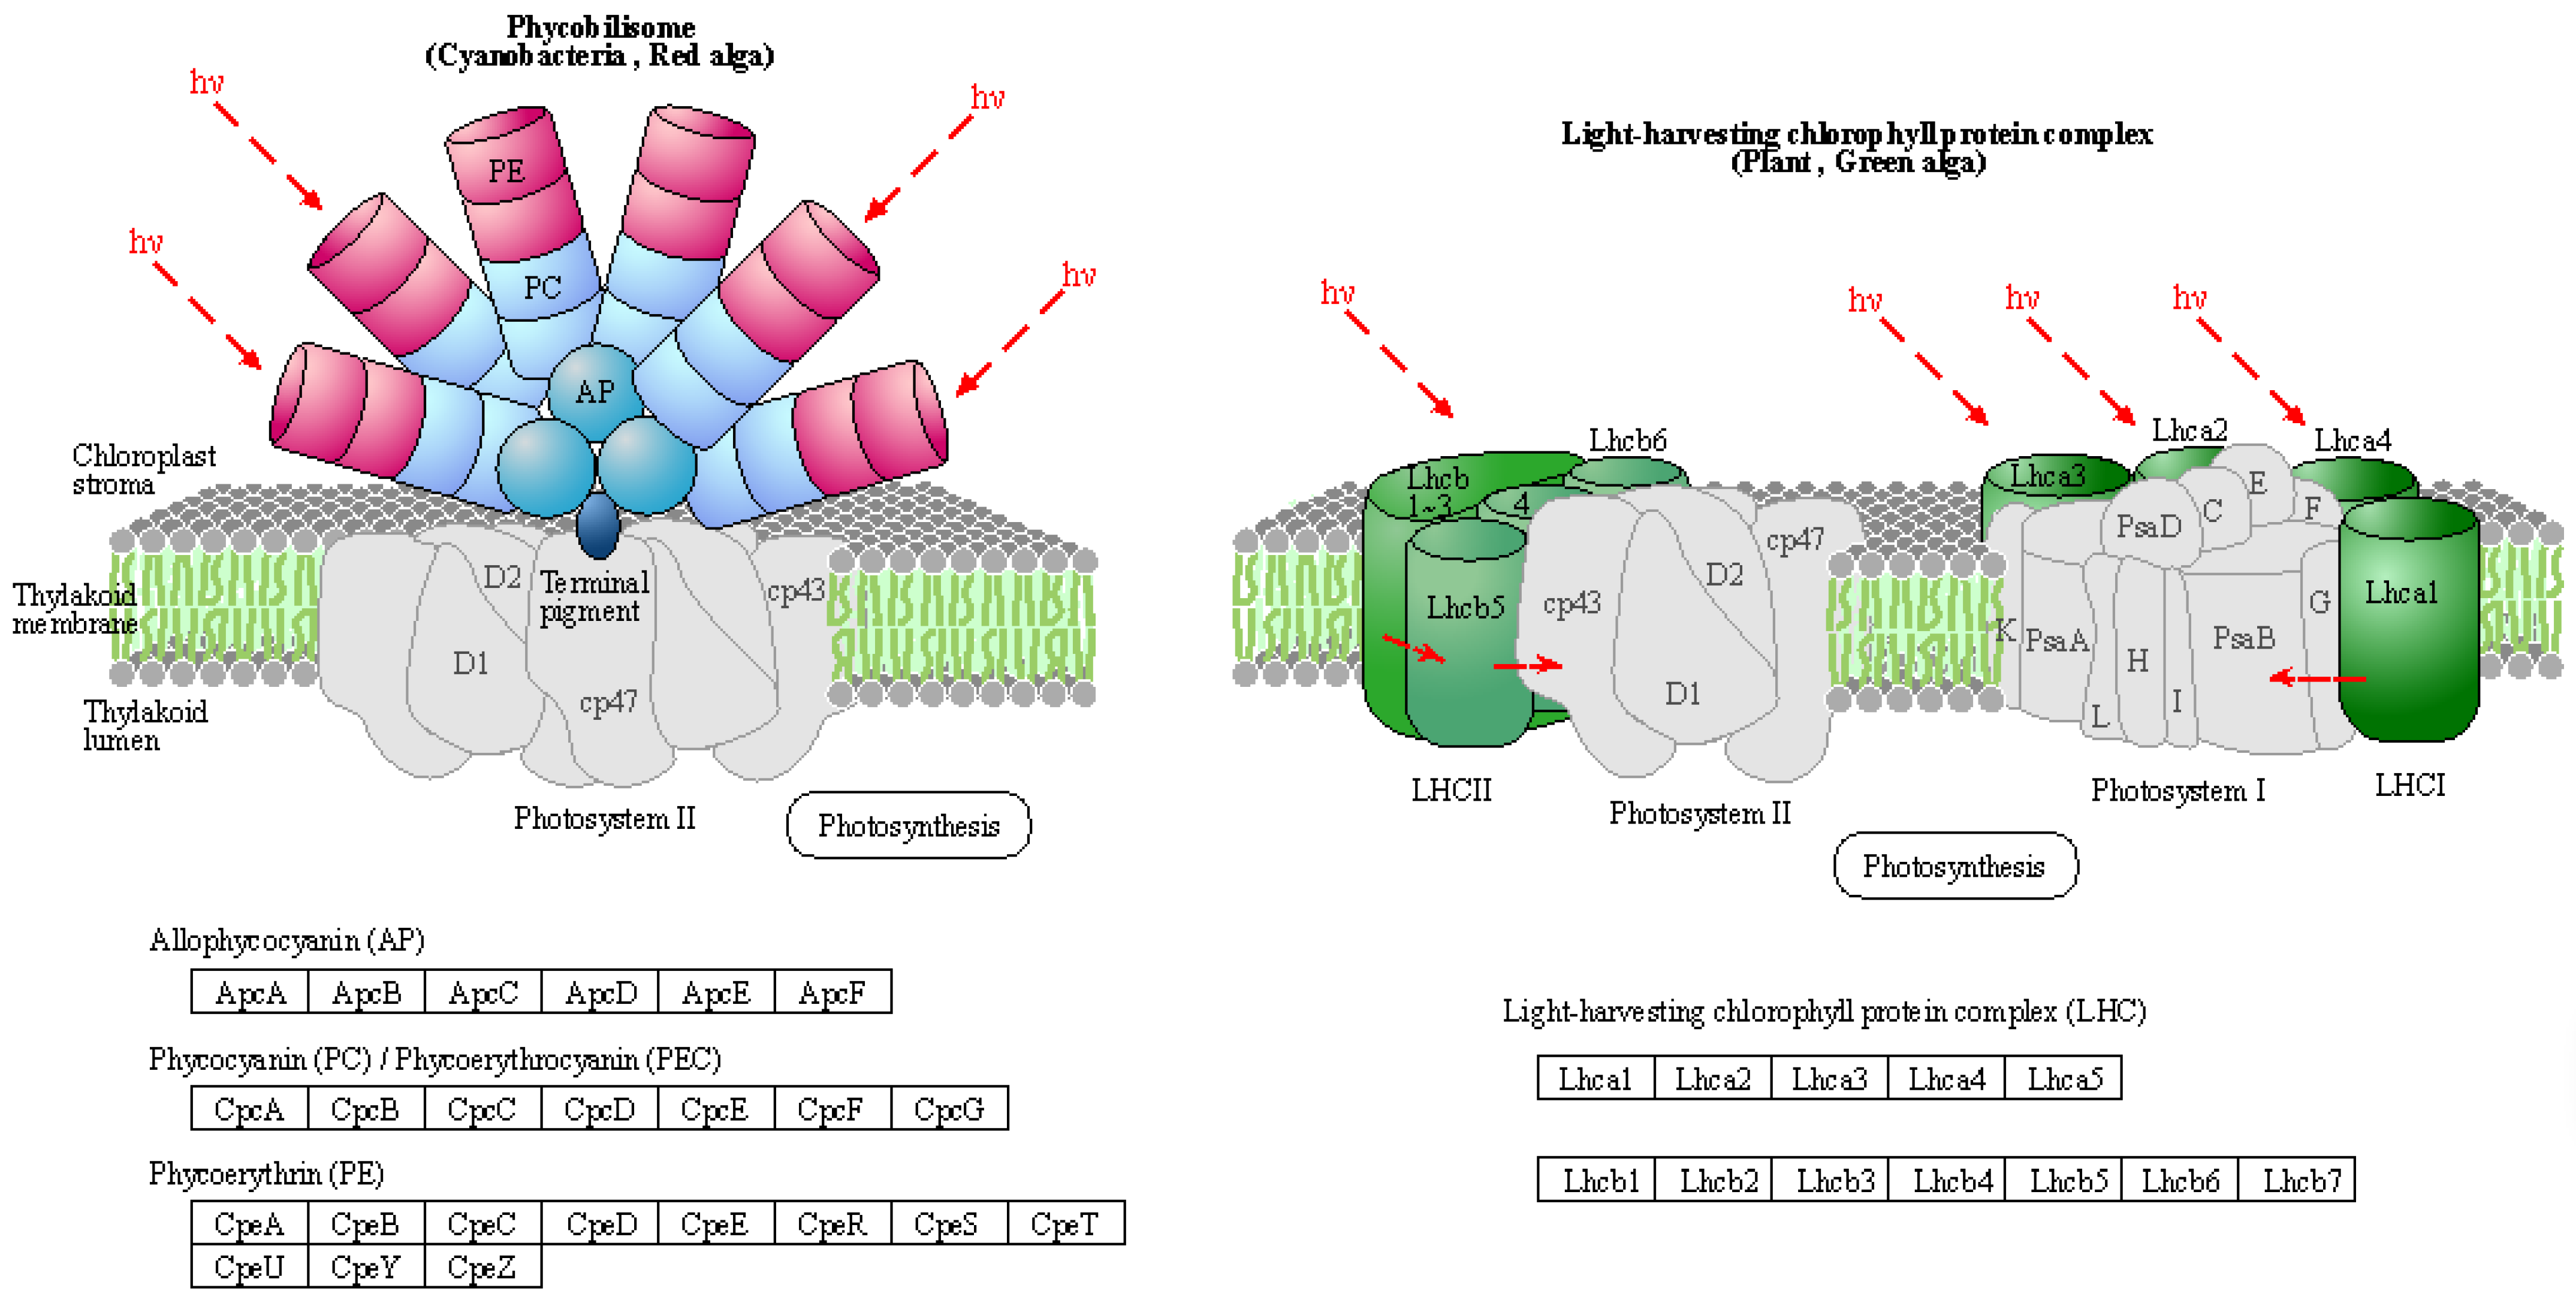
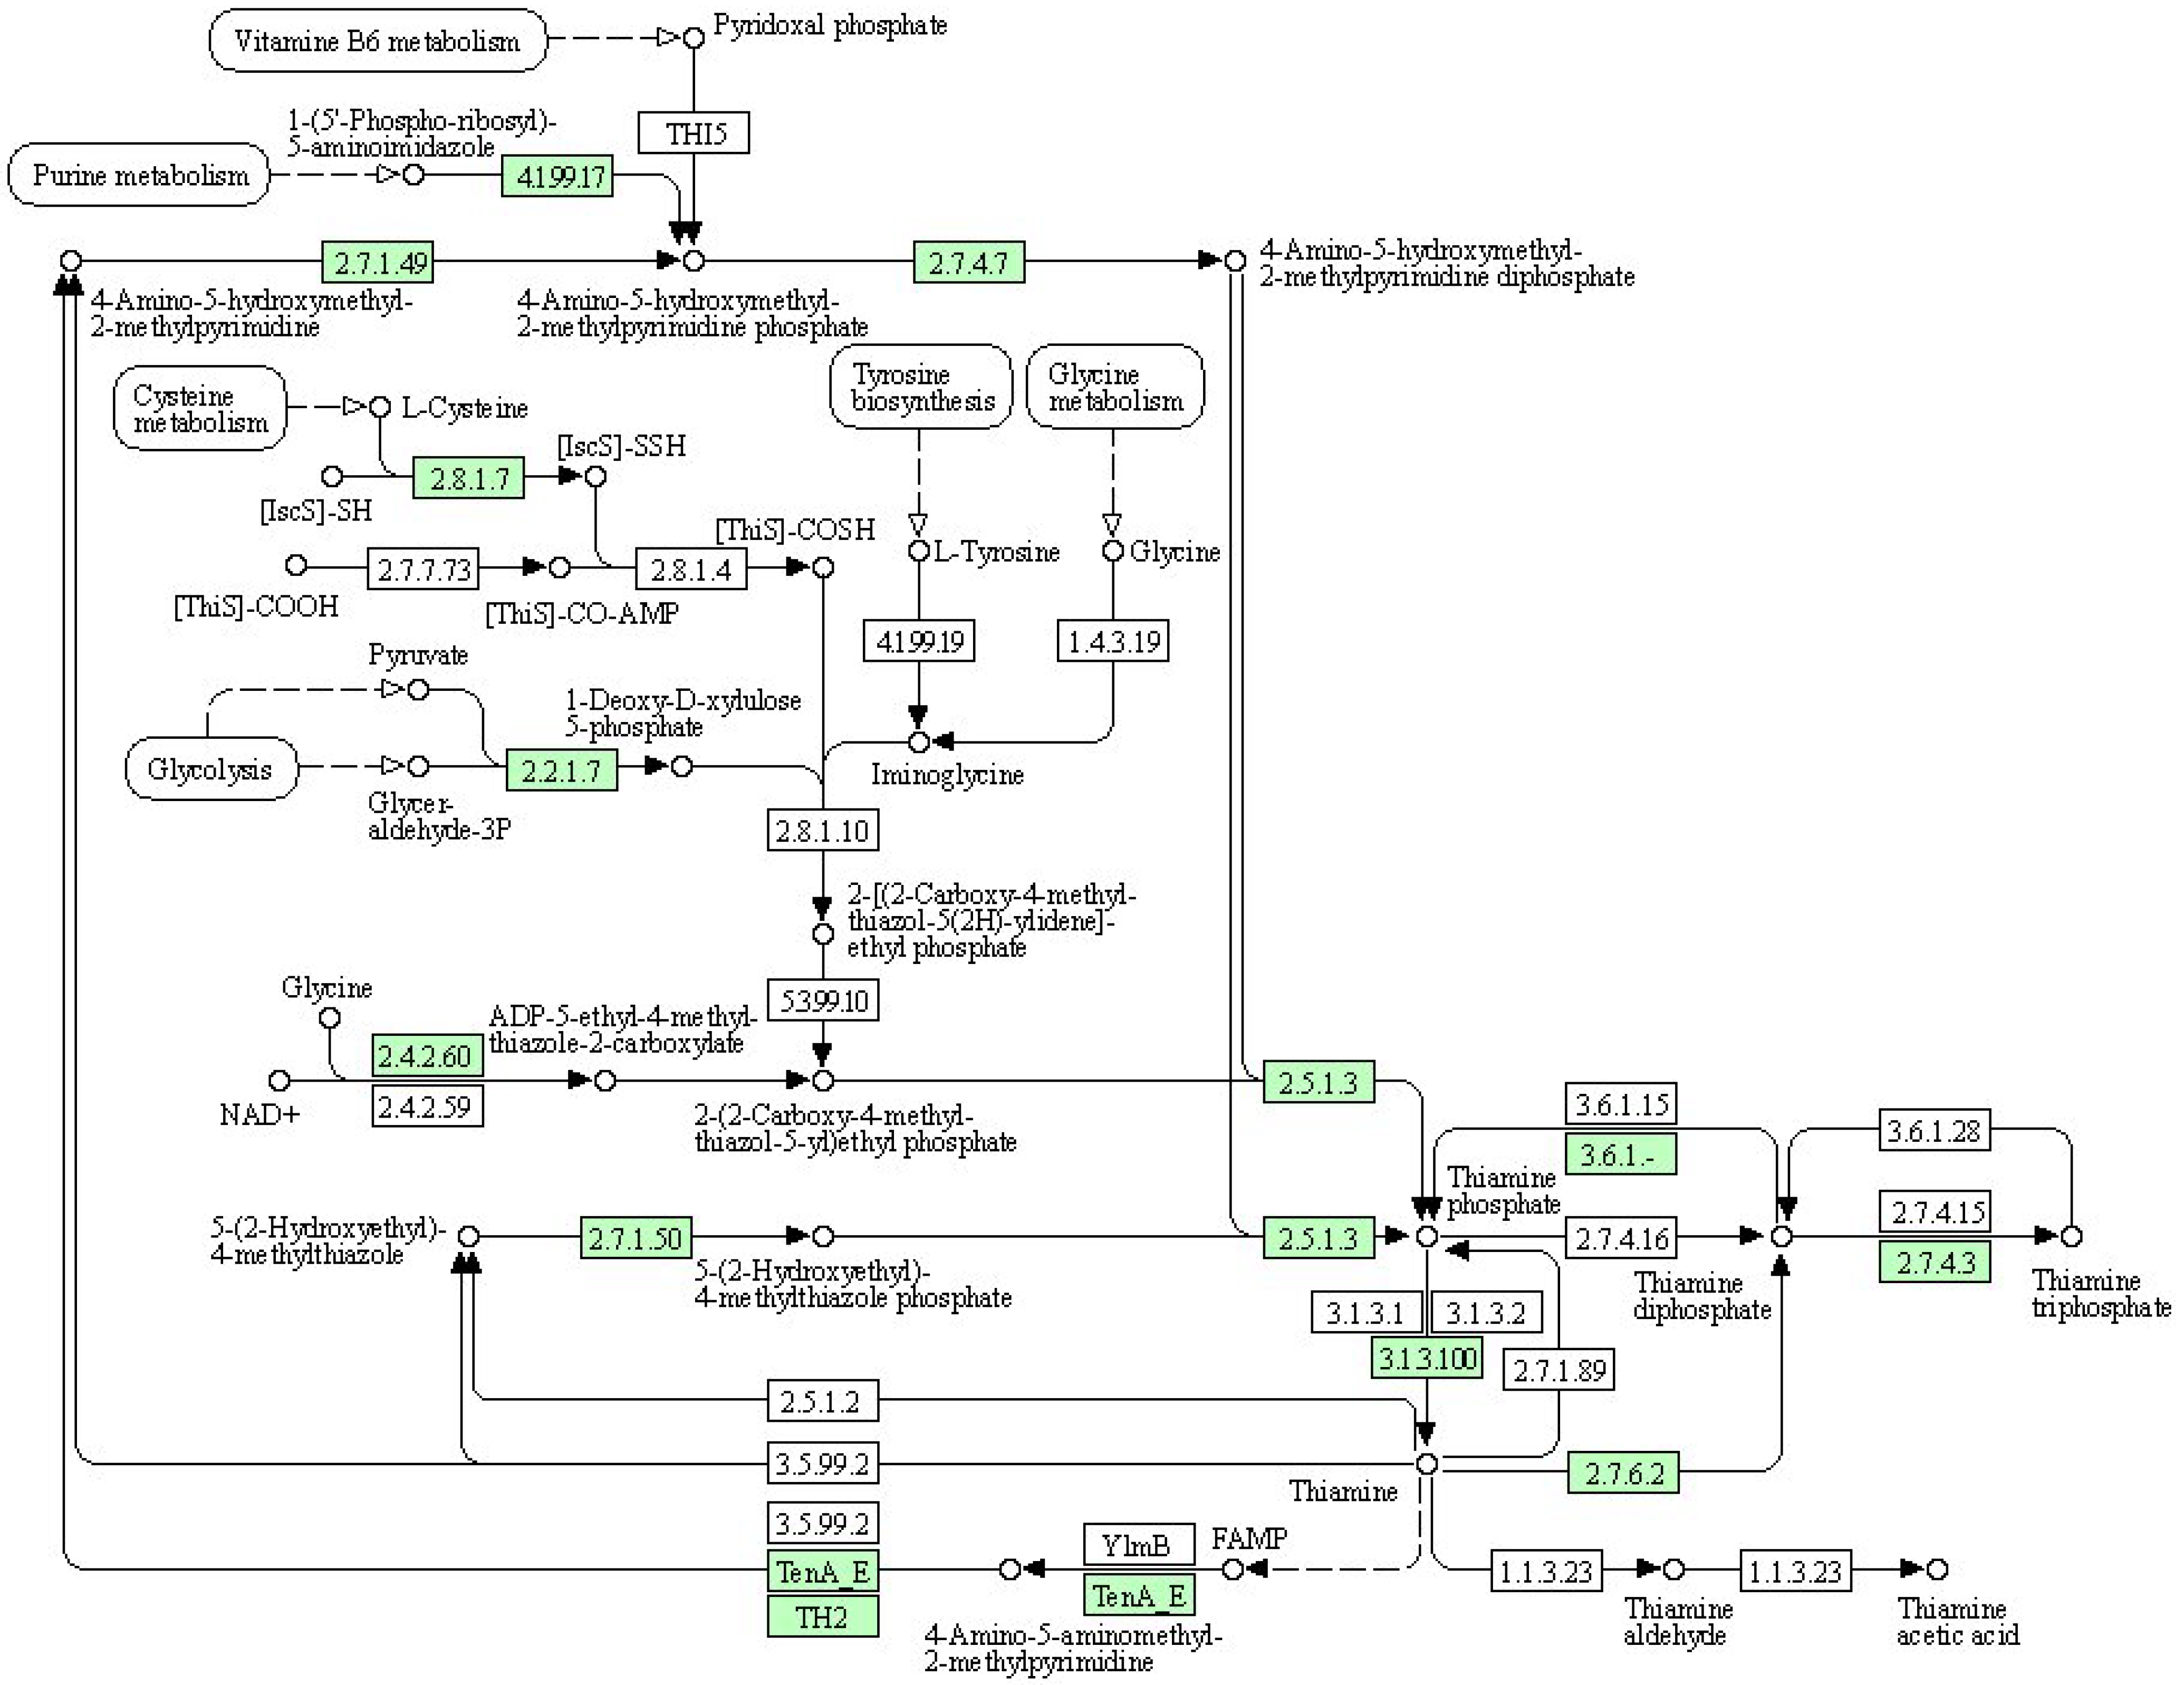
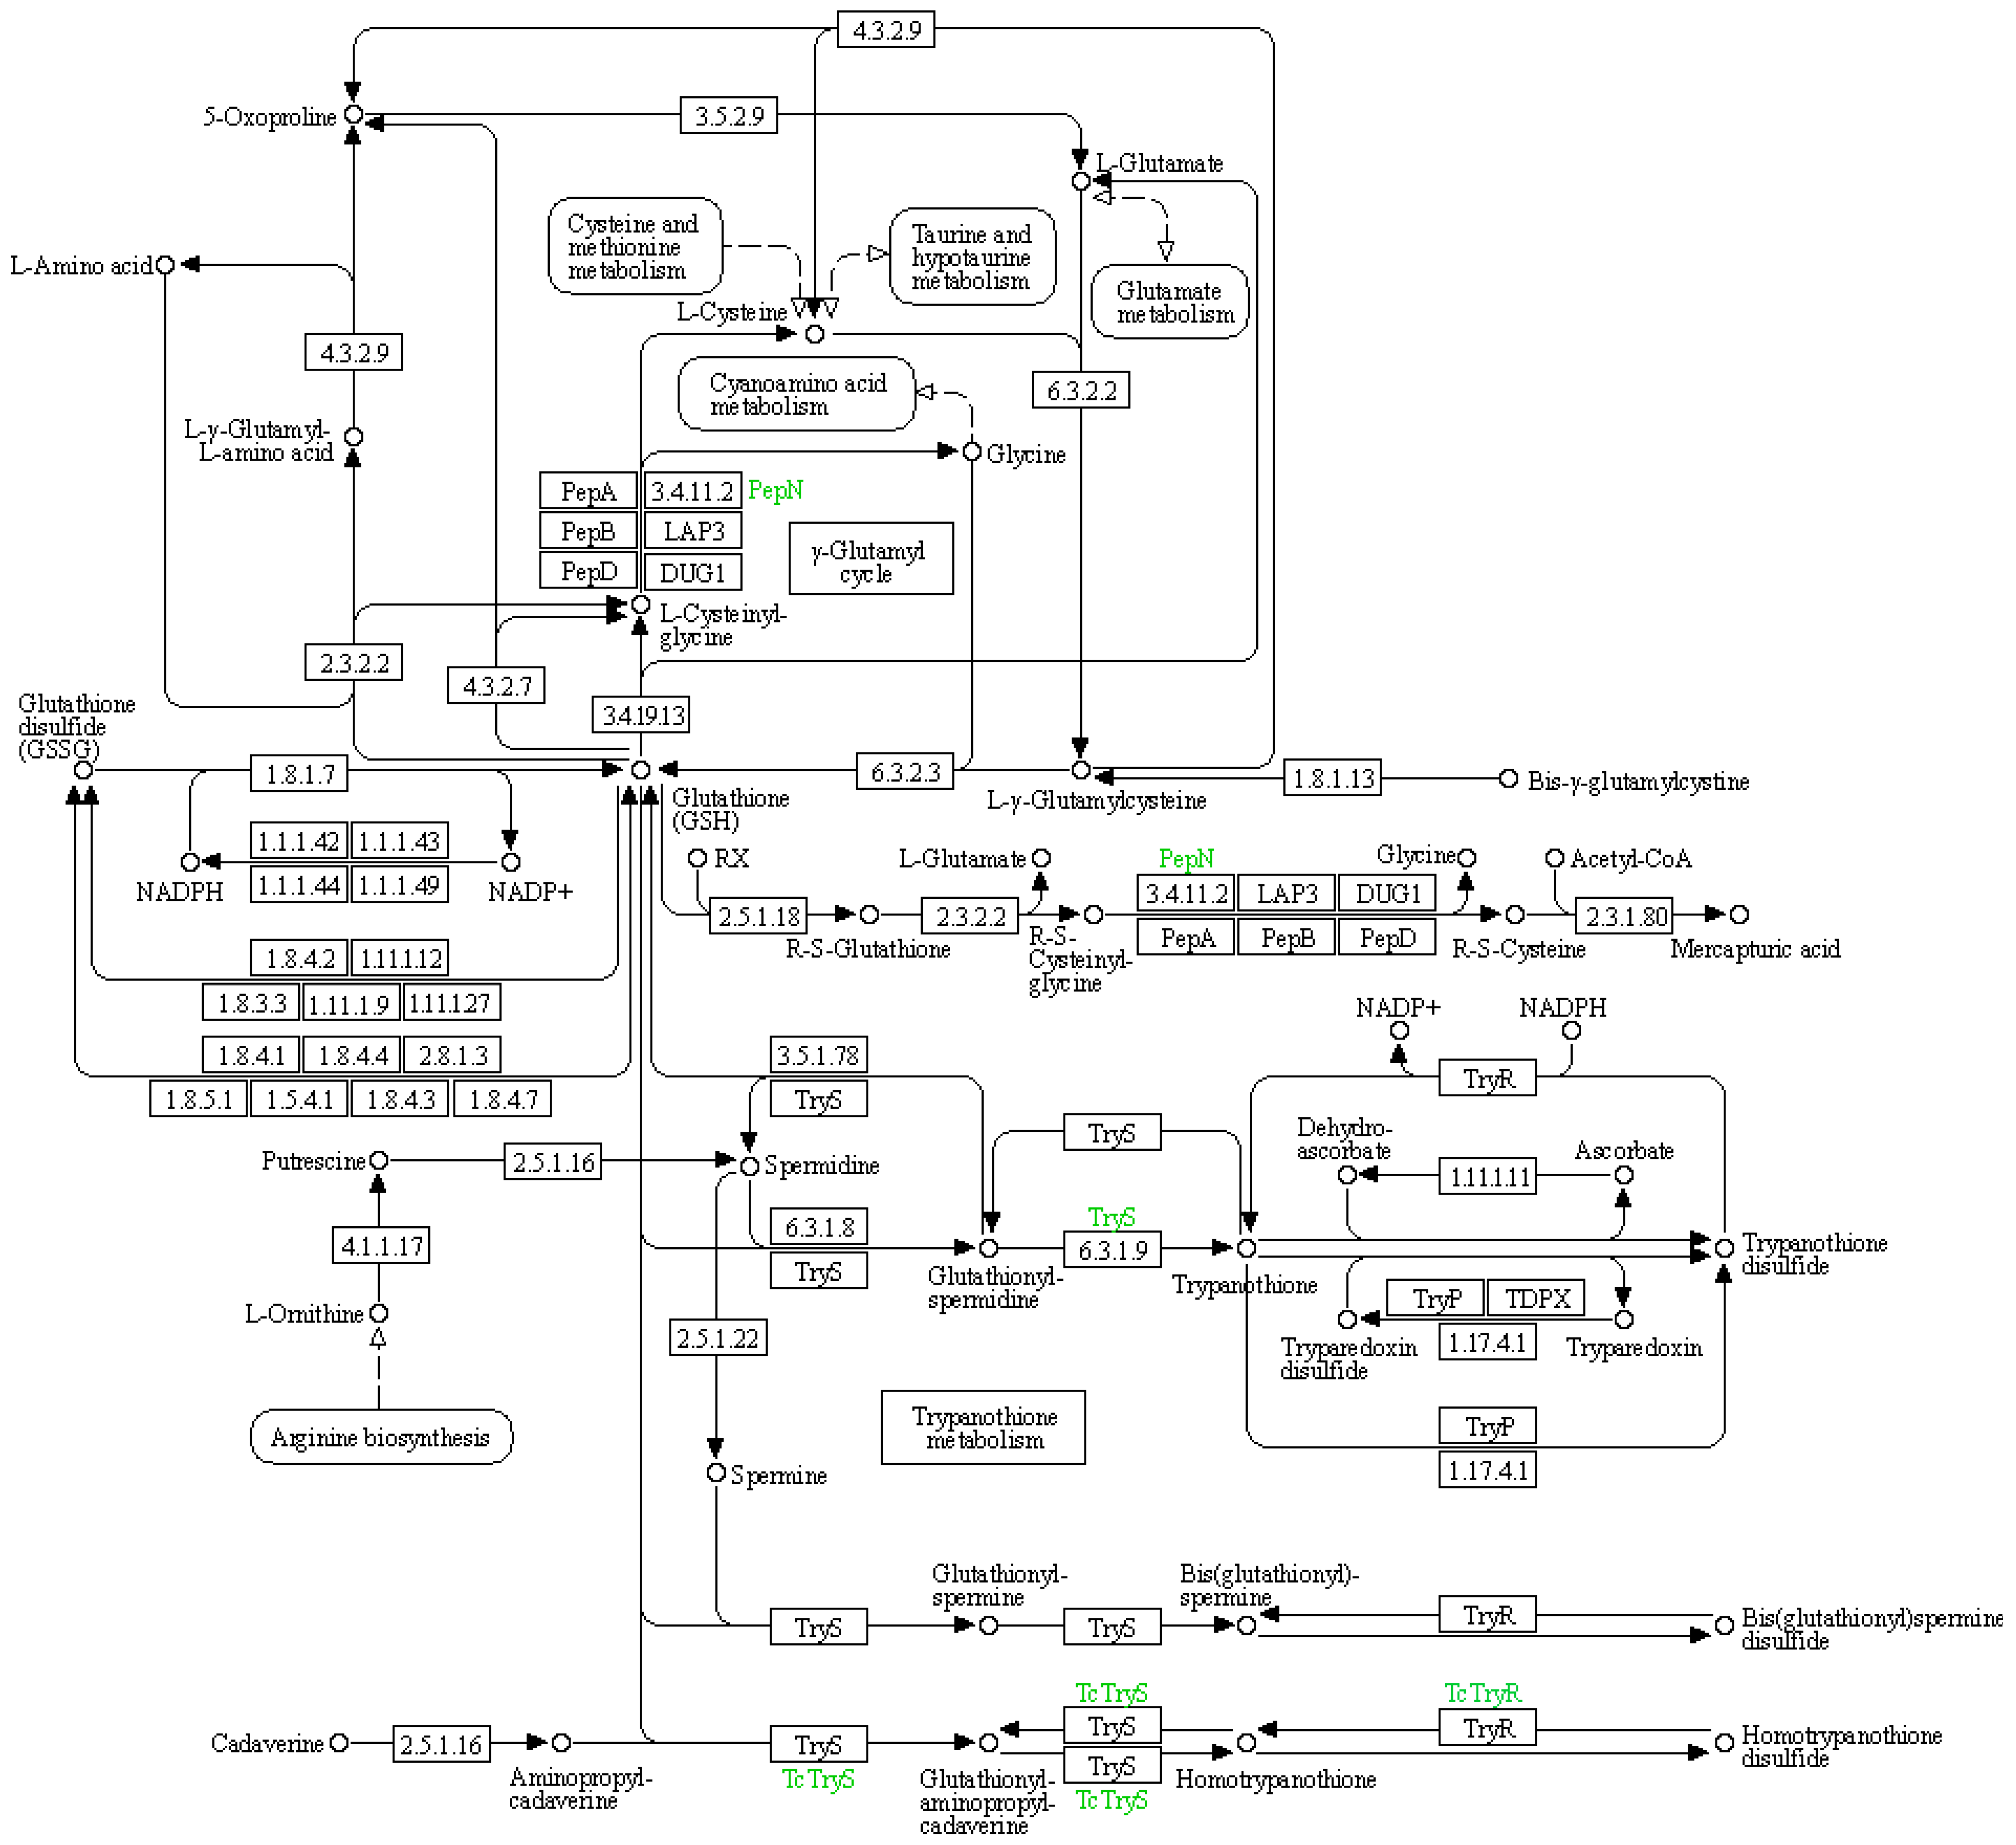
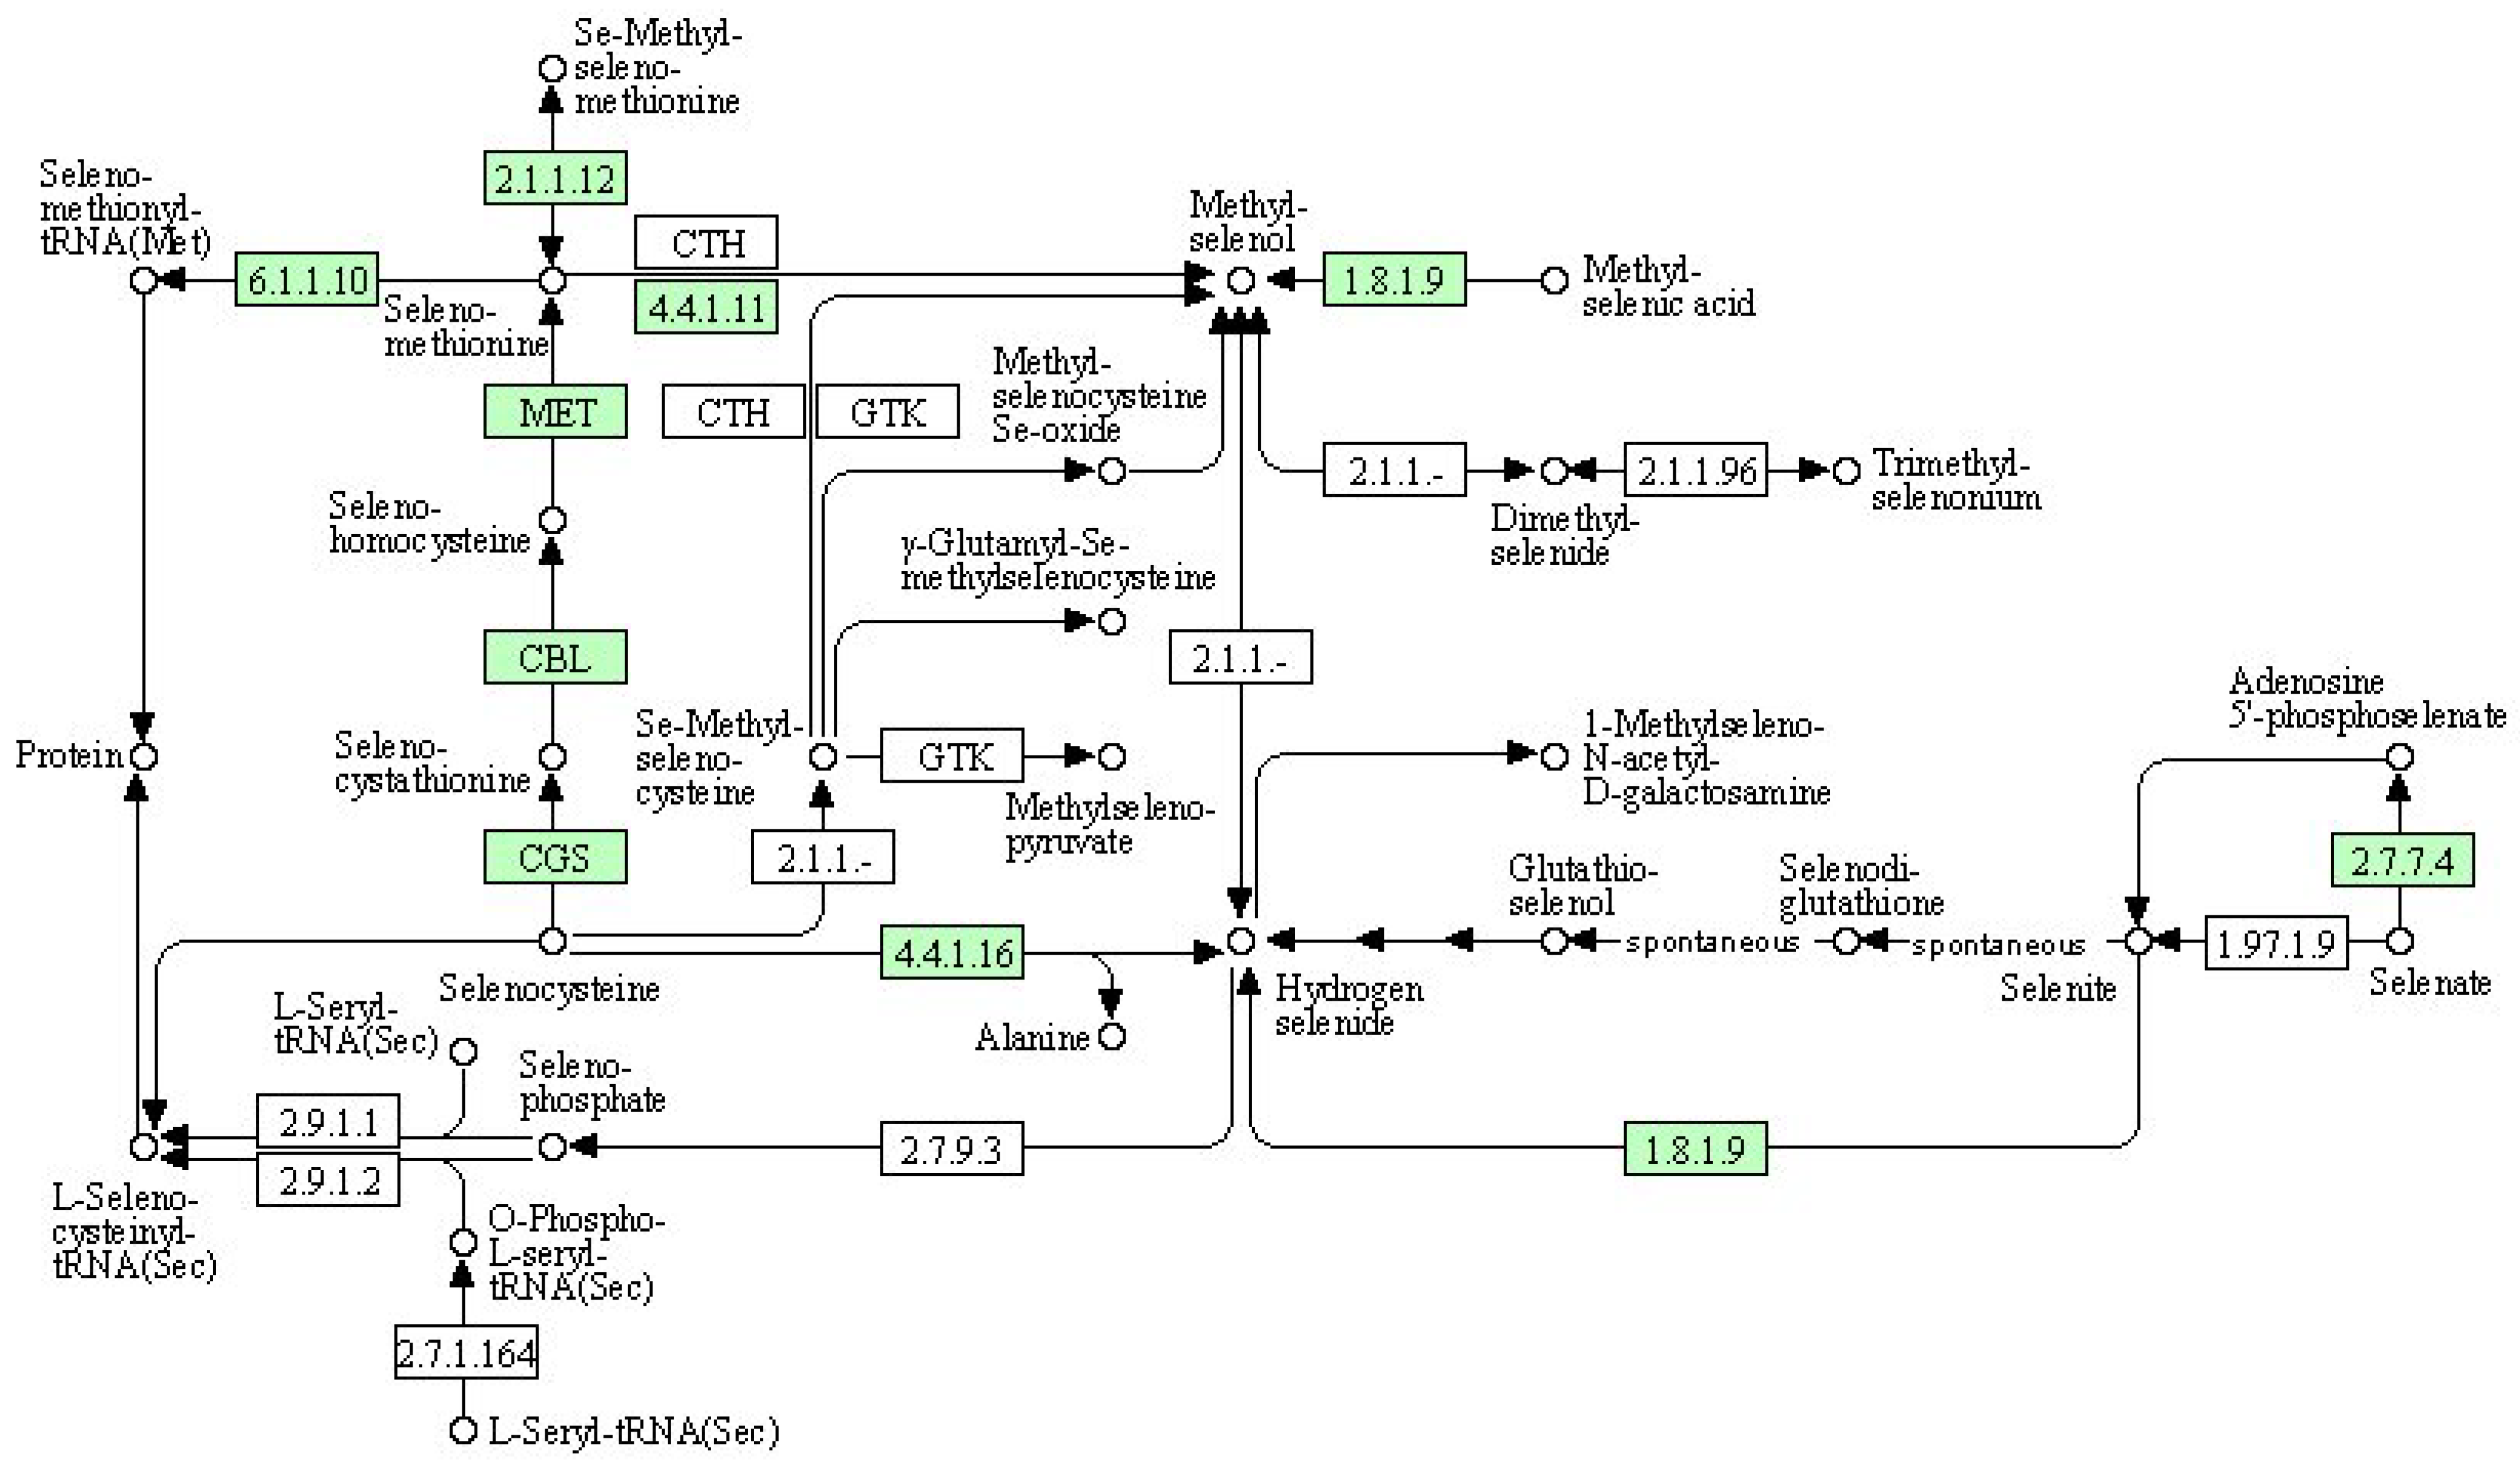
3.5.7. KEGG Annotation and Enrichment Analysis of Differentially Expressed Genes

(1) KEGG pathway: photosynthesis-antenna proteins
A pathway-based analysis is crucial for gaining a deeper understanding of the biological functions of genes. KEGG serves as a prominent public database for pathway information, and a hypergeometric analysis is employed to identify the significant enrichment of pathways.
Usually, PS I light-trapping pigment protein (LHC) contains Lhca1, Lhca2, Lhca3, and Lhca4 proteins. PS II light-trapping pigment protein (LHCII) contains Lhcb1, Lhcb2, Lhcb3, Lhcb4, Lhcb5, and other proteins, and the molecular weight of light-trapping pigment protein is between 20 and 29 kD. There are two kinds of chlorophyll a/b pigment protein complexes in the inner capsule membrane, the chlorophyll a/b pigment protein complex (LHCI) of the photocatcher antenna and the chlorophyll a/b pigment protein complex (LHCII) of the photocatcher antenna(PS II). Since LHCII combines 50% of the total leaf chlorophyll, it plays an important role in the absorption of light energy in photosynthesis. The process of plant photosynthesis is highly susceptible to the effects of drought stress, which can impede photochemical activity and disrupt the equilibrium between light energy absorption and utilization. PSII and PSI serve as the reaction center complexes that drive the photocooperative photoreaction. The biogenesis of PSII involves the coassembly of at least 20 distinct peptides and a multitude of cofactors, while PSI is a multi-subunit protein complex located in the chloroplast thylakoid membrane. Under drought stress conditions, damage to photoinhibition relies on the rate of the de novo assembly of all subunits and cofactors in PSII, indicating that downregulation of photosynthetic genes may lead to a decreased photosynthesis.
The light-harvesting complex (LHC) serves as a photoreceptor, efficiently capturing and transferring excitation energy to closely associated photosystems. When the q-value is equal to or less than 0.05, there are notable differences observed in the drought response of photosynthetic antenna (light pigment protein complexes) and their impact on light-harvesting protein complex (LHC) and photosynthetic capacity. Figure 5, which refers to schematic diagram 4 from Kanehisa laboratories depicting photosynthetic antenna proteins, highlights the significantly differentially expressed genes, while Table 7 provides a list of these corresponding differentially expressed genes. There was a notable increase in the abundance of phototrapping chlorophyll a/b pigment antenna proteins in PS II (Table 9), indicating that both nanoselenium and organic selenium treatments augmented the leaf photoelectron trapping capacity and thus significantly enhanced the efficiency of photosystem I (PS I) and photosystem II (PS II) compared to the control group.
(2) KEGG pathway: thiamine metabolism
Thiamine is a bicyclic compound consisting of thiazole and pyrimidine moieties. In plants, thiamine exists primarily in three forms: free thiamine, thiamine monophosphate, and thiamine pyrophosphate. During the biosynthesis process of thiamine, the pyrimidine and thiazole components are synthesized and independently coupled to form thiamine pyrophosphate. Pyrimidine synthetase (THIC), thiazole synthetase (THI1), thiamine phosphate synthetase (TH1), and thiamine pyrophosphokinase (TPK) serve as key enzymes in the pathway regulating the plant’s synthesis of this essential vitamin (Figure 6). Thiamine plays a crucial role in the plant response to drought stress, and thiamine metabolism is shown in the figure below. As shown in Table 10, the expression of cysteine desulfurase, cysteine-dependent adenosine diphosphate thiazole synthase, adenylate kinase, and thiamine pyrophosphokinase was upregulated upon treatment with organic selenium and nanoselenium.
(3) KEGG pathway: glutathione metabolism
The glutathione metabolic pathway plays a significant role in adapting to drought conditions, particularly in maintaining water homeostasis and reducing water sensitivity in leaves. This has been elucidated through key pathways such as reactive oxygen species (ROS) clearance and signal transduction, as well as the upregulation of antioxidant enzyme gene expression (Figure 7 and Table 11).
(4) KEGG pathway: selenocompound metabolism
We used a bioinformatics analysis to explore the leaf genome and determine the comprehensive metabolic pathway of selenium compounds (Figure 8). The metabolism of selenocompounds begins with the conversion of selenocysteine through cystathionine gamma-synthase (CGS), resulting in the release of seleno-cystathionine. The subsequent compound undergoes a metabolic transformation via cysteine-S-conjugate beta-lyase (CBL), leading to the liberation of selenohomocysteine. This resulting compound reacts with 5-methyltetrahydrofolate-homocysteine methyltransferase (MET), resulting in the liberation of seleno-methionine. Seleno-methionine can be further metabolized into either seleno-methionyl-tRNA or methyl-selenol. Alternatively, methyl-selenol can also be formed from the reaction between methyl-selenic acid and thioredoxin reductase or Se-methyl-seleniumcysteine through cystathionin gamma-lyase (CTH). Compared to the control group, there were significant differences in gene expression between the nanoselenium treatment and the organic selenium treatment, as shown in Table 12.

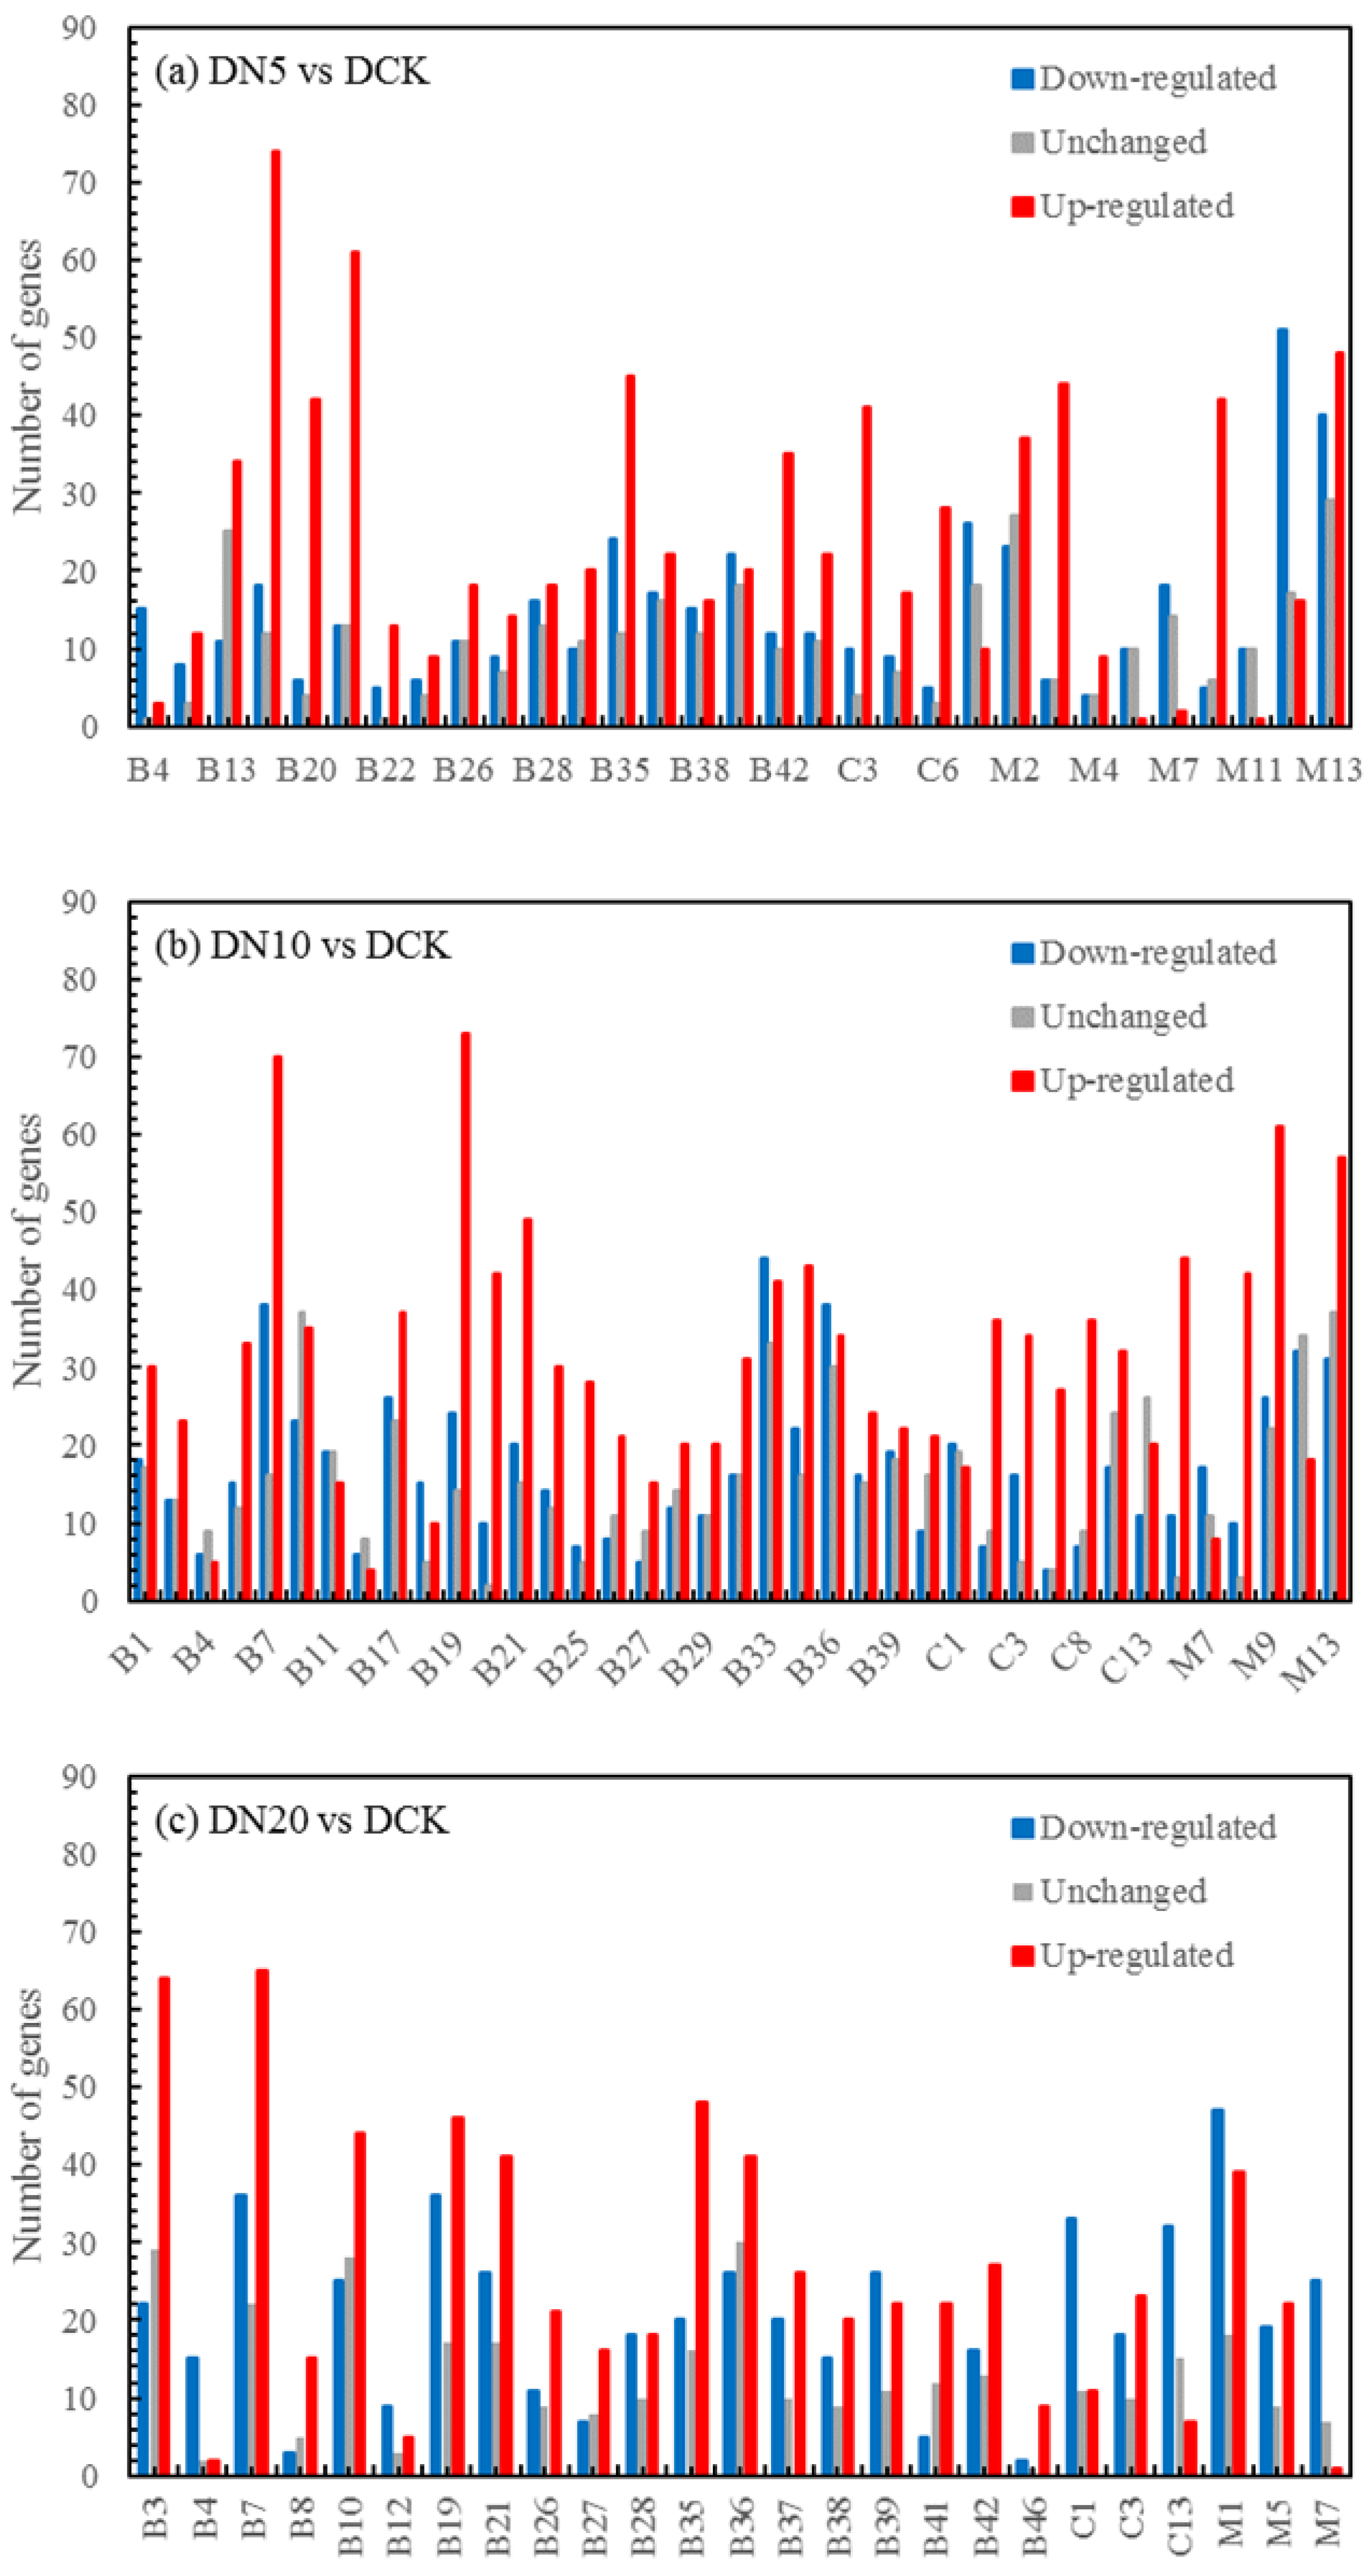
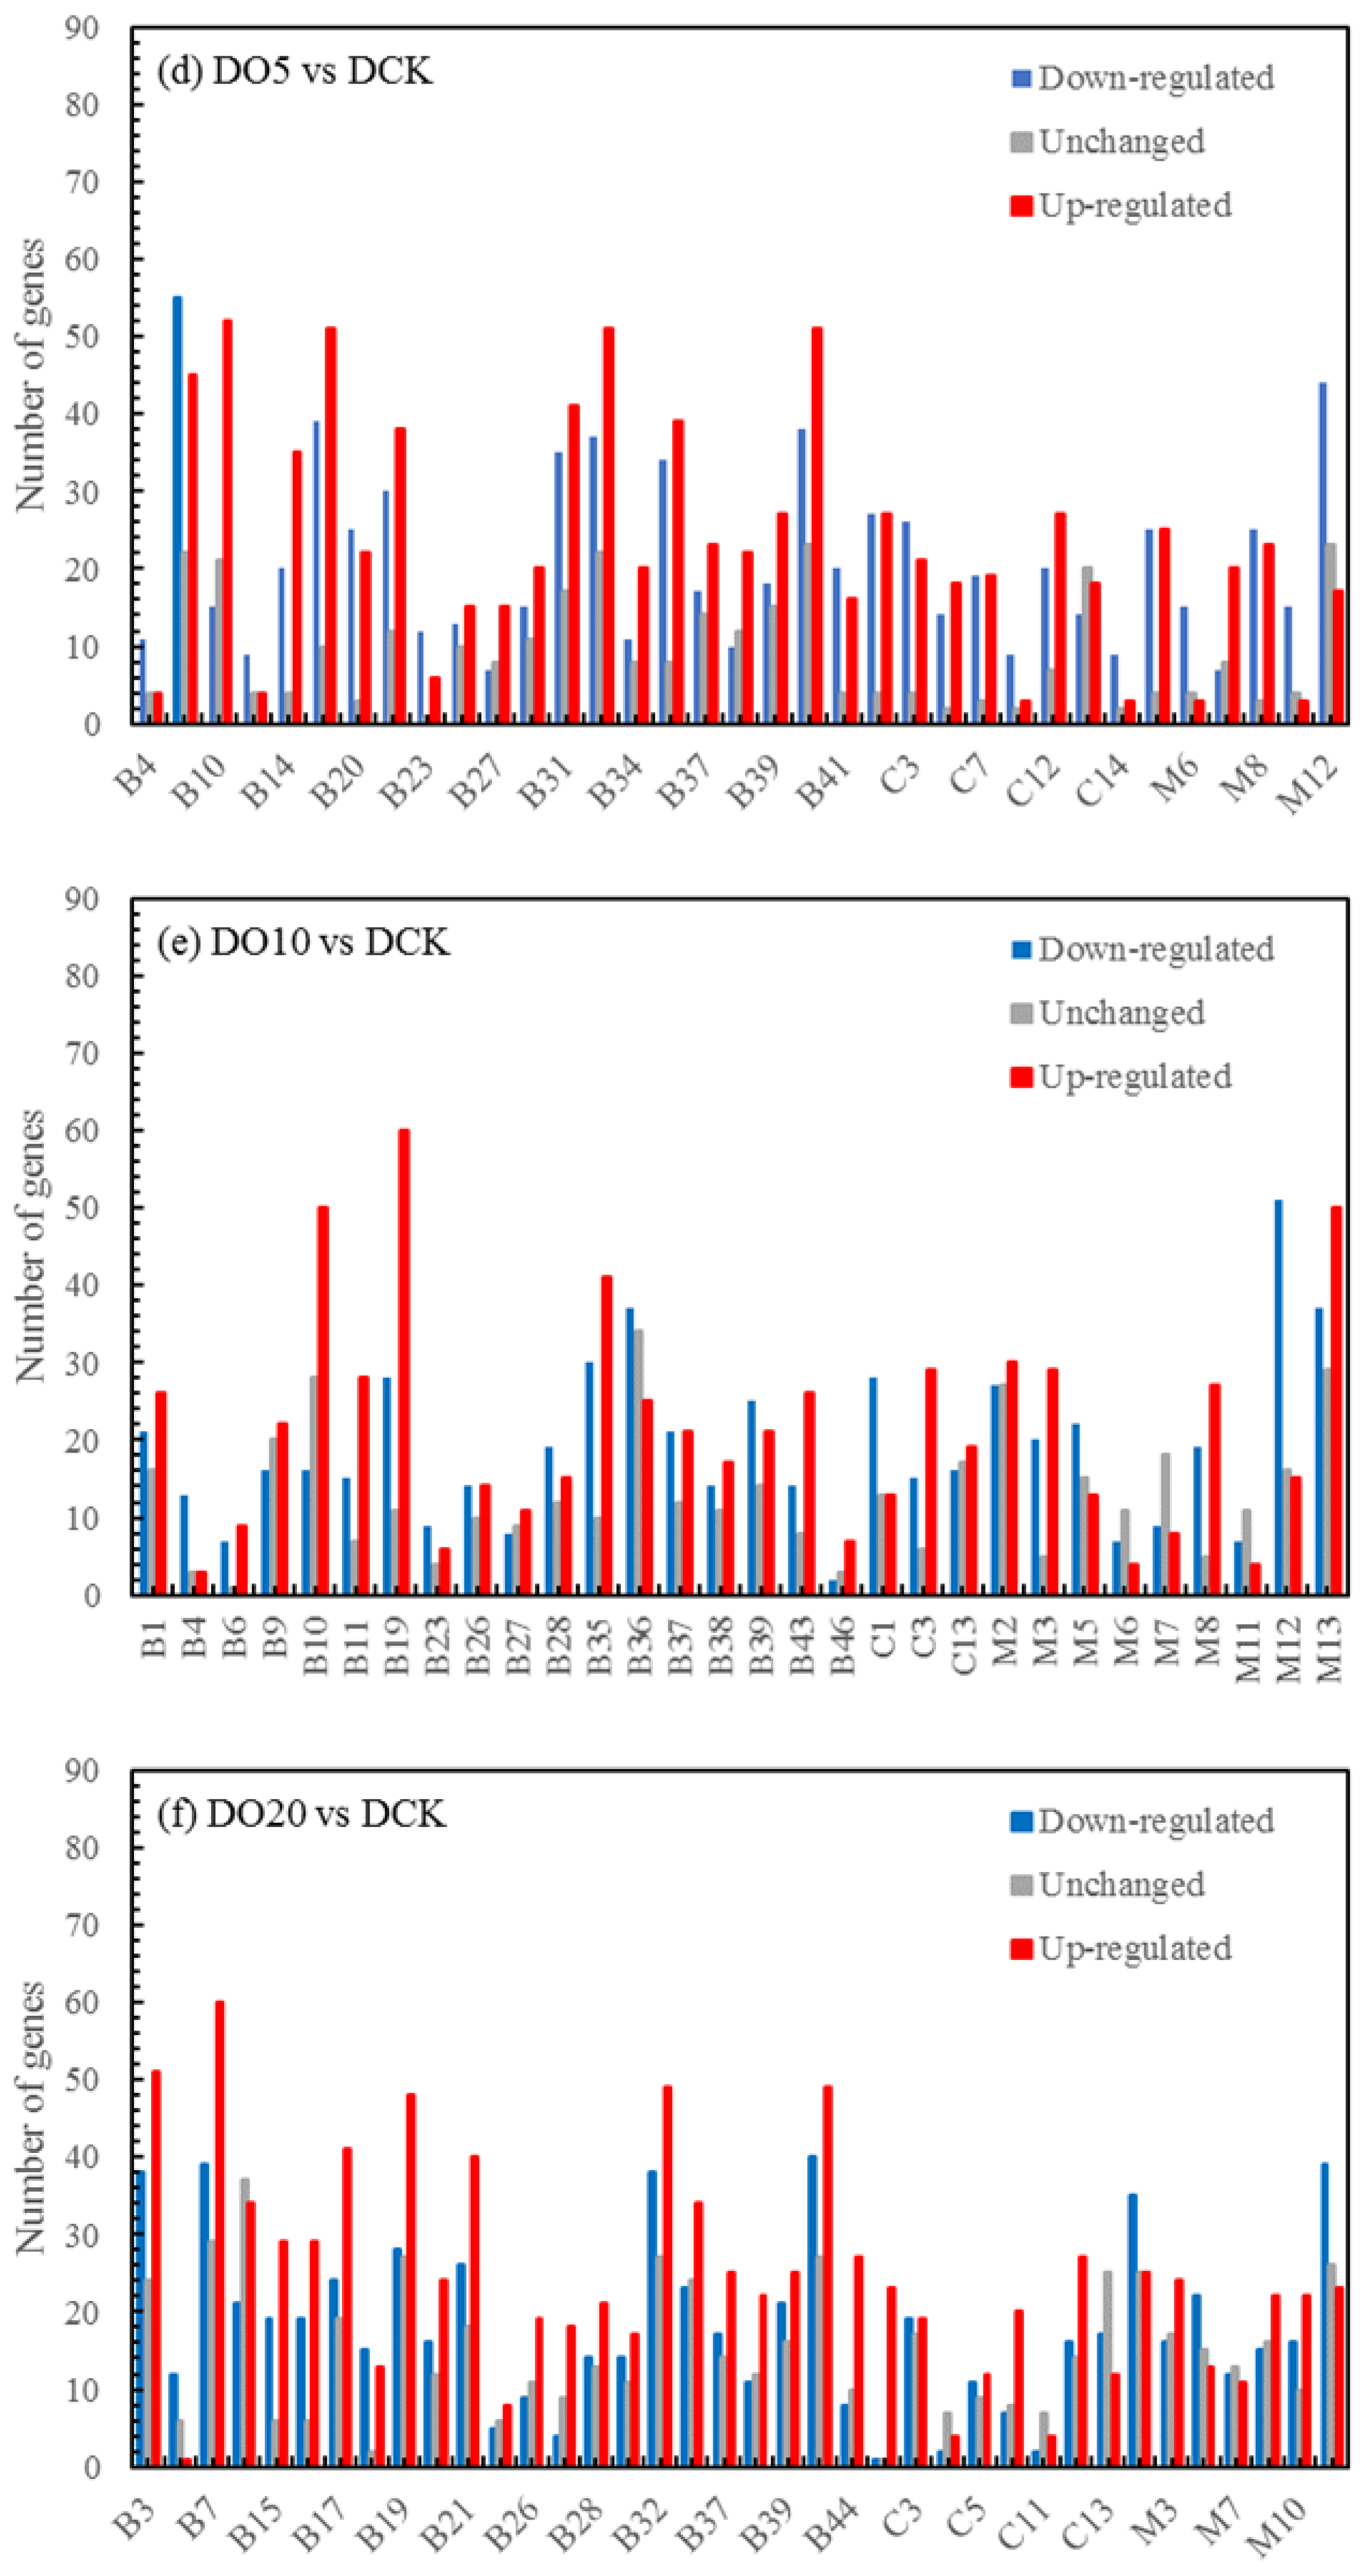
3.6. WGCNA of DEGs and Identification of Hub Gene

The WGCNA assumes a scale-free gene network, defines the correlation matrix and adjacency function for gene coexpression, and calculates different coefficients for various nodes. Subsequently, a hierarchical clustering tree is constructed. Different branches of the cluster tree represent distinct gene modules characterized by a high intramodule gene coexpression and varying scores indicating a low intermodule gene coexpression. The correlation between the module and the sample is shown in Figure 9. The results revealed that DN5 exhibited the highest correlation (0.88) with the MEsalmon module, while DN10 displayed the highest correlation (0.93) with the MEtan module. Additionally, DN20 demonstrated the strongest association (0.96) with the MEdarkred module, and DO5 showed a significant association (0.95) with the MEmagenta module. Moreover, DO10 exhibited the highest correlation (0.95) with the MEbrown module, whereas DO20 displayed a strong association (0.96) with the MEdarkorange module.
The expression trend of genes in the module across different samples is illustrated in Figure 10, and the expression patterns of the aforementioned six module eigenvalues were analyzed. Subsequently, the connectivity degree (commonly referred to as connectivity or degree, denoted by k) between a gene within the module and other genes was calculated. Generally, genes with high connectivity rankings (k values) within a module can be considered as hub genes due to their central position. The results of connectivity are presented in the Table 10, and a total of nine hub genes were obtained: LOC103837231, adenylate kinase 2; LOC103858064, glutathione peroxidase 3; LOC103842805, glutathione S-transferase U25; LOC103830524, glutathione S-transferase U20; LOC103844552, thiamine pyrophosphokinase 1; LOC103872309, ABC transporter G family member 35; LOC103867761, ABC transporter G family member 1; LOC103844798, ATP-dependent zinc metalloprotease FTSH 11; LOC103866104, cysteine synthase.
The gene expression changes observed by the WGCNA were consistent with the results of the upregulated genes in the KEGG pathway of DEGs as in the above transcriptome sequencing analysis, thereby validating the accuracy and reliability of the transcriptome sequencing data (Table 13). Additionally, a differential expression of these genes was observed between the experimental and control groups. Consequently, these genes can be considered crucial selenium-response-related genes that play a pivotal role in the molecular response mechanism of the leaf towards the exogenous selenium treatment.

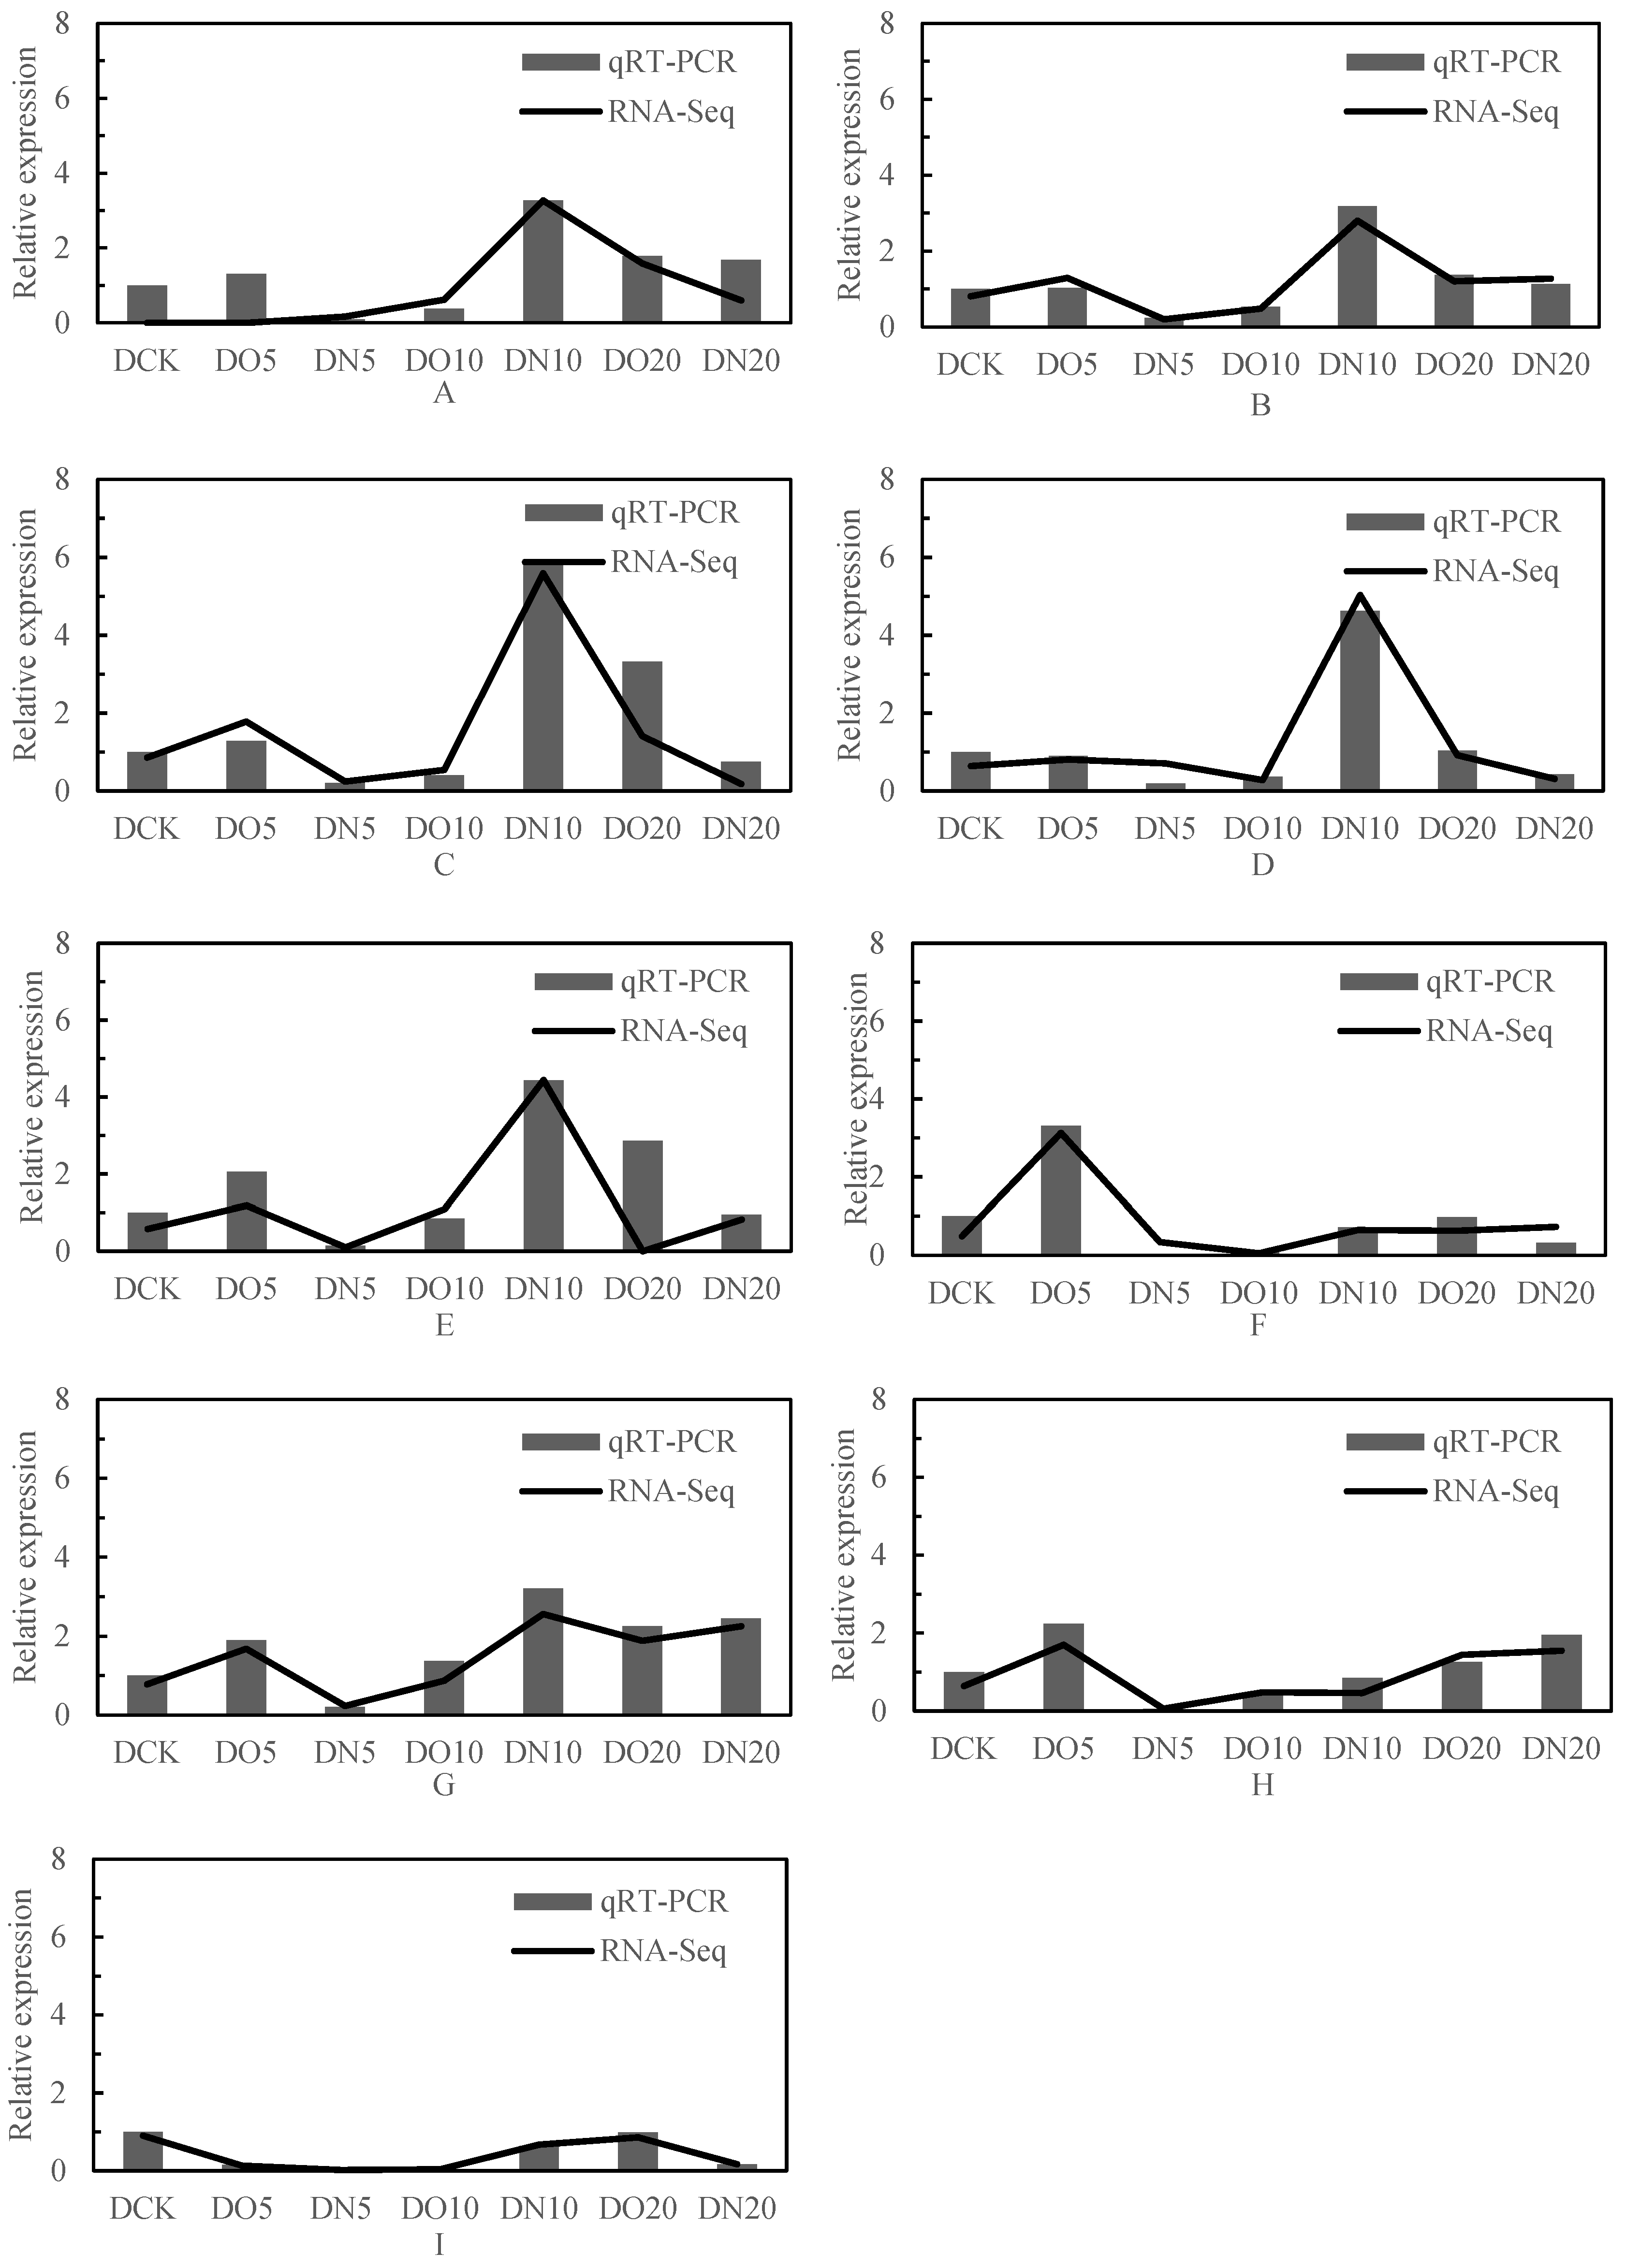
3.7. Fluorescence Quantitative PCR Analysis

Nine genes were selected from the differentially expressed genes in the transcriptome for validation analysis using real-time fluorescence quantitative PCR, and the correlation coefficient was 0.95 (calculated by 2−ΔΔCt value). The results of the qRT-PCR verification exhibited a significant positive correlation with the RNA-seq results at a level of p < 0.01, indicating that the test outcomes were reliable (Figure 10).

4. Discussion

4.1. Effects of Organic Selenium and Nanoselenium on Leaf Photosynthesis under Drought Stress

Chlorophyll is the main pigment that maintains plant photosynthesis, directly affecting the strength of plant photosynthetic capacity. Yao et al. [33] found that exogenous selenium could increase chlorophyll content in wheat seedling leaves under drought stress. Chen et al. [34] conducted experiments on tobacco by controlling water and simulating drought stress, finding that exogenous selenium could promote the synthesis of photosynthetic pigments in tobacco leaves under drought stress and increase chlorophyll content. Yue [35] discovered that exogenous selenium could alleviate chlorophyll destruction in N51 seedling leaves under drought stress, better helping corn seedlings resist damage caused by drought stress and improving their drought resistance.
The results of this study are essentially consistent with those of the aforementioned scholars. Our findings suggest that appropriate concentrations of nanoselenium and organic selenium can enhance chlorophyll accumulation by modulating the synthesis pathway of chlorophyll compared with DCK. In this paper, digital gene expression profile technology was employed to analyze differential gene expression. The findings revealed a significant increase in the expression levels of photosynthetic antenna protein regulatory genes (Lhca1, Lhca2, Lhca3, Lhca4, Lhcb1, Lhcb2, Lhcb3, Lhcb4, and Lhcb5) and major regulatory genes of photosynthesis upon spraying with nanoselenium and organic selenium, leading to an improvement in photosynthesis. We also observed that under drought conditions, reactive oxygen species (ROS) molecules tend to accumulate in leaf cells, particularly in mitochondria and chloroplasts—the primary sites of electron transport. The clearance mechanism for ROS is a crucial component of the electron transport process, wherein selenium plays a pivotal role. Consequently, selenium may facilitate plant photosynthesis by promoting efficient electron transport.
Additionally, an exogenous selenium treatment resulted in a notable increase in the net photosynthetic rate, transpiration rate, and stomatal conductance of leaves, indicating an enhancement in photosynthetic capacity that aligns with the results obtained from the gene expression profile analysis.

4.2. Effects of Organic Selenium and Nanoselenium on the Regulation of the Antioxidant System of Leaves under Drought Stress

The application of selenium has been shown to increase the activity of antioxidant enzymes and reduce oxidative damage in wheat under water stress [36]. Fan [10] demonstrated that selenium supplementation significantly decreased the accumulation of H2O2, O2-, and MDA in plant leaves and roots under drought and salt stress, which is consistent with the findings of Rady et al. [37]. Yue [35] found exogenous selenium could significantly enhance the activity of antioxidant enzymes in N51 seedling leaves and roots under drought stress, reduce reactive oxygen species levels in vivo, maintain normal tissue physiological activities, and improve seedling drought resistance.
Ahmad et al. [38] discovered that a foliar application of selenium and priming with selenium significantly enhanced the activities of SOD, POD, and CAT in oilseed crops Camelina (Camelina sativa L.) and Canola (Brassica napus L.) under drought stress conditions. Sardari et al. [39] reported that selenium and nanoselenium acted as stimulators for antioxidant enzyme activities in wheat plants, thereby enhancing plant tolerance to drought stress. Zahedi et al. [40] demonstrated that foliar spraying of 10 nm and 50 nm Se-NPs alleviated the detrimental effects of drought on pomegranate leaves and fruits by reducing stress-induced lipid peroxidation and H2O2 content, while enhancing the activity of antioxidant enzymes. Moloi and Khoza [41] observed that selenium induced an increase in ascorbate peroxidase activity during the flowering stage in edamame plants under drought stress.
The findings of this study are consistent with previous research: the application of organic selenium and nanoselenium resulted in an increase in SOD activity, POD activity, and GSH content. It demonstrated that the antioxidant enzyme system induced by nanoselenium and organic selenium effectively enhanced the antioxidative capacity of leaves. Both nanoselenium and organic selenium were found to enhance the leaf antioxidant activity and stimulate the synthesis of nonenzymatic antioxidants, including glutathione, ascorbic acid, and carotenoids. Furthermore, nanoselenium and organic selenium also triggered the disproportionation of superoxide anions leading to H2O2 production, which was subsequently decomposed by antioxidant enzymes. Consequently, an appropriate concentration of nanoselenium and organic selenium can confer protection against drought-induced damage on leaves.
Additionally, transcriptome sequencing revealed that this could be attributed to selenium acting as a cofactor for glutathione peroxidase (GPX) and participating in the antioxidant defense system. The upregulation of glutathione S-transferase and glutathione oxidase genes reduced oxidative damage in plants under stress, indirectly reducing the need for antioxidant enzymes to eliminate ROS.
Based on research findings on thiamine metabolism, we hypothesize that the application of nanoselenium and organic selenium can help establish a balance between the production and elimination of reactive oxygen species by thiamine. The clearance of reactive oxygen species may be associated with a direct coupling of its molecules, while its metabolite thiamine pyrophosphate is stored as a coenzyme to enhance mitochondrial oxidation state under foreign stress stimuli. This enables cells to release reactive oxygen species more efficiently when stimulated by external factors, thereby inducing downstream signaling molecules for plant resistance. However, a further investigation is needed to explore the intricate relationship between thiamine and mitochondrial oxidative state.

4.3. Effects of Organic Selenium and Nanoselenium on Weight, Total Selenium Content, and Leaf Nutritional Quality under Drought Stress

The metabolism and regulatory mechanism of selenium in plants constitute a complex gene expression network. Various intermediates synthesized in the pathway of selenium metabolism may participate in regulating plant growth and development. In this study, we found that nanoselenium and organic selenium could enhance the accumulation of soluble sugars, soluble proteins, free amino acids, and ascorbic acid in leaves. Soluble sugar acts as a cell osmotic regulator while ascorbic acid serves as a potent antioxidant, both playing crucial roles in maintaining plant tolerance to environmental stress. Soluble proteins and free amino acids are vital constituents of numerous enzymes involved in diverse metabolic processes. These substances represent important primary metabolites within plants and are frequently employed as representative indicators for evaluating the growth status and nutritional quality of horticultural products. These compounds can serve as osmoregulatory factors to maintain osmotic pressure balance in plants and protect plant cells in stressful environments [42].
In recent years, studies have demonstrated that an adequate supply of selenium can enhance crop yield and increase grain selenium content. This finding is consistent with the results of our study, which revealed that both nanoselenium and organic selenium treatments promoted the growth and development of Suzhouqing. These findings align with previous research conducted by Li et al. [43], Guo et al. [44], Zhang et al. [45], Gao et al. [46], Kong [32] on millet, as well as Song et al. [47] and Peng et al. [48] on wheat cultivation practices.
A transcriptome analysis of drought-stressed cotton revealed that differentially expressed genes were significantly enriched in the osmoregulatory system [49]. Transcriptome sequencing was employed to elucidate the absorption, transport, and metabolism of selenium in Cymbidium japonicum. The investigation identified the relevant pathways and key enzyme genes involved in selenium metabolism while exploring the mechanism underlying selenium enrichment. Hu et al. [50] discovered 16 crucial genes belonging to the ABC transporter family in tea plants, including 4 members from the ABCB subfamily, 4 from the ABCC subfamily, 5 from the ABCG subfamily, as well as 2 members from both ABCA and ABCF subfamilies. It is hypothesized that ABC transporters may participate in selenide transportation within tea plants. Kong [32] examined the physiological and biochemical effects of applying a biological milkshake on yield and found that four out of five differential genes related to ABC transporters were upregulated while one was downregulated. In our study, multiple key genes associated with ABC transporters were primarily identified within the ABCG subfamily; these differential genes exhibited upregulation without any downregulation. This finding contrasts with Kong’s results [32], suggesting potential tissue specificity differences regarding ABC transporter function across different species.
In this study, we observed varying degrees of upregulation in the key genes controlling the expression of cystathionine gamma-lyase and 5-methyltetrahydrofolate-homocysteine methyltransferase. These findings suggest that the leaf enhances selenium absorption by upregulating the expression of relevant genes in response to selenium supply in its environment. Furthermore, our results are consistent with previous studies conducted by Freeman [51] and Hoewyk [52], which also identified consistent patterns in the hub genes involved in cysteine synthase. However, further research is required to investigate how these genes directly participate in the absorption, transport, and metabolism of selenium.

5. Conclusions

The underlying physiological and molecular mechanisms of organic selenium and nanoselenium on Suzhouqing were examined using a transcriptomics approach, and the following conclusions were drawn. Under drought conditions, the beneficial effects of organic selenium and nanoselenium on the weight and quality of ‘Suzhouqing’ were primarily manifested in the following four aspects. Firstly, there was an enhancement in photosynthetic capacity through the upregulation of light-trapping pigment proteins such as Lhca1, Lhca2, Lhca3, Lhca4, Lhcb1, Lhcb2, Lhcb3, Lhcb4, and Lhcb5. Secondly, the effective regulation of reactive oxygen species (ROS) homeostasis was achieved by activating the antioxidant system via the upregulation of glutathione S-transferase. Thirdly, water homeostasis was maintained through the glutathione oxidase activity. Lastly, increased expression levels of ABC transporter, adenylate kinase, and cysteine desulphurase contributed to the elevated total selenium content.
The determination of the application effect of selenium on Suzhouqing under drought stress is not solely influenced by unilateral factors. Therefore, we will use multiomics analysis to further investigate how Suzhouqing responds to drought stress when selenium is applied, ensuring its adaptation to a drought environment while simultaneously enhancing weight.

Author Contributions

Conceptualization, J.W. (Jianfu Wu); Methodology, L.H. (Liu Huang), J.W. (Junda Wu), P.S. and J.Z.; Formal analysis, C.Z.; Investigation, J.C.; Resources, S.L.; Data curation, N.L.; Writing—original draft, Y.W.; Writing—review & editing, C.R. and L.H. (Longsong Hu); Funding acquisition, X.H. All authors have read and agreed to the published version of the manuscript.

Funding

This study was supported by the Natural Science Foundation of Jiangxi Province: 20224BAB215033; Key R&D Project in Jiangxi Province: 20223BBF61016; Jiangxi Province higher education reform research project: JXJG-21-3-29; Natural Science Foundation of China: 42167045; Natural Science Foundation of China: 31960331.

Data Availability Statement

Data are contained within the article.

Conflicts of Interest

The authors declare no conflict of interest.

References

  1. Liu, Z.K.; Sun, H.Y.; Han, J.J.; Yang, X.M.; Chen, H.G.; Chen, D.L.; Jiang, Y.Y. Research progress on conservation of germplasm resources of ‘Suzhouqing’. Vegetables 2015, 1, 80–82. [Google Scholar]
  2. Ullah, A.; Nisar, M.; Ali, H.; Hazrat, A.; Yang, X.Y. Drought tolerance improvement in plants: An endophytic bacterial approach. Appl. Microbiol. Biotechnol. 2019, 103, 7385–7397. [Google Scholar] [CrossRef]
  3. Cohen, I.; Zandalinas, S.I.; Huck, C.; Fritschi, F.B.; Mittler, R. Meta-analysis of drought and heat stress combination impact on crop yield and yield components. Plant Physiol. 2021, 171, 66–76. [Google Scholar] [CrossRef]
  4. Dubey, A.; Saiyam, D.; Kumar, A.; Hashem, A.; Abd-Allah, E.F.; Khan, M.L. Bacterial root endophytes: Characterization of their competence and plant growth promotion in Soybean (Glycine max (L.) Merr.) under drought stress. Int. J. Environ. Res. Public Health 2021, 18, 931. [Google Scholar] [CrossRef]
  5. Zhao, X.Y.; Liu, Y.M.; Qin, J.; Wang, X.Z.; Zhao, H.W. Effects of microelements Se, Mn, and F on SOD activity. Acta Acad. Med. Mil. Tertiae 2014, 2, 171–173. [Google Scholar]
  6. Cartes, P.; Jara, A.A.; Pinilla, L.; Rosas, A.; Mora, L. Selenium improves the antioxidant ability against aluminium-induced oxidative stress in ryegrass roots. Ann. Appl. Biol. 2010, 156, 297–307. [Google Scholar] [CrossRef]
  7. Yao, X.Q.; Chu, J.Z.; He, X.L.; Liu, B.B.; Li, J.M.; Yue, Z.W. Effects of selenium on agronomical characters of winter wheat exposed to enhanced ultraviolet-B. Ecotoxicol. Environ. Saf. 2013, 92, 320–326. [Google Scholar] [CrossRef]
  8. Huang, T.; Bai, Y.N.; Mi, J.; Li, J.X.; He, X.R.; Lu, L.; Zhang, B.; Duan, L.Y.; Yan, Y.M.; Qin, K. Effects of external application of copper and selenium trace elements on quality and storage resistance of Lycium barbarum. Non-Wood For. Res. 2023, 41, 252–262. [Google Scholar]
  9. Kumar, M.; Bijo, A.J.; Baghel, R.S.; Reddy, C.R.K.; Jha, B. Selenium and spermine alleviate cadmium induced toxicity in the red seaweed Gracilaria duraby regulating antioxidants and DNA methylation. Plant Physiol. Biochem. 2012, 51, 129–138. [Google Scholar] [CrossRef]
  10. Fan, S.Y. Study on Physiological Mechanisms for Exogenous Selenium-Mediated Drought and Salt Tolerance in Tomato. Master’s Thesis, Northwest A&F University, Yangling, China, 2022. [Google Scholar]
  11. Nawaz, F.; Ahmad, R.; Ashraf, M.Y.; Waraich, E.A.; Khan, S.Z. Effect of selenium foliar spray on physiological and biochemical processes and chemical constituents of wheat under drought stress. Ecotoxicol. Environ. Saf. 2015, 113, 191–200. [Google Scholar] [CrossRef]
  12. Habibi, G. Effect of drought stress and selenium spraying on photosynthesis and antioxidant activity of spring barley. Acta Agric. Slov. 2013, 101, 31–39. [Google Scholar] [CrossRef]
  13. Hasanuzzaman, M.; Fujita, M. Selenium pretreatment upregulates the antioxidant defense and methylglyoxal detoxification system and confers enhanced tolerance to drought stress in rapeseed seedlings. Biol. Trance Elem. Res. 2011, 143, 1758–1776. [Google Scholar] [CrossRef] [PubMed]
  14. Van Hoewyk, D.; Takahashi, H.; Inoue, E.; Hess, A.; Tamaoki, M.; Pilson-Smits, E.A.H. Transcriptome analyses give insights into selenium stress responses and selenium tolerance mechanisms in Arabidopsis. Physiol. Plant. 2008, 132, 236–253. [Google Scholar] [CrossRef] [PubMed]
  15. Cakir, O.; Candar-Cakir, B.; Zhang, B. Small RNA and degradome sequencing reveals important microRNA function in Astragalus chrysochlorus response to selenium stimuli. Plant Biotechnol. J. 2015, 14, 543–556. [Google Scholar] [CrossRef] [PubMed]
  16. Chang, Y.Y.; Wu, H.; Niu, J.Q. Effects of Water Stress on Physiological Index of Grapevine Leaves. SINO Overeas Grapebine Wine 2005, 2005, 11–14. [Google Scholar]
  17. Wang, X.K.; Huang, J.L. Principles and Techniques of Plant Physiological Biochemical Experiment; Higher Education Press: Beijing, China, 2014; pp. 131–133. [Google Scholar]
  18. Ukeda, H.; Kawana, D.; Maeda, S.; Sawamura, M. Spectrophotometric assay for superoxide dismutase based on the reduction of highly water-soluble tetrazolium salts by xanthine-xanthine oxidase. J. Agric. Chem. Soc. Jpn. 1999, 63, 485–488. [Google Scholar] [CrossRef]
  19. Doerge, D.R.; Divi, R.L.; Churchwell, M.I. Identification of the colored guaiacol oxidation product produced by peroxidases. Anal. Biochem. 1997, 250, 10–17. [Google Scholar] [CrossRef]
  20. Johansson, L.H.; Borg, L.A.H. A spectrophotometric method for determination of catalase activity in small tissue samples. Anal. Biochem. 1988, 174, 331–336. [Google Scholar] [CrossRef]
  21. Spitz, D.R.; Oberley, L.W. An assay for superoxide dismutase activity in mammalian tissue homogenates. Anal. Biochem. 1989, 179, 8–18. [Google Scholar] [CrossRef]
  22. Nishimoto, S.; Koike, S.; Inoue, N.; Suzuki, T.; Ogasawara, Y. Activation of Nrf2 attenuates carbonyl stress induced by methylglyoxal in human neuroblastoma cells: Increase in GSH levels is a critical event for the detoxification mechanism. Biochem. Biophys. Res. Commun. 2017, 483, 874. [Google Scholar] [CrossRef]
  23. Buysse, J.A.N.; Merckx, R. An improved colorimetric method to quantify sugar content of plant tissue. J. Exp. Bot. 1993, 44, 1627–1629. [Google Scholar] [CrossRef]
  24. Campion, E.M.; Loughran, S.T.; Walls, D. Protein quantitation and analysis of purity. Methods Mol. Biol. 2011, 681, 229–258. [Google Scholar] [PubMed]
  25. Chen, Y.Y.; Fu, X.M.; Mei, X.; Zhou, Y.; Cheng, S.H.; Zeng, L.T.; Dong, F.; Yang, Z.Y. Proteolysis of chloroplast proteins is responsible for accumulation of free amino acids in dark-treated tea (Camellia sinensis) leaves. J. Proteom. 2017, 157, 10–17. [Google Scholar] [CrossRef] [PubMed]
  26. Gao, Y.H.; Feng, J.; Wu, J.F.; Wang, K.; Wu, S.; Liu, H.C.; Jiang, M.G. Transcriptome analysis of the growth-promoting effect of volatile organic compounds produced by Microbacterium aurantiacum GX14001 on tobacco (Nicotiana benthamiana). BMC Plant Biol. 2022, 22, 208. [Google Scholar] [CrossRef] [PubMed]
  27. Grabherr, M.G.; Haas, B.J.; Yassour, M.; Levin, J.Z.; Thompson, D.A.; Amit, I.; Adiconis, X.; Fan, L.; Raychowdhury, R.; Zeng, Q.D.; et al. Full-length transcriptome assembly from RNA-Seq data without a reference genome. Nat. Biotechnol. 2011, 29, 644–652. [Google Scholar] [CrossRef] [PubMed]
  28. Davidson, N.M.; Oshlack, A. Corset: Enabling differential gene expression analysis for de novo assembled transcriptomes. Genome Biol. 2014, 15, 410–424. [Google Scholar] [PubMed]
  29. Eom, S.H.; Ahn, M.-A.; Kim, E.; Lee, H.J.; Lee, J.H.; Wi, S.H.; Kim, S.K.; Lim, H.B.; Hyun, T.K. Plant response to cold stress: Cold stress changes antioxidant metabolism in heading type kimchi cabbage (Brassica rapa L. ssp. Pekinensis). Antioxidants 2022, 11, 700. [Google Scholar] [CrossRef]
  30. Hassan, Z.U. Melatonin Induced Selenium Tolerance in Oilseed Rape Cultivars through Physio-Biochemical Metabolism, Anatomical, and Molecular Profiling. Ph.D. Thesis, Zhejiang University, Hangzhou, China, 2019. [Google Scholar]
  31. Zhang, L.L. Study on Genes Related to Flavonoid Biosynthesis in Foxtail Millet Based on WGCNA. Master’s Thesis, Shanxi Agricultural University, Taigu, China, 2021. [Google Scholar]
  32. Kong, Q.H. Effects of Biological Nano Se on Yield and Physiological-Biochemical Characteristics of Foxtail Millet. Master’s Thesis, Shandong Normal University, Jinan, China, 2020. [Google Scholar]
  33. Yao, X.; Chu, J.; Wang, G. Effects of selenium on wheat seedlings under drought stress. Biol. Trace Elem. Res. 2009, 130, 283–290. [Google Scholar] [CrossRef]
  34. Chen, B.; Li, J.W.; Wang, X.D.; Xu, Z.C. Effects of exogenous selenium on growth and physiological characteristics of flue-cured tobacco under drought stress. Plant Physiol. J. 2018, 54, 165–172. [Google Scholar]
  35. Yue, H.F. Effects of Exogenous Selenium on Drought Tolerance of Waxy Maize Seedlings and Its Transcriptomic Analysis. Master’s Thesis, Zhongkai University of Agriculture and Engineering, Zhongkai, China, 2022. [Google Scholar]
  36. Sattar, A.; Cheema, M.A.; Sher, A.; Ijaz, M.; Ali, Q. Physiological and biochemical attributes of bread wheat (Triticum aestivum L.) seedlings are influenced by foliar application of silicon and selenium under water deficit. Acta Physiol. Plant 2019, 41, 146. [Google Scholar] [CrossRef]
  37. Rady, M.M.; Belal, H.E.E.; Gadallah, F.M.; Semida, W.M. Selenium application in two methods promotes drought tolerance in Solanum lycopersicum plant by inducing the antioxidant defense system. Sci. Hortic. 2020, 266, 109290. [Google Scholar] [CrossRef]
  38. Ahmad, Z.; Anjum, S.; Skalicky, M.; Waraich, E.A.; Tariq, R.M.S.; Ayub, M.A.; Hossain, A.; Hassan, M.; Brestic, M.; Islam, M.S.; et al. Selenium alleviates the adverse effect of drought in oilseed crops Camelina (Camelina sativa L.) and Canola (Brassica napus L.). Molecules 2021, 26, 1699. [Google Scholar] [CrossRef]
  39. Sardari, M.; Rezayian, M.; Niknam, V. Comparative study for the effect of selenium and nano-selenium on wheat plants grown under drought Stress. Russ. J. Plant Physiol. 2022, 69, 127. [Google Scholar] [CrossRef]
  40. Zahedi, S.M.; Hosseini, M.S.; Daneshvar Hakimi Meybodi, N.; Peijnenburg, W. Mitigation of the effect of drought on growth and yield of pomegranates by foliar spraying of different sizes of selenium nanoparticles. J. Sci. Food Agric. 2021, 101, 5202–5213. [Google Scholar] [CrossRef] [PubMed]
  41. Moloi, M.J.; Khoza, B.M. The Effect of selenium foliar application on the physiological responses of edamame under different water treatments. Agronomy 2022, 12, 2400. [Google Scholar] [CrossRef]
  42. Li, C.H.; Wan, Y.F.; Shang, X.L.; Fang, S.Z. Integration of transcriptomic and metabolomic analysis unveils the response mechanism of sugar metabolism in Cyclocarya paliurus seedlings subjected to PEG-induced drought stress. Plant Physiol. Biochem. 2023, 1, 107856. [Google Scholar] [CrossRef] [PubMed]
  43. Li, H.; Zhang, X.Y.; Yang, R.D.; Tian, H.X.; Liang, H.Y. Effect of different ways of applying selenium on yields and related traits of broomcorn millet. Mod. Agric. Sci. Technol. 2015, 2, 29+37. [Google Scholar]
  44. Guo, M.M.; Guo, P.Y.; Yuan, X.Y.; Gao, H.; Gao, Z.P.; Feng, L.; Wang, B.Q.; Ning, N.; Yu, K.K.; Dong, S.Q. Effects of foliar application of Na2SeO3 on photosynthetic characteristics and yield of foxtail millet. J. Nucl. Agric. Sci. 2014, 28, 1099–1107. [Google Scholar]
  45. Zhang, P.F.; Zhang, A.J.; Zhang, J.H.; Wang, X.J.; Liu, J.M.; Zhou, D.M. Effects of foliar application of sodium selenite on selenium accumulation and quality in millet. Acta Agric. Boreali-Sin. 2010, 25, 231–234. [Google Scholar]
  46. Gao, Z.P.; Guo, P.Y.; Yuan, X.Y.; Ning, N.; Guo, M.J.; Gao, H.; Wang, B.Q.; Feng, L.; Dong, S.Q.; Wen, Y.Y. Effects of foliar spraying Na2SeO3 during the grain filling stage on quality and seeds selenium content of foxtail millet. J. Shanxi Agric. Univ. Nat. Sci. Ed. 2015, 35, 157–161. [Google Scholar]
  47. Song, J.Y. Effect of selenium fertilization on flag leaf physiological characteristics and grain selenium content and yield after anthesis of wheat. Acta Agric. Boreali-Sin. 2006, 21, 68–71. [Google Scholar]
  48. Peng, T.; Yu, J.L.; Cheng, D.F.; Gao, Y.; Zhao, W.F. Effect of spraying stage and time of selenium rich liquid on wheat yield and grain selenium content. J. Anhui Agri. Sci. 2015, 43, 104–105+108. [Google Scholar]
  49. Bao, Q.J. The Transcriptome Analysis of Cotton under Drought Stress. Master’s Thesis, Xinjiang University, Urumqi, China, 2018. [Google Scholar]
  50. Hu, Y.R. Identification and Analysis of Genes Related to Selenium Assimilation and Metabolism in Tea Plant Roots. Master’s Thesis, Chinese Academy of Agricultural Sciences, Beijing, China, 2016. [Google Scholar]
  51. Freeman, J.L.; Tamaoki, M.; Stushnoff, C.; Quinn, C.F.; Cappa, J.; Devonshire, J.; Fakra, S.C.; Marcus, M.A.; McGrath, P.; Hoewyk, D.V. Molecular mechanisms of selenium tolerance and hyperaccumulation in Stanleya pinnata. Plant Physiol. 2010, 153, 1630–1652. [Google Scholar] [CrossRef] [PubMed]
  52. Hoewyk, D.V.; Pilon, M.; Pilon-Smits, A.H.E. The functions of NifS-like proteins in plant sulfur and selenium metabolism. Plant Sci. 2008, 174, 120–123. [Google Scholar]
Figure 1. Effect of nanoselenium and organic selenium on antioxidant properties of Suzhouqing leaves under drought stress. (a): SOD activity, (b): POD activity, (c): CAT activity, (d): MDA content, (e): GSH content. Note: FW: fresh weight. The average value was obtained by measuring 3 samples each time. Lowercase letters denote a significant difference between treatments (p < 0.05).
Agronomy 14 00078 g001aAgronomy 14 00078 g001b
Figure 2. Volcano map of DEGs (“−1”: downregulated, “0”: unchanged and “1”: upregulated). Note: The horizontal coordinate is log2(fold change), that is, the pair value of the fold change value; the ordinate is -log10(padj), which is the inverse of the logarithm of the corrected p-value.
Agronomy 14 00078 g002
Figure 3. Venn diagrams of DEGs.
Agronomy 14 00078 g003
Figure 4. GO enrichment histogram of differential genes. Note: B: biological process; C: cellular component; M: molecular function; B1: cell plate assembly; B2: cell plate formation involved in plant-type cell wall biogenesis; B3: cellular divalent inorganic cation homeostasis; B4: cellular response to gravity; B5: cellular zinc ion homeostasis; B6: central nervous system neuron development; B7: chlorophyll metabolic process; B8: circadian regulation of calcium ion oscillation; B9: circadian regulation of gene expression; B10: clathrin-dependent endocytosis; B11: defense response to Gram-negative bacterium; B12: ethanolamine-containing compound metabolic process; B13: long-day photoperiodism; B14: negative regulation of GTPase activity; B15: nitric oxide biosynthetic process; B16: nitric oxide metabolic process; B17: NLS-bearing protein import into the nucleus; B18: nucleotide-excision repair, DNA gap filling; B19: photosynthesis, light harvesting; B20: photosynthesis, light harvesting in photosystem I; B21: photosynthetic electron transport chain; B22: photosynthetic electron transport in photosystem II; B23: photosystem I stabilization; B24: photosystem II repair; B25: plastid translation; B26: positive regulation of protein import; B27: positive regulation of protein import into the nucleus; B28: positive regulation of protein localization to nucleus; B29: primary miRNA processing; B30: protein repair; B31: red, far-red light phototransduction; B32: regulation of chlorophyll biosynthetic process; B33: regulation of dephosphorylation; B34: regulation of DNA-templated transcription in response to stress; B35: regulation of photosynthesis, light reaction; B36: regulation of protein dephosphorylation; B37: regulation of protein import; B38: regulation of protein import into the nucleus; B39: regulation of protein localization to nucleus; B40: regulation of tetrapyrrole biosynthetic process; B41: response to low-fluence blue-light stimulus by blue low-fluence system; B42: response to low-light intensity stimulus; B43: response to strigolactone; B44: ribosomal protein import into the nucleus; B45: salicylic acid catabolic process; B46: spindle assembly involved in meiosis; C1: Cajal body; C2: chloroplast thylakoid lumen; C3: chloroplast thylakoid membrane protein complex; C4: light-harvesting complex; C5: nuclear dicing body; C6: photosystem; C7: plastid ribosome; C8: plastid thylakoid lumen; C9: protein phosphatase type 2A complex; C10: proton-transporting V-type ATPase, V0 domain; C11: thylakoid light-harvesting complex; C12: transcriptionally active chromatin; C13: tubulin complex; C14: vacuolar proton-transporting V-type ATPase, V0 domain; M1: acid-thiol ligase activity; M2: alcohol binding; M3: chlorophyll binding; M4: glutaminase activity; M5: isoprenoid binding; M6: MAP-kinase scaffold activity; M7: methionine adenosyltransferase activity; M8: pigment binding; M9: Poly(U) RNA binding; M10: pyrophosphate hydrolysis-driven proton transmembrane transporter activity; M11: signaling adaptor activity; M12: SnoRNA binding; M13: structural constituent of cytoskeleton.
Agronomy 14 00078 g004aAgronomy 14 00078 g004b
Figure 5. Schematic representation of photosynthesis-antenna proteins in the KEGG database.
Agronomy 14 00078 g005
Figure 6. Schematic representation of thiamine metabolism in the KEGG database.
Agronomy 14 00078 g006
Figure 7. Schematic representation of glutathione metabolism in the KEGG database.
Agronomy 14 00078 g007
Figure 8. Schematic representation of selenocompound metabolism in the KEGG database.
Agronomy 14 00078 g008
Figure 9. Heat map of correlation between sample and module.
Agronomy 14 00078 g009
Figure 10. qRT-PCR identification and RNA-seq analysis. Note: (A): LOC103837231, adenylate kinase 2; (B): LOC103858064, glutathione peroxidase 3; (C): LOC103842805, glutathione S-transferase U25; (D): LOC103830524, glutathione S-transferase U20; (E): LOC103844552, thiamine pyrophosphokinase 1; (F): LOC103872309, ABC transporter G family member 35; (G): LOC103867761, ABC transporter G family member 1; (H): LOC103844798, ATP-dependent zinc metalloprotease FTSH 11; (I): LOC103866104, cysteine synthase.
Agronomy 14 00078 g010
Table 1. Physical and chemical properties of soil.
Available
Potassium (g kg−1)
Available Phosphorus Content (mg kg−1)Alkali-Hydrolyzable Nitrogen (mg kg−1)Total Selenium Content
(mg kg−1)
Organic Matter Content (g kg−1)pH
3.44 175.76 536.69 0.34 646.62 5.87
Table 2. Experimental design.
TreatmentTypeVolume (mL)Concentration (mg L−1)
DCKNeutral water200
DN5Nanoselenium205
DN10Nanoselenium2010
DN20Nanoselenium2020
DO5Organic selenium205
DO10Organic selenium2010
DO20Organic selenium2020
Table 3. Effect of nanoselenium and organic selenium on photosynthetic pigment content of Suzhouqing leaves under drought stress.
TreatmentChlorophyll a Content
(mg g−1 Fresh Weight)
Chlorophyll b Content
(mg g−1 Fresh Weight)
Total Chlorophyll Content (mg g−1 Fresh Weight)Chlorophyll a/bCarotenoid Content (μg g−1)
DCK0.87 ± 0.02e0.46 ± 0.02c1.33 ± 0.02d1.89 ± 0.01a181.39 ± 1.01b
DN51.47 ± 0.02a0.67 ± 0.03a2.14 ± 0.02a2.19 ± 0.02d216.71 ± 0.63a
DN101.23 ± 0.02b0.57 ± 0.02b1.80 ± 0.03b2.16 ± 0.02c178.46 ± 0.42c
DN201.06 ± 0.02c0.49 ± 0.02c1.55 ± 0.02c2.16 ± 0.01a136.05 ± 0.27e
DO50.88 ± 0.02e0.47 ± 0.02c1.35 ± 0.03d1.87 ± 0.02b91.13 ± 0.44g
DO101.05 ± 0.02c0.52 ± 0.01b1.57 ± 0.03c2.02 ± 0.01d143.07 ± 0.48d
DO200.93 ± 0.03d0.42 ± 0.02d1.35 ± 0.03d2.21 ± 0.01e109.96 ± 0.70f
Note: The average value was obtained by conducting measurements on 7 blades for each trial. Lowercase letters denote a significant difference between treatments (p < 0.05).
Table 4. Effect of nanoselenium and organic selenium on photosynthetic indexes of Suzhouqing leaves under drought stress.
TreatmentPn (μmol CO2 m−2 s−1)Tr (mmol H2O m−2 s−1)Gs (mmol H2O m−2 s−1)Ci (μmol CO2 mol−1 Air)
DCK9.37 ± 0.02e5.77 ± 0.25b232.03 ± 1.54g528.62 ± 1.10f
DN514.09 ± 0.29b7.93 ± 0.19a370.12 ± 1.01a539.23 ± 0.89e
DN1019.38 ± 0.17a5.65 ± 0.12b293.73 ± 1.93c547.18 ± 0.63d
DN2019.5 ± 0.15a5.63 ± 0.08b241.49 ± 4.01e565.54 ± 0.68b
DO512.47 ± 0.02c7.79 ± 0.08a335.53 ± 1.09b527.15 ± 0.64f
DO1010.67 ± 0.22d5.22 ± 0.25b215.61 ± 1.07f557.36 ± 0.59c
DO207.39 ± 0.13f5.17 ± 0.17b288.37 ± 0.85d573.72 ± 0.62a
Note: The average value was obtained by conducting measurements on 7 blades for each trial. Lowercase letters denote a significant difference between treatments (p < 0.05).
Table 5. Weight and total selenium content of Suzhouqing leaves.
TreatmentDCKDN5DN10DN20DO5DO10DO20
Weight (g fresh weight)48.71 ±
0.44f
62.79 ±
0.25b
67.30 ±
0.49a
56.12 ±
0.43d
57.25 ±
0.35c
50.76 ±
0.24e
56.68 ±
0.28d
Total selenium content
(μg kg−1)
10.21 ±
0.37g
33.22 ±
0.27d
42.37 ±
0.26a
38.242 ±
0.22b
30.19 ±
0.50f
32.27 ±
0.36e
36.56 ±
0.18c
Note: The average value was obtained by conducting measurements on 7 blades for each trial. Lowercase letters denote a significant difference between treatments (p < 0.05).
Table 6. Effect of nanoselenium and organic selenium on nutritional qualities of Suzhouqing leaves under drought stress.
TreatmentSoluble Sugar
(mg g−1 Fresh Weight)
Soluble Protein
(mg g−1 Fresh Weight)
Free Amino Acid
Content
(mg g−1 Fresh Weight)
Total Flavonoid
Content
(mg g−1 Fresh Weight)
DCK11.77 ± 0.19e17.36 ± 0.14c1.73 ± 0.02de0.62 ± 0.04cd
DN520.06 ± 0.24b26.84 ± 0.19a1.86 ± 0.03c1.24 ± 0.07a
DN1012.88 ± 0.10d17.97 ± 0.32c2.09 ± 0.08b0.79 ± 0.04c
DN2020.80 ± 0.17a28.93 ± 0.24a3.44 ± 0.05a0.63 ± 0.02d
DO57.85 ± 0.11g18.94 ± 0.24c1.62 ± 0.05e0.67 ± 0.06cd
DO1010.56 ± 0.54f16.85 ± 0.66c1.83 ± 0.05cd0.69 ± 0.05d
DO2016.87 ± 0.07c24.11 ± 1.98b2.02 ± 0.04b1.06 ± 0.05b
Note: The average value was obtained by conducting measurements on 7 blades for each trial. Lowercase letters denote a significant difference between treatments (p < 0.05).
Table 7. Sequencing data statistics.
TreatmentRaw Base (G)Raw
Sequences
Clean Bases (G)Clean
Sequences
Q20 (%)Q30 (%)GC (%)
DCK6.6744,468,5006.1541,582,304100.099.8546.00 (%)
DO57.2248,160,3446.6544,924,020100.099.8447.00 (%)
DN56.6644,402,0766.1741,736,154100.099.8647.50 (%)
DO106.1140,701,1265.6238,076,306100.099.8547.00 (%)
DN107.0346,882,7386.4844,169,476100.099.8747.00 (%)
DO206.9946,628,8546.5043,870,658100.099.8747.00 (%)
DN206.7945,277,2386.3442,817,196100.099.8747.00 (%)
Table 8. List of DEGs.
GroupAllUpregulatedDownregulated
DN5vsDCK58,85221,35821,530
DN10vsDCK60,71122,39723,018
DN20vsDCK58,56621,51922,818
DO5vsDCK57,07020,65124,828
DO10vsDCK57,47320,05922,953
DO20vsDCK59,52921,32421,444
Table 9. Information of differential expression genes related to photosynthesis-antenna proteins.
SymbolDN5 vs. DCKDN10 vs. DCKDN20 vs. DCKDO5 vs. DCKDO10 vs. DCKDO20 vs. DCK
Lhca1-Up----
Lhca2---UpUp-
Lhca3------
Lhca4-----Up
Lhca5Up-----
Lhcb1-Up---Up
Lhcb2Up-UpUp--
Lhcb3------
Lhcb4Up-----
Lhcb5-----Up
Lhcb6------
Lhcb7----UpUp
Note: -: unchanged; Up: upregulated; Lhca1, Lhca2, Lhca3, Lhca4, Lhca5: light-harvesting complex I chlorophyll a/b binding protein 1, 2, 3, 4, 5; Lhcb1, Lhcb2, Lhcb3, Lhcb4, Lhcb5, Lhcb6, Lhcb7: light-harvesting complex II chlorophyll a/b binding protein 1, 2, 3, 4, 5, 6, 7.
Table 10. Information of differential expression genes related to thiamine metabolism.
SymbolDescriptionDN5 vs. DCKDN10 vs. DCKDN20 vs. DCKDO5 vs. DCKDO10 vs. DCKDO20 vs. DCK
THI5Pyrimidine precursor biosynthesis enzyme------
4.1.99.17Phosphomethylpyrimidine synthase---Up--
2.7.1.49Hydroxymethylpyrimidine--Up---
2.7.4.7Phosphomethylpyrimidine kinase--Up---
2.8.1.7Cysteine desulfuraseUpUp-UpUp-
2.7.7.73Sulfur carrier protein ThiS adenylyltransferase------
2.8.1.4tRNA uracil 4-sulfurtransferase------
4.1.99.192-iminoacetate synthase------
1.4.3.19Glycine oxidase------
2.2.1.71-deoxy-D-xylulose-5-phosphate synthase------
2.8.1.10Thiazole synthase------
5.3.99.10Thiazole tautomerase (transcriptional regulator TenI)------
2.4.2.60Cysteine-dependent adenosine diphosphate thiazole synthaseUp-Up--Up
2.4.2.59Sulfide-dependent adenosine diphosphate thiazole synthase------
2.5.1.3Thiamine-phosphate pyrophosphorylase--Up---
3.6.1.15Nucleoside-triphosphatase------
3.6.1.28Thiamine-triphosphatase------
2.7.1.50Hydroxyethylthiazole kinase--Up---
2.5.1.3Thiamine-phosphate pyrophosphorylase------
2.7.4.16Thiamine-monophosphate kinase------
2.7.4.15Thiamine-diphosphate kinase------
2.7.4.3Adenylate kinaseUp-UpUpUpUp
3.1.3.1Alkaline phosphatase------
3.1.3.2Acid phosphatase------
3.1.3.100Thiamine phosphate phosphatase------
2.7.1.89Thiamine kinase------
2.5.1.2Thiamine pyridinylase------
3.5.99.2Thiaminase (transcriptional activator TenA)------
2.7.6.2Thiamine pyrophosphokinaseUpUpUpUp--
1.1.3.23Thiamine oxidase------
TenA_EFormylaminopyrimidine deformylase-Up--Up-
TH2Thiamine phosphate phosphatase----Up-
Note: -: unchanged; Up: upregulated.
Table 11. Information of differential expression genes related to glutathione metabolism.
SymbolDescriptionDN5 vs. DCKDN10 vs. DCKDN20 vs. DCKDO5 vs. DCKDO10 vs. DCKDO20 vs. DCK
4.3.2.9Gamma-glutamylcyclotransferase------
3.5.2.95-oxoprolinase------
6.3.2.2Glutamate–cysteine ligase catalytic subunitUp-Up-Up-
3.4.11.2Aminopeptidase N------
2.3.2.2Gamma-glutamyltranspeptidase------
4.3.2.7Glutathione-specific gamma-glutamylcyclotransferase------
3.4.19.13Glutathione hydrolase--Up---
1.8.1.7Glutathione reductase (NADPH)------
6.3.2.3Glutathione synthase---Up--
1.8.1.13Bis-gamma-glutamylcystine reductase------
1.1.1.42Isocitrate dehydrogenase------
1.1.1.43Phosphogluconate 2-dehydrogenase------
1.1.1.446-phosphogluconate dehydrogenase------
1.1.1.49Glucose-6-phosphate 1-dehydrogenase------
2.5.1.18Glutathione S-transferaseUp-UpUp-Up
2.3.2.2Gamma-glutamyltranspeptidase------
2.3.1.80N-acetyltransferase 8------
1.8.4.2Protein-disulfide reductase------
1.11.1.12Phospholipid-hydroperoxide glutathione peroxidase------
1.8.3.3Glutathione oxidaseUp-Up-Up-
1.11.1.9Glutathione peroxidase-Up---Up
1.11.1.27Peroxiredoxin 6------
1.8.4.1Glutathione—homocystine transhydrogenase---Up--
1.8.4.4Glutathione—cystine transhydrogenase;--Up---
2.8.1.3Thiosulfate—thiol sulfurtransferase------
1.8.5.1Glutathione dehydrogenase------
1.5.4.1Pyrimidodiazepine synthase------
1.8.4.3Glutathione—CoA-glutathione transhydrogenaseUp---Up-
1.8.4.7Enzyme-thiol transhydrogenase---Up--
3.5.1.78Glutathionylspermidine amidase------
2.5.1.16Spermidine synthase------
1.11.1.11L-ascorbate peroxidase------
4.1.1.17Ornithine decarboxylase------
6.3.1.8Glutathionylspermidine synthase-Up-Up--
6.3.1.9Trypanothione synthetase------
2.5.1.22Spermine synthase------
1.17.4.1Ribonucleoside-diphosphate reductase subunit M1------
PepALeucyl aminopeptidase------
PepBPepB aminopeptidase------
LAP3Cytosol aminopeptidase------
PepDDipeptidase D------
DUG1Cys-Gly metallodipeptidase DUG1------
TrySTrypanothione synthetase------
TryRTrypanothione-disulfide reductase------
TryP Cytosolic tryparedoxin peroxidase, trypanosomatid typical 2-Cys peroxiredoxin------
TDPXGlutathione peroxidase-type tryparedoxin peroxidaseUp----Up
Note: -: unchanged; Up: upregulated.
Table 12. Information of differential expression genes related to selenocompound metabolism.
SymbolDescriptionDN5 vs. DCKDN10 vs. DCKDN20 vs. DCKDO5 vs. DCKDO10 vs. DCKDO20 vs. DCK
2.1.1.12Methionine S-methyltransferase-Up----
6.1.1.10Methionyl-tRNA synthetase---UpUp-
4.4.1.11Methionine-gamma-lyase-----Up
1.8.19Thioredoxin reductase (NADPH)Up-----
MET5-methyltetrahydrofolate–homocysteine methyltransferaseUpUp---Up
CTHCystathionine gamma-lyaseUp-UpUp--
GTKCysteine-S-conjugate beta-lyase------
2.1.1.-S-adenosyl-L-methionine:methaneselenol Se-methyltransferaseUp-----
2.1.1.96Methyltransferase-----Up
CBLCysteine-S-conjugate beta-lyase------
CGSCystathionine gamma-synthase------
2.7.7.43′-phosphoadenosine 5′-phosphosulfate synthase------
4.4.1.16Selenocysteine lyase------
1.97.1.9Selenate/chlorate reductase subunit alpha------
2.9.1.1L-seryl-tRNA(Ser) seleniumtransferase------
2.9.1.2O-phospho-L-seryl-tRNASec:L-selenocysteinyl-tRNA synthase------
2.7.9.3Selenide, water dikinase------
2.7.1.164O-phosphoseryl-tRNA(Sec) kinase------
Note: -: unchanged; Up: upregulated.
Table 13. Gene connectivity results for the six modules.
Gene idGene NameFunctionkTotalkWithinkOutkDiffModule
Cluster-1111.26333LOC103837231Adenylate kinase 2128.91327853.8561575.0571321.201Salmon
Cluster-1111.33663LOC103858064Glutathione peroxidase 3266.4526169.316997.135772.18123Salmon
Cluster-1111.62702LOC103842805Glutathione S-transferase U25788.70573.26215.44357.81Magenta
Cluster-1111.32944LOC103830524Gglutathione S-transferase U20216.4186126.546489.8722336.67415Salmon
Cluster-1111.94080LOC103844552Thiamine pyrophosphokinase 177.4984614.0458763.4525949.4067Darkorange
Cluster-1111.21138LOC103872309ABC transporter G family member 35470.7212281.3282189.39391.93526Darkred
Cluster-1111.51912LOC103867761ABC transporter G family member 1317.63200.26117.3882.88Darkorange
Cluster-1111.47151LOC103844798ATP-dependent zinc metalloprotease FTSH 11741.37564.38176.99387.39Tan
Cluster-1111.43447LOC103866104Cysteine synthase83.4920627.3696256.1224428.7528Brown4
Note: kTotal: total gene connectivity; kWithin: the connectivity of genes within modules; kOut: the connectivity of genes outside the module, kTotal minus kWithin; kDiff: difference between kWithin and kOut.
Disclaimer/Publisher’s Note: The statements, opinions and data contained in all publications are solely those of the individual author(s) and contributor(s) and not of MDPI and/or the editor(s). MDPI and/or the editor(s) disclaim responsibility for any injury to people or property resulting from any ideas, methods, instructions or products referred to in the content.

