Article

Monitoring the Degradation of Semi-Natural Grassland Associations under Different Land-Use Patterns

1
Karcag Research Institute, Hungarian University of Agriculture and Life Sciences, 5300 Karcag, Hungary
2
Gödöllő Campus, Hungarian University of Agriculture and Life Sciences, 2100 Gödöllő, Hungary
*
Author to whom correspondence should be addressed.
Agronomy 2024, 14(1), 35; https://doi.org/10.3390/agronomy14010035
Submission received: 21 November 2023 / Revised: 19 December 2023 / Accepted: 19 December 2023 / Published: 22 December 2023
(This article belongs to the Section Farming Sustainability)

Abstract

:
The topicality of our research topic is justified by the significant change in traditional grassland management in the grassland areas of the Pannonian Basin. Due to several factors, the proportion of fallow grassland, and in parallel of over-exploited pastures, is continuously increasing. In the medium term (11 years), the effects of fallowing (Z), annual mowing (M), mowing and grazing (meadow treatment M + G), and permanent overgrazing (OG) as treatments on the population structure of grassland plants were investigated in a semi-natural grassland community in the Solonyec soil. It was found that the lowest degradation rates in the studied grassland biotope were obtained for the treatment presenting the utilisation pattern of mowing the main grassland phytomass followed by sheep grazing of the coltgrass. The highest degradation levels, which threatened the condition of the grassland community, were measured for the treatment presenting overgrazing with sheep at the end of the experimental period.

1. Introduction

Grasslands are a major driver of biodiversity [1] and are among the most species-rich ecosystems on the planet [2]. However, semi-natural grasslands are threatened by loss of plant diversity in many parts of the world [3]. Despite this, the conservation status of grasslands around the world differs [4]. Several research teams have highlighted [5,6] that degradation of grasslands can lead to botanical and economic problems for many biotopes. Due to the accelerating trend of grassland degradation, up to 49% of the grasslands used by humanity are degraded to some extent [7,8]. The onset of grassland degradation is a shortcut to degradation of grassland quality, productivity, economic potential, service function, biodiversity, or complexity [9,10]. Human activities, such as overgrazing and urban development, have significant impacts on regional ecosystem services [11]. Degradation of grasslands is mainly reflected in a recession of grassland ecological attributes (e.g., grassland biodiversity, productivity, soil organic matter) and other ecosystem services (e.g., forage yield, forage quality) [12]. Furthermore, the degradation of grasslands can also cause environmental problems, such as soil erosion, salinisation, desertification, and spontaneous fires [13,14].
The combined effect of potential factors, such as overgrazing [15,16], inappropriate management practices such as no mowing [17,18,19], climate change [20,21], eutrophication, conversion of land to forest and monoculture, and land abandonment [22,23], are causing a myriad of problems. Overgrazing is causing problems for both mountain ecosystems and human livelihoods around the world, as grazing patterns are changing rapidly [24]. In some regions, such as the European mountain ranges, overgrazing is disappearing, while in contrast, overgrazing has become common in Australia, Africa [25], Asia [26,27], South America [28], and parts of Europe [29,30]. Grazing animals influence the species composition of grassland plant communities through nutrient inputs [31], trampling, and grazing [32,33]. Excessive trampling causes uncovered patches, reducing biomass [34,35]. Extensive bare patches develop in frequently visited areas favoured by the animals, such as resting areas and around watering holes [36]. In addition, long-term trampling by livestock leads to a decrease in soil nutrients and organic matter and even an increase in sand content, resulting in increased soil erosion, which plays a major role in the degradation of grasslands [6]. Overgrazing reduces its porosity by high trampling, reduces the efficiency of infiltration of precipitation, and thus moisture loss occurs [37]. Furthermore, over-stressing also reduces the animal-holding capacity of the grassland [38].
It is not only overgrazing that is a problem but also underutilisation. In the absence of proper management, valuable grassland species disappear from the area, and, at the same time, the advance of competitor species threatens the survival of the natural grassland [39]. Without utilisation, meadows will start to become rewetted and disturbed (dry phytomass accumulates). According to Perevolotsky and Seligman [40], underutilisation leads to a ‘green desert’ condition, where the area becomes impenetrable scrub, species richness decreases, and the risk of scrub fires in Mediterranean and arid areas increases due to water scarcity. Bakker and Berendse [41] also found that the loss of traditional grassland management leads to a significant increase in the amount of flammable grasses in underutilised areas. In arid areas, woody stem plants begin to take over [42]. With shrub encroachment, the species economy of grasslands decreases, as found by Erdős et al. [43,44,45]. According to Szentes et al. [46], shrub encroachment in grasslands reduces plant cover, leading to excessive soil warming and promoting degradation processes. Degraded grasslands increase the proportion of plant species that harm animals [47]. The loss of plant diversity [48] also leads to the impoverishment of fauna [49,50]. Degraded areas can be invaded by invasive species, causing the natural state to fall apart [51].
In Hungary, the gradual decline of grazing livestock, especially sheep—the Central Statistical Office recorded only 922,000 sheep in the first half of 2023 (compared to 3 million sheep at the time of the regime change)—and the spread of pasture-based technology due to labour shortages [52], led to the emergence of extreme grassland management. According to Fernandez-Gimenez and Le Febre [53], the main driver of grassland degradation is the change in the grazing system due to the privatisation of grasslands. In fact, the pasture-centred grazing system can often lead to overgrazing, while the phytomass of the more distant pastures remains unused (zero utilisation). Tasi et al. [54] concluded from the Corine 50 surface cover data that about 20% of the grasslands in Hungary are underutilised, and the situation is more severe in the northern Hungarian region, where the proportion of underutilised grasslands was 47.1% in 2005. However, if grazing is not available, the main grassland crop can be harvested by mowing (mowing use), while if grazing animals are present, the second growth is also exploited (meadow use—mowing of main vegetation and grazing of young growth).
The main scientific aim of our study is to provide more precise data on the effects of different extensive grassland management practices on the population structure of the studied semi-natural plant communities in the medium term (11 years).

2. Materials and Methods

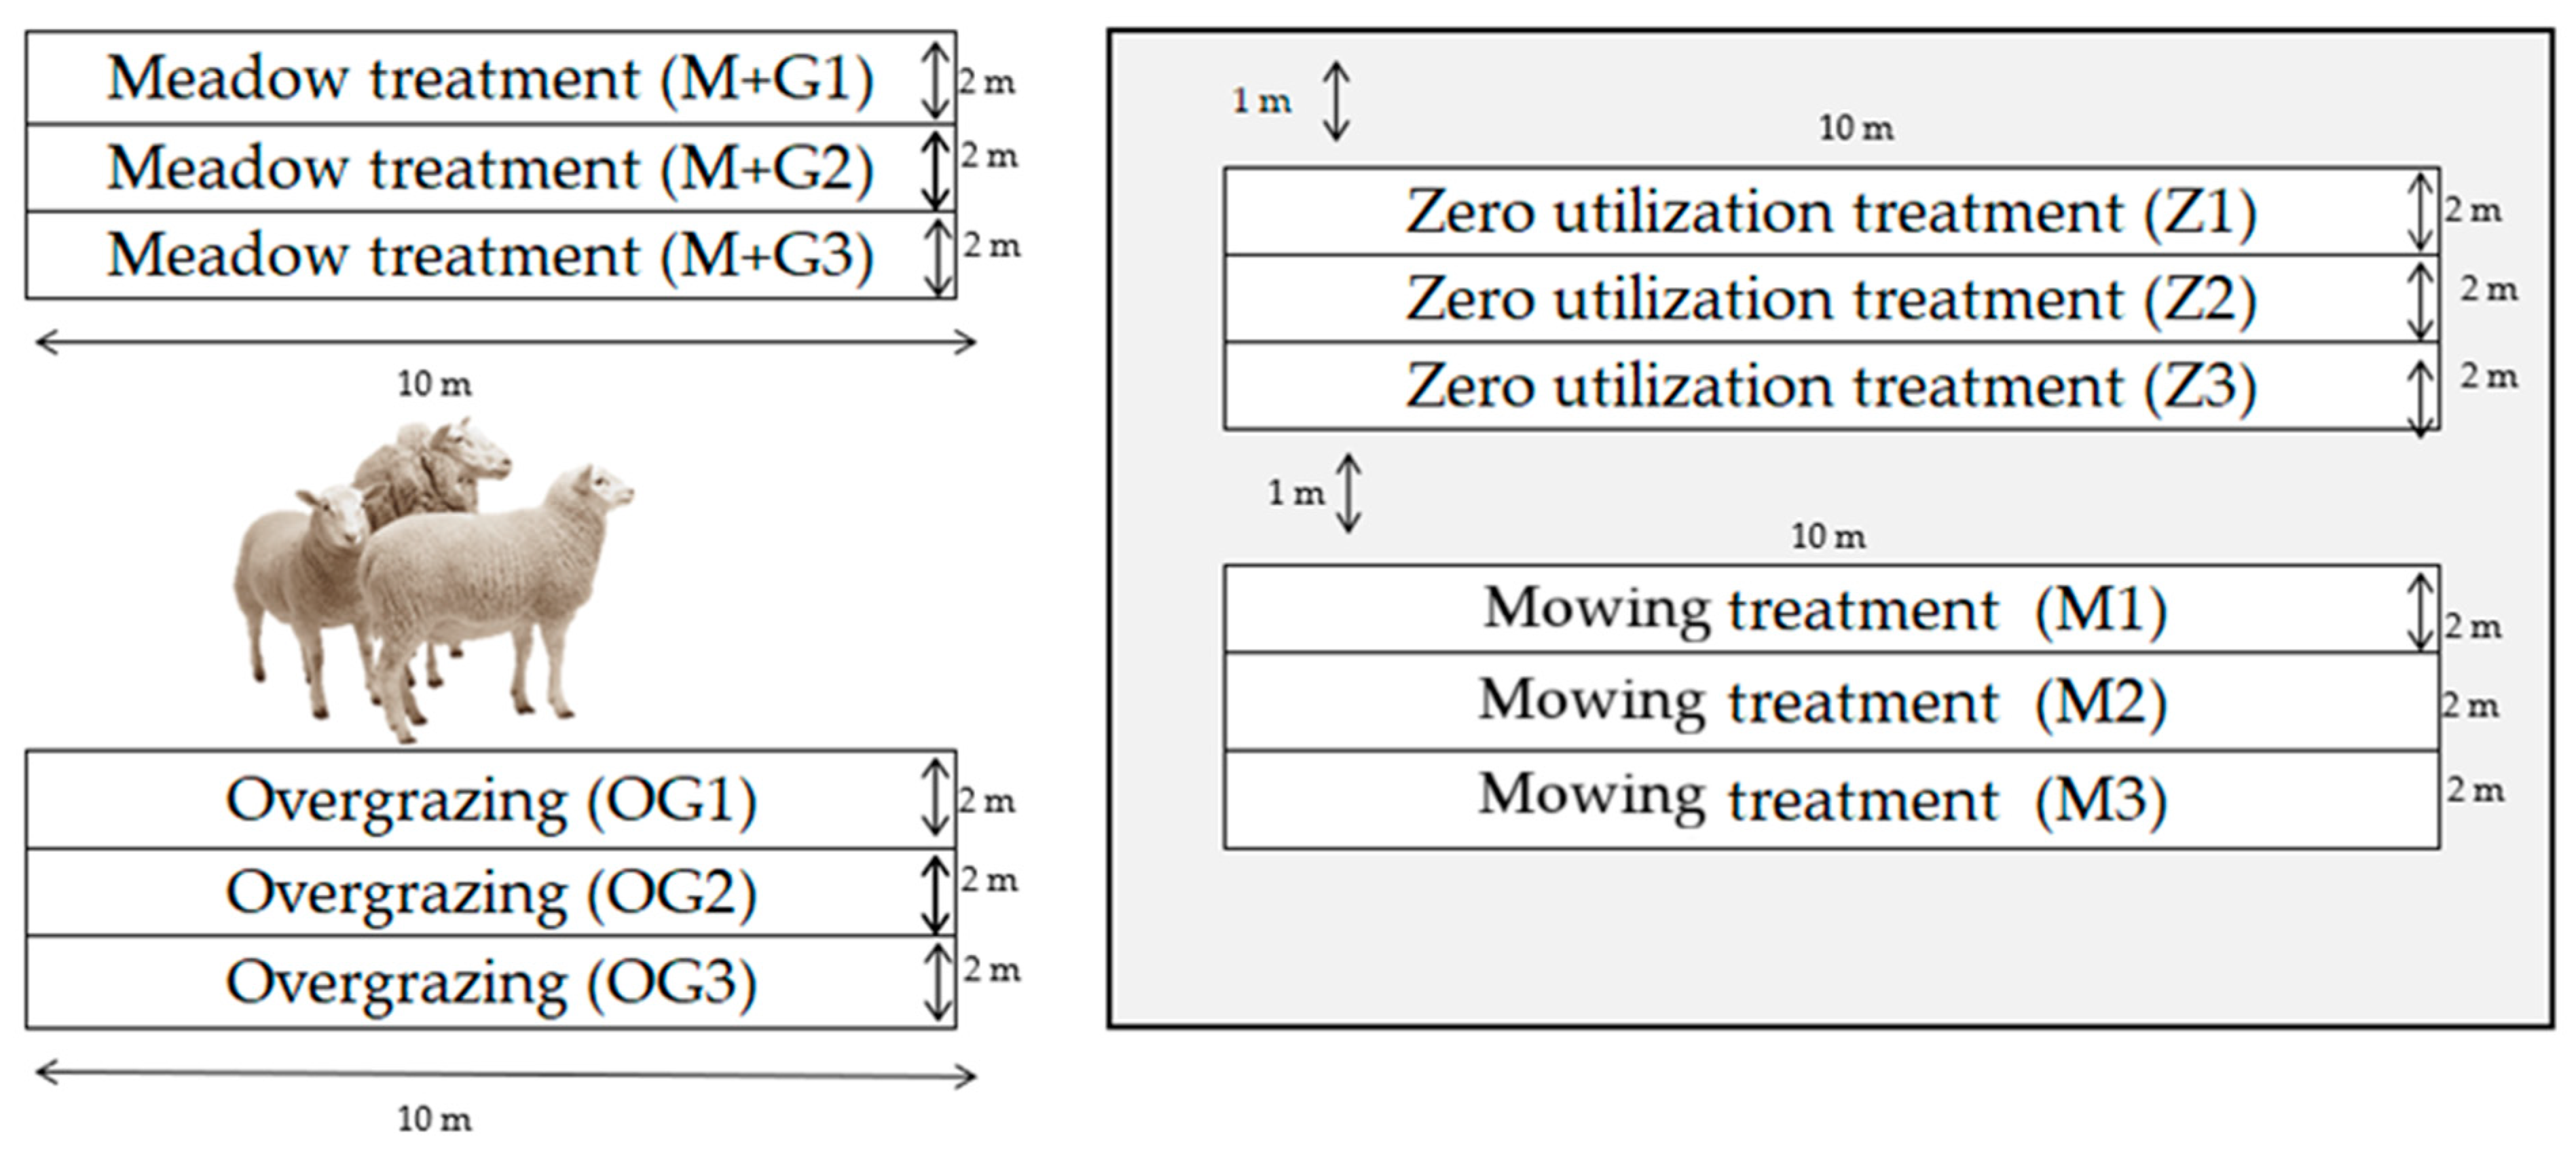
2.1. Description of the Experimental Site

Our experiment was set up in 2009 on the grassland of the Hungarian University of Agricultural and Life Sciences, Research Institute of Karcag (parcel number 01712/1, coordinate 47°17′27.8″ N 20°55′12.0″ E), a site with arid climatic conditions, which is well representative of the arid soil of the Central Tisza region.
The altitude of the experiment is 83 m a.s.l. The soil type of the experiment area is medium meadow Solonyec soil. The results of the general soil sample taken at a depth of 0–10 cm at the time of setting up the experiment are as follows: pH: 5.1; soil plasticity of Arany: 53; humus: 3.8 m/m%; nitrogen (NO2 + NO3 − N) content: 3 mg/kg; phosphorus pentaoxide content: 46 mg/kg; potassium oxide content: 253 mg/kg.
The experimental area under study belongs to the Pannonian flora region, the flora of the Tiszántúli region of the flora of the Great Plain [55]. The grassland experiment is classified as a transitional grassland association between Agrostio stoloniferae-Alopecuretum pratensis (Soó 1933 corr. Borhidi 2003) and Achilleo setaceae-Festucetum pseudovinae (Soó (1933) 1947 corr. Borhidi 1996). The study site is included in the Natura 2000 network [56].
In the choice of treatments on which our experiment was based, we closely followed the grassland management practices commonly used by farmers in the landscape. A uniform baseline condition was considered very important.
The experiment was set up with the same soil conditions, and micro-climatic conditions, where the area had the same vegetation structure at the beginning of the experiment. The remaining part of the area is mown once a year and then grazed with sheep flocks of 500 head in a so-called “underfoot grazing” system, which has been practised since 2009 (meadow management—mowing and grazing, M + G). Of the Institute’s flocks, 124 hectares are under grassland management, so the stocking rate is 4 sheep/ha. Naturally, because of the pastoral grazing system, where the flock grazes in a spreading pattern, the grassland is shaved. The plots of the meadow management are separated from the other treatments only by a fence. Between 1987 and 2009, prior to the setting of the experiment, the area was used as a mowing field (once a year mowing, M), during which period no inputs (e.g., topdressing, fertilisation, irrigation, etc.) were applied to the grassland. There are no data on the use of the area before 1987, as it was owned by a local cooperative. The results reported cover the period 2017–2020. The area, which is heavily overgrazed with a stocking density of 25 sheep/ha, was completed with a fixed pasture in 2014, so overgrazing had been taking place for 3 years before our pilot data collection. This high stocking density is “unfortunately” representative of the extreme use of grazing pastures directly adjacent to the livestock building, due to labour constraints.
The experiment was set up with 4 treatments in 3 replicates, with a net plot size of 20 m2 (10 m × 2 m) (Figure 1):
-
Zero-utilisation treatment: the plot is not utilised (denoted Z);
-
Mowing treatment: removal of phytomass by mowing in the 3rd decade of May (designation: M);
-
Meadow treatment (mowing and grazing): removal of phytomass by mowing in the 3rd decade of May, followed by sheep grazing (4 sheep/ha) in August (designation: M + G).
-
Overgrazing management treatment: grazing 25 sheep/ha continuously (designation: OG). The whole flock passed through the overgrazed plots and grazed them. The flock consists of female sheep of mixed age (1–4 years), weight (50–90 kg), and breed (Magyar Merino, Blanc du Massif Central, Berrichon du Cher).
There is no buffer zone between repetitions of treatments, only between treatments.

2.2. Meteorological Data

Temperature and precipitation data from the Karcag Research Institute Meteorological Station were used in our study (Table 1). The year 2019 was the year with the least precipitation and the average temperature was warmer than the other years of the experiment. We found that 2020 was the year with the highest precipitation (648.50 mm). It was also the year with the highest precipitation month in the experiment (May: 139.30 mm).

2.3. The Methods Used in the Study

The botanical recording of the plant population was carried out using the Balázs quadrat method [57], where the extent of the grassland area covered by a given plant species is indicated by the Balázs dominance value (DB). DB was not given for the traditional 2 m × 2 m quadrat size but for the whole plot. The plot was divided into 32 units and the number of 32nds of the area covered by a given plant species was determined when the plants were recorded. Species with a very low cover value were marked with a + sign (DB = 0.5), corresponding to 1.5625% cover. The maximum sum of the Balázs dominance values is 32 (DBmax = 32; 100%). The following Formula (1) was used to calculate the cover values:
Cover % = DB × 100 DBmax
The plants were named according to Király et al. [58]. After the botanical recording, each plant species was classified according to its ecological status into Borhidi’s Social Behaviour Types (SBT) categories [59]:
-
Specialists (S): character species indicating variation in production area. Their absence indicates site disturbance; their reappearance indicates site rehabilitation.
-
Competitors (C): Dominant species of natural plant communities indicating community stability.
-
Generalists (G): Species of natural communities with a wide ecological tolerance, which play an important role in community stability and maintenance of diversity.
-
Natural pioneers (NP): They play an important role in the regeneration or rehabilitation of the community.
-
Disturbance-tolerant plant species (DT): Pioneer elements of incipient secondary succession.
-
Natural weed species (W): Plants of an area with a persistent anthropogenic influence.
-
Invasive alien species (I): Alien flora elements indicating that the site is/was used for persistent economic purposes.
-
Invasive species (A): Alien plants of the landscape and flora that have been introduced into the flora as a result of anthropogenic activity.
-
Ruderal competitors (RC): Type-forming or dominant weed species of the natural flora that are able to change the direction of succession.
-
Aggressive, alien invasive species (AC): Landscape and alien flora plants that have the potential to alter the progressive direction of succession, while creating an alien flora and threatening the survival and rehabilitation of communities.
In this experiment, the degree of degradation (Degree of Degradation—Dʄ) was determined by the ratio of species cover indicative of degradation to species cover indicative of naturalness based on Borhidi’s SBT categories, without taking into account the extent of uncovered areas. Species indicative of naturalness belong to the group of specialists (S), competitors (C), generalists (G), and natural pioneers (NP), while species indicative of degradation belong to the group of disturbance tolerant plants (DT), natural weed species (W), established alien species (I), alien species (A), ruderal competitors (RC) and aggressive landscape invasive species (AC). The degree of degradation was calculated using the following Formula (2):
D ʄ = Σ DT   +   Σ W   +   Σ I   +   Σ A   +   Σ RC   +   Σ AC Σ S   +   Σ C   +   Σ G   +   Σ NP

2.4. Statistical Evaluation of the Experiment

The data collected in the experiments were recorded and the results were processed using Microsoft® Office Excel (version: LTSC Professional Plus 2021).
One-way analysis of variance (ANOVA) was used for statistical analysis of the data. Analysis of variance is used to determine whether there is a significant difference between the means of two groups. It is important to note, however, that this statistical analysis does not show where the difference between the means of the two groups lies. For the statistical evaluation, the elements of the analysis of variance (“SS” is the sum of squares of the variance of the factors, “DF” is the degree of freedom, “MS” is the mean of the squares, “F” is the calculated F-value, “p-value” is the probability associated with the calculated F-value, “F crit” is the critical F-value) were used at 5% significance level with the p-value.
After conducting the analysis of variance, we performed a Fisher’s Least Significant Difference (LSD) post hoc test (3), also at 5% significance level, to see if two means were statistically different from each other using the following formula (“t” is the distribution of the two-tailed Student’s t-test, “MSw” is the mean sum of squares between groups, “N” is the sample size). If the difference in the mean between groups is greater than the calculated LSD test value, it is considered significant.
LSD = t × MSw × ( 1 N + 1 N )

3. Results

3.1. Results of the Botanical Survey

To summarise our main findings: the results of the botanical surveys showed that Rosa canina appeared in the zero-utilisation area (Z). In the meadow-use area (M + G), a change in the control plant occurred in 2018. Instead of meadow brushgrass (Alopecurus pratensis L.), there was a predominance of lean fescue (Festuca pseudovina Hack. ex Wiesb.) cover. Alopecurus pratensis was able to maintain its dominance under the influence of underutilisation. Basically, it should be taken into account when judging our results that only the main crop was exploited in the mowed treatment areas, whereas the fenced grassland, which is the site of the meadow grassland treatment and protects the other treatments, is exploited twice a year, with the main crop being mowed in May and the field being grazed with cattle in August. It is likely that the grazing to low stubble height and the trampling and dung effect will increase the proportion of undergrowth cover, particularly of lean fescue (Festuca pseudovina). The overgrazed area (OG) was dominated by mouse grass (Hordeum murinum L.). Furthermore, it cannot be overlooked that the meadow-utilised area was the most diverse, while the zero-utilised area had the fewest number of plant species. When recording plant species, we recorded the uncovered areas. In the case of the grassland botanical survey, we recorded an increase in uncovered areas during the study period.

3.2. Evaluation of the SBT Classification of Plants

The species of the grassland association were classified according to their ecological value into Borhidi’s Social Behaviour Types—specialists, natural competitors, generalists, natural pioneers, disturbance tolerant plants, natural weed species, established alien species, and ruderal competitors. The average cover values of the different treatments can be found in Table 2.
In classifying the grassland components into Borhidi’s SBT categories, we found that for each of the grassland management treatments, the cover fraction of natural competitors (C) and stress-tolerant species (generalists −G) is dominant, indicating the stability and value of the natural grassland association. In addition, disturbance-tolerant (DT) and natural weed species (W) are also important in the overgrazed area.
The rare unicolored species (Sr) was recorded only in the meadow management (M + G) (Plantago schwarzenbergiana Schur), whose value has remained constant from year to year (DB value = 1.5625%).
Specialist species (S) were recorded in the mowing management (M) (Trifolium resutum L.) in 2018 (6.25%) but were also excluded from the area the following year, and 1.5625% in the meadow management. The cover value of the specialist species (Trifolium angulatum Waldst. and Kit.) in the overgrazed area decreased by 33.33%. In 2019–2020, the cover value did not change compared to previous years.
The cover of natural competitor species (C) in the mowing treatment (M) increased by 35.94% between 2017 and 2018, decreased by 50.36% between 2018 and 2019, and increased again by 11.43% between 2019 and 2020. In the zero-use treatment (Z), the natural competitor cover decreased by 31.67% between 2017 and 2018, and increased by 15.57% between 2018 and 2020. In the meadow-use treatment (M + G), the natural competitor cover decreased by 29.99% between 2017 and 2018, increased by 17.67% between 2018 and 2019, and decreased again by 2.70% between 2019 and 2020. The cover values of natural competitors in the overgrazed area (OG) decreased by 52.34% between 2017 and 2019, and the cover value in the overgrazed area did not change between 2019 and 2020 compared to previous years.
The cover of generalist species (G) in the mowing treatment (M) decreased by 50.00% between 2017 and 2018, increased by 83.28% between 2018 and 2019, and then decreased again by 3.03% between 2019 and 2020. In the zero-utilisation treatment (Z), generalist species cover increased by 85.71% between 2017 and 2018, then decreased by 53.24% between 2018 and 2020. In the meadow-use treatment (M + G), generalist species cover decreased by 9.52% between 2017 and 2018, increased by 31.58% between 2018 and 2019, and decreased by 8.00% between 2019 and 2020. The cover of generalist species in the overgrazed area (OG) decreased by 90.00% between 2017 and 2019, and their cover did not change between 2019 and 2020.
The natural pioneer species (NP) was recorded only in the meadow management (M + G) during the botanical survey (Ghypsophila muralis L.), with a cover value ranging from 1.56 to 3.12, but disappeared from the area in 2019 and from the still overgrazed area (OG) in 2018. The disappearance of this species indicates the degradation of both sites.
The cover of disturbance-tolerant plants (DT) in the mowing treatment (M) increased by 133.33% between 2017 and 2019 and decreased by 58.33% between 2019 and 2020. In the zero-use treatment (Z), the cover of disturbance-tolerant species decreased by 11.77% between 2017 and 2018 and increased by 36.67% between 2018 and 2019, with no change between 2019 and 2020. In the meadow-use treatment (M + G), the disturbance-tolerant species cover increased by 54.33% between 2017 and 2020. The cover of disturbance-tolerant plants in overgrazed areas (OG) increased by 36.89% between 2017 and 2020.
The cover of natural weed species (W) in the mowing treatment (M) was recorded in 2019, with a decrease in cover of 11.11% by 2020. In the zero-use treatment (Z), the cover of natural weed species remained unchanged between 2017 and 2018, increased by 50.00% between 2018 and 2019, and again remained unchanged between 2019 and 2020. In the meadow-use treatment (M + G), natural weed species cover increased by 12.50% from 2017 to 2018, decreased by 33.33% from 2018 to 2019, and remained unchanged from 2019 to 2020. The natural weed species cover in the overgrazed area (OG) increased by 57.24% between 2017 and 2020.
The ruderal competitor (RC) cover in the mowing treatment (M) decreased by 60% between 2017 and 2019 and had a 7.69% increase between 2019 and 2020. In the zero-use treatment (Z), ruderal competitor coverage increased by 100% between 2017 and 2018, by 50.00% between 2018 and 2019, and by 83.33% between 2019 and 2020. In the meadow-use treatment (M + G), ruderal competitor coverage increased by 62.86% between 2017 and 2020. However, the ruderal competitor cover, in overgrazed areas (OG), decreased by 50.00% between 2017 and 2018, increased by 6.67% between 2018 and 2019, and remained unchanged between 2019 and 2020.
Statistical analysis showed no statistically significant difference in the cover of rare unique species (Sr), special species (S), natural pioneer species (NP), disturbance-tolerant plants (DT), and ruderal competitors (RC). Tracking the change in the natural competitor (C) cover, we found that analysis of variance showed a difference in the mowing treatment (M p-value: 0.004) and the overgrazing treatment (OG p-value: 0.031). For the mowing treatment (M), we showed a difference between 2017 and 2018 and between 2018 and 2019 in the least significant difference test, while in the overgrazing treatment (OG), we found a significant difference only between 2017 and 2018 in the Fisher post hoc test LSD0.05. We showed that the change in the cover of generalist species (G) in the mowing treatment showed a significant difference in the analysis of variance (p-value: 0.013). Also, we found significant differences between 2017 and 2018 and 2018 and 2019 in the least significant difference test. We found a positive difference in the overgrazing treatment (OG) between 2019 and 2020 in the LSD test, as the analysis of variance showed a significant difference (p-value: 0.017) when analysing the change in the cover (W) of natural weed species.

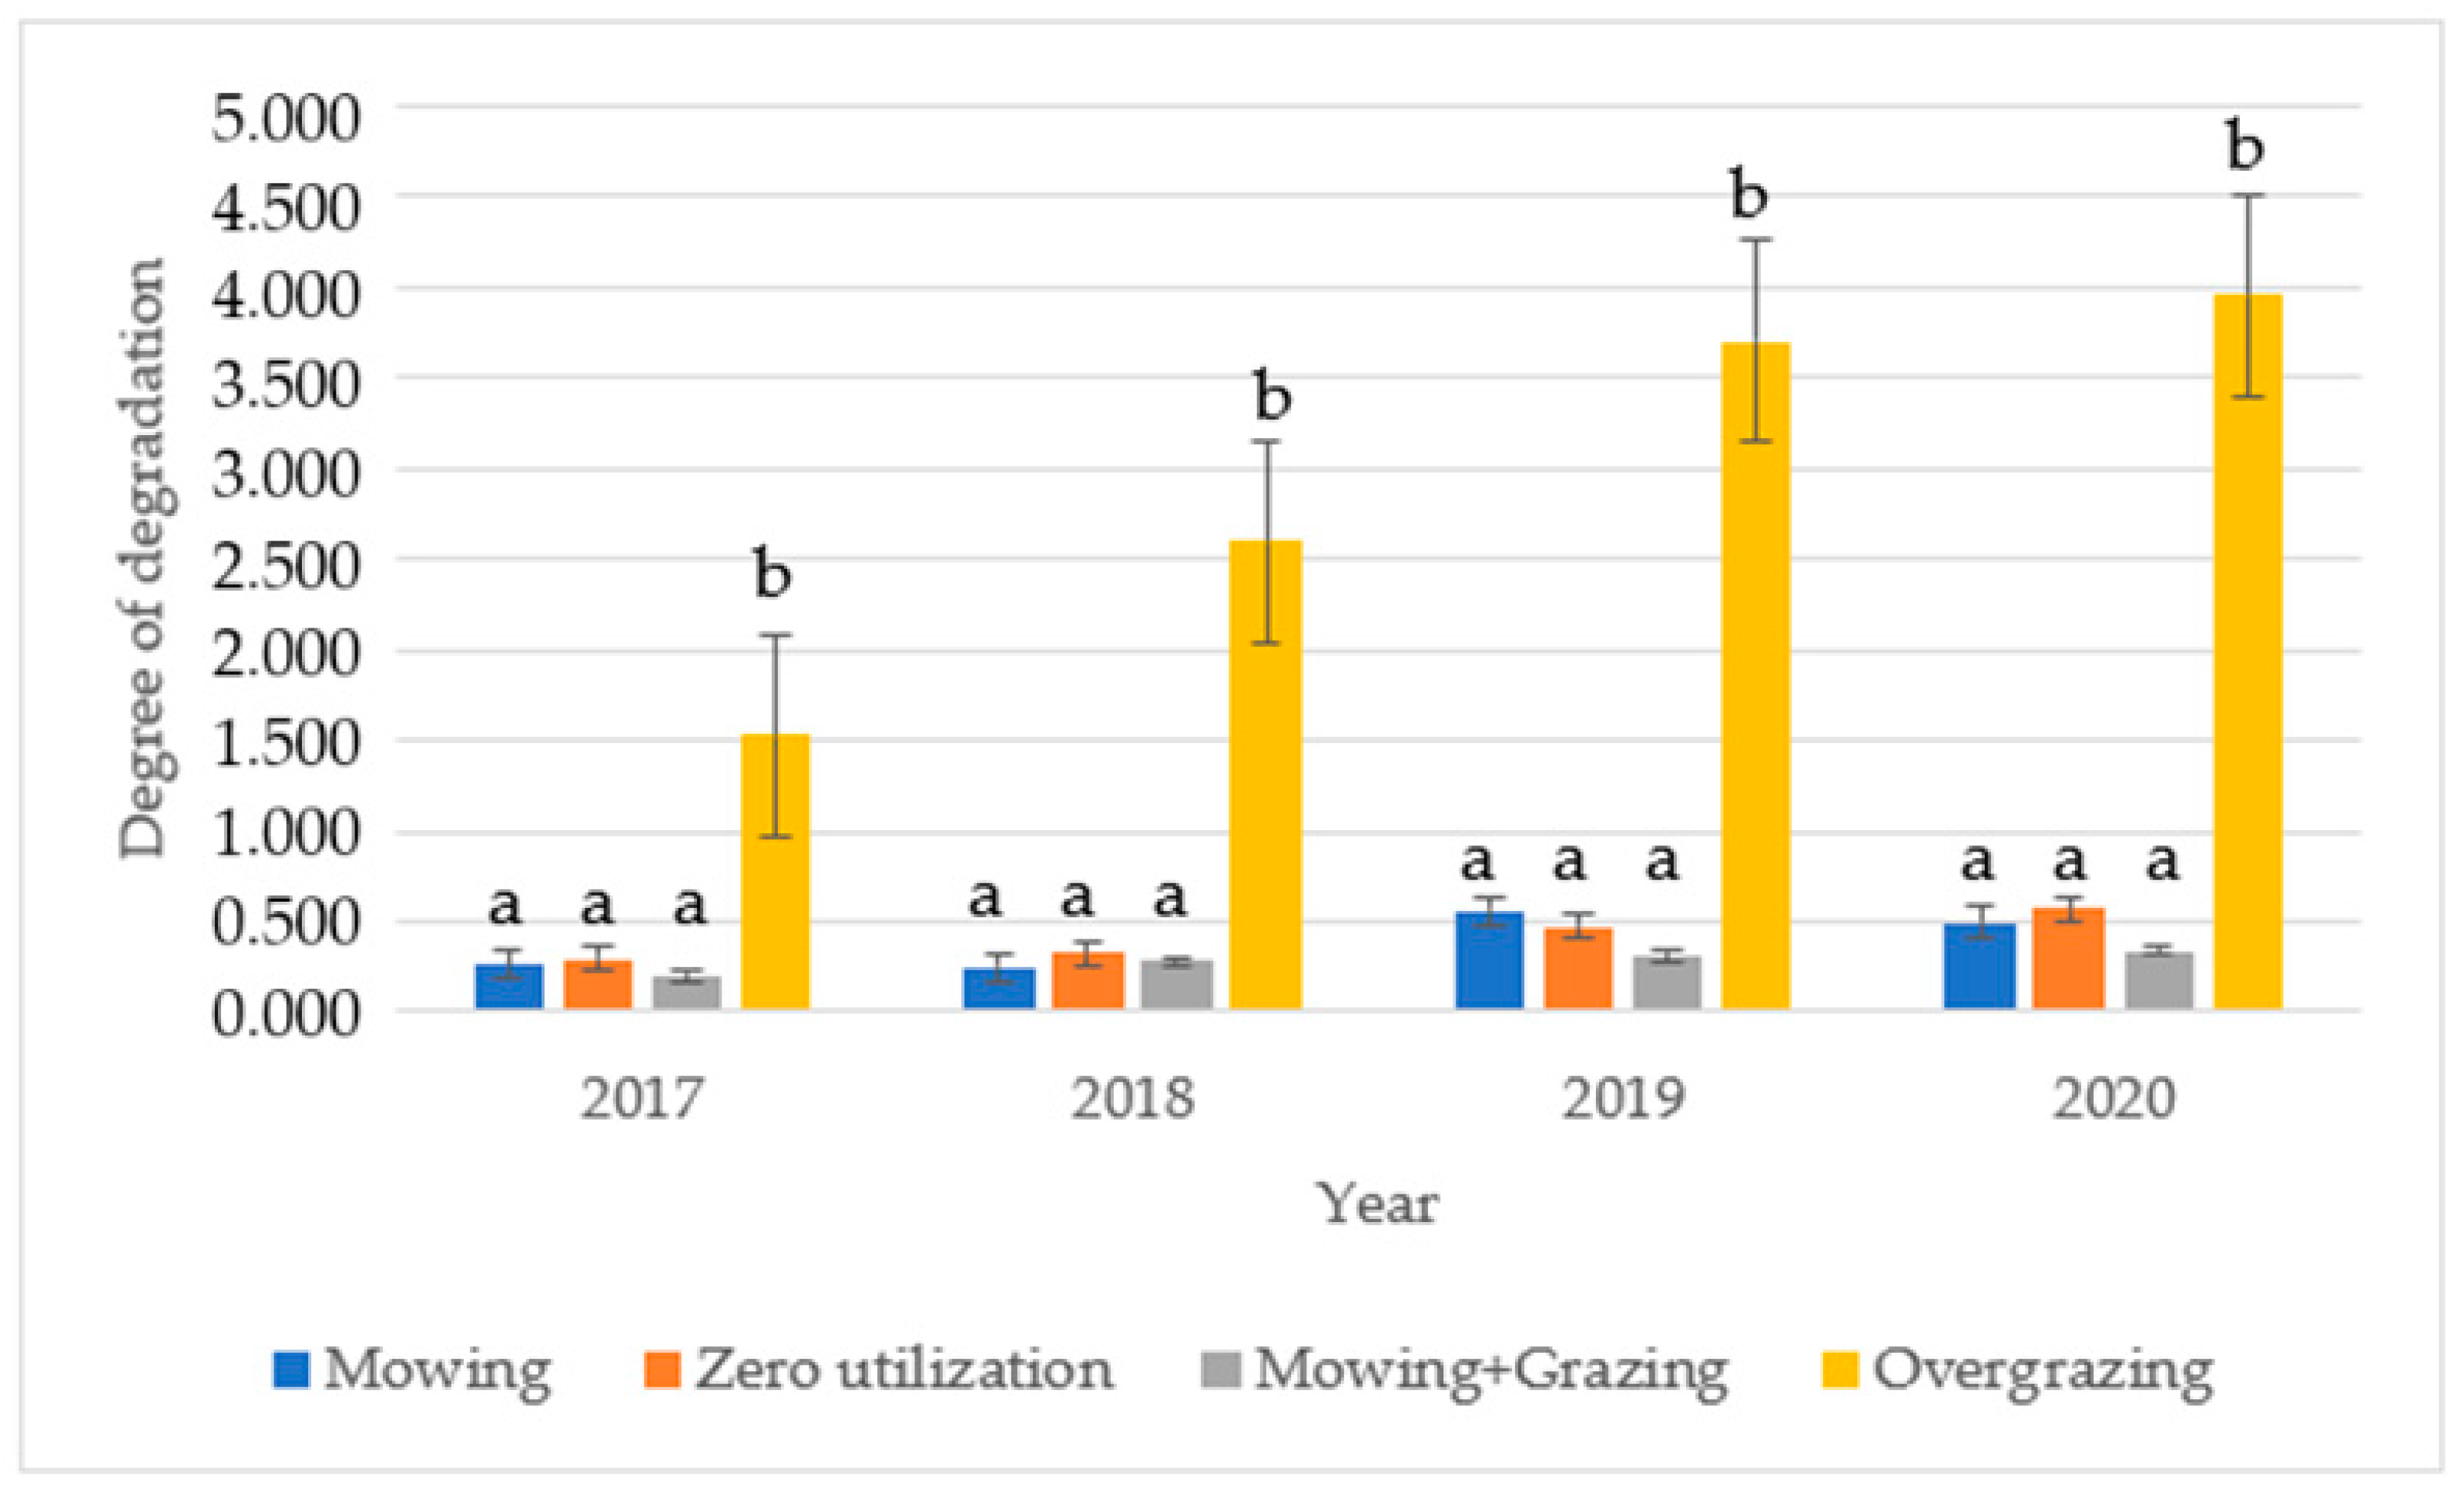
3.3. Results of the Degradation Degree Calculation

The degree of degradation was calculated based on the cover of plants classified by SBT. Figure 2 shows the average number of treatments. For the meadow-use treatment (M + G), the degradation rate varied between 0.123 and 0.463. The degradation rate in the treatment increased by 67.92% on average between 2017 and 2020. In the mowing treatment (M), the degradation rate varied between 0.032 and 0.875, with a small increase in degradation. The degradation rate in the treatment increased by 91.07% between 2017 and 2020. In the zero (Z) recovery treatment, the degradation rate varied between 0.071 and 0.771, with a continuous increase. On average, the degradation rate in the treatment increased by 94.82% between 2017 and 2020. For all treatments, degradation remained below 1 over the period. No difference was observed in the analysis of variance for any of the treatments. For the overgrazing treatment (OG), the degradation rate increased steadily during the study years, reaching 5.00 Dʄ in 2020. In these plots, the degradation rate increased by an average of 157.84% between 2017 and 2020, with degradation values ranging from 0.94 to 2.10 in 2017, 1.55 to 3.83 in 2018, 3.00 to 4.80 in 2019, and 3.43 to 5.00 in 2020.
The analysis of variance showed a significant result (p-value: 0.004) over the period studied. No significant difference was found between years using Fisher’s LSD post hoc test. The average degradation values of the treatments are presented in Figure 1, which shows that the lowest degradation and the lowest increase are found in the meadow-use treatment (M + G), while the highest degradation is observed in the overgrazed (OG) area.
After comparing the years, we also analysed the difference between treatments by year and found that no difference was found in any of the years comparing the mowing (M), zero-use (Z), and meadow-use (M + G) treatments, but, comparing these treatments with the overgrazed area (OG), our experiment showed a significant difference in all study years by analysis of variance.

4. Discussion

It is predicted that the Pannonian grasslands will be characterised by extensive utilisation in the longer term [60,61]. The issue of unutilised grasslands has become a persistent problem in Hungarian grassland management due to the decline in grazing ruminant populations [62,63,64,65,66,67,68,69]. Paradoxically, overgrazing is also a problem in Pannonian grasslands, as it is in many parts of the planet [6,30,31,32,33,34,35,36,37,38,39,40,41,42,43,44,45,46,47,48,49,50,51,52,53,54,55,56,57,58,59,60,61,62,63,64,65,66,67,68,69,70].
The area of our experiment was, until recent years, one of the largest lowland grazing livestock units in the European Union. A fundamental change towards extensification has taken place, accompanied by a lack of a quality workforce. The study is therefore new in that it examines the spread of negative trends in grassland management, such as the spread of fallow grassland, which, to our knowledge, is still being carried out only in the region with the large grassland areas under study, with a farmer’s approach and concrete experiments.
For these reasons, the main scientific aim of our study is to provide more precise data on the effects of different extensive grassland management practices on the population structure of the studied semi-natural grassland communities in the medium term (11 years).
In the studied grassland association stand structure, the dominant grassland species have dominant cover values even in the 11th year of fallowing. However, due to the effect of the grassland cover over the years, the cover values of the grassland grass species changed, and the thick dead fallen leaves could be almost only outgrown by the annual grasses, in agreement with the report of Nagy [71].
Our botanical recordings show that the higher number of species in the overgrazed area, even if some of them are weeds, confirms the findings of Dufour et al. [72] and Vickery et al. [73] that grazed grasslands have a higher biodiversity value than mowed grasslands.
Based on Borhidi’s classification of plant species into Social Behaviour Type categories, we found that natural competitors and stress-tolerant species are still present in high proportions in the underutilised treatment plots after 11 years, indicating the stability of the studied semi-natural grassland association.
Inappropriate grassland management practices are widespread in the extensive grasslands of the Pannonian Basin and, as we have shown, reduce the forage base of ruminant livestock by degrading the plant structure. At the same time, they increase the risk of wildfire in underutilisation. Overgrazing can also open the way for weeds and even invasive species that threaten animal welfare.
Our results also suggest that there may be a need for a comprehensive grassland quality sustainability monitoring system at the EU level, because the lack of a critical quality workforce in livestock production and no-input environmental subsidies may maintain the negative situation for grasslands in the longer term.
We found that under the influence of persistent overgrazing, the proportion of plant species excluded by animals increases year by year, leading to increased degradation, similar to the results reported by Czóbel et al. [74]. Considering the overgrazing treatments of our experiment, it is clear that the study area can be considered degraded, as the degradation scores calculated by the Social Behaviour Types indicate results higher than 1, in agreement with Stefán [75].

5. Conclusions

By comparing the changes in plant population structure of fallow, extensively exploited, and over-exploited grassland associations, our results suggest that over-exploitation is the cause of the higher degradation problems in the grassland of the study area.
Our results clearly indicate that the high level of overgrazing in pasture gardens adjacent to livestock farms, spread by necessity due to manpower shortages, is a potential threat to the sustainability of pasture-based sheep production, mainly due to the massive emergence of unconditioned, prickly weeds, such as Hordeum murinum, which threaten the health of the sheep flock.
In the case of fallow grassland, the accumulation of stubble may reduce the species richness of the plant structure and may reduce the hay value in the event of mowing. In the case of possible reuse of fallow grassland, it is recommended that the practice should be to use a grazing system with a higher animal density in the first year.
As we only had the opportunity to study sheep grazing in our experiment, we consider it appropriate to include other species of farm animals using grassland to refine our results.

Author Contributions

K.V., I.C., A.H., D.M. and D.N. conceived and designed the experiments, performed the field experiments and analyzed the data, wrote the paper, and revised the manuscript. All authors have read and agreed to the published version of the manuscript.

Funding

This research received no external funding.

Data Availability Statement

Data included in the article and https://doi.org/10.6084/m9.figshare.24916125.v1.

Conflicts of Interest

The authors declare no conflict of interest.

References

  1. Zhou, T.; Hou, G.; Sun, J.; Zong, N.; Shi, P. Degradation shifts plant communities from S- to R-strategy in an alpine meadow, Tibetan Plateau. Sci. Total Environ. 2021, 800, 149572. [Google Scholar] [CrossRef] [PubMed]
  2. Wilson, J.B.; Peet, R.K.; Dengler, J.; Pärtel, M. Plant species richness: The world records. J. Veg. Sci. 2012, 23, 796–802. [Google Scholar] [CrossRef]
  3. Zhang, Y.; Ganjurjav, H.; Dong, S.; Gao, Q. Excessive plant compensatory growth: A potential endogenous driver of meadow degradation on the Qinghai-Tibetan Plateau. Ecosyst. Health Sustain. 2020, 6, 1816500. [Google Scholar] [CrossRef]
  4. Tiscornia, G.; Jaurena, M.; Baethgen, W. Drivers, Process, and Consequences of Native Grassland Degradation: Insights from a Literature Review and a Survey in Río de la Plata Grasslands. Agronomy 2019, 9, 239. [Google Scholar] [CrossRef]
  5. Wu, G.L.; Ren, G.H.; Dong, Q.M.; Shi, J.J.; Wang, Y.L. Above- and belowground response along degradation gradient in an alpine grassland of the Qinghai-Tibetan Plateau. Acta Hydrochim. Et Hydrobiol. 2014, 42, 319–323. [Google Scholar] [CrossRef]
  6. Lu, X.; Kelsey, K.C.; Yan, Y.; Sun, J.; Wang, X.; Cheng, G.; Neff, J.C. Effects of grazing on ecosystem structure and function of alpine grasslands in Qinghai-Tibetan Plateau: A synthesis. Ecosphere 2017, 8, e01656. [Google Scholar] [CrossRef]
  7. Gibbs, H.K.; Salmon, J.M. Mapping the world’s degraded lands. Appl. Geogr. 2015, 57, 12–21. [Google Scholar] [CrossRef]
  8. Liu, M.; Dries, L.; Wim Heijman, W.; Zhu, X.; Deng, X.; Huang, J. Land tenure reform and grassland degradation in Inner Mongolia, China. China Econ. Rev. 2019, 55, 181–198. [Google Scholar] [CrossRef]
  9. Li, X.L.; Gao, J.; Brierley, G.; Qiao, Y.M.; Zhang, J.; Yang, Y.W. Rangeland degradation on the Qinghai-Tibet plateau: Implications for rehabilitation. Land Degrad. Dev. 2013, 24, 72–80. [Google Scholar] [CrossRef]
  10. Lin, L.; Li, Y.K.; Xu, X.L.; Zhang, F.W.; Du, Y.G.; Liu, S.L.; Guo, X.W.; Cao, G.M. Predicting parameters of degradation succession processes of Tibetan Kobresia grasslands. Solid Earth 2015, 6, 1237–1246. [Google Scholar] [CrossRef]
  11. Seto, K.C.; Fragkias, M.; Güneralp, B.; Reilly, M.K. A meta-analysis of global urban land expansion. PLoS ONE 2011, 6, e23777. [Google Scholar] [CrossRef] [PubMed]
  12. Zhou, H.; Yang, X.; Zhou, C.; Shao, X.; Shi, Z.; Li, H.; Su, H.; Qin, R.; Chang, T.; Hu, X.; et al. Alpine Grassland Degradation and Its Restoration in the Qinghai–Tibet Plateau. Grasses 2023, 2, 31–46. [Google Scholar] [CrossRef]
  13. Zhang, W.; Xue, X.; Peng, F.; You, Q.; Hao, A. Meta-analysis of the effects of grassland degradation on plant and soil properties in the alpine meadows of the Qinghai-Tibetan Plateau. Glob. Ecol. Conserv. 2019, 20, e00774. [Google Scholar] [CrossRef]
  14. Xie, H.; Zhang, Y.; Wu, Z.; Lv, T. A Bibliometric Analysis on Land Degradation: Current Status, Development, and Future Directions. Land 2020, 9, 28. [Google Scholar] [CrossRef]
  15. Allen, V.G.; Batello, C.; Berretta, E.J.; Hodgson, J.; Kothmann, M.; Li, X.; McIvor, J.; Milne, J.; Morris, C.; Peeters, A.; et al. An international terminology for grazing lands and grazing animals. Grass Forage Sci. 2011, 66, 2–28. [Google Scholar] [CrossRef]
  16. Harris, R.B. Rangeland degradation on the Qinghai-Tibetan plateau: A review of the evidence of its magnitude and causes. J. Arid Environ. 2010, 74, 1–12. [Google Scholar] [CrossRef]
  17. Veldman, J.W.; Buisson, E.; Durigan, G.; Fernandes, G.W.; Le Stradic, S.; Mahy, G.; Negreiros, D.; Overbeck, G.E.; Veldman, R.G.; Zaloumis, N.P.; et al. Toward an old-growth concept for grasslands, savannas, and woodlands. Front. Ecol. Environ. 2015, 13, 154–162. [Google Scholar] [CrossRef]
  18. Wick, A.F.; Geaumont, B.A.; Sedivec, K.; Hendrickson, J. Grassland degradation. In Biological and Environmental Hazards, Risks and Disasters; Shroder, J.F., Sivanpillai, R., Eds.; Elsevier: New York, NY, USA, 2016; Volume 8, pp. 257–276. ISBN 9780123964717. [Google Scholar]
  19. Andrade, B.O.; Marchesi, E.; Burkart, S.; Setubal, R.B.; Lezama, F.; Perelman, S.; Schneider, A.A.; Trevisan, R.; Overbeck, G.E.; Boldrini, I.I. Vascular plant species richness and distribution in the Río de la Plata grasslands. Bot. J. Linn. Soc. 2018, 188, 250–256. [Google Scholar] [CrossRef]
  20. Gang, C.C.; Zhou, W.; Chen, Y.Z.; Wang, Z.Q.; Sun, Z.G.; Li, J.L.; Odeh, I. Quantitative assessment of the contributions of climate change and human activities on global grassland degradation. Environ. Earth Sci. 2014, 72, 4273–4282. [Google Scholar] [CrossRef]
  21. Zhou, W.; Gang, C.; Zhou, L.; Chen, Y.; Li, J.; Ju, W.; Odeh, I. Dynamic of grassland vegetation degradation and its quantitative assessment in the northwest China. Acta Oecol. 2014, 55, 86–96. [Google Scholar] [CrossRef]
  22. Lark, T.J.; Spawn, S.A.; Bougie, M.; Gibbs, H.K. Cropland expansion in the United States produces marginal yields at high costs to wildlife. Nat. Commun. 2020, 11, 4295. [Google Scholar] [CrossRef] [PubMed]
  23. Bardgett, R.D.; Bullock, J.M.; Lavorel, S.; Manning, P.; Schaffner, U.; Ostle, N.; Chomel, M.; Durigan, G.; Fry, E.L.; Johnson, L.; et al. Combatting global grassland degradation. Nat. Rev. Earth Environ. 2021, 2, 720–735. [Google Scholar] [CrossRef]
  24. Török, P.; Penksza, K.; Tóth, E.; Kelemen, A.; Sonkoly, J.; Tóthmérész, B. Vegetation type and grazing intensity jointly shape grazing effects on grassland biodiversity. Ecol. Evol. 2018, 8, 10326–10335. [Google Scholar] [CrossRef] [PubMed]
  25. Siyabulela, S.; Tefera, S.; Wakindiki, I.; Keletso, M. Comparison of grass and soil conditions around water points in different land use systems in semi-arid South African rangelands and implications for management and current rangeland paradigms. Arid. Land Res. Manag. 2020, 34, 207–230. [Google Scholar] [CrossRef]
  26. Kamp, J.; Koshkin, M.A.; Bragina, T.M.; Katzner, T.E.; Milner-Gulland, E.J.; Schreiber, E.; Sheldon, R.; Shmalenko, A.; Smelansky, I.; Terraube, J.; et al. Persistent and novel threats to the biodiversity of Kazakhstan’s steppes and semi-deserts. Biodivers. Conserv. 2016, 25, 2521–2541. [Google Scholar] [CrossRef]
  27. Shahriary, E.; Langford, R.P.; Gill, T.E.; Hussein, M.; Hargrove, W.L.; Golding, P. Partitioning variation in vegetation communities around Lajaneh Piosphere, Iran. Arid. Land Res. Manag. 2021, 35, 32–54. [Google Scholar] [CrossRef]
  28. Gaitán, J.J.; Bran, D.E.; Oliva, G.E.; Aguiar, M.R.; Buono, G.G.; Ferrante, D.; Nakamatsu, V.; Ciari, G.; Salomone, J.M.; Massara, V.; et al. Aridity and overgrazing have convergent effects on ecosystem structure and functioning in Patagonian rangelands. Land Degrad. Dev. 2018, 29, 210–218. [Google Scholar] [CrossRef]
  29. Abu Hammad, A.; Tumeizi, A. Land degradation: Socioeconomic and environmental causes and consequences in the eastern Mediterranean. Land Degrad. Dev. 2012, 23, 216–226. [Google Scholar] [CrossRef]
  30. Vetter, S.; Bond, W.J. Changing predictors of spatial and temporal variability in stocking rates in a severely degraded communal rangeland. Land Degrad. Dev. 2012, 23, 190–199. [Google Scholar] [CrossRef]
  31. Kovácsné Koncz, N.; Béri, B.; Deák, B.; Kelemen, A.; Tóth, K.; Kiss, R.; Radócz, S.; Miglécz, T.; Tóthmérész, B.; Valkó, O. Meat production and maintaining biodiversity: Grazing by traditional and crossbred beef cattle breeds in marshes and grasslands. Appl. Veg. Sci. 2020, 23, 139–148. [Google Scholar] [CrossRef]
  32. Xie, Y.; Sha, Z. Quantitative Analysis of Driving Factors of Grassland Degradation: A Case Study in Xilin River Basin, InnerMongolia. Sci. World J. 2012, 2012, 169724. [Google Scholar] [CrossRef] [PubMed]
  33. Mor-Mussery, A.; Abu-Glaion, H.; Shuker, S.; Zaady, E. The influence of trampling by small ruminants on soil fertility in semi-arid rangelands. Arid. Land Res. Manag. 2020, 35, 189–197. [Google Scholar] [CrossRef]
  34. Borer, E.T.; Seabloom, E.W.; Gruner, D.S.; Harpole, W.S.; Hillebrand, H.; Lind, E.M.; Adler, P.B.; Alberti, J.; Anderson, T.M.; Bakker, J.D.; et al. Herbivores and nutrients control grassland plant diversity via light limitation. Nature 2014, 508, 517. [Google Scholar] [CrossRef] [PubMed]
  35. Zhan, W.; Deng, X.; Song, W.; Li, Z.; Chen, J. What is the main cause of grassland degradation? A case study of grassland ecosystem service in the middle-south Inner Mongolia. CATENA 2017, 150, 100–107. [Google Scholar] [CrossRef]
  36. Evans, R. Overgrazing and soil erosion on hill pastures with particular reference to the Peak District. Grass Forage Sci. Soc. 2006, 32, 65–76. [Google Scholar] [CrossRef]
  37. Zhao, Y.; Peth, S.; Krummelbein, J.; Horn, R.; Wang, Z.Y.; Steffens, M.; Hoffmann, C.; Peng, X.H. Spatial variability of soil properties affected by grazing intensity in Inner Mongolia Grassland. Ecol. Model. 2007, 205, 241–254. [Google Scholar] [CrossRef]
  38. Jiang, A.; Jing, L.H.; Mipam, T.-D.; Tian, L.M. Progress in research on the effects of grazing on grassland litter decomposition. Acta Pratacult. Sin. 2022, 32, 208–220. [Google Scholar]
  39. Isselstein, J.; Jeangros, B.; Pavlů, V. Agronomic aspects of biodiversity targeted management of temperate grasslands in Europe—A review. Agric. Res. 2005, 3, 139–151. [Google Scholar]
  40. Perevolotsky, A.; Seligman, N.G. Role of grazing in Mediterranean rangeland ecosystems. Bioscience 1998, 48, 1007–1017. [Google Scholar] [CrossRef]
  41. Bakker, J.P.; Berendse, F. Constraints in the restoration of ecological diversity in grassland and heathland communities. Trends Ecol. Evol. 1999, 14, 63–68. [Google Scholar] [CrossRef]
  42. Bajor, Z.; Zimmermann, Z.; Szabó, G.; Fehér, Z.; Járdi, I.; Lampert, R.; Kerény-Nagy, V.; Penksza, P.; Szabó, Z.L.; Székely, Z.; et al. Effect of conservation management practices on sand grassland vegetation in Budapest, Hungary. Appl. Ecol. Environ. Res. 2016, 14, 233–247. [Google Scholar] [CrossRef]
  43. Erdős, L.; Bátori, Z.; Tölgyesi, C.; Körmöczi, L. The moving split window (MSW) analysis in vegetation science—An overview. Appl. Ecol. Environ. Res. 2014, 12, 787–805. [Google Scholar] [CrossRef]
  44. Erdős, L.; Cserhalmi, D.; Bátori, Z.; Kiss, T.; Morschhauser, T.; Benyhe, B.; Dénes, A. Shrub encroachment in a wooded-steppe mosaic: Combining GIS methods with landscape historical analysis. Appl. Ecol. Environ. Res. 2013, 11, 371–384. [Google Scholar] [CrossRef]
  45. Erdős, L.; Tölgyesi, C.; Dénes, A.; Darányi, N.; Fodor, A.; Bátori, Z.; Tolnay, D. Comparative analysis of the natural and semi–natural plant communities of Mt Nagy and other parts of the Villány (Mts south Hungary). Thaiszia J. Bot. 2014, 24, 1–21. [Google Scholar]
  46. Szentes, S.; Sutyinszki, Z.; Szabó, G.; Zimmermann, Z.; Házi, J.; Wichmann, B.; Hufnágel, L.; Penksza, K.; Bartha, S. Grazed Pannonian grassland beta-diversity changes due to C4 yellow bluestem. Cent. Eur. J. Biol. 2012, 7, 1055–1065. [Google Scholar] [CrossRef]
  47. Ma, L.; Yao, Z.; Zheng, X.; Zhang, H.; Wang, K.; Zhu, B.; Wang, R.; Zhang, W.; Liu, C. Increasing grassland degradation stimulates the non-growing season CO2 emissions from an alpine meadow on the Qinghai–Tibetan Plateau. Environ. Sci. Pollut. Res. 2018, 25, 26576–26591. [Google Scholar] [CrossRef]
  48. Bartha, S.; Szentes, S.; Horváth, A.; Házi, J.; Zimmermann, Z.; Molnár, C.; Dancza, I.; Margóczi, K.; Pál, R.; Purger, D.; et al. Impact of mid-successional dominant species on the diversity and progress of succession in regenerating temperate grasslands. Appl. Veg. Sci. 2014, 17, 201–213. [Google Scholar] [CrossRef]
  49. Wright, C.K.; Wimberly, M.C. Recent land use change in the western corn belt threatens grasslands and wetlands. Proc. Natl. Acad. Sci. USA 2013, 110, 4134–4139. [Google Scholar] [CrossRef]
  50. Sauer, J.R.; Link, W.A.; Fallon, J.E.; Pardieck, K.L.; Ziolkowski, D.J., Jr. The North American breeding bird survey 1966e2011: Summary analysis and species accounts. N. Am. Fauna 2012, 79, 1–32. [Google Scholar] [CrossRef]
  51. Sanderson, M.A.; Archer, D.; Hendrickson, J.; Kronberg, S.; Liebig, M.; Nichols, K.; Schmer, M.; Tanaka, D.; Aguilar, J. Diversification and ecosystem services for conservation agriculture: Outcomes from pastures and integrated crop-livestock systems. Renew. Agric. Food Syst. 2013, 28, 129–144. [Google Scholar] [CrossRef]
  52. Varga, K.; Csízi, I. Túllegeltetett természetközeli gyeptársulás rekultivációja legeltetés kizárással. Gyepgazdálkodási Közlemények 2020, 18, 45–53. [Google Scholar] [CrossRef]
  53. Fernandez-Gimenez, M.E.; Le Febre, S. Mobility in pastoral systems: Dynamic flux or downward trend? The International Journal of Sustainable. Dev. World Ecol. 2006, 13, 341–362. [Google Scholar] [CrossRef]
  54. Tasi, J.; Bajnok, M.; Halász, A.; Szabó, F.; Harkányiné Székely, Z.; Láng, V. Magyarországi komplex gyepgazdálkodási adatbázis létrehozásának első lépései és eredményei. Gyepgazdálkodási Közlemények 2014, 12, 57–58. [Google Scholar] [CrossRef]
  55. Hortobágyi, T.; Simon, T. Növényföldrajz, Társulástan és Ökológia; Nemzeti Tankönyvkiadó: Budapest, Hungary, 2002; pp. 1–538. [Google Scholar]
  56. Šefferová Stanová, V.; Janák, M.; Ripka, J. Management of Natura 2000 Habitats. In 1530*Pannonic Salt Steppes and Salt Marshes; European Commission: Brussels, Belgium, 2008. [Google Scholar]
  57. Balázs, F. A gyepek termésbecslése növénycönológia alapján. Agrártudományok 1949, 1, 25–35. [Google Scholar]
  58. Király, G.; Virók, V.; Szmorad, F.; Molnár, V.A. Új magyar füvészkönyv: Magyarország hajtásos növényei: Határozókulcsok; Aggteleki Nemzeti Park Igazgatóság: Jósvafő, Hungray, 2009; pp. 1–616. [Google Scholar]
  59. Borhidi, A. A Magyar Flóra Szociális Magatartástípusa, Természetességi és Relatív Ökológiai Értékszámai; KTM-OTVH-JPTE: Pécs, Hungary, 1993; pp. 1–93. [Google Scholar]
  60. Penksza, K.; Házi, J.; Tóth, A.; Wichmann, B.; Pajor, F.; Gyuricza, C.S.; Póti, P.; Szentes, S. Eltérő hasznosítású szürkemarha legelő szezonális táplálóanyag-tartalom alakulás, fajdiverzitás változása és ennek hatása a biomassza mennyiségére és összetételére nedves pannon gyepekben. Növénytermelés 2013, 62, 73–94. [Google Scholar]
  61. Török, P.; Janišová, M.; Kuzemko, A.; Rūsiņa, S.; Stevanović, Z.D. Grasslands, their threats and management in Eastern Europe. In Grasslands of the World: Diversity, Management and Conservation; CRC Press: Boca Raton, FL, USA, 2018; pp. 67–88. [Google Scholar]
  62. Házi, J.; Bartha, S.; Szentes, S.; Wichmann, B.; Penksza, K. Seminatural grassland management by mowing of Calamagrostis epigejos in Hungary. Plant Biosyst. 2011, 145, 699–707. [Google Scholar] [CrossRef]
  63. Házi, J.; Penksza, K.; Bartha, S.; Hufnagel, L.; Tóth, A.; Gyuricza, C.; Szentes, S. Cut mowing and grazing Effects with grey cattle on plant species composition in case of Pannon wet grasslands. Appl. Ecol. Environ. Res. 2012, 10, 223–231. [Google Scholar] [CrossRef]
  64. Valkó, O.; Venn, S.; Zmihoski, M.; Biurrun, I.; Labadessa, R.; Loos, J. The challenge of abandonment for the sustainable management of Palaearctic natural and semi-natural grasslands. Hacquetia 2018, 17, 5–16. [Google Scholar] [CrossRef]
  65. Török, P.; Valkó, O.; Deák, B.; Kelemen, A.; Tóth, E.; Tóthmérész, B. Managing for composition or species diversity? Pastoral and year-round grazing systems in alkali grasslands. Agric. Ecosyst. Environ. 2016, 234, 23–30. [Google Scholar] [CrossRef]
  66. Török, P.; Valkó, O.; Deák, B.; Kelemen, A.; Tóthmérész, B. Traditional cattle grazing in a mosaic alkali landscape: Effects on grassland biodiversity along a moisture gradient. PLoS ONE 2014, 9, e97095. [Google Scholar] [CrossRef]
  67. Pápay, G. Cserjeirtás után magára hagyott, legeltetett és kaszált gyepterületek vegetációjának összehasonlító elemzése parádóhutai (Mátra) mintaterületen. Gyepgazdálkodási Közlemények 2016, 14, 37–48. [Google Scholar] [CrossRef]
  68. Pápay, G.; Penksza, K.; Szabó, G.; Ibadzane, M.; Járdi, I.; Wichmann, B. Természetvédelmi kezelések hatása hegyi rétek vegetációjára a Gyöngyösi Sár-hegy TT területén. Gyepgazdálkodási Közlemények 2017, 15, 37–46. [Google Scholar] [CrossRef]
  69. Penksza, K.; Pápay, G.; Házi, J.; Tóth, A.; S-Falusi, E.; Saláta, D.; Kerényi-Nagy, V.; Wichmann, B. Gyepregeneráció erdőirtással kialakított gyepekben mátrai (Fallóskút) mintaterületeken. Gyepgazdálkodási Közlemények 2015, 13, 31–44. [Google Scholar] [CrossRef]
  70. Tóth, E.; Deák, B.; Valkó, O.; Kelemen, A.; Miglécz, T.; Tóthmérész, B.; Török, P. Livestock type is more crucial than grazing intensity: Traditional cattle and sheep grazing in shortgrass steppes. Land Degrad. Dev. 2016, 29, 231–239. [Google Scholar] [CrossRef]
  71. Nagy, G. A gyephasználat és a vidékfejlesztés összefüggései. In Gyepgazdálkodásunk helyzete és kilátásai; Debreceni Gyepgazdálkodási Napok 17: Debrecen, Hungary, 2001; pp. 24–25. [Google Scholar]
  72. Dufour, A.; Gadallah, F.; Wagner, H.H.; Guisan, A.; Buttler, A. Plant species richness and environmental heterogeneity in a mountain landscape: Effects of variability and spatial configuration. Ecography 2006, 29, 573–584. [Google Scholar] [CrossRef]
  73. Vickery, J.A.; Tallowin, J.R.; Feber, R.E.; Asteraki, E.J.; Atkinson, P.W.; Fuller, R.J.; Brown, V.K. The management of lowland neutral grasslands in Britain: Effects of agricultural practices on birds and their food resources. J. Appl. Ecol. 2001, 38, 647–664. [Google Scholar] [CrossRef]
  74. Czóbel, S.; Szirmai, O.; Németh, Z.; Gyuricza, C.S.; Házi, J.; Tóth, A.; Schellenberger, J.; Vasa, L.; Penksza, K.P. Shortterm effects of grazing exclusion on net ecosystem CO2 exchange and net primary production in a Pannonian sandy grassland. Not. Bot. Horti Agrobot. Cluj-Napoca 2012, 40, 67–72. [Google Scholar] [CrossRef]
  75. Stefán, E. Az alsószuhai szőlőhegy tájtörténeti és botanikai vizsgálata. Bot. Közlemények 2018, 105, 129–142. [Google Scholar] [CrossRef]
Figure 1. Schematic figure of the experiment.
Agronomy 14 00035 g001
Figure 2. Evolution of the degree of degradation with standard error during the study period for different uses (Karcag, 2017–2020). Note: (a) not significant, (b) significant.
Agronomy 14 00035 g002
Table 1. Climatic data for the period under review (2017–2020, Karcag).
2017201820192020
Yearly precipitation (mm)527.50557.80505.10648.50
Yearly average temperature (°C)11.2012.5013.3011.70
Table 2. Average coverage of SBT groups of different treatments (%).
Treatment/Plant GroupYearOvergrazing (OG)Mowing (M)Zero Utilisation (Z)Mowing and Grazing (M + G)
Rare specialists (Sr)20170.000.000.000.52
20180.000.000.000.52
20190.000.000.000.52
20200.000.000.000.52
Specialists (S)20172.080.000.002.08
20181.042.080.001.56
20191.040.000.001.04
20201.040.000.002.08
Competitors (C)201728.1354.0262.5068.23
201819.2773.4442.7149.13
201914.0636.4648.4457.81
202014.0640.6349.4856.25
Generalists (G)20176.7737.5014.5810.94
20186.2518.7527.089.90
20194.6934.3819.7913.02
20204.6933.3347.5811.98
Natural pioneers (NP)20170.520.000.001.56
20180.000.000.000.52
20190.000.000.000.00
20200.000.000.000.52
Disturbance tolerant plants (DT)201727.601.5617.719.90
201829.173.6515.6310.42
201933.856.2521.3512.50
202030.212.6017.1913.02
Weeds (W)201725.520.001.042.08
201830.210.001.044.69
201932.814.690.523.13
202041.674.178.853.13
Ruderal competitors (RC)20175.215.212.083.65
20183.652.084.175.21
20194.1713.546.255.21
20204.1714.5811.466.25
Disclaimer/Publisher’s Note: The statements, opinions and data contained in all publications are solely those of the individual author(s) and contributor(s) and not of MDPI and/or the editor(s). MDPI and/or the editor(s) disclaim responsibility for any injury to people or property resulting from any ideas, methods, instructions or products referred to in the content.

