Article

Metabolome and Transcriptome Analysis Provide Insights into Flower Bud Color Variation in the Adaptation to UV-B Radiation of Litchi

Institute of Fruit Tree Research, Guangdong Academy of Agricultural Sciences, Key Laboratory of South Subtropical Fruit Biology and Genetic Resource Utilization, Ministry of Agriculture and Rural Affairs, Guangdong Provincial Key Laboratory of Tropical and Subtropical Fruit Tree Research, Guangzhou 510640, China
*
Author to whom correspondence should be addressed.
Agronomy 2024, 14(1), 221; https://doi.org/10.3390/agronomy14010221
Submission received: 8 January 2024 / Accepted: 15 January 2024 / Published: 19 January 2024
(This article belongs to the Section Horticultural and Floricultural Crops)

Abstract

:
Flower color variations have increasingly been recognized as playing an important role in the adaptation to UV-B radiation; however, the underlying mechanism is poorly understood in perennial fruit trees. Litchi is an important fruit tree, and extremely early maturing (EEM) and middle-to-late-maturing (MLM) cultivars that originated from regions with high and low UV-B radiation have dark brown and light yellow flower buds, respectively, while their hybrid early-maturing (EM) cultivars have an intermediate brown flower bud. This study comprehensively analyzed the metabolome and transcriptome of flower buds of litchi EEM, EM and MLM cultivars to explore the mechanism underlying flower color variation during the adaptation to UV-B radiation for the first time. Metabolomic analysis identified 72 flavonoids in litchi flower buds, among which a higher accumulation of flavonol glycosides was responsible for darker flower buds of EEM cultivars. And transcriptome analysis revealed key structural genes, including LcCHI, LcFLS and seven UGTs, together with two transcription factors (LcMYB12 and LcMYB111), which could be directly up-regulated by UV-B radiation, playing critical roles in regulating the differential accumulation of flavonol glycosides. These results provide new insights into the molecular mechanism underlying adaptation to UV-B radiation and provide a genetic basis for future breeding of stress-tolerant cultivars of litchi.

1. Introduction

Environmental adaptation is crucial to species survival in the face of rapid climate change [1], among which flower color diversity is one of the most extraordinary examples of adaptive variation in the plant world [2,3]. Increasing evidence has demonstrated that darker floral pigmentation is under especially strong selection by UV-B radiation [4]. For instance, the extents of petal UV pigmentation were found to increase significantly across taxa by about 2% per year in response to elevated UV incidence by analyzing 1238 herbarium specimens sampled from 1941 to 2017 [2]. Among 177 species in the Potentilleae tribe (Rosaceae), species that grow at higher altitudes where UV-B irradiance is higher, have larger portions of petal areas with UV-absorbing pigmentation [3]. Floral pigmentation was also found to increase with higher UV-B incidence, and UV was confirmed as an agent of selection of floral pigmentation in a widespread plant, Argentina anserina (Rosaceae) [5]. However, studies of flower color variations in adaptation to UV-B radiation in domesticated perennial fruit trees are scarce.
Litchi (Litchi chinensis Sonn., Sapindaceae) is an important fruit tree in tropical and subtropical regions of the world [6]. Litchi originated in southern areas of China and have been cultivated for ~2300 years [7]. Wild litchi populations are distributed in geographically diverse regions in China, and can be found in hilly areas with high altitude in Yunnan Province where UV-B radiation is high [8,9], as well as rainforests with low altitude in Hainan Province where UV-B radiation is low [10,11]. Litchi cultivars could be divided into three clusters based on the fruit maturation period: extremely early maturing (EEM) cultivars; early-maturing (EM) cultivars and middle-to-late-maturing (MLM) cultivars [12,13]. Two independent domestication events of litchi cultivars have been revealed by our previous resequencing study of cultivated and wild litchi accessions, which found that EEM cultivars were domesticated from the wild Yunnan population, while the MLM cultivars were domesticated in the wild Hainan Province, with EM cultivars that probably originated through hybridization between EEM and MLM cultivars [14]. Interestingly, there are conspicuous color variations of flower buds between litchi accessions that originated from different environments [7,8,9,10,11]. The wild Yunnan population as well as their descendant EEM cultivars that originated from regions with high UV-B radiation have dark brown flower buds [8,9], the wild Hainan population as well as their descendant MLM cultivars that originated from regions with low UV-B radiation have light yellow flower buds [10,11], and their possible hybrid EM cultivars have an intermediate brown flower bud [7]. Therefore, litchi provides an excellent material for investigating the mechanism underlying flower color variation during the adaptation to UV-B in domesticated perennial fruit trees. However, there are no reports exploring the underlying mechanism in litchi to date.
Flavonoids have been demonstrated as the major UV-absorbing compound that protects plants from the detrimental effects of UV-B radiation [15,16,17]. A previous study revealed that the concentration of flavone aglycones was elevated because of increasing UV-B radiation in an Antarctic moss, Bryum argenteum [18]. Arabidopsis mutants that cannot accumulate flavonoids are hypersensitive to UV-B radiation [19], while Arabidopsis growing at low latitudes or high altitudes with an overaccumulation of phenylacylated flavonols [20] and rice grown at low latitudes or high altitudes with higher flavone O-glycosides contents [21] obtained enhanced UV-B tolerance. A metabolite-based genome-wide association study of qingke, which was exposed to long-term and strong UV-B radiation on the Tibetan Plateau, demonstrated that various flavonoids such as flavone O-glycosides and flavone glucuronoids showed overaccumulation in varieties with higher tolerance to UV-B radiation [22]. It can be seen that different metabolites are utilized in different species in UV-B protection.
Flavonoid synthesis is relatively conserved in higher plants and is well-understood in plants [23]. Various structural genes involved in flavonoid synthesis have been identified, including chalcone synthase (CHS), chalcone isomerase (CHI), favanone-3-hydroxyl enzyme (F3H), flavonoid 3′-hydroxylase (F3′H), flavonoid 3′5′-hydroxylase (F3′5′H), flavonol synthase (FLS), dihydrofavonol 4-reductase (DFR), anthocyanin synthase (ANS) et al. [24,25,26,27]. Glycosyltransferases (UGTs), which catalyze the glycosylation of flavonoids, have also been identified [28,29,30]. In addition, transcription factors also play a critical role in the modulation of flavonoid biosynthesis, and the R2R3-MYB family has been proven to be an important transcriptional regulator of flavonoid biosynthesis [31,32,33]. Although genes involved in flavonoid biosynthesis have been clearly characterized in many plants, research on the genes regulating flavonoid biosynthesis in litchi flower buds is still lacking.
In this study, dark brown and light yellow flower buds of EEM and MLM cultivars that originated from regions with high and low UV-B radiation, together with brown flower buds from their possible hybrid EM cultivars, were studied using metabolome and transcriptome analysis. This study aims to (1) identify the key differential flavonoid metabolites among flower buds of EEM, EM and MLM cultivars; (2) identify the key differential expressed genes involved in the differential accumulation of flavonoids in flower buds of EEM, EM and MLM cultivars. These results provide important insights into the molecular network of flavonoid biosynthesis in litchi flower buds and explain the mechanism underlying flower color variation of different litchi cultivars during the adaptation to UV-B radiation. These results provide new insights into the molecular mechanism underlying adaptation to UV-B radiation and provide a genetic basis for future breeding of stress-tolerant cultivars of litchi.

2. Materials and Methods

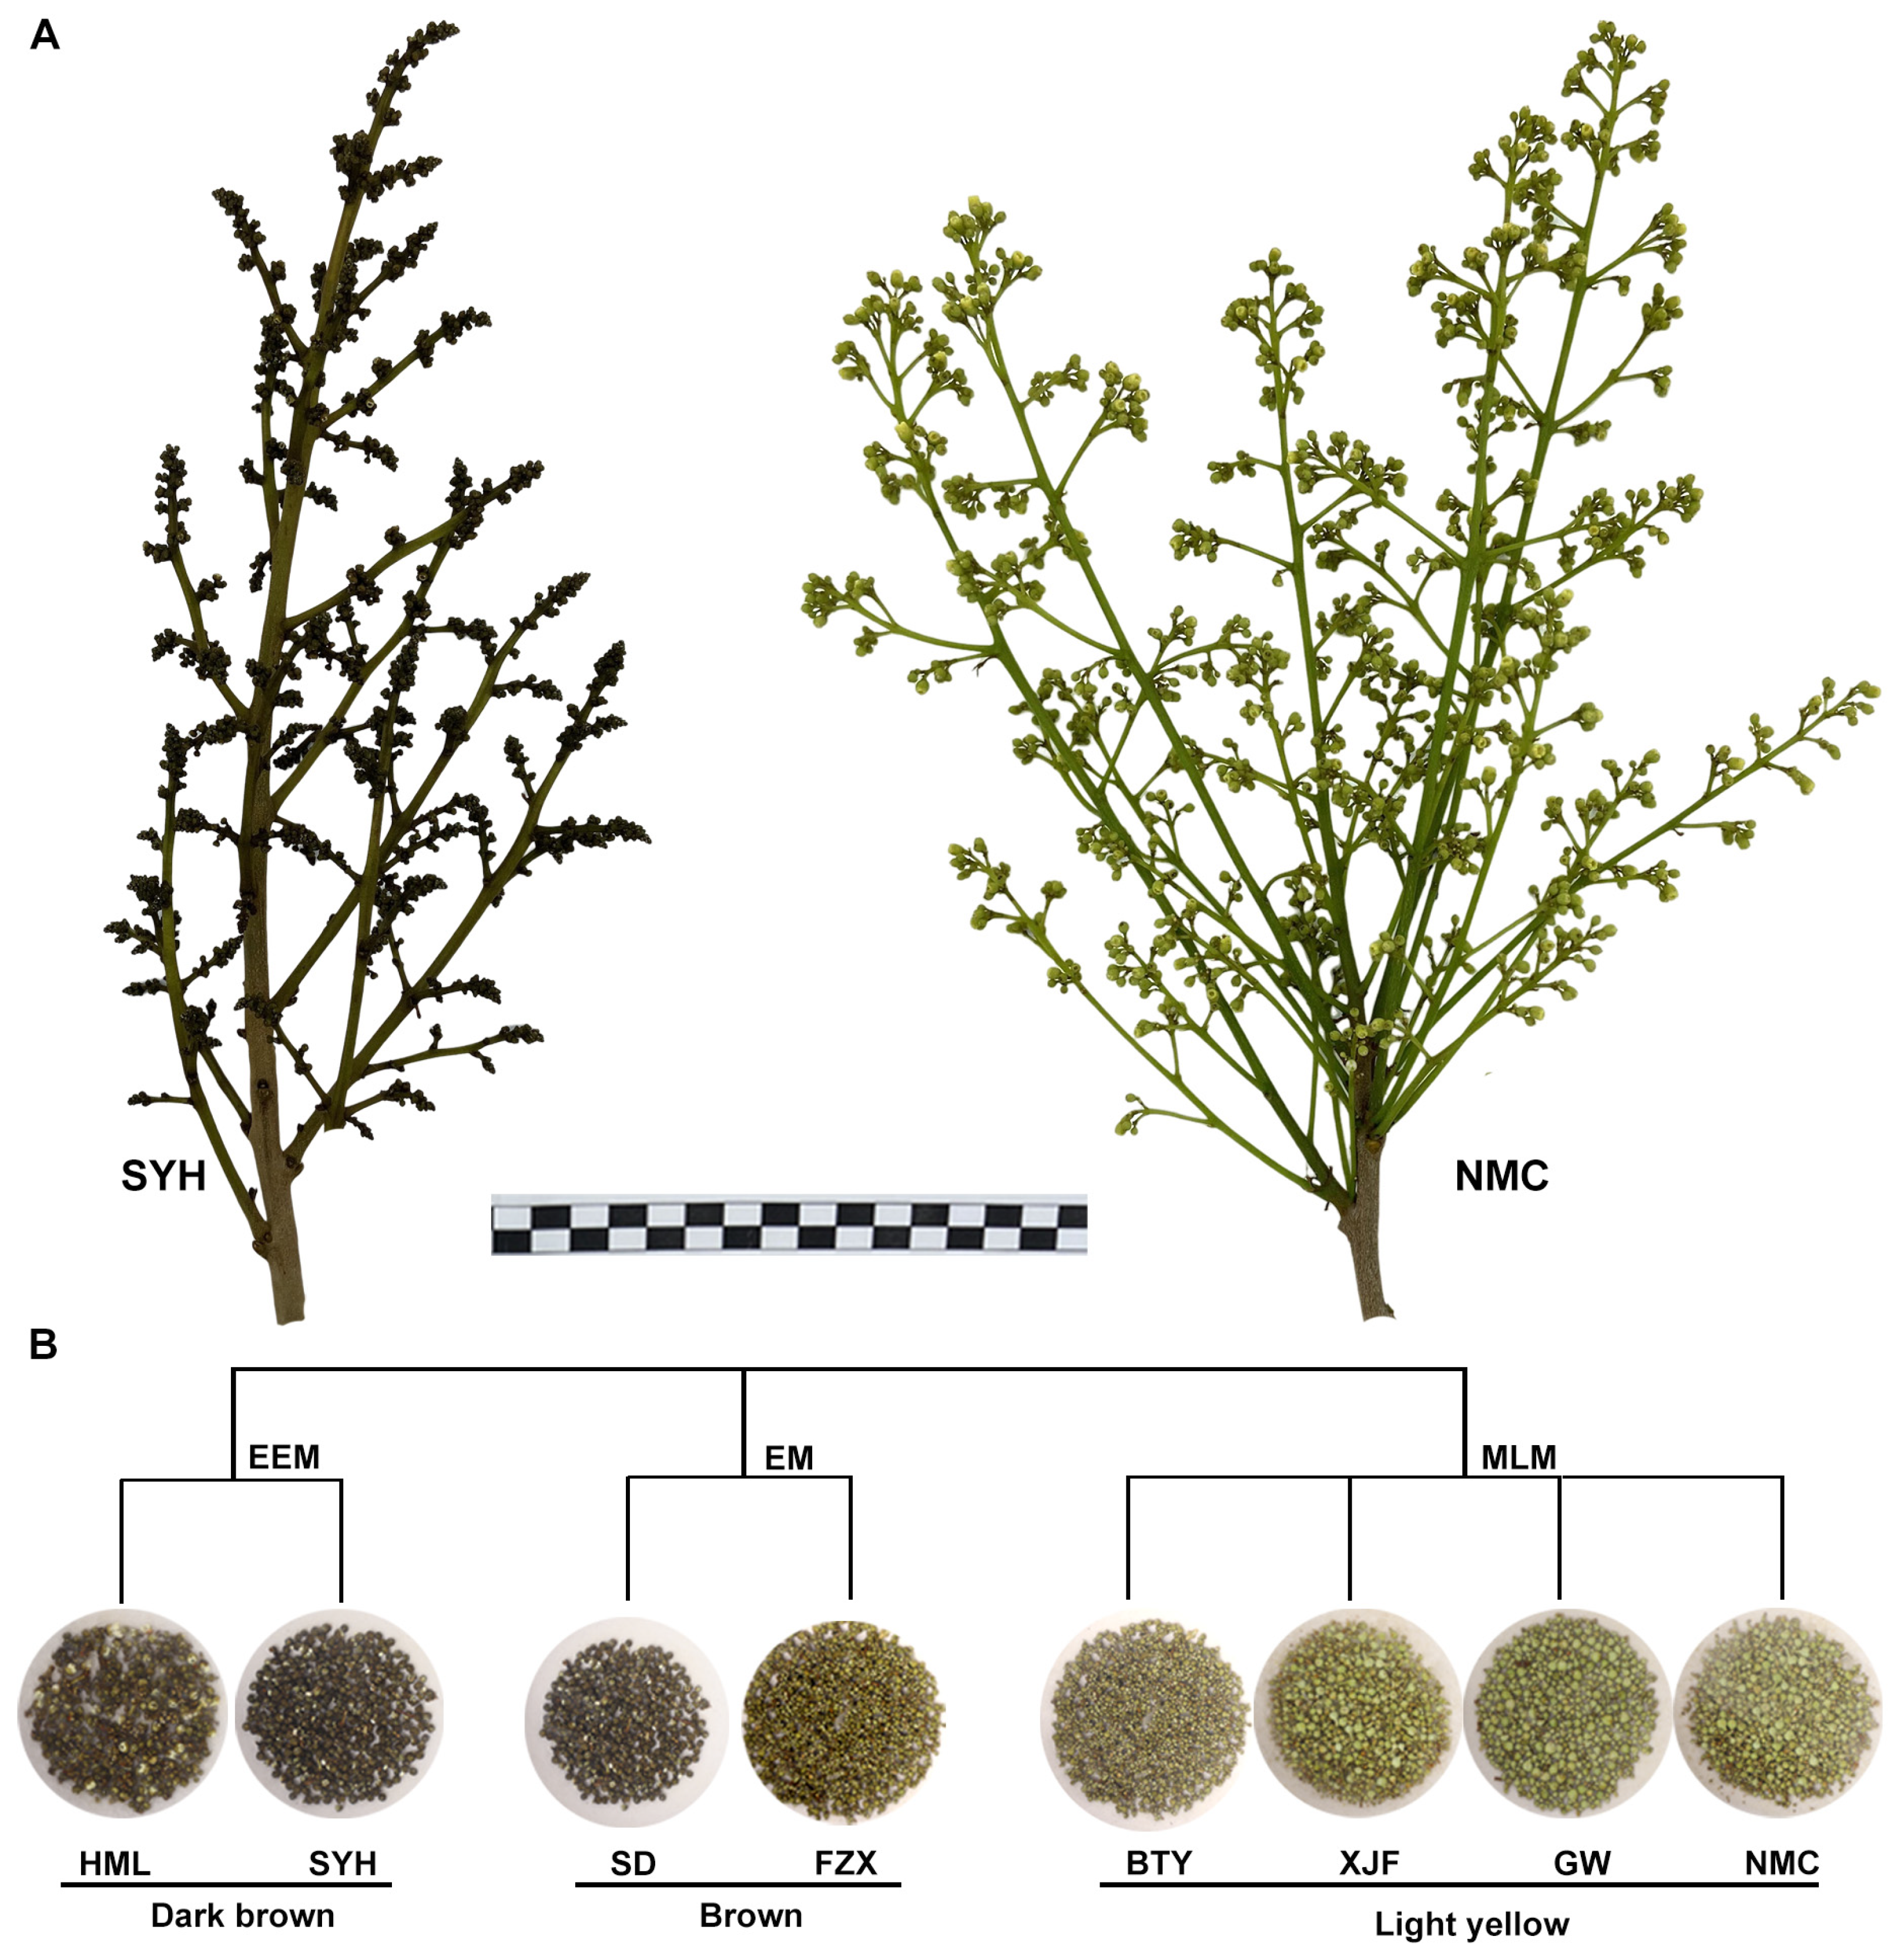
2.1. Plant Materials

Two representative EEM cultivars: ‘Hemaoli’ (‘HML’) and ‘Sanyuehong’ (‘SYH’); two representative EEM cultivars: ‘Shuidong’ (‘SD’) and ‘Feizixiao’ (‘FZX’); and four representative MLM cultivars: ‘Baitangying’ (‘BTY’), ‘Xianjinfeng’ (‘XJF’), ‘Guiwei’ (‘GW’) and ‘Nuomici’ (‘NMC’) grown in the experimental orchard in the Institute of Fruit Tree Research, Guangdong Academy of Agricultural Sciences (Guangzhou, China) were used in this study. Three biological replicates were selected for each cultivar. The dark brown flower buds of EEM cultivars, the brown flower buds of EM cultivars and the light yellow flower buds of MLM cultivars were harvested in November 2022, January 2023 and March 2023, respectively. Then, the flower buds of each tree were harvested and stored at −80 °C for subsequent LC-MS/MS and RNA-seq analyses.
Furthermore, in order to explore the regulation of candidate genes in response to UV-B radiation, UV-B treatment was also conducted for flower buds for the above cultivars. Specifically, flower buds of each tree were collected and immediately transferred to plant growth chamber (Blupard, Shanghai, China) under 25 °C and daily light, with humidity maintained at 90% to prevent water loss. The UV-B radiation (30 μmol m−2s−1) was applied to flower bud sample for 6 h using Philips NARROWBAND TL 20 W/01 RS tube with a characteristic peak at 311 nm (Philips Electronics, Eindhoven, The Netherlands), which was wrapped by cellulose diacetate filter (Courtaulds Chemicals, Derby, UK). Then, the flower buds were collected and stored at −80 °C for subsequent experiments.

2.2. Metabolite Extraction, LC-MS/MS Conditions and Metabolite Analyses

Extraction of metabolites was performed based on the chemical characters of multi-targeted metabolites. Briefly, 600 μL ice-cold MeOH-water (2:1, v/v, containing IS) was added into 200 mg freeze-dried litchi flower buds. The samples were extracted by ultrasound for 30 min with ice-water bath, and centrifuged at 4 °C (14,000× g) for 15 min. The supernatant was transferred to sample vials and then 400μL ice-cold MeOH-water (2:1, v/v, containing IS) was added to the residue samples. The samples were extracted once again by ultrasound and centrifuged as above. The two supernatants were combined and mixed well. Then, the supernatant (200 μL) was dried under a nitrogen stream, re-dissolved in 200 μL of MeOH-water (7:18, v/v, containing IS) and then filtered through a 0.22 μm organic phase pinhole filter for subsequent UPLC-MS/MS analysis.
Liquid chromatography was performed on a Nexera UHPLC LC-30A (SHIMADZU, Kyoto, Japan). A Waters ACQUITY UPLC HSS T3 column (2.1 × 100 mm, 1.8 μm) was used for analysis with 5 μL injection volume. The mobile phase A was water containing 0.1% formic acid, and the mobile phase B was ACN. The flow rate is 0.3 mL/min. The gradient conditions were as follows: 0–2 min, 0 B; 2–30 min, 0–50% B; 30–32 min, 50–95% B; 32–34 min, 95% B; 34–34.1 min, 100–0% B; 34.1–35.5min, 0 B. The column temperature was set at 40 °C, while the samples were kept at 4 °C during the detection process. Flavonoid metabolites were analyzed in schedule multiple reaction monitoring (SRM) mode.
The differentially accumulated metabolites (DAMs) were classified by thresholds with|Log2FC| ≥ 1 (p < 0.05) and variable importance in projection (VIP) ≥1 by comparing each cultivar with MLM cultivar ‘NMC’. Kyoto Encyclopedia of Genes and Genomes (KEGG) metabolite enrichment analysis of DAMs was conducted with the OmicShare tools platform (https://www.omicshare.com/tools) (accessed on 1 November 2023) to determine the important pathways in the enriched term.

2.3. RNA Extraction and Transcriptome Sequencing

The total RNA of 24 samples was extracted using the TRIzol reagent (Invitrogen, Carlsbad, CA, USA) based on the manufacturer’s protocol. The purity, concentration and integrity of RNA were evaluated using NanoDrop 2000 spectrophotometer (Thermo Scientific, Waltham, MA, USA) and Agilent 2100 Bioanalyzer (Agilent Technologies, Santa Clara, CA, USA). The RNA-sequencing libraries were constructed using VAHTS Universal V6 RNA-seq Library Prep Kit according to the manufacturer’s instructions. The 24 flower buds’ cDNA libraries were sequenced on a llumina Novaseq 6000 platform at OE Biotech Co., Ltd. (Shanghai, China).

2.4. Transcriptome Analysis

A total of 166.27 G clean data were obtained for the 24 flower bud samples sequenced. In order to obtain the clean reads, the low-quality reads and polluted reads were removed from the raw reads. The clean reads were assembled and mapped to the reference genome (http://www.sapindaceae.com/Download.html) (accessed on 1 October 2023) using HISAT2 v2.0.5 [34]. The FPKM (fragments per kilobase of transcript per million mapped reads) for all genes was used to calculate gene expression by HTSeq-count [35]. The biological duplication of 24 flower bud samples was evaluated by principal component analysis (PCA).
Differentially expressed genes (DEGs) with a relative change threshold of foldchange >2 and FDR < 0.05 were identified from the transcriptome of comparable groups using the DESeq2 [36]. The comparisons of DEGs among different comparisons were depicted by Venn graph. The Kyoto Encyclopedia of Genes and Genomes (KEGG) pathway enrichment and Gene Ontology (GO) analysis of DEGs [37] was performed using the OmicShare tools platform (http://www.omicshare.com/tools) (accessed on 1 November 2023). The heat maps of gene expression profiles were generated by TBtools-ll (Toolbox for Biologists v2.019).

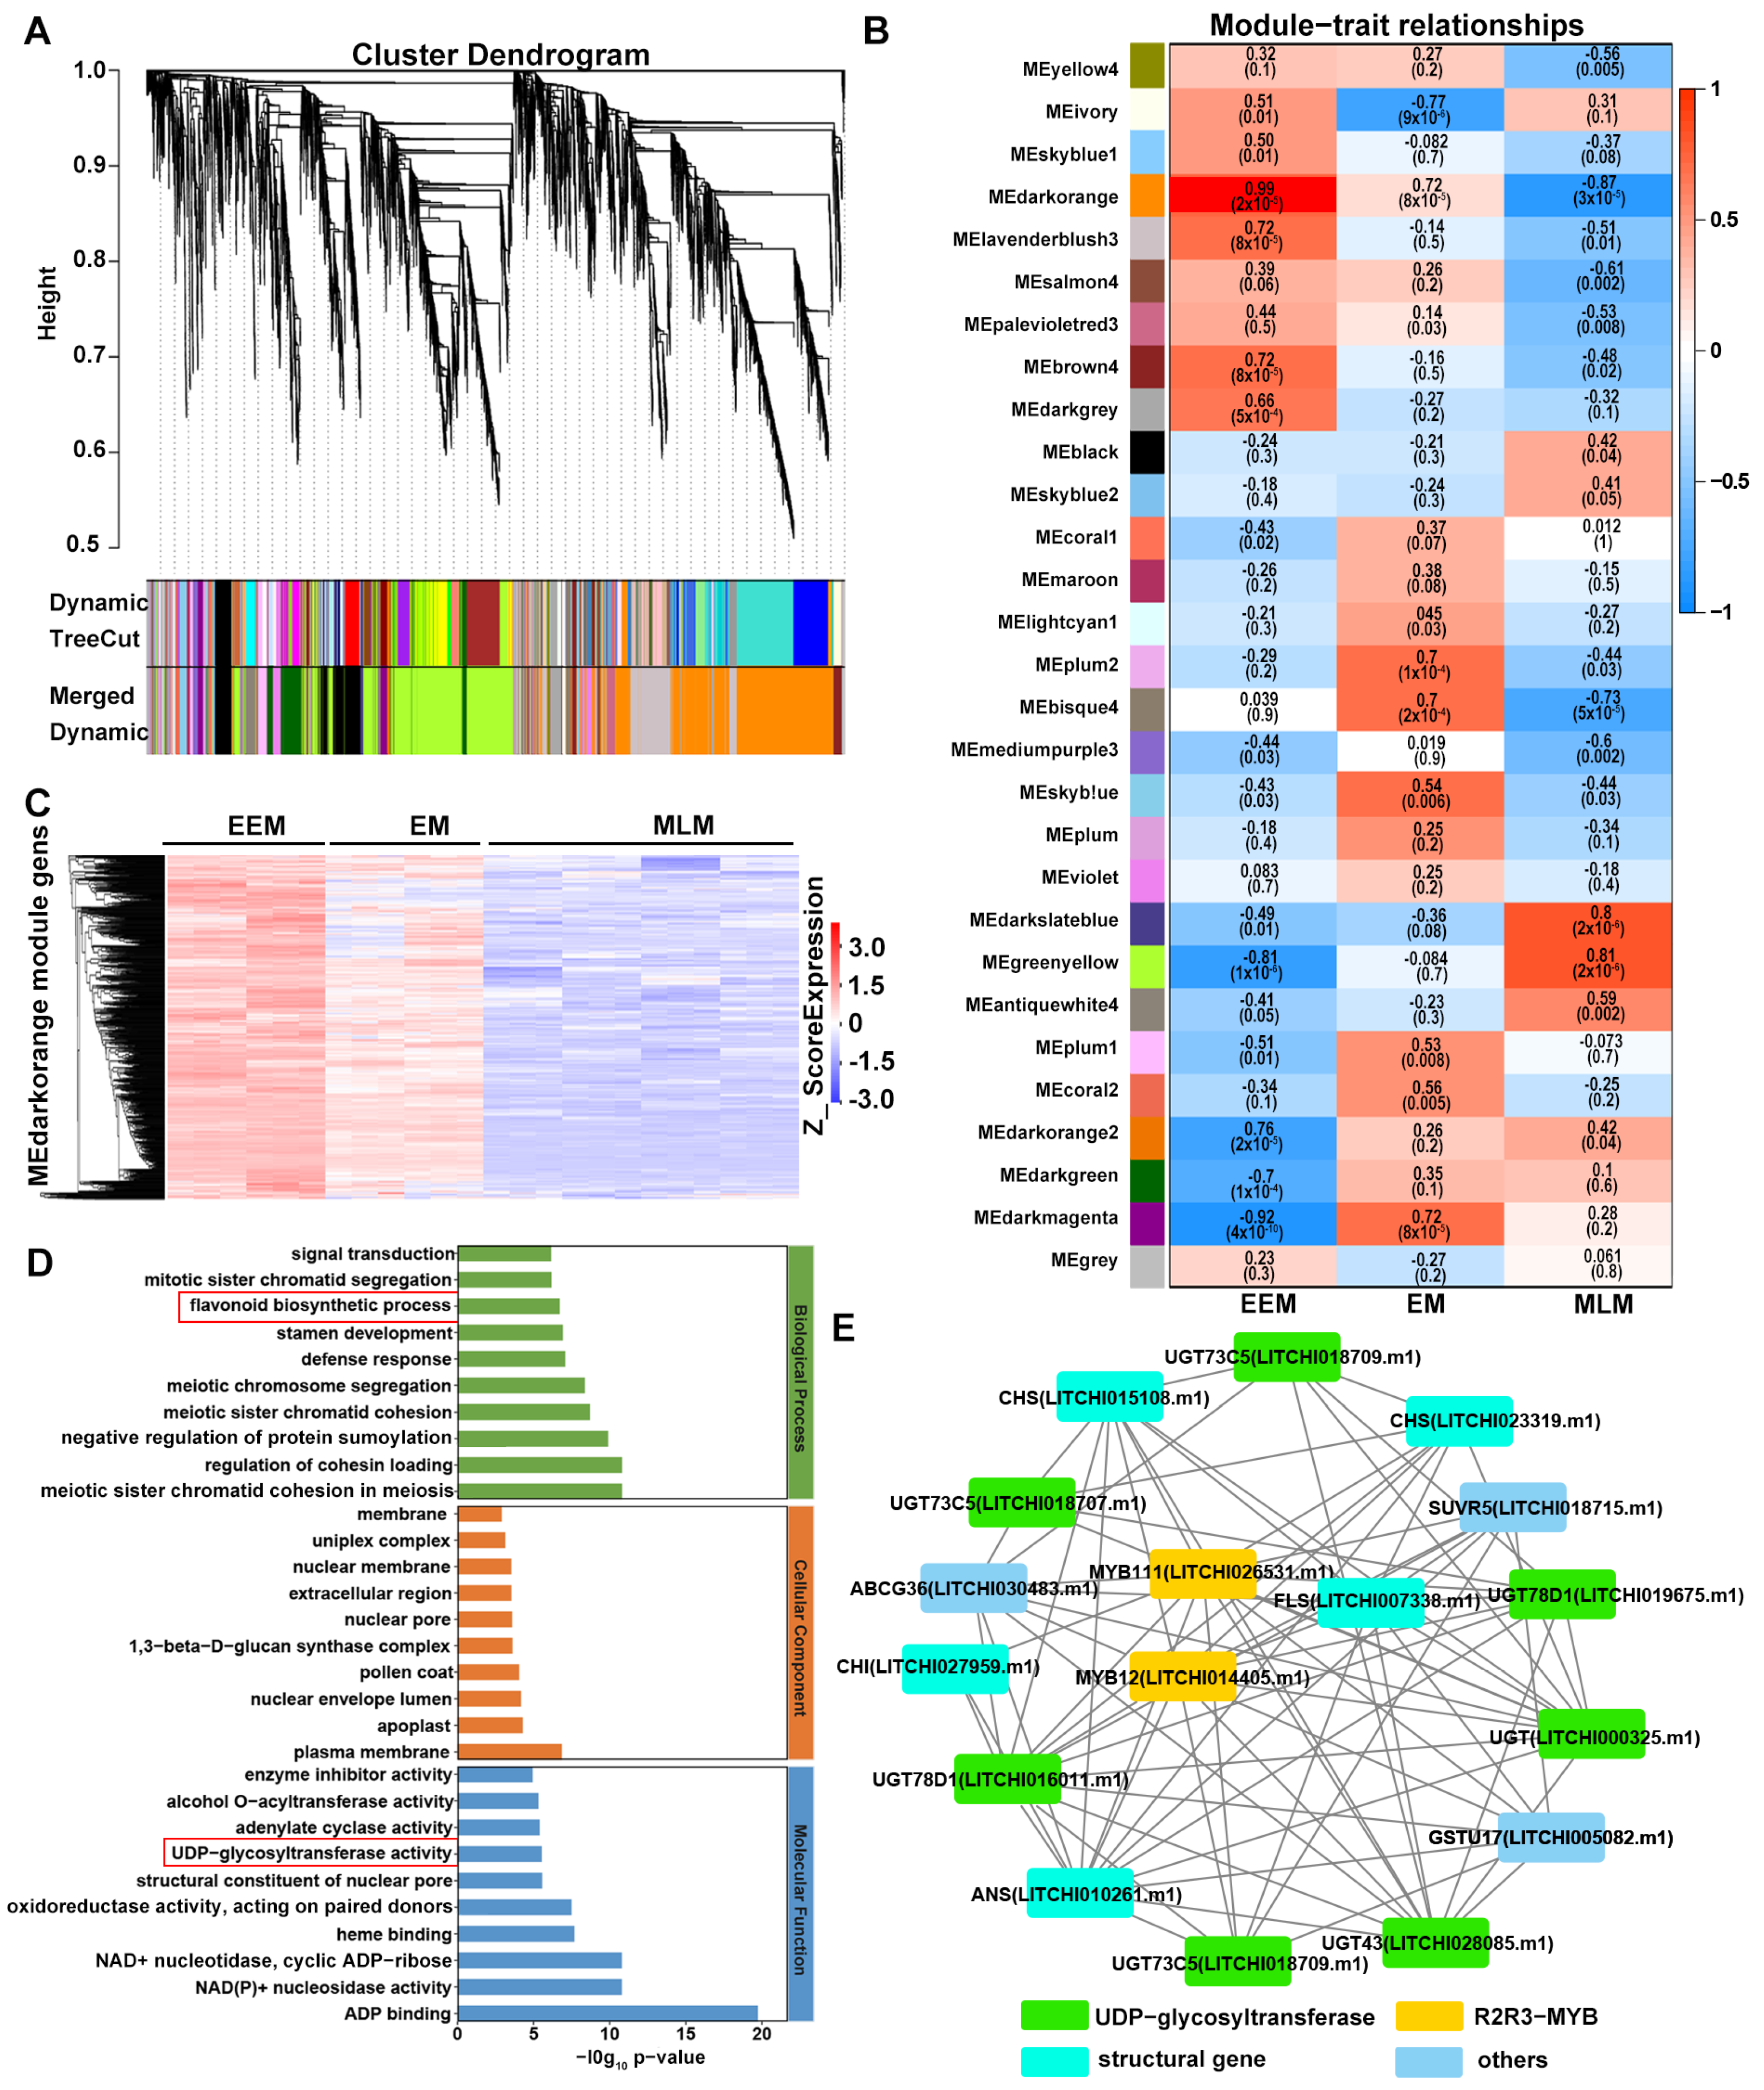
2.5. Weighted Gene Co-Expression Network Analysis (WGCNA)

The weighted gene co-expression network analysis (WGCNA) of DEGs was performed using the OmicShare tools platform (http://www.omicshare.com/tools) (accessed on 1 November 2023) [38,39]. FPKM of the genes from all samples was used for WGCNA analysis. The original data contained 59,630 genes from 24 samples. Genes with low fluctuation of expression (standard deviation ≤ 0.5) were filtered out, and finally, 8627 genes from 24 samples were left. Genes with identical expression patterns were grouped into the same module. The correlation of different WGCNA modules with different flower bud colors of EEM, EM and MLM cultivars was analyzed. The genes that highly correlated with the dark brown flower buds of EEM cultivars were visually exported using Cytoscape v3.9.0.

2.6. Real-Time Quantitative PCR Analysis (RT-qPCR)

Nine randomly selected candidate genes were used to evaluate the RNA-seq results by qRT-PCR analysis. In addition, expression pattern of LcMYB12 and LcMYB111 in flower buds after treatment of UV-B radiation was also analyzed by qRT-PCR, and LcACTIN was the internal reference. The primers used for qRT-PCR are listed in Table S1.
The total RNA was isolated from the flower buds using the RNAprep Pure Plant Plus Kit (TIANGEN, Beijing, China). cDNA synthesis was performed using the Primescript RT reagent Kit with gDNA Eraser (Perfect Real Time) (TaKaRa, Beijing, China). RT-qPCR analysis was performed using TB Green Ex Taq II (TaKaRa, Beijing, China). RT-qPCR was conducted with three biological repeats based on the manufacturer’s protocols. PCR was carried out in an QuantStudio 5 (Thermofisher, Waltham, MA, USA). The 2−∆∆CT method was used for calculating the relative gene expression level [40].

3. Results

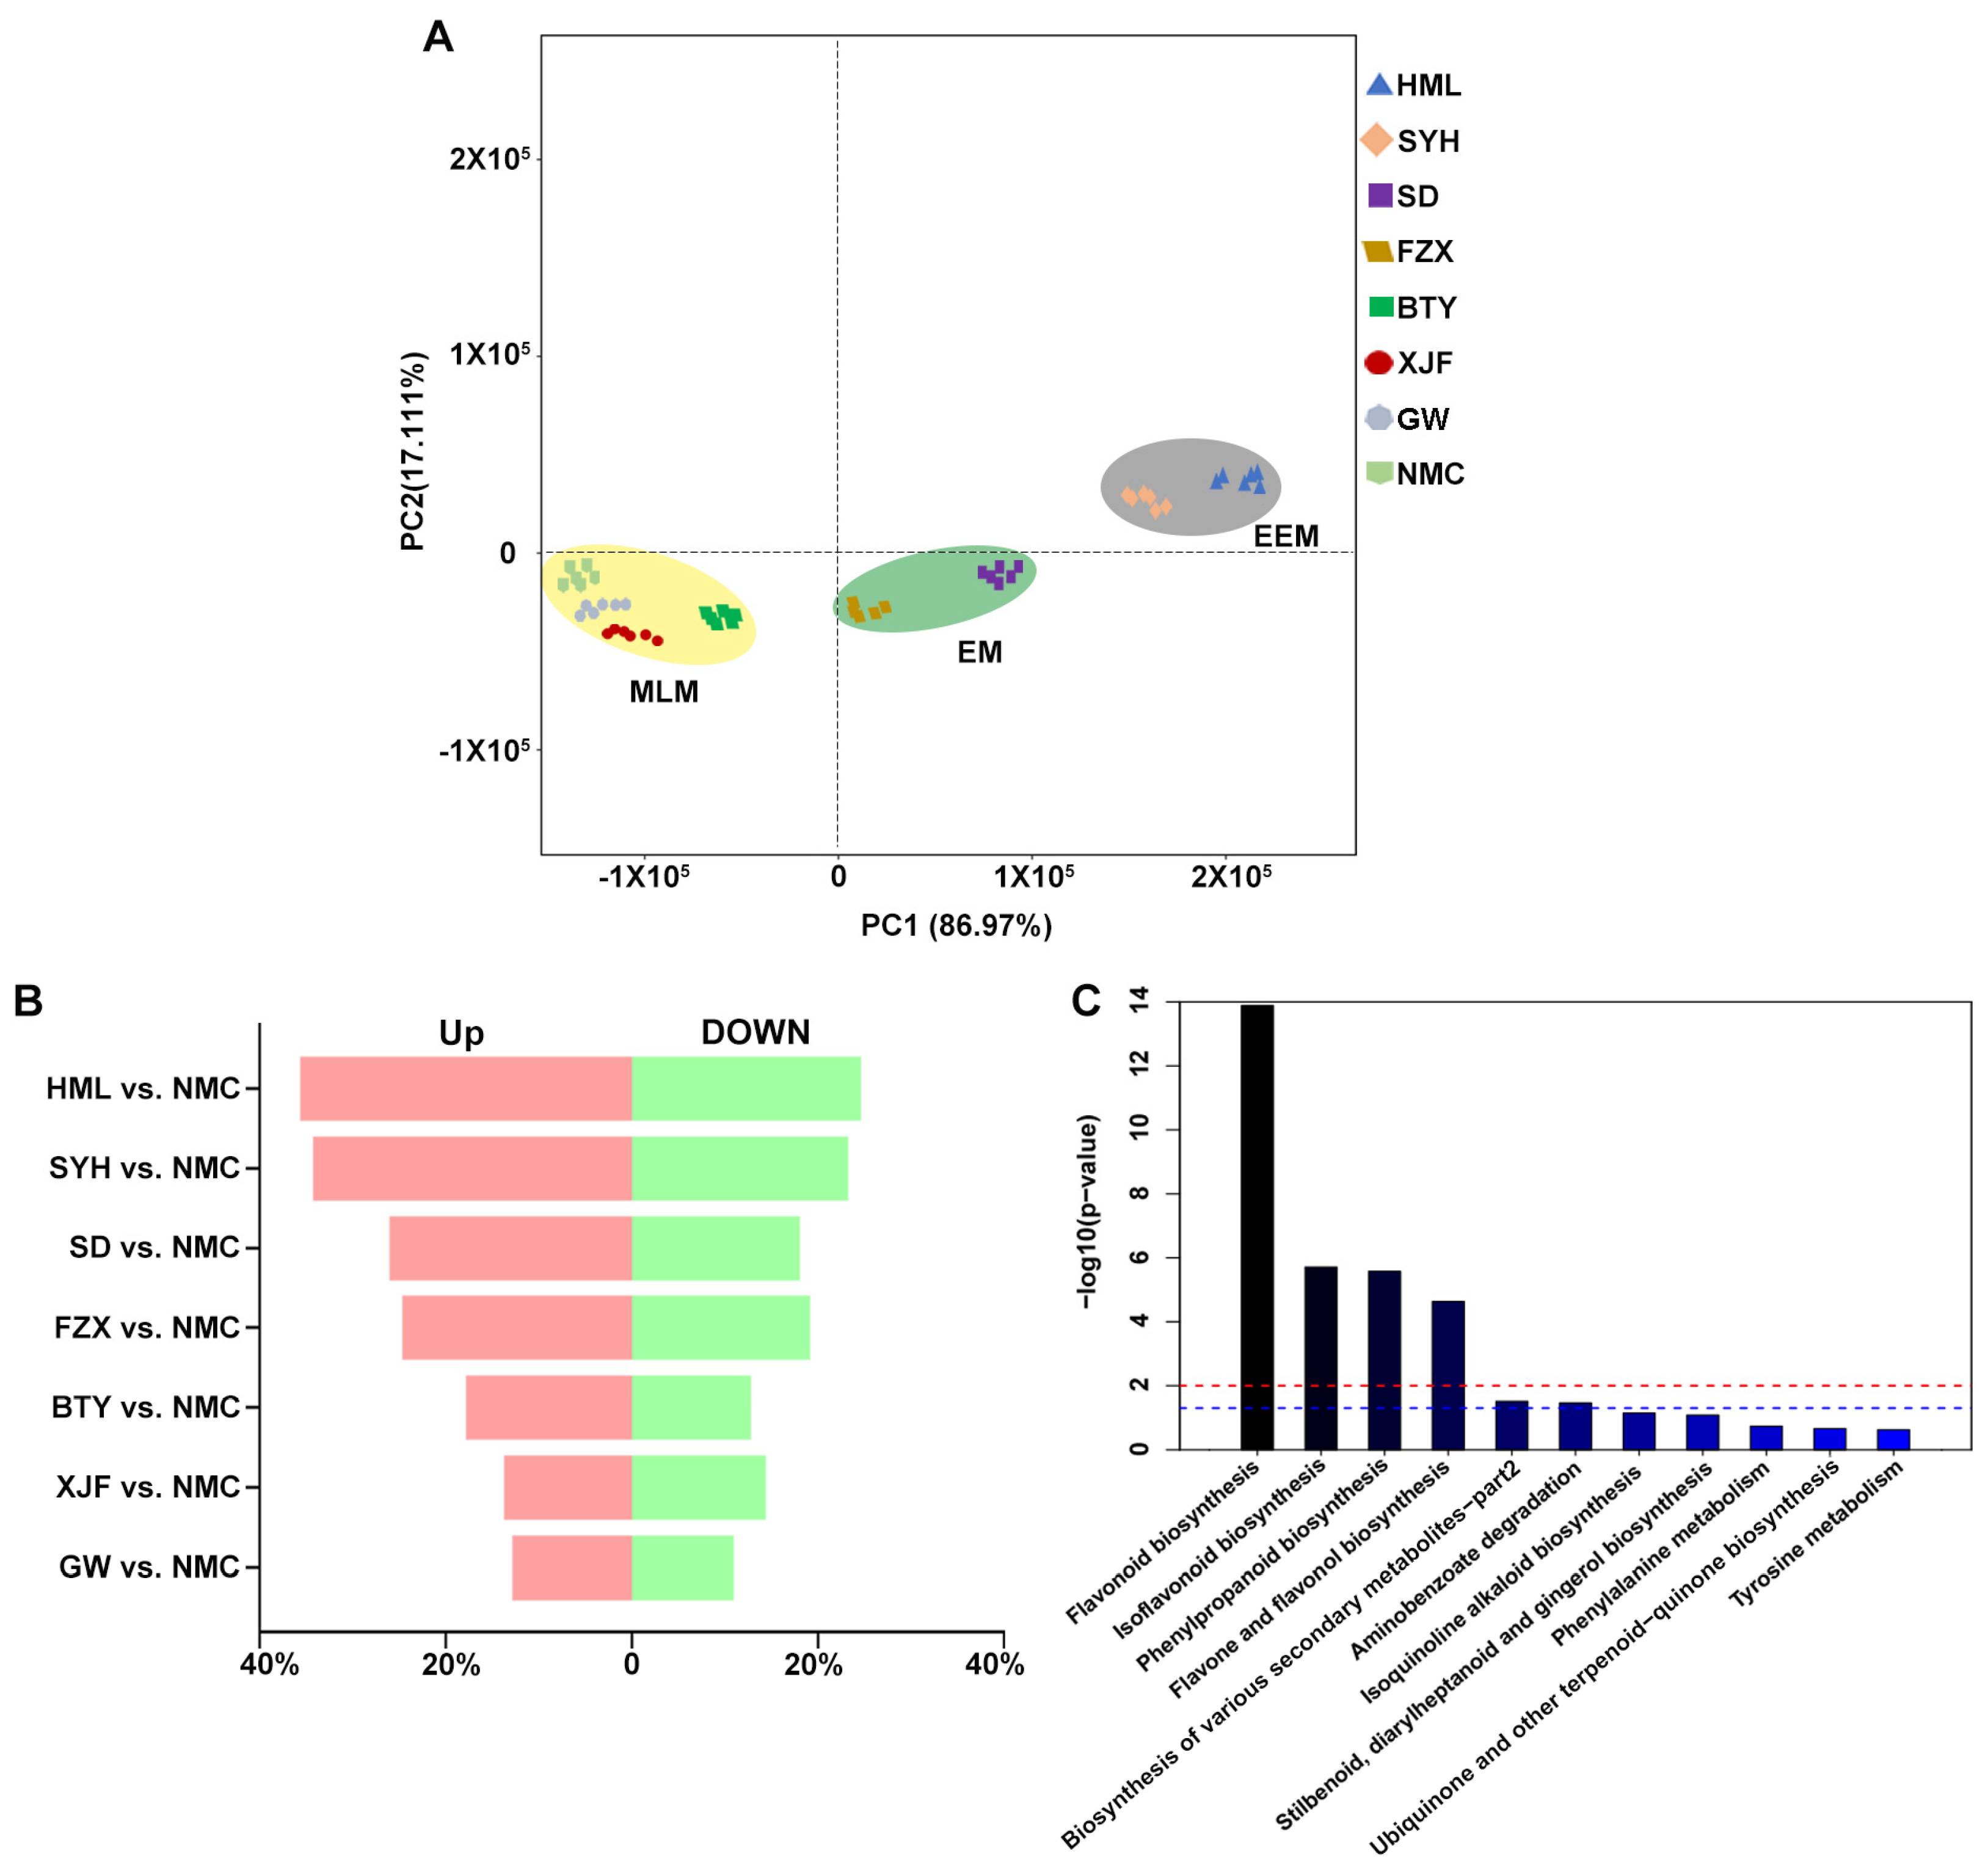
3.1. Analysis of Metabolomic Differences among Dark Brown, Brown and Light Yellow Flower Buds of EEM, EM and MLM Litchi Cultivars

In order to investigate the difference in metabolites underlying the flower buds’ color variation in the adaptation to UV-B radiation, the flower bud samples of two representative EEM cultivars (‘HML’ and ‘SYH’), two representative EM cultivars (‘SD’ and ‘FZX’) and four MLM representative cultivars (‘BTY’, ‘XJF’, ‘GW’ and ‘NMC’) that show dark brown, brown and light yellow colors (Figure 1), respectively, were analyzed by LC-MS/MS. A total of seventy-two flavonoid metabolites were detected, including twenty-two flavonols, nine dihydroflavones, seven flavones, seven benzoic acid derivatives, six phenylpropanoids, six coumarins, three alcohols and polyols, three catechols, two chalcones, two stilbenes, two anthocyanins, two proanthocyanidins, and one dihydroisoflavone (Table S2).
PCA showed that the three biological replicates of each cultivar cluster together (Figure 2A), indicating that the data processing for each sample was reliable. And cultivars with the same flower bud color all clustered together while remaining distant from other groups with different colors (Figure 2A), indicating that the metabolic profiles of flower buds were significantly different among EEM, EM and MLM cultivars. The first PC with 86.97% of the metabolic variance separated the EEM and EM cultivars from the MLM cultivars, while the second PC separated the EEM cultivars from the EM cultivars, which accounted for 17.11% of the metabolic variance between the samples (Figure 2A).
The DAMs were classified by comparing each cultivar with MLM cultivar ‘NMC’ (Figure S1). The percentage of both up-regulated and down-regulated flavonoid metabolites was highest in EEM cultivars (‘HML’ and ‘SYH’) vs. ‘NMC’ comparisons, medium in EM cultivars (‘SD’ and ‘FZX’) vs. ‘NMC’ comparisons, and lowest in MLM cultivars (‘BTY’, ‘XJF’ and ‘GW’) vs. NMC comparisons (Figure 2B). These results suggest that the metabolic profiles of flower buds were most distinct between EEM and MLM cultivars that originated from different regions with high and low UV-B radiation, respectively.
The DAMs from each pairwise combination were further analyzed using the KEGG enrichment analysis. The results indicated that differential metabolites were significantly enriched in flavonoid biosynthesis for all comparisons (Figure 2C and Figure S2). A cluster heat map was further plotted for the identified DAMs, and all the DAMs were divided into three groups (Figure 3). Group 1 contained 27 metabolites whose contents were highest in EEM cultivars, medium in EM cultivars and lowest in MLM cultivars; Group 2 contained 14 metabolites whose accumulation pattern was opposite that of Group 1; and Group 3 contained 31 metabolites without a consistent pattern among different groups. Interestingly, flavonol glycosides, including Quercetin 3-rhamnoside, Quercetin 3-galactoside, Quercetin O-glycoside, Kaempferol 3-O-β-rutinoside, Kaempferol 3-rhamnoside and Myricetin 3-galactoside, were all found in Group 1, which showed an extremely high accumulation in the flower buds of EEM cultivars. Therefore, these results suggest that flavonol glycosides are major contributors to the darker color of flower buds of EEM cultivars that originated from regions with high UV-B radiation.

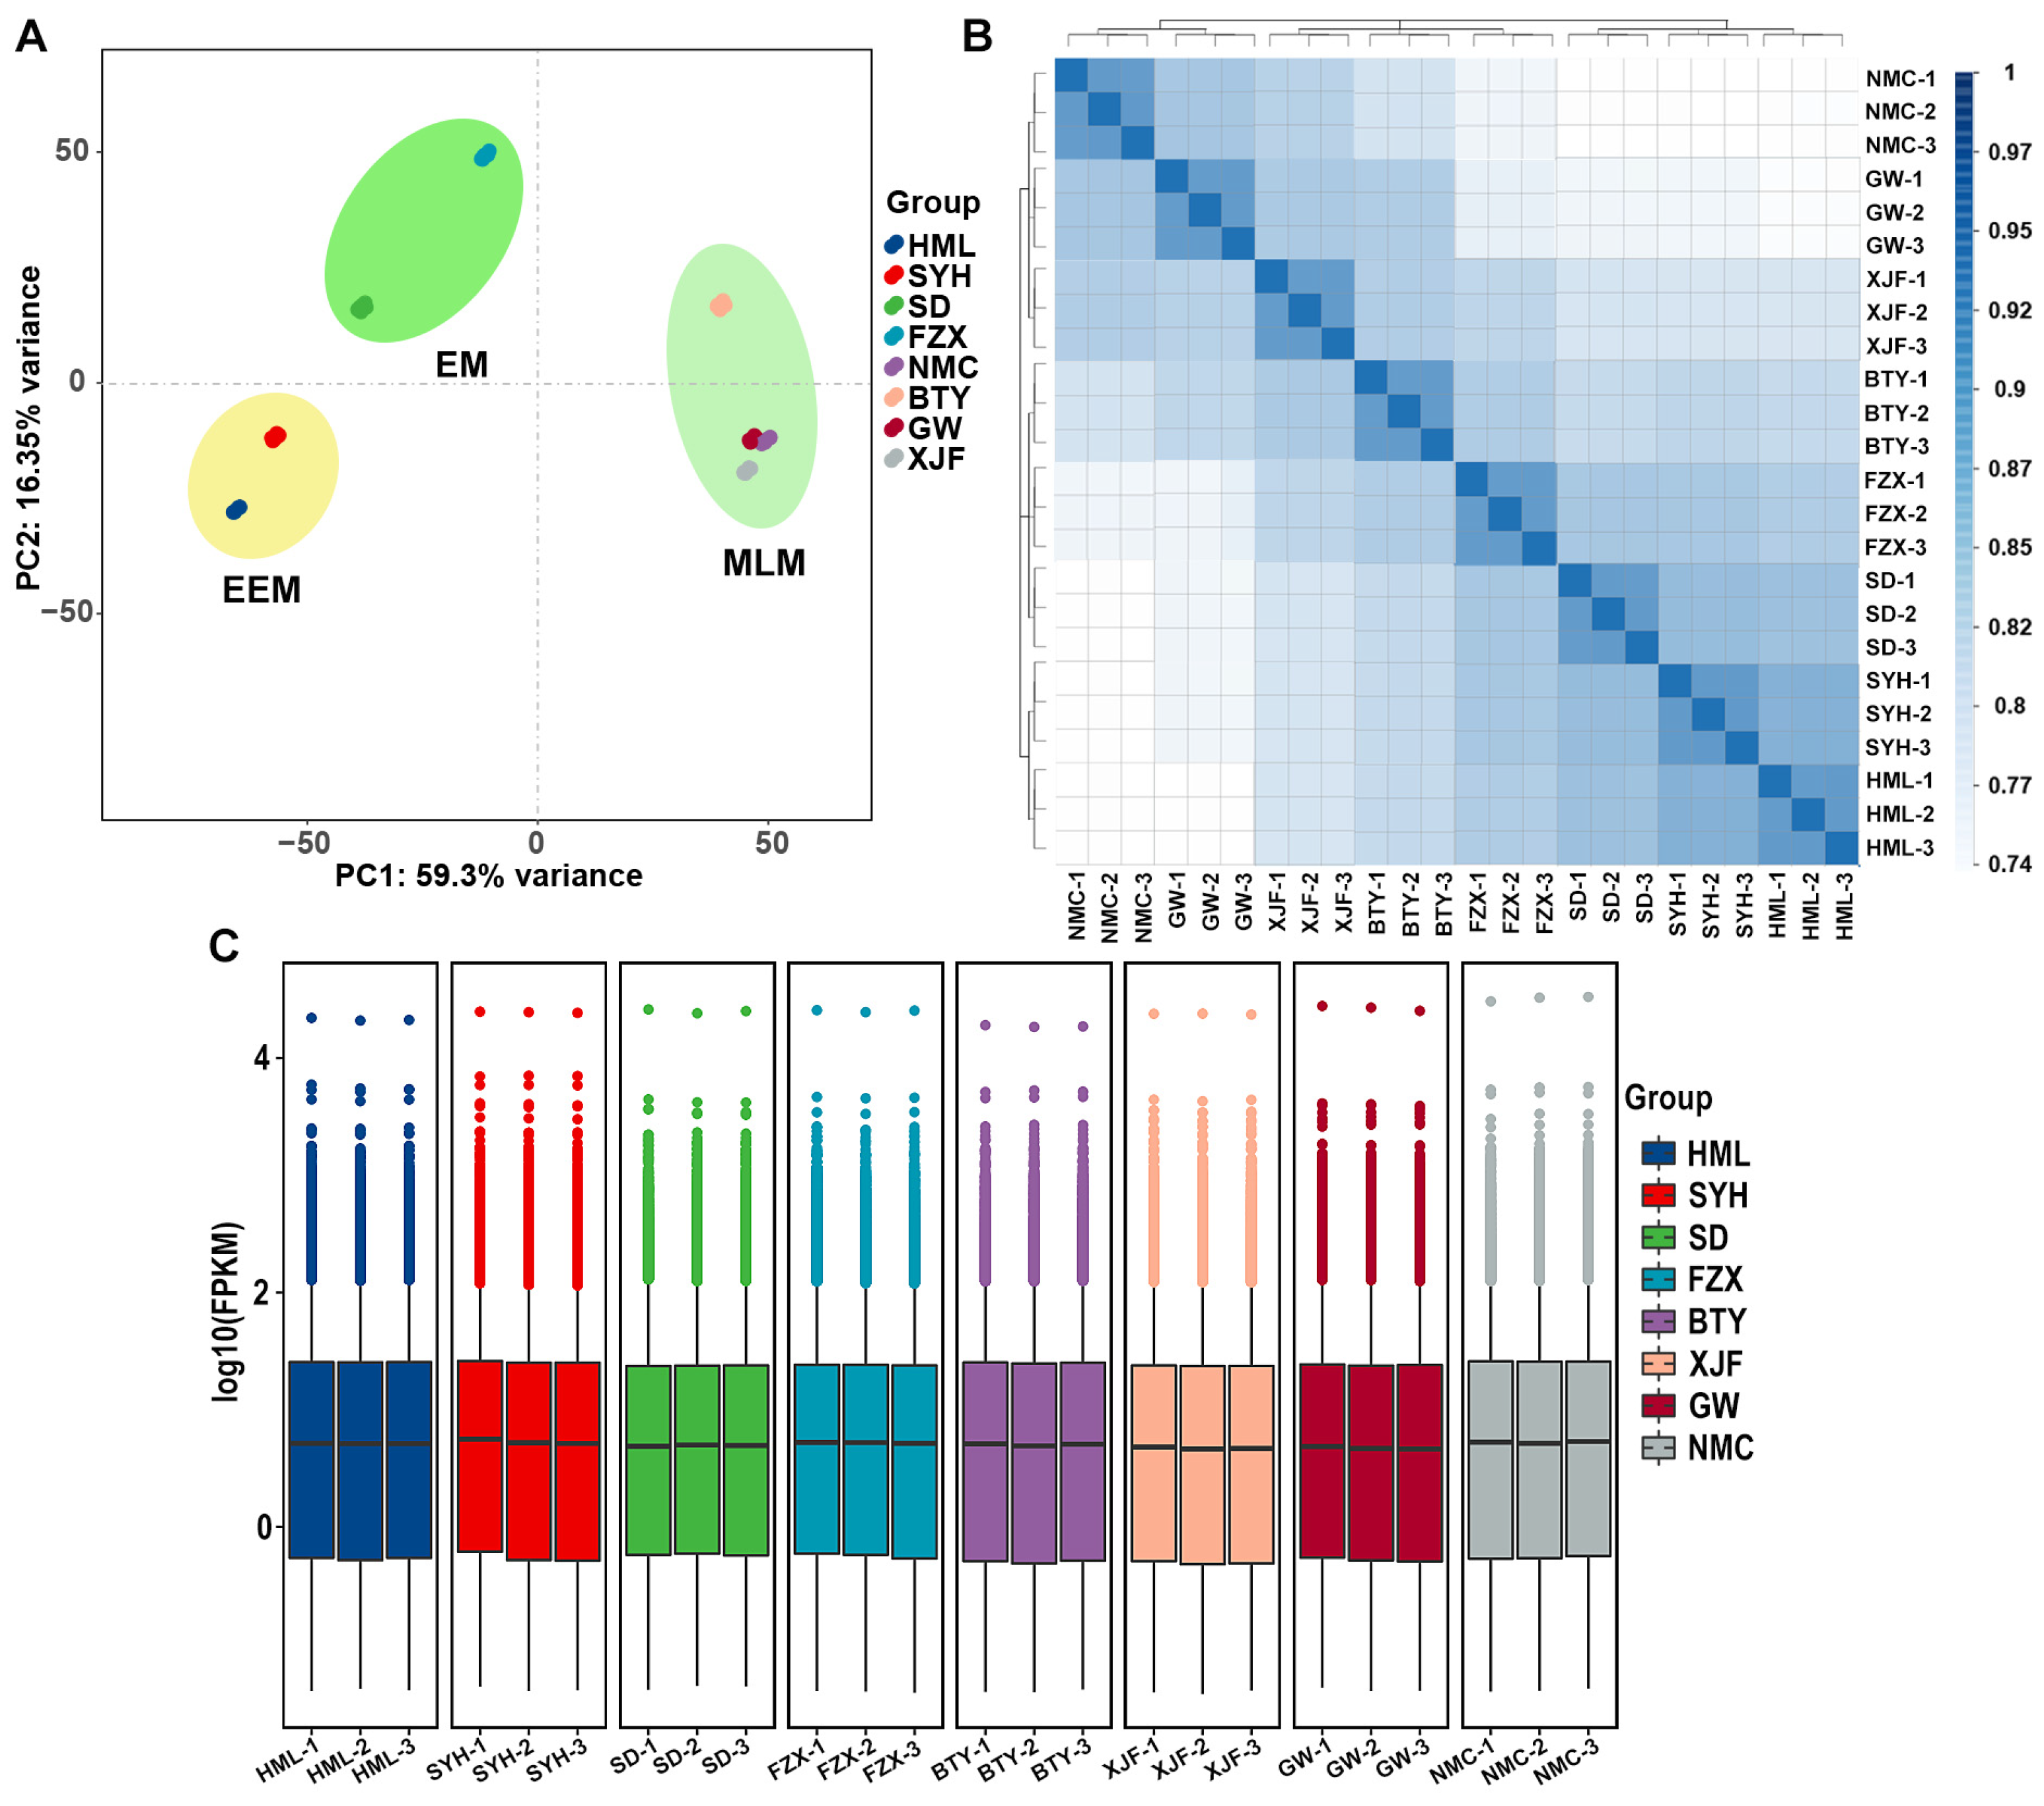
3.2. Summary of Transcriptome Sequencing of Flower Buds of Different Litchi Cultivars

The flower buds of the abovementioned EEM, EM and MLM cultivars were also subjected to RNA-seq to elucidate the molecular mechanism underlying flower bud color variation in adaptation to UV-B radiation. A total of 166.27 GB of clean data from 24 flower bud samples were obtained. The clean data of each flower bud sample ranged from 6.62 to 7.06 Gb in size, the Q30 base distribution percentage was between 93.8 and 94.62% and the average GC content was 45.99% (Table S3). Over 44.41 million clean reads were obtained and aligned to the designated litchi reference genome, with a mapping rate of 90.24–93.35% (Table S3). More than 84.84% of the valid reads were uniquely mapped in the reference genome (Table S3).
PCA analysis classified all samples into three distinct groups, which were EEM (‘HML’ and ‘SYH’), EM (‘SD’ and ‘FZX’) and MLM (‘BTY’, ‘XJF’, ‘GW’ and ‘NMC’) (Figure 4A). This result indicates that the gene expression profiles of flower buds were significantly different among EEM, EM and MLM cultivars. The MLM cultivars were separated from EEM and EM cultivars in the PC1 dimension, and the PC2 dimension segregated EEM and EM cultivars (Figure 4A). The high Pearson coefficient between all replicates (r > 0.88) suggests robust reproducibility (Figure 4B). The box histogram shows that the gene expression distribution in eight cultivars was basically consistent (Figure 4C).

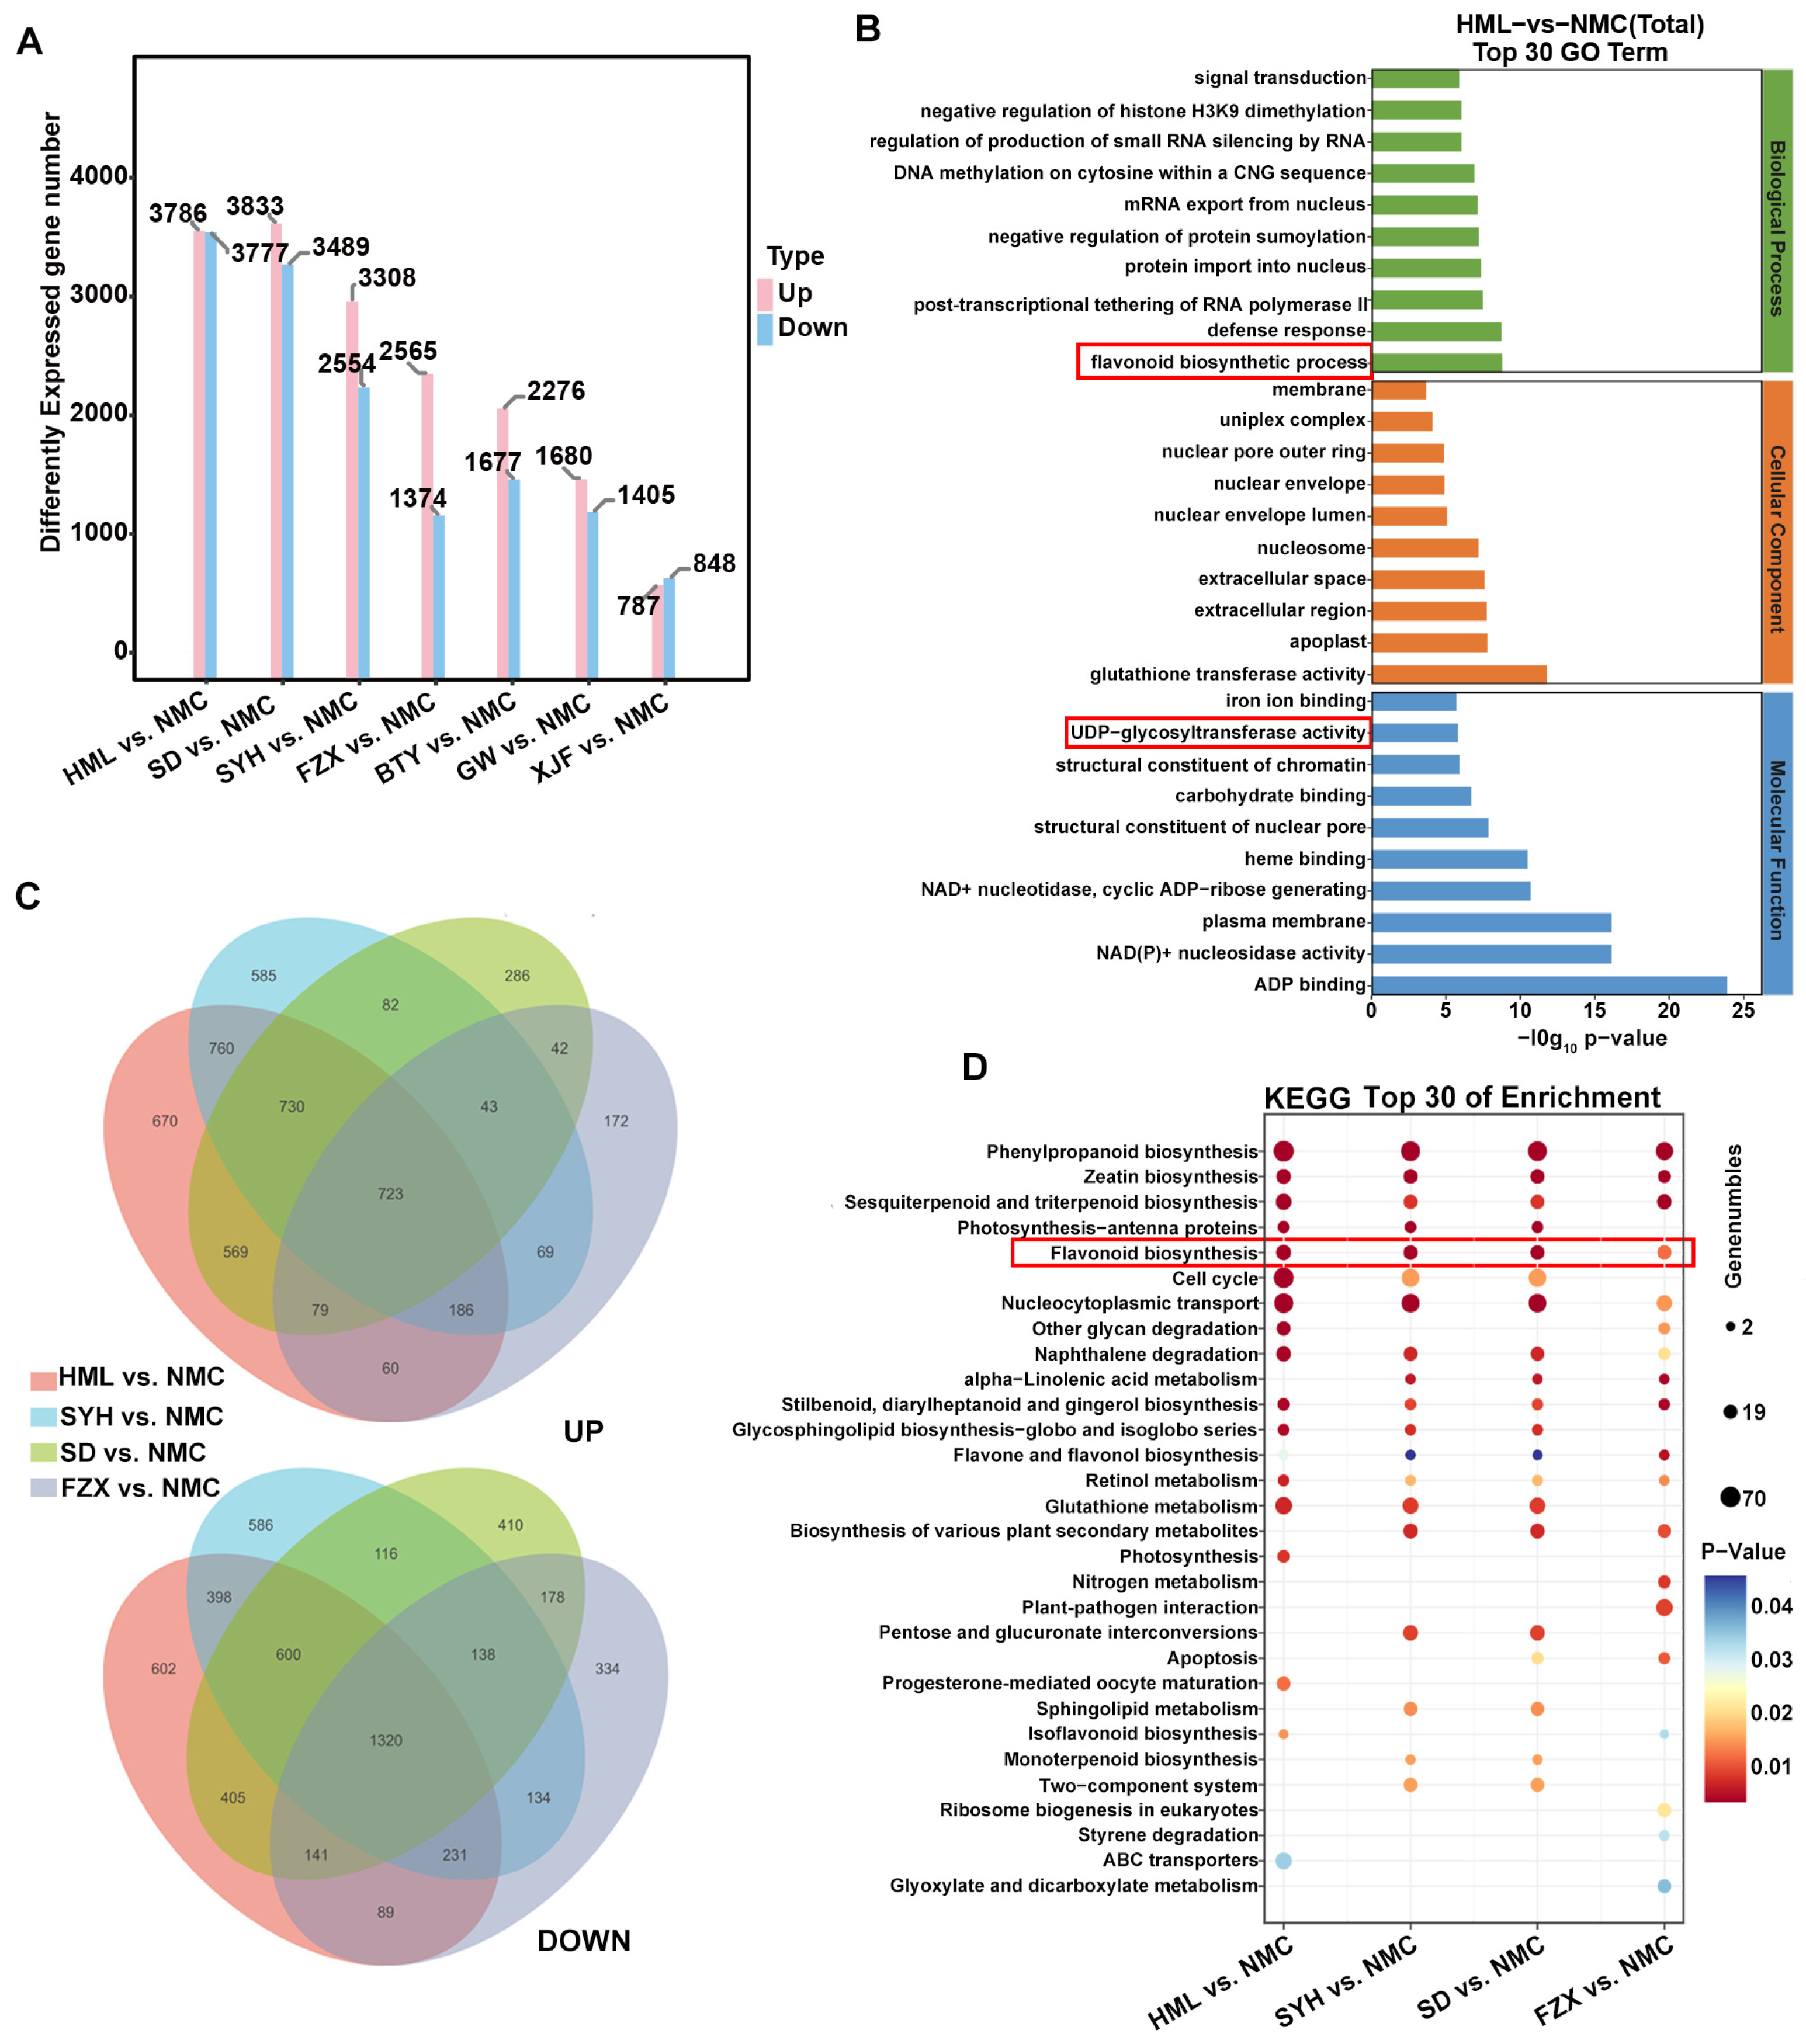
3.3. Analysis of DEGs among Dark Brown, Brown and Light Yellow Flower Buds of EEM, EM and MLM Litchi Cultivars

To further compare the expression profiles of genes among dark brown, brown and light yellow flower buds of EEM, EM and MLM cultivars, DEGs were identified from pairwise comparisons of the MLM cultivar ‘NMC’ with the others. The numbles of up-regulated and down-regulated DEGs of EEM cultivars (‘HML’ and ‘SYH’) vs. ‘NMC’ comparisons, EM cultivars (‘SD’ and ‘FZX’) vs. ‘NMC’ comparisons and MLM cultivars (‘BTY’, ‘GW’ and ‘XJF’) vs. ‘NMC’ comparisons declined gradually from 3786 to 787 and from 3777 to 848, respectively (Figure 5A). The Venn diagram identified 1320 down-regulated and 723 up-regulated DEGs that were common among the four comparisons of ‘HML’ vs. ‘NMC’, ‘SYH vs. ‘NMC’, ‘SD’ vs. ‘NMC’ and ‘FZX’ vs. ‘NMC’, while 670, 585, 266 and 172 DEGs were only up-regulated and 602, 586, 410 and 334 DEGs were only down-regulated in each of the four comparisons, respectively (Figure 5B).
GO enrichment and KEGG pathway enrichment analyses were further performed to explore the functions of DEGs. All DEGs were classified into three parts: biological processes, molecular function and cellular components (Figure 5C and Figure S3). We found that the flavonoid biosynthetic process was enriched in EEM cultivars (‘HML’ and ‘SYH’) vs. ‘NMC’ comparisons and EM cultivars (‘SD’ and ‘FZX’) vs. ‘NMC’ comparisons (Figure 5C). Meanwhile, UDP-glycosyltransferase activity, which categorized molecular function, was enriched in the same comparisons (Figure 5C). KEGG analysis further confirmed the enrichment of the flavonoid biosynthesis pathway in the same comparisons. However, no such enrichment was found in the comparisons of other MLM cultivars (‘BTY’, ‘GW’ and ‘XJF’) vs. ‘NMC’ (Figure S4). These results show that the flavonoid biosynthetic process and UDP-glycosyltransferase activity were directly related to flower bud color variation among EEM, EM and MLM cultivars.

3.4. Candidate Hub Genes Responsible for Flower Bud Color Variation in Adaptation to UV-B Radiation of Litchi

In order to clarify the molecular regulatory network of flavonoid biosynthesis in flower buds of EEM, EM and MLM cultivars, WGCNA was conducted using filtered DEGs. There were 59,630 genes for 24 samples in the original data, the genes with low expression fluctuation (standard deviation ≤ 0.5) were filtered, and, finally, 8627 genes for 24 samples remained for WGCNA analysis (Table S4). A total of 29 modules were clarified, each of which was correlated with flavonoid biosynthesis in the flower buds of EEM, EM and MLM cultivars (Figure 6A,B and Table S5).
The MEdarkorange module was highly positively correlated with the dark brown flower buds of EEM cultivars (Figure 6B). The MEdarkorange module included 2260 genes with a correlation coefficient (r2) of 0.99 (Figure 6B). It could be concluded that genes in the MEdarkorange module played a significant role in flavonoid biosynthesis in dark brown flower buds of EEM cultivars, so the MEdarkorange module was chosen for further research. According to the Z_Score expression of MEdarkorange module genes, the cluster diagram showed that expression of 50 DEGs was highest in the dark brown flower buds of EEM cultivars, medium in brown flower buds of EM cultivars and lowest in light yellow flower buds of MLM cultivars (Figure 6C and Table S6), which might contribute to darker flower buds of EEM cultivars that originated from regions with high UV-B radiation.
Furthermore, GO enrichment analysis showed that 17 and 27 genes were enriched in the flavonoid biosynthetic process and UDP-glycosyltransferase, respectively (Figure 6D and Table S7). A correlation network was further constructed and visualized using Cytoscape v3.9.0. In the network diagram, two R2R3-MYB transcription factors (TFs) LcMYB12 (LITCHI014405.m1) and LcMYB111 (LITCHI026531.m1), two structural genes LcCHI (LITCHI027959.m1) and LcFLS (LITCHI007338.m1) and seven UGTs UGT78D1 (LITCHI019675.m1 and LITCHI016011.m1), LITCHI018790.m1, LITCHI 000325.m1, LITCHI028085.m1, LITCHI018709.m1 and LITCHI018707.m1 showed the highest connectivity in the gene network (Figure 6E and Table S7), indicating that they are hub genes responsible for flower bud color variation of EEM, EM and MLM cultivars.

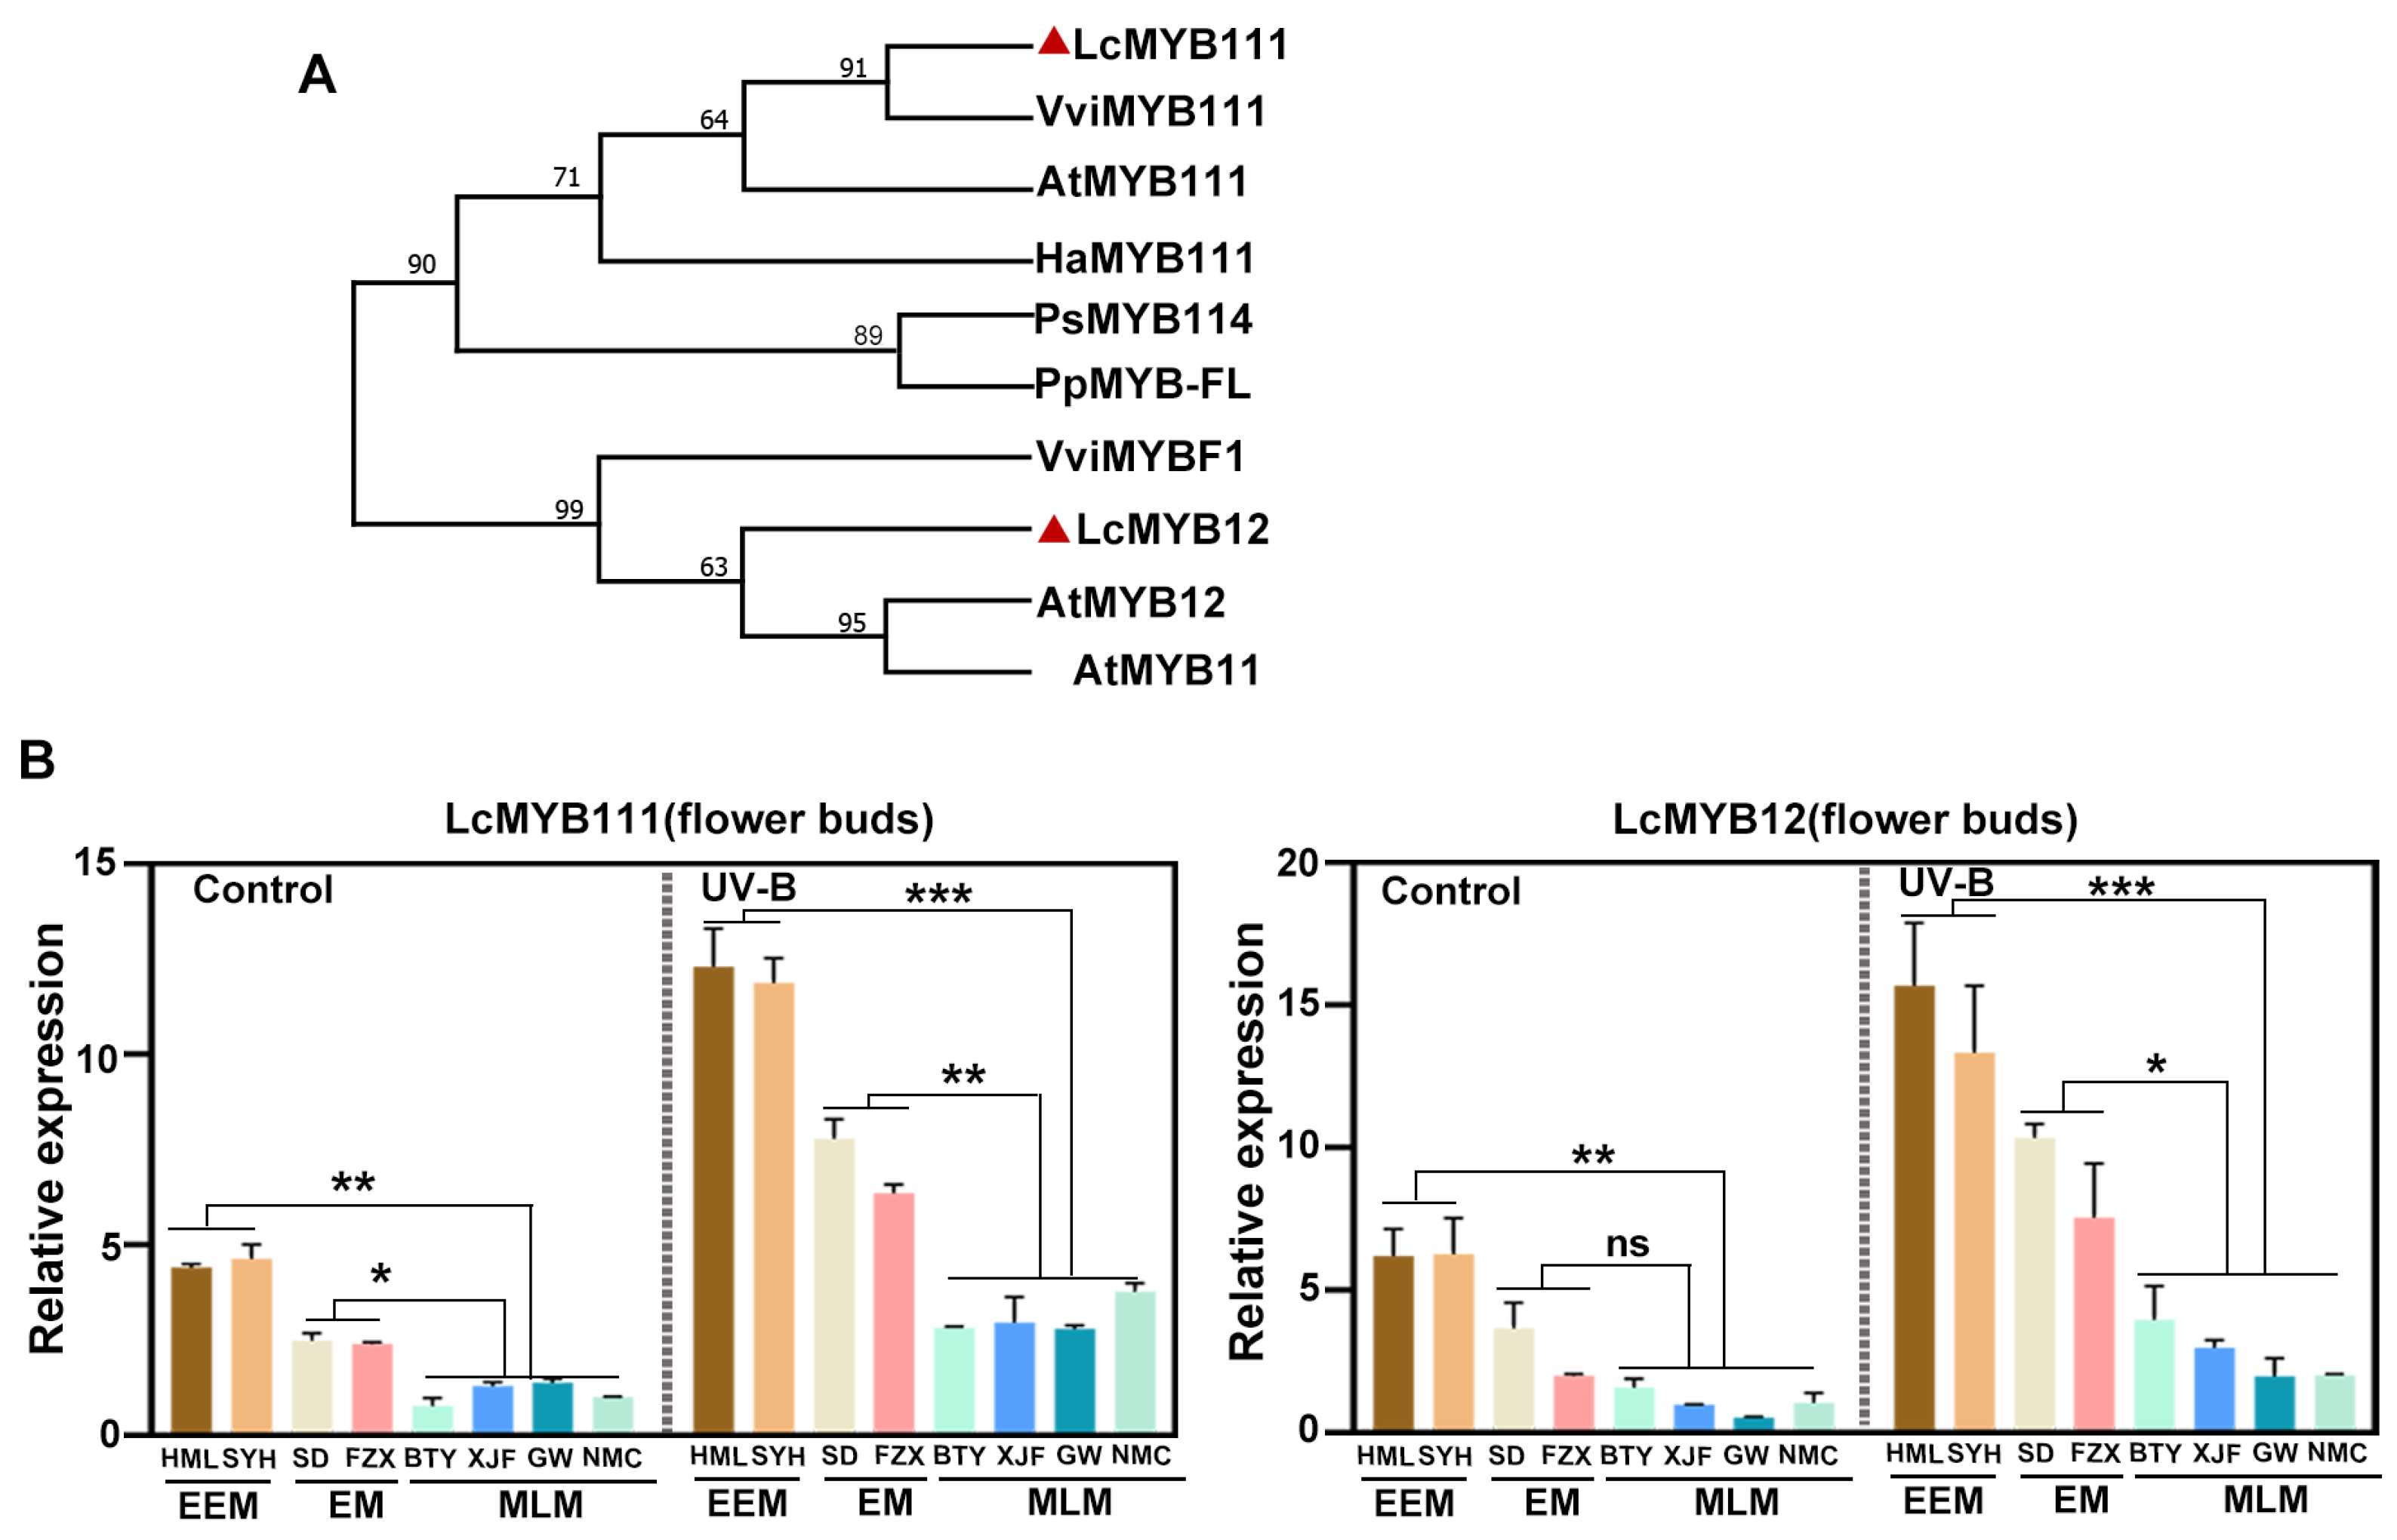
3.5. Key R2R3-MYB Transcription Factors Up-Regulated by UV-B Radiation

As MYB12 and MYB111 have been proven to play a crucial role in the production of flavonol glycoside in response to UV-B radiation [41,42], we further explore the sequence and expression pattern of LcMYB12 and LcMYB111 identified by the above WGCNA analysis. Firstly, a phylogenetic tree was constructed for LcMYB111 and LcMYB12 with other MYB111s, which could be up-regulated by UV-B radiation, including AtMYB111, AtMYB12, HaMYB111 [43], CsMYB12 [44], VcMYB114 [45], PpMYB-FL [46] and VviMYBF1 [47]. Phylogenetic analysis revealed that LcMYB111 clustered together with AtMYB111, while LcMYB12 clustered together with AtMYB12 (Figure 7A), indicating that they are homologs of AtMYB111 and AtMYB12 in litchi. After exposure to UV-B radiation for 6 h, the transcription levels of LcMYB12 and LcMYB111 were all upregulated in flower buds of EEM, EM and MLM cultivars, while the expression level was highest in EEM cultivars, medium in EM cultivars and lowest in MLM cultivars (Figure 7B), indicating their critical roles involved in flower bud color variation in the adaptation to UV-B radiation of litchi.

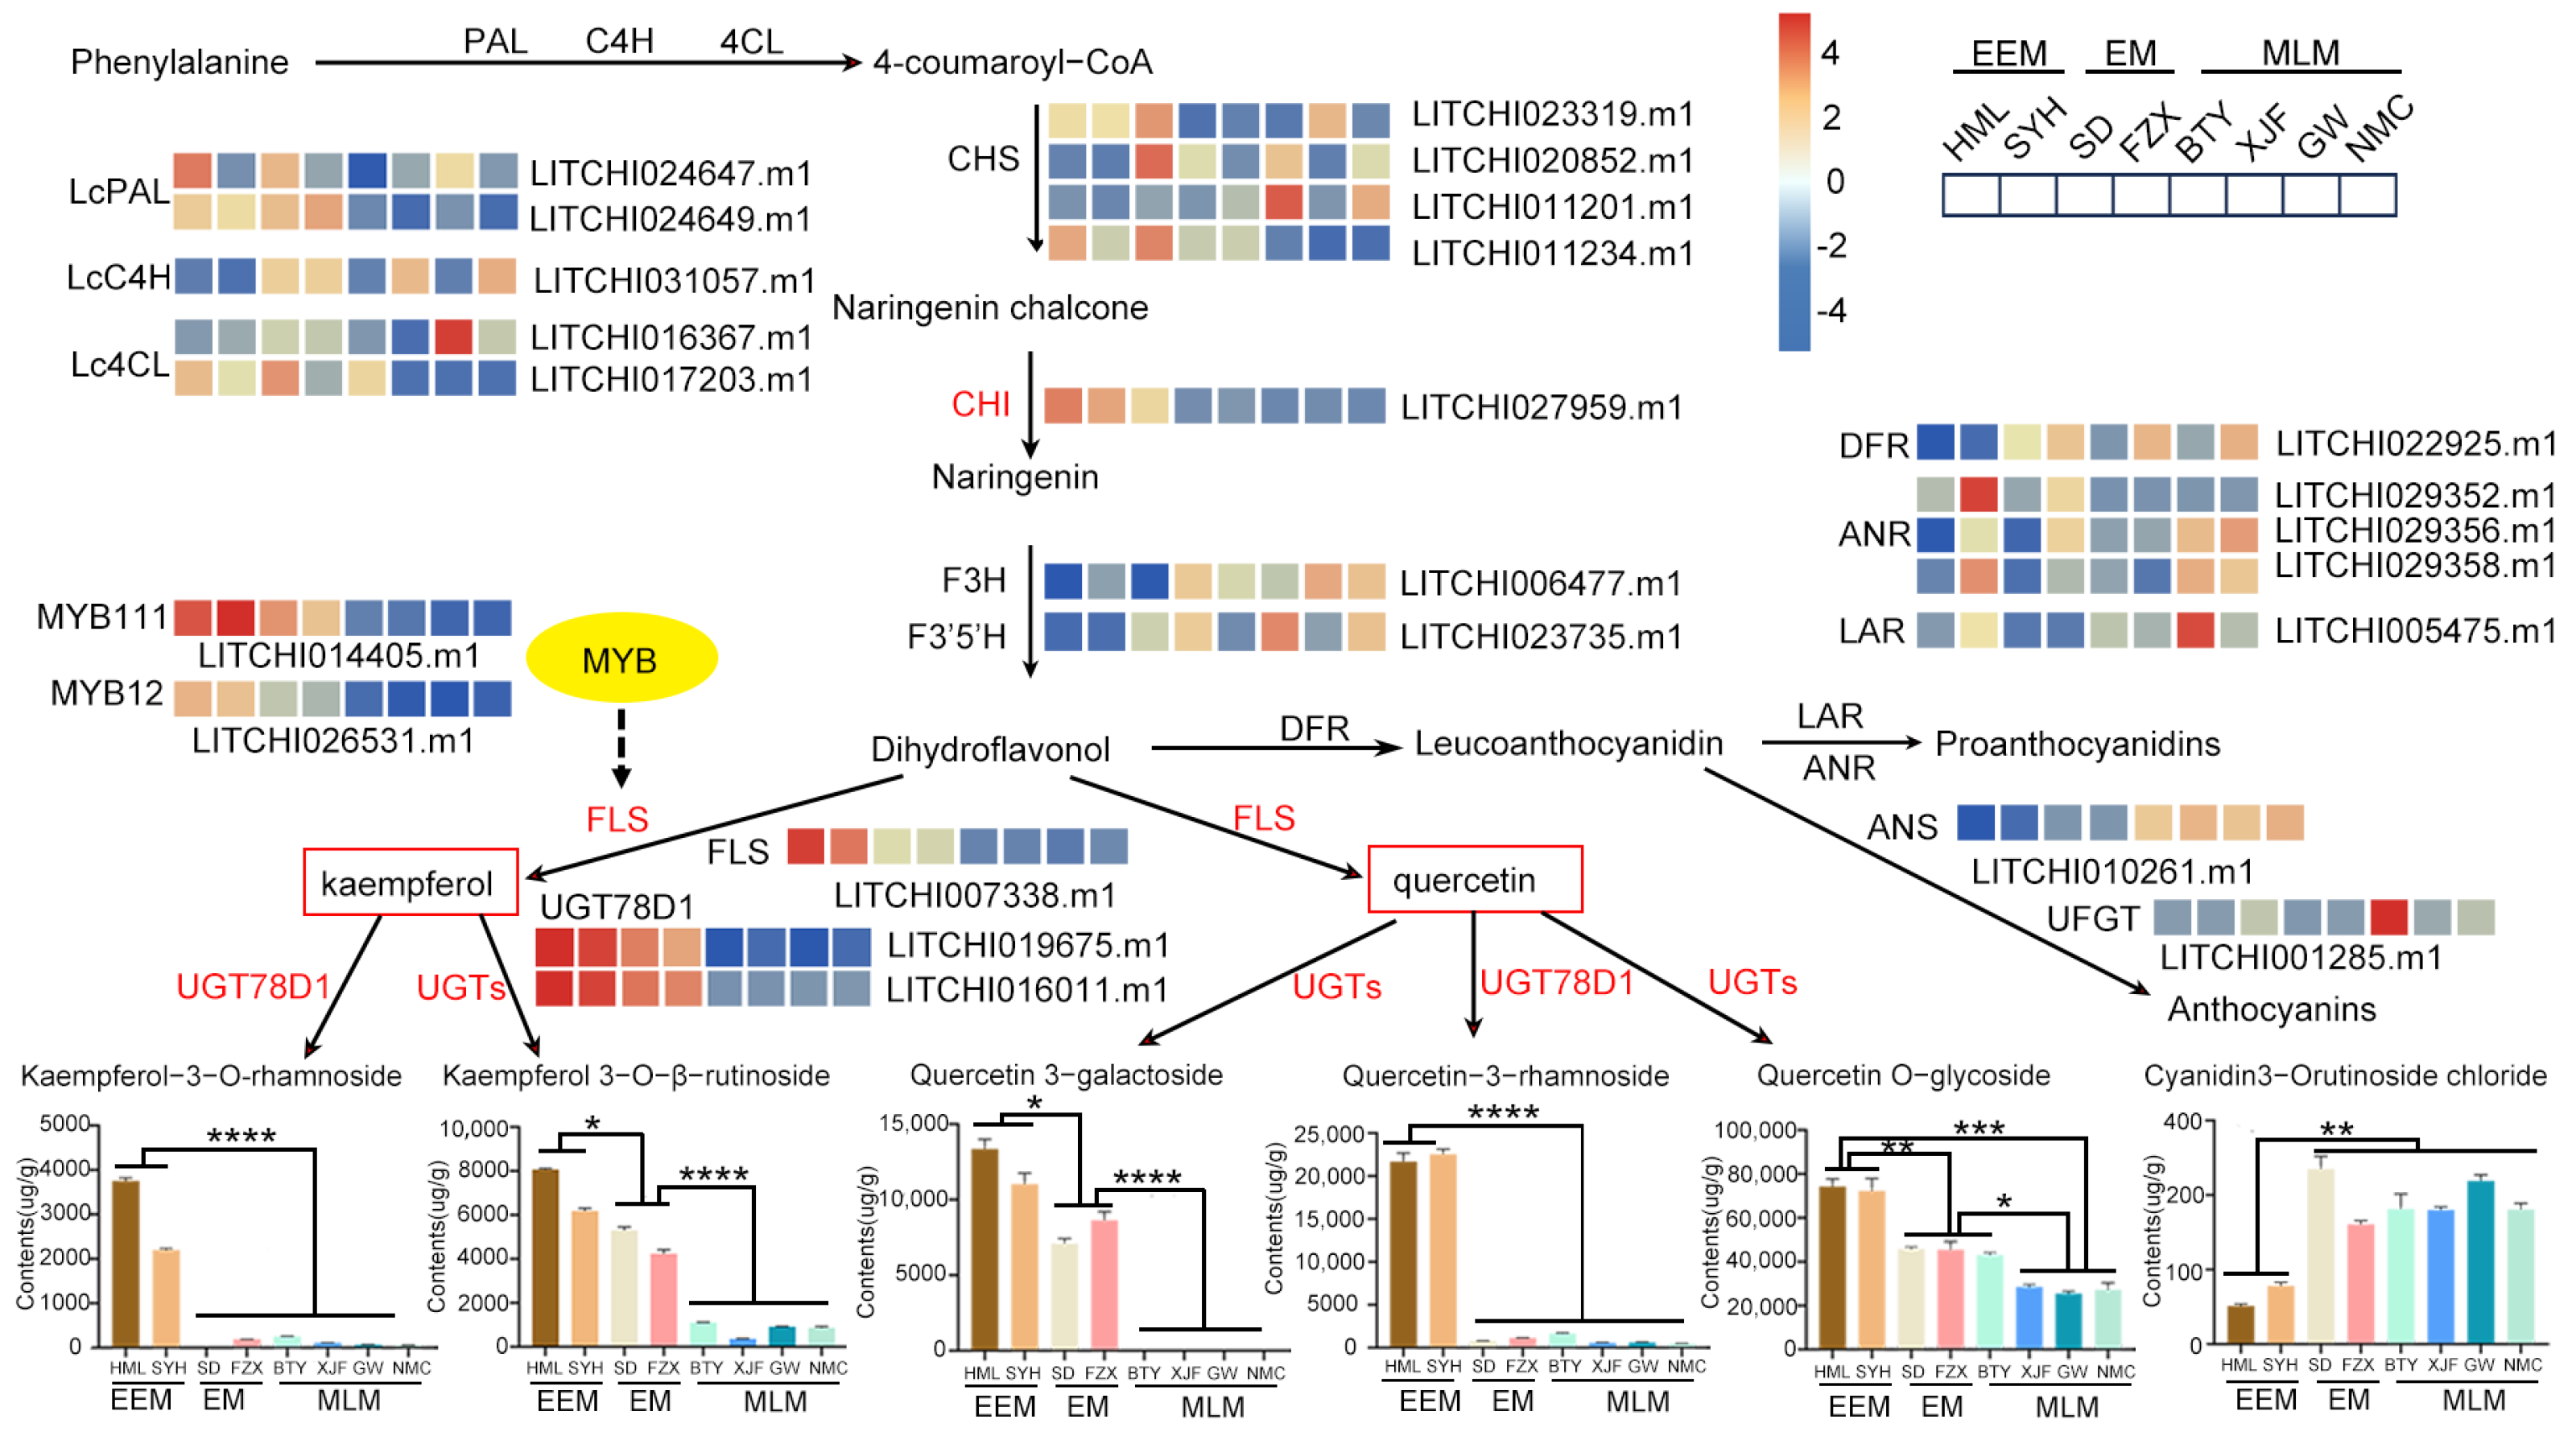
3.6. Comprehensive Analysis of Genes and Metabolites Involved in Flavonoid Biosynthesis in Flower Buds of EEM, EM and MLM Litchi Cultivars

In order to explore the correlation between metabolites and genes in the flavonoid biosynthesis in flower buds of EEM, EM and MLM litchi cultivars, a pathway map containing flavonoid-related metabolites and genes based on metabolome and transcriptome analysis was constructed (Figure 8). It was clear that structural genes like LcPAL, LcC4H, Lc4CL, LcCHS, LcF3H, LcF3′5′H, LcDFR, LcANR, LcANS, LcLAR and LcUFGT did not show any consistent expression pattern among EEM, EM and MLM cultivars (Figure 8 and Table S8). However, the expression level of structural genes, including LcCHI, LcFLS and UGT78D1, together with two transcription factors LcMYB12 and LcMYB111, were all highest in the flower buds of EEM cultivars (Figure 8) that originated from regions with high UV-B radiation. Correspondingly, the contents of flavonol glycosides, such as Quercetin 3-rhamnoside, Quercetin 3-galactoside, Quercetin O-glycoside, Kaempferol 3-O-β-rutinoside and Kaempferol 3-rhamnoside, were highest in flower buds of EEM cultivars. Based on the above results, it was speculated that the up-regulation of transcription factors (LcMYB12 and LcMYB111) and structural genes (LcCHI, LcFLS and UGTs) in flower buds of EEM cultivars lead to increased accumulation of flavonol glycosides, thus resulting in their darker flower buds in adaptation to the high UV-B radiation in their original habitats.

3.7. qRT-PCR Validation

To further verify the reliability of the RNA-seq data, nine candidate genes were randomly selected to substantiate the RNA-seq results by qRT-PCR analysis. As shown in Figure S5, the expression patterns of the nine genes were consistent with the transcriptome data, supporting the accuracy of the RNA-seq data.

4. Discussion

4.1. Flavonol Glycosides Are Responsible for Flower Bud Color Variation in Adaptation to UV-B Radiation of Litchi

Global climate change is expected to increase UV-B radiation [48], and damaging UV-B radiation is becoming a major stress facing land plants [49]. Therefore, understanding the genetic bases of adaptation to UV-B radiation is essential for the survival of land plants [49,50]. Flower pigmentation has increasingly been recognized as playing an important role in response to UV-B radiation [2,3,43,51], and flavonoids have been proven to be the main protectant for UV-B radiation [43,46]. In litchi, flower bud colors of EEM and MLM cultivars that originated from regions with high and low UV-B radiation are dark brown and light yellow, respectively, with their hybrid EM cultivars showing an intermediate brown flower bud. In this study, metabolome was conducted to investigate the metabolic difference among flower buds of EEM, EM and MLM cultivars. A total of 72 flavonoid metabolites were detected in flower buds, and PCA analysis could clearly separate EEM, EM and MLM cultivars from each other, indicating that the metabolic profiles of flower buds with different colors were significantly different. KEGG analysis of DAMs showed that flavonoid biosynthesis was significantly enriched in flower buds. The heat map analysis of DAMs further showed that the contents of significantly differentiated flavonol glycosides, such as Quercetin O-glycoside, Quercetin 3-galactoside, Quercetin 3-rhamnoside, Kaempferol 3-rhamnoside and Kaempferol-3-O-rutinoside, were highest in the EEM cultivars, medium in the EM cultivars and lowest in the MLM cultivars. Therefore, the results suggested that the greater accumulation of flavonol glycosides was responsible for the darker color of the flower buds of EEM cultivars.
Flavonol glycosides are the most prevalent flavonoids in plants, which have been proven to play vital roles in protecting against abiotic and biotic stresses [24,52]. Significantly, flavonol glycosides absorb strongly in the near UV range (300–400 nm) and were found to be the major UV-absorbing compounds in many plant species [43,46]. For instance, quercetin glycosides were found to accumulate at high levels in many sunflower tissues and flavonol glycosides were found to be the major UV-absorbing pigments in sunflower petals [43]. The number of quercetin and kaempferol glycosides were increased after UV radiation in different Brassicaceae vegetable sprouts [53]. Therefore, it was speculated that higher accumulation of flavonol glycosides in dark brown flower buds of EEM cultivars might contribute to their adaptation to UV-B radiation.

4.2. Key Structural Genes Responsible for Differential Flavonol Glycoside Accumulation in Flower Buds in Adaptation to UV-B Radiation of Litchi

It has been widely reported that a series of structural genes co-regulated flavonoid biosynthesis in plant species [24,54]. In this present study, LcFLS and UGTs were significantly upregulated in the flower buds of EEM cultivars compared to MLM cultivars. FLS is an important enzyme responsible for the production of flavonols and has been proven to play vital roles in flower coloration [55,56] and response to UV-B radiation [17,57]. FLS competes with DFR for the common substrate dihydroflavonols, leading to the production of flavonols and anthocyanins, respectively [58]. The higher expression level of LcFLS in flower buds of EEM cultivars enhanced the flux in flavonol biosynthesis pathways.
Flavonols are further modified by a series of glycosylation steps under the action of UGTs, which leads to the production of flavonol glycosides [59]. Numbers of flavonoid UGTs have been characterized in plenty of plants [59]. In A. thaliana, UGT78D1, UGT78D2 and UGT78D3 are 3-O-glycosyltransferases using quercetin and kaempferol as substrates, among which UGT78D1 catalyzed the 3-OH transfer of UDP-rhamnose to quercetin and kaempferol, while UGT78D2 transferred UDP-glucose to kaempferol and quercetin [60]. In rice, OsUGT706D1 (flavone 7-O-glucosyltransferase) and OsUGT707A2 (flavone 5-O-glucosyltransferase) were responsible for adaptation to UV-B irradiance of rice accessions derived from different irradiation areas [21]. In this study, seven UGTs were up-regulated in flower buds of EEM cultivars, which were in accordance with the higher accumulation of flavonol glycosides. These results suggested that the above seven UGTs as well as LcFLS are potential key structural genes regulating flavonol glycosides biosynthesis in litchi flower buds.

4.3. Key R2R3-MYB Transcription Factors Involved in Flower Buds Color Variation in Adaptation to UV-B Radiation of Litchi

It is well recognized that the R2R3-MYB transcription factors are crucial transcriptional regulators of flavonol biosynthesis and have been characterized in many plant species [24,31,33]. In this study, two R2R3-MYB transcription factors, LcMYB12 and LcMYB111, were significantly up-regulated in dark brown flower buds of EEM cultivars that originated from regions with higher levels of UV-B radiation. Phylogenetic analysis confirmed that LcMYB12 and LcMYB111 are homologs of AtMYB12 and AtMYB111 in litchi. And the expression of LcMYB12 and LcMYB111 in litchi flower buds was up-regulated after exposure to UV-B radiation, which showed the highest and lowest levels in EEM and MLM cultivars, respectively.
In A. thaliana, AtMYB12 and AtMYB111 have been found to play the strongest effect on flavonol glycoside accumulation [31]. Further evidence has demonstrated that MYB12 and MYB111 played critical roles in the production of UV-absorbing flavonols [43,46]. For instance, MYB-FL of Petunia species, which is homologous to AtMYB111, is responsible for the evolutionary gain and subsequent loss of flavonol accumulation and two transitions in UV absorbance in flowers [46]. HaMYB111, a homolog of AtMYB111 in sunflower, regulates the biosynthesis of UV-absorbing flavonol glycosides in sunflower petals and sequence diversity in the HaMYB111 promoter accounting for different floral pigmentation of different sunflower populations [43]. A homolog of AtMYB12 in Brassica rapa has also been proven to be associated with variations in floral UV patterns [61]. Therefore, we speculated that LcMYB12 and LcMYB111 are key transcriptional regulators involved in flower bud color variation in adaptation to UV-B radiation of litchi.

5. Conclusions

In summary, this is the first study to investigate molecular mechanisms underlying flower bud color variation (dark brown, brown and light yellow) of different litchi cultivars (EEM, EM and MLM cultivars) in the adaptation to UV-B radiation. Based on metabolome analysis, a total of 72 flavonoids were identified in litchi flower buds, among which, a higher accumulation of flavonol glycosides was responsible for darker flower buds of EEM cultivars that originated from regions with high UV-B radiation. And transcriptome analysis revealed that key structural genes, including LcCHI, LcFLS and seven UGTs, together with two transcription factors (LcMYB12 and LcMYB111), which could be directly up-regulated by UV-B radiation, played critical roles in regulating the differential accumulation of flavonol glycosides among different litchi cultivars. These results shed new insights into the molecular mechanism underlying adaptation to UV-B radiation of litchi and provide a genetic basis for future breeding of stress-tolerant cultivars of litchi.

Supplementary Materials

The following supporting information can be downloaded at: https://www.mdpi.com/article/10.3390/agronomy14010221/s1, Figure S1: Volcano plots of differential accumulated metabolites (DAMs) in comparison of each cultivar vs. ‘NMC’; Figure S2: KEGG pathway enrichment analysis of DAMs in comparison of each cultivar vs. ‘NMC’; Figure S3: GO enrichment analysis of DEGs in the comparation of each cultivar vs. ‘NMC’; Figure S4: KEGG analysis of DEGs identified in the comparation of ‘BTY’ vs. ‘NMC’, ‘XJF’ vs. ‘NMC’ and ‘GW’ vs. ‘NMC’; Figure S5: Expression pattern of nine randomly selected genes by qRT-PCR; Table S1: List of primers used for the qRT-PCR analysis; Table S2: Flavonoid metabolites detected in the flower buds of EEM, EM and MLM cultivars; Table S3: All the clean reads match the genome of litchi; Table S4: All DEGs are used for WGCNA analysis; Table S5: The scores of EEM, EM and MLM cultivars DEGs grouped into 29 modules; Table S6: The top 50 DEGs of Z_Scorel Expression in MEdarkorange module; Table S7: GO and KEGG analysis of genes in the MEdarkorange module; Table S8: The FPKM of structural genes of Flavonol biosynthesis.

Author Contributions

Conceptualization, Z.X. and W.L.; methodology, Z.X., J.W. and W.L.; software, Z.X. and W.L.; validation, N.J. and X.X.; formal analysis, Z.X.; investigation, J.W.; resources, X.X.; data curation, N.J.; writing—original draft preparation, Z.X.; writing—review and editing, Z.X. and W.L.; visualization, N.J.; supervision, X.X.; project administration, X.X. and W.L.; funding acquisition, X.X. and W.L. All authors have read and agreed to the published version of the manuscript.

Funding

This research was funded by the Natural Science Foundation of Guangdong Province, China (Grant number: 2020A1515010356); the Key-Area Research and Development Program of Guangdong Province, China (Grant number: 2022B0202070003); the Key Research and Development Program of Guangzhou City, China (Grant number: 2023B01J2002); the Guangdong Litchi Industry Technology System (Grant number: 2023KJ107); the Special Fund for Rural Revitalization Strategy (2023TS-2-1); Science and Technology Planning Project of Guangzhou Municipal Science and Technology Bureau (Grant number: 2023A04J0797); Funding for Excellent Young Scientists of Guangdong Academy of Agricultural Sciences (R2021YJ-YB3018).

Data Availability Statement

Data are contained within the article or Supplementary Materials.

Conflicts of Interest

The authors declare no conflicts of interest.

References

  1. Blanquart, F.; Kaltz, O.; Nuismer, S.L.; Gandon, S. A practical guide to measuring local adaptation. Ecol. Lett. 2013, 16, 1195–1205. [Google Scholar] [CrossRef]
  2. Koski, M.H.; MacQueen, D.; Ashman, T.-L. Floral Pigmentation Has Responded Rapidly to Global Change in Ozone and Temperature. Curr. Biol. 2020, 30, 4425–4431.e4423. [Google Scholar] [CrossRef] [PubMed]
  3. Koski, M.H.; Ashman, T.-L. Macroevolutionary patterns of ultraviolet floral pigmentation explained by geography and associated bioclimatic factors. New Phytol. 2016, 211, 708–718. [Google Scholar] [CrossRef] [PubMed]
  4. Roulin, A. Melanin-based colour polymorphism responding to climate change. Glob. Chang. Biol. 2014, 20, 3344–3350. [Google Scholar] [CrossRef] [PubMed]
  5. Koski, M.H.; Ashman, T.-L. Floral pigmentation patterns provide an example of Gloger’s rule in plants. Nat. Plants 2015, 1, 14007. [Google Scholar] [CrossRef]
  6. Li, J.G. The Litchi; China Agriculture Press: Beijing, China, 2008. [Google Scholar]
  7. Wu, S.X. Encyclopedia of China Fruits: Litchi; China Forestry Press: Beijing, China, 1998. [Google Scholar]
  8. Luo, X.; Wei, T.; Lu, Y.; Yang, X.; Zhang, H.; Gao, X. Investigation and analysis of litchi fulvosus YQ Lee germplasm resources in Yunnan. Chin. J. Trop. Agric. 2010, 30, 52–54. [Google Scholar]
  9. Zhang, H.; Gao, X.; Wang, Y.; Wang, Y.; Song, Y.; Zuo, Y.; Zhang, C.; Li, X.; Rao, X.; Luo, X. Ancient Trees of Litchi chinensis var. fulvosus: Resource Investigation. J. Agric. 2020, 10, 77–81. [Google Scholar]
  10. Luo, H. Genetic Diversity of Wild Litchi Idioplasm Resouces and the Phylogentic Relationship among Wild, Semi-Wild and Cultivar Litchi in Hainan by ISSR Markers. Master’s Thesis, South China University of Tropical Agriculture, Danzhou, China, 2007. [Google Scholar]
  11. Chen, Y. Collection Evaluation and Analysis of Hainan Lichee Germplasm Resources. Ph.D. Thesis, Hainan University, Haikou, China, 2012. [Google Scholar]
  12. Liu, C.M.; Mei, M.T. Classification of lychee cultivars with RAPD analysis. Acta Hortic. 2005, 665, 149–159. [Google Scholar] [CrossRef]
  13. Liu, W.; Xiao, Z.; Bao, X.; Yang, X.; Fang, J.; Xiang, X. Identifying litchi (Litchi chinensis Sonn.) cultivars and their genetic relationships using single nucleotide polymorphism (SNP) markers. PLoS ONE 2015, 10, e0135390. [Google Scholar] [CrossRef]
  14. Hu, G.B.; Feng, J.T.; Xiang, X.; Wang, J.B.; Salojärvi, J.; Liu, C.M.; Wu, Z.X.; Zhang, J.S.; Liang, X.M.; Jiang, Z.D.; et al. Two divergent haplotypes from a highly heterozygous lychee genome suggest independent domestication events for early and late-maturing cultivars. Nat. Genet. 2022, 54, 73–83. [Google Scholar] [CrossRef]
  15. Bieza, K.; Lois, R. An Arabidopsis mutant tolerant to lethal Ultraviolet-B levels shows constitutively elevated accumulation of flavonoids and other phenolics. Plant Physiol. 2001, 126, 1105–1115. [Google Scholar] [CrossRef] [PubMed]
  16. Calvenzani, V.; Martinelli, M.; Lazzeri, V.; Giuntini, D.; Dall’Asta, C.; Galaverna, G.; Tonelli, C.; Ranieri, A.; Petroni, K. Response of wild-type and high pigment-1 tomato fruit to UV-B depletion: Flavonoid profiling and gene expression. Planta 2010, 231, 755–765. [Google Scholar] [CrossRef] [PubMed]
  17. Liu, S.; Gu, X.; Jiang, Y.; Wang, L.; Xiao, N.; Chen, Y.; Jin, B.; Wang, L.; Li, W. UV-B promotes flavonoid biosynthesis in Ginkgo biloba by inducing the GbHY5-GbMYB1-GbFLS module. Hortic. Res. 2023, 10, uhad118. [Google Scholar] [CrossRef]
  18. Ryan, K.G.; Burbe, A.; Seppelt, R.D. Historical ozone concentrations and flavonoid levels in herbarium specimens of the Antarctic moss Bryum argenteum. Glob. Chang. Biol. 2009, 15, 1694–1702. [Google Scholar] [CrossRef]
  19. Landry, L.G.; Chapple, C.; Last, R.L. Arabidopsis Mutants Lacking Phenolic Sunscreens Exhibit Enhanced Ultraviolet-B Injury and Oxidative Damage. Plant Physiol. 1995, 109, 1159–1166. [Google Scholar] [CrossRef] [PubMed]
  20. Tohge, T.; Wendenburg, R.; Ishihara, H.; Nakabayashi, R.; Watanabe, M.; Sulpice, R.; Hoefgen, R.; Takayama, H.; Saito, K.; Stitt, M.; et al. Characterization of a recently evolved flavonol-phenylacyltransferase gene provides signatures of natural light selection in Brassicaceae. Nat. Commun. 2016, 7, 12399. [Google Scholar] [CrossRef]
  21. Peng, M.; Shahzad, R.; Gul, A.; Subthain, H.; Shen, S.; Lei, L.; Zheng, Z.; Zhou, J.; Lu, D.; Wang, S.; et al. Differentially evolved glucosyltransferases determine natural variation of rice flavone accumulation and UV-tolerance. Nat. Commun. 2017, 8, 1975. [Google Scholar] [CrossRef]
  22. Zeng, X.; Yuan, H.; Dong, X.; Peng, M.; Jing, X.; Xu, Q.; Tang, T.; Wang, Y.; Zha, S.; Gao, M.; et al. Genome-wide Dissection of Co-selected UV-B Responsive Pathways in the UV-B Adaptation of Qingke. Mol. Plant 2020, 13, 112–127. [Google Scholar] [CrossRef]
  23. Pourcel, L.; Routaboul, J.M.; Cheynier, V.; Lepiniec, L.; Debeaujon, I. Flavonoid oxidation in plants: From biochemical properties to physiological functions. Trends Plant Sci. 2007, 12, 29–36. [Google Scholar] [CrossRef]
  24. Liu, W.; Feng, Y.; Yu, S.; Fan, Z.; Li, X.; Li, J.; Yin, H. The Flavonoid Biosynthesis Network in Plants. Int. J. Mol. Sci. 2021, 22, 2824. [Google Scholar] [CrossRef]
  25. Nabavi, S.M.; Samec, D.; Tomczyk, M.; Milella, L.; Russo, D.; Habtemariam, S.; Suntar, I.; Rastrelli, L.; Daglia, M.; Xiao, J.; et al. Flavonoid biosynthetic pathways in plants: Versatile targets for metabolic engineering. Biotechnol. Adv. 2020, 38, 107316. [Google Scholar] [CrossRef] [PubMed]
  26. Tan, H.; Man, C.; Xie, Y.; Yan, J.; Chu, J.; Huang, J. A Crucial Role of GA-Regulated Flavonol Biosynthesis in Root Growth of Arabidopsis. Mol. Plant 2019, 12, 521–537. [Google Scholar] [CrossRef] [PubMed]
  27. Winkel-Shirley, B. Flavonoid biosynthesis. A colorful model for genetics, biochemistry, cell biology, and biotechnology. Plant Physiol. 2001, 126, 485–493. [Google Scholar] [CrossRef]
  28. Bowles, D.; Lim, E.K.; Poppenberger, B.; Vaistij, F.E. Glycosyltransferases of lipophilic small molecules. Annu. Rev. Plant Biol. 2006, 57, 567–597. [Google Scholar] [CrossRef] [PubMed]
  29. Cheng, J.; Wei, G.; Zhou, H.; Gu, C.; Vimolmangkang, S.; Liao, L.; Han, Y. Unraveling the mechanism underlying the glycosylation and methylation of anthocyanins in peach. Plant Physiol. 2014, 166, 1044–1058. [Google Scholar] [CrossRef] [PubMed]
  30. Wang, F.; Su, Y.; Chen, N.; Shen, S. Genome-Wide Analysis of the UGT Gene Family and Identification of Flavonoids in Broussonetia papyrifera. Molecules 2021, 26, 3449. [Google Scholar] [CrossRef]
  31. Mehrtens, F.; Kranz, H.; Bednarek, P.; Weisshaar, B. The Arabidopsis Transcription Factor MYB12 Is a Flavonol-Specific Regulator of Phenylpropanoid Biosynthesis. Plant Physiol. 2005, 138, 1083–1096. [Google Scholar] [CrossRef]
  32. Yan, H.; Pei, X.; Zhang, H.; Li, X.; Zhang, X.; Zhao, M.; Chiang, V.L.; Sederoff, R.R.; Zhao, X. MYB-Mediated Regulation of Anthocyanin Biosynthesis. Int. J. Mol. Sci. 2021, 22, 3103. [Google Scholar] [CrossRef]
  33. Stracke, R.; Werber, M.; Weisshaar, B. The R2R3-MYB gene family in Arabidopsis thaliana. Curr. Opin. Plant Biol. 2001, 4, 447–456. [Google Scholar] [CrossRef]
  34. Kim, D.; Langmead, B.; Salzberg, S.L. HISAT: A fast spliced aligner with low memory requirements. Nat. Methods 2015, 12, 357–360. [Google Scholar] [CrossRef]
  35. Anders, S.; Pyl, P.T.; Huber, W. HTSeq—A Python framework to work with high-throughput sequencing data. Bioinformatics 2015, 31, 166–169. [Google Scholar] [CrossRef] [PubMed]
  36. Love, M.I.; Huber, W.; Anders, S. Moderated estimation of fold change and dispersion for RNA-seq data with DESeq2. Genome Biol. 2014, 15, 550. [Google Scholar] [CrossRef] [PubMed]
  37. Kanehisa, M.; Araki, M.; Goto, S.; Hattori, M.; Hirakawa, M.; Itoh, M.; Katayama, T.; Kawashima, S.; Okuda, S.; Tokimatsu, T.; et al. KEGG for linking genomes to life and the environment. Nucleic Acids Res. 2008, 36, D480–D484. [Google Scholar] [CrossRef]
  38. Langfelder, P.; Horvath, S. WGCNA: An R package for weighted correlation network analysis. BMC Bioinform. 2008, 9, 559. [Google Scholar] [CrossRef] [PubMed]
  39. Zhang, B.; Horvath, S. A general framework for weighted gene co-expression network analysis. Stat. Appl. Genet. Mol. Biol. 2005, 4, 17. [Google Scholar] [CrossRef]
  40. Livak, K.J.; Schmittgen, T.D. Analysis of relative gene expression data using real-time quantitative PCR and the 2(-Delta Delta C(T)) Method. Methods 2001, 25, 402–408. [Google Scholar] [CrossRef]
  41. Stracke, R.; Ishihara, H.; Huep, G.; Barsch, A.; Mehrtens, F.; Niehaus, K.; Weisshaar, B. Differential regulation of closely related R2R3-MYB transcription factors controls flavonol accumulation in different parts of the Arabidopsis thaliana seedling. Plant J. 2007, 50, 660–677. [Google Scholar] [CrossRef]
  42. Stracke, R.; Jahns, O.; Keck, M.; Tohge, T.; Niehaus, K.; Fernie, A.R.; Weisshaar, B. Analysis of PRODUCTION OF FLAVONOL GLYCOSIDES-dependent flavonol glycoside accumulation in Arabidopsis thaliana plants reveals MYB11-, MYB12- and MYB111-independent flavonol glycoside accumulation. New Phytol. 2010, 188, 985–1000. [Google Scholar] [CrossRef]
  43. Todesco, M.; Bercovich, N.; Kim, A.; Imerovski, I.; Owens, G.L.; Dorado Ruiz, O.; Holalu, S.V.; Madilao, L.L.; Jahani, M.; Legare, J.S.; et al. Genetic basis and dual adaptive role of floral pigmentation in sunflowers. eLife 2022, 11, e72072. [Google Scholar] [CrossRef]
  44. Zhao, X.; Zeng, X.; Lin, N.; Yu, S.; Fernie, A.R.; Zhao, J. CsbZIP1-CsMYB12 mediates the production of bitter-tasting flavonols in tea plants (Camellia sinensis) through a coordinated activator-repressor network. Hortic. Res. 2021, 8, 110. [Google Scholar] [CrossRef]
  45. Song, Y.; Ma, B.; Guo, Q.; Zhou, L.; Zhou, X.; Ming, Z.; You, H.; Zhang, C. MYB pathways that regulate UV-B-induced anthocyanin biosynthesis in blueberry (Vaccinium corymbosum). Front. Plant Sci. 2023, 14, 1125382. [Google Scholar] [CrossRef] [PubMed]
  46. Sheehan, H.; Moser, M.; Klahre, U.; Esfeld, K.; Dell’Olivo, A.; Mandel, T.; Metzger, S.; Vandenbussche, M.; Freitas, L.; Kuhlemeier, C. MYB-FL controls gain and loss of floral UV absorbance, a key trait affecting pollinator preference and reproductive isolation. Nat. Genet. 2016, 48, 159–166. [Google Scholar] [CrossRef]
  47. Czemmel, S.; Holl, J.; Loyola, R.; Arce-Johnson, P.; Alcalde, J.A.; Matus, J.T.; Bogs, J. Transcriptome-Wide Identification of Novel UV-B- and Light Modulated Flavonol Pathway Genes Controlled by VviMYBF1. Front. Plant Sci. 2017, 8, 1084. [Google Scholar] [CrossRef] [PubMed]
  48. Herman, J.R. Global increase in UV irradiance during the past 30 years (1979–2008) estimated from satellite data. J. Geophys. Res. 2010, 115, 116. [Google Scholar] [CrossRef]
  49. Chen, Z.; Dong, Y.; Huang, X. Plant responses to UV-B radiation: Signaling, acclimation and stress tolerance. Stress Biol. 2022, 2, 51. [Google Scholar] [CrossRef] [PubMed]
  50. Shi, C.; Liu, H. How plants protect themselves from ultraviolet-B radiation stress. Plant Physiol. 2021, 187, 1096–1103. [Google Scholar] [CrossRef] [PubMed]
  51. Valenta, K.; Dimac-Stohl, K.; Baines, F.; Smith, T.; Piotrowski, G.; Hill, N.; Kuppler, J.; Nevo, O. Ultraviolet radiation changes plant color. BMC Plant Biol. 2020, 20, 253. [Google Scholar] [CrossRef]
  52. Pollastri, S.; Tattini, M. Flavonols: Old compounds for old roles. Ann. Bot. 2011, 108, 1225–1233. [Google Scholar] [CrossRef]
  53. Neugart, S.; Majer, P.; Schreiner, M.; Hideg, É. Blue Light Treatment but Not Green Light Treatment After Pre-exposure to UV-B Stabilizes Flavonoid Glycoside Changes and Corresponding Biological Effects in Three Different Brassicaceae Sprouts. Front. Plant Sci. 2021, 11, 611247. [Google Scholar] [CrossRef]
  54. Shirley, B.W.; Kubasek, W.L.; Storz, G.; Bruggemann, E.; Koornneef, M.; Ausubel, F.M.; Goodman, H.M. Analysis of Arabidopsis mutants deficient in flavonoid biosynthesis. Plant J. 1995, 8, 659–671. [Google Scholar] [CrossRef]
  55. Holton, T.A.; Brugliera, F.; Tanaka, Y. Cloning and expression of flavonol synthase from Petunia hybrida. Plant J. 1993, 4, 1003–1010. [Google Scholar] [CrossRef] [PubMed]
  56. Park, S.; Kim, D.-H.; Yang, J.-H.; Lee, J.-Y.; Lim, S.-H. Increased Flavonol Levels in Tobacco Expressing AcFLS Affect Flower Color and Root Growth. Int. J. Mol. Sci. 2020, 21, 1011. [Google Scholar] [CrossRef] [PubMed]
  57. Falcone Ferreyra, M.L.; Rius, S.; Emiliani, J.; Pourcel, L.; Feller, A.; Morohashi, K.; Casati, P.; Grotewold, E. Cloning and characterization of a UV-B-inducible maize flavonol synthase. Plant J. 2010, 62, 77–91. [Google Scholar] [CrossRef]
  58. Luo, P.; Ning, G.; Wang, Z.; Shen, Y.; Jin, H.; Li, P.; Huang, S.; Zhao, J.; Bao, M. Disequilibrium of Flavonol Synthase and Dihydroflavonol-4-Reductase Expression Associated Tightly to White vs. Red Color Flower Formation in Plants. Front. Plant Sci. 2016, 6, 1257. [Google Scholar] [CrossRef]
  59. Yonekura-Sakakibara, K.; Saito, K. Function, Structure, and Evolution of Flavonoid Glycosyltransferases in Plants. In Recent Advances in Polyphenol Research; John Wiley & Sons: Hoboken, NJ, USA, 2014; pp. 61–82. [Google Scholar]
  60. Jones, P.; Messner, B.; Nakajima, J.; Schaffner, A.R.; Saito, K. UGT73C6 and UGT78D1, glycosyltransferases involved in flavonol glycoside biosynthesis in Arabidopsis thaliana. J. Biol. Chem. 2003, 278, 43910–43918. [Google Scholar] [CrossRef]
  61. Brock, M.T.; Lucas, L.K.; Anderson, N.A.; Rubin, M.J.; Cody Markelz, R.J.; Covington, M.F.; Devisetty, U.K.; Chapple, C.; Maloof, J.N.; Weinig, C. Genetic architecture, biochemical underpinnings and ecological impact of floral UV patterning. Mol. Ecol. 2016, 25, 1122–1140. [Google Scholar] [CrossRef]
Figure 1. Phenotype of flower buds in EEM, EM and MLM cultivars. (A) The inflorescence of representative EEM cultivar ‘SYH’ and MLM cultivar ‘NMC’. (B) The flower buds of the EEM (‘HML’ and ‘SYH’), EM (‘SD’ and ‘FZX’) and MLM cultivars (‘BTY’, ‘XJF’, ‘GW’ and ‘NMC’) are dark brown, brown and light yellow, respectively.
Agronomy 14 00221 g001
Figure 2. Metabolomic analysis of flower buds of EEM (‘HML’ and ‘SYH’), EM (‘SD’, ‘FZX’ and ‘BTY’) and MLM (‘XJF’, ‘GW’ and ‘NMC’) cultivars. (A) PCA score plot. (B) Percentage of up-regulated and down-regulated metabolites of each cultivar compared to MLM cultivar ‘NMC’. (C) KEGG pathway enrichment analysis of DAMs in ‘HML’ vs. ‘NMC’ comparison.
Agronomy 14 00221 g002
Figure 3. Heat map of DAMs in flower buds among EEM (‘HML’ and ‘SYH’), EM (‘SD’, ‘FZX’ and ‘BTY’) and MLM (‘XJF’, ‘GW’ and ‘NMC’) cultivars. Highly accumulated metabolites were indicated by red bar, while less accumulated metabolites were indicated by blue bar.
Agronomy 14 00221 g003
Figure 4. Global analysis of the transcriptome data of the flower buds of EEM (‘HML’ and ‘SYH’), EM (‘SD’, ‘FZX’ and ‘BTY’) and MLM (‘XJF’, ‘GW’ and ‘NMC’) cultivars. (A) PCA analysis of gene expression in 24 samples of flower buds. (B) Pearson’s correlation among 24 samples of flower buds. The range of Pearson correlation from 0 to 1 was indicated by color set. (C) Box plot of all transcripts’ expression levels of the eight cultivars. Different colors represented different cultivars of EEM (‘HML’ and ‘SYH’), EM (‘SD’, ‘FZX’ and ‘BTY’) and MLM (‘XJF’, ‘GW’ and ‘NMC’) cultivars.
Agronomy 14 00221 g004
Figure 5. Analysis of DEGs in flower buds among EEM (‘HML’ and ‘SYH’), EM (‘SD’, ‘FZX’ and ‘BTY’) and MLM (‘XJF’, ‘GW’ and ‘NMC’) cultivars. (A) The statistics of up-regulated and down-regulated DEGs numbers from EEM, EM and MLM cultivars compared with ‘NMC’. (B) Venn diagrams of DEGs between HML vs. NMC, SYH vs. NMC, SD vs. NMC and FZX vs. NMC. (C) GO enrichment analysis of DEGs in HML vs. NMC comparison. (D) Bubble chart of KEGG pathway enrichment analysis.
Agronomy 14 00221 g005
Figure 6. WGCNA analysis based on DEGs. (A) Cluster dendrogram and gene module. (B) Module–sample association. The correlation coefficient and p value marked the upper and lower lines in each cell, respectively. (C) Cluster heat map of Z_Score expression of genes in MEdarkorange module, whose expression was highest in flower buds of EEM cultivars, medium in EM cultivars and lowest in MLM cultivars. (D) GO enrichment analysis in the MEdarkorange module. (E) Co-expression network of DEGs enriched in flavonoid biosynthesis pathway and UDP-glycosyltransferase in the MEdarkorange module.
Agronomy 14 00221 g006
Figure 7. Phylogenetic analysis and expression pattern of LcMYB111 and LcMYB12 in flower buds exposed to UV-B radiation. (A) Phylogenetic tree of LcMYB111 and LcMYB12 in litchi and its homolog in other species. (B) Expression pattern of LcMYB111 and LcMYB12 in flower buds of EEM, EM and MLM cultivars exposed to UV-B radiation. The mean ± SD from three independent experiments were shown. Asterisks indicated significant expression difference determined by one-way ANOVA with Tukey’s tests. (* p < 0.05, ** p < 0.01 and *** p < 0.001; ns: nonsignificant).
Agronomy 14 00221 g007
Figure 8. The pathway of flavonoid biosynthesis in flower buds of EEM, EM and MLM litchi cultivars. The expression levels of genes in the flavonoid synthesis pathway were exhibited with heat maps. Red represents up-regulation and blue denotes down-regulation. PAL, phenylalanine aminotransferase; C4H, cinnamate hydroxylase; 4CL, p-Coumarate CoA Ligase; CHS, chalcone synthase; CHI, chalcone isomerase; F3H, flavonoid 3-hydroxylase; FLS, flavonol synthase; DFR, dihydroflavonol 4-reductase; ANS, anthocyanidin synthase; UGT, UDP glycosyl-transferase. Column diagrams are shown for content difference of flavonol glycosides in flower buds of EEM, EM and MLM litchi cultivars. Units of metabolite content are all ng/g. Data are means ± SD obtained from six biological replicates (* p < 0.05, ** p < 0.01, *** p < 0.001 and **** p < 0.0001 according to Tukey’s test).
Agronomy 14 00221 g008
Disclaimer/Publisher’s Note: The statements, opinions and data contained in all publications are solely those of the individual author(s) and contributor(s) and not of MDPI and/or the editor(s). MDPI and/or the editor(s) disclaim responsibility for any injury to people or property resulting from any ideas, methods, instructions or products referred to in the content.

