Article

Influence of Different Agro-Food Waste on Ammonia and Greenhouse Gas Emissions during Composting

by
José L. S. Pereira
1,2,3,*,
Telma Costa
1,
Vitor Figueiredo
1,
Francisco Marques
1,2,3,
Adelaide Perdigão
1,2,3,
Isabel Brás
4,
Maria E. F. Silva
4,5 and
Dulcineia F. Wessel
1,2,6
1
Agrarian Higher School of Viseu, Polytechnic Institute of Viseu, Quinta da Alagoa, 3500-606 Viseu, Portugal
2
CERNAS-IPV Research Centre, Polytechnic Institute of Viseu, Campus Politécnico, 3504-510 Viseu, Portugal
3
Centre for Research and Technology of Agro-Environmental and Biological Sciences (CITAB), Inov4Agro, University of Trás-os-Montes and Alto Douro (UTAD), Quinta de Prados, 5000-801 Vila Real, Portugal
4
Centre for Research in Digital Services (CISeD), School of Technology and Management of Viseu, Polytechnic Institute of Viseu, Campus Politécnico de Repeses, 3504-510 Viseu, Portugal
5
Laboratory for Process Engineering, Environment, Biotechnology and Energy (LEPABE), Faculty of Engineering, University of Porto, R. Dr. Roberto Frias, 4200-465 Porto, Portugal
6
LAQV-REQUIMTE, Department of Chemistry, University of Aveiro, 3810-193 Aveiro, Portugal
*
Author to whom correspondence should be addressed.
Agronomy 2024, 14(1), 220; https://doi.org/10.3390/agronomy14010220
Submission received: 13 December 2023 / Revised: 12 January 2024 / Accepted: 18 January 2024 / Published: 19 January 2024
(This article belongs to the Section Farming Sustainability)

Abstract

:
Composting is one of the best organic waste management techniques, with zero waste; however, it generates environmental impacts. The objective of this study was to evaluate the emission of NH3, N2O, CO2, and CH4 from the composting of olive, elderberry, and grape agro-food waste. The experiment was carried out using reactors receiving straw as control and three treatments receiving mixtures of straw and olive, elderberry, or grape wastes. The gas emissions were measured for 150 days, and the composition of the mixtures and composts was determined. The results showed NH3 and CH4 emissions were reduced by 48% and 29% by the Olive and Elderberry treatments, while only NH3 loss was reduced by 24% by the Grape treatment. Nitrous oxide, CO2, and GWP emissions were reduced by 46%, 32%, and 34% by the Olive treatment, while these losses were not reduced by the Elderberry or Grape treatments. It can be concluded olive waste can effectively reduce NH3 and GWP, while elderberry and grape wastes are also effective in reducing NH3, but not GWP. Thus, the addition of agro-food waste appears to be a promising mitigation strategy to reduce gaseous losses from the composting process.

1. Introduction

Sustainable agriculture has gained prominence in the last decade. Improving production and reducing negative impact on the environment are mandatory for the development of sustainable agricultural practices. The reuse of organic waste from agro-food production is an example of sustainable practice [1,2]. Mediterranean countries are significant producers of agro-food crops such as olive groves and vineyards, resulting in large amounts of waste from the manufacturing chains. The application of these residues to the soil can benefit it due to its richness in phytochemical compounds such as lignins, celluloses, hemicelluloses, and polyphenols [3]. Unfortunately, a high polyphenol content in agro-food waste can increase toxicity problems after direct application of these wastes [4]. This problem can be solved through composting agri-food waste.
Composting is one of the best organic waste management techniques, with zero waste; however, it generates environmental impacts such as emission of ammonia (NH3), nitrous oxide (N2O), carbon dioxide (CO2), and methane (CH4) [5,6]. The generation of NH3 and greenhouse gases (GHG) are responsible for negative impacts on ozone formation in the troposphere, acid rain, and climate change [7]. The increase in NH3 and GHG emissions from the composting process is very dependent on the physicochemical characteristics of the materials to be composted, such as the composting method, average composting temperature, initial moisture content, initial total carbon (C), and initial total nitrogen (N) content, bulking agent, aeration rate, and pH value [5,8]. Nordahl et al. [6] reported proper pile management and aeration were key to reducing CH4 emissions, but forced aeration could increase NH3 emissions.
The origin of gaseous emissions is an issue of major concern, endorsing the development of mitigation strategies based on providing adequate bulking agent, introducing microorganisms for promoting the nitrification process, and reducing NH3 emissions, applying vermicomposting, using different additives, such as biochar and applying compressing, covering, and biofiltration [8]. For example, the addition of some materials to organic wastes showed its efficiency in reducing gaseous losses from composting [9,10]. Furthermore, the chemical compounds, namely phenols and lignocelluloses, have a great influence on the emission of GHG during the composting process [3]. However, more studies are needed to adequately characterize the physicochemical properties of agro-food waste and the processes that control gaseous emissions during composting.
The objective of this study was to evaluate the emission of NH3, N2O, CO2, and CH4 from the composting of olive, elderberry, and grape agro-food waste.

2. Materials and Methods

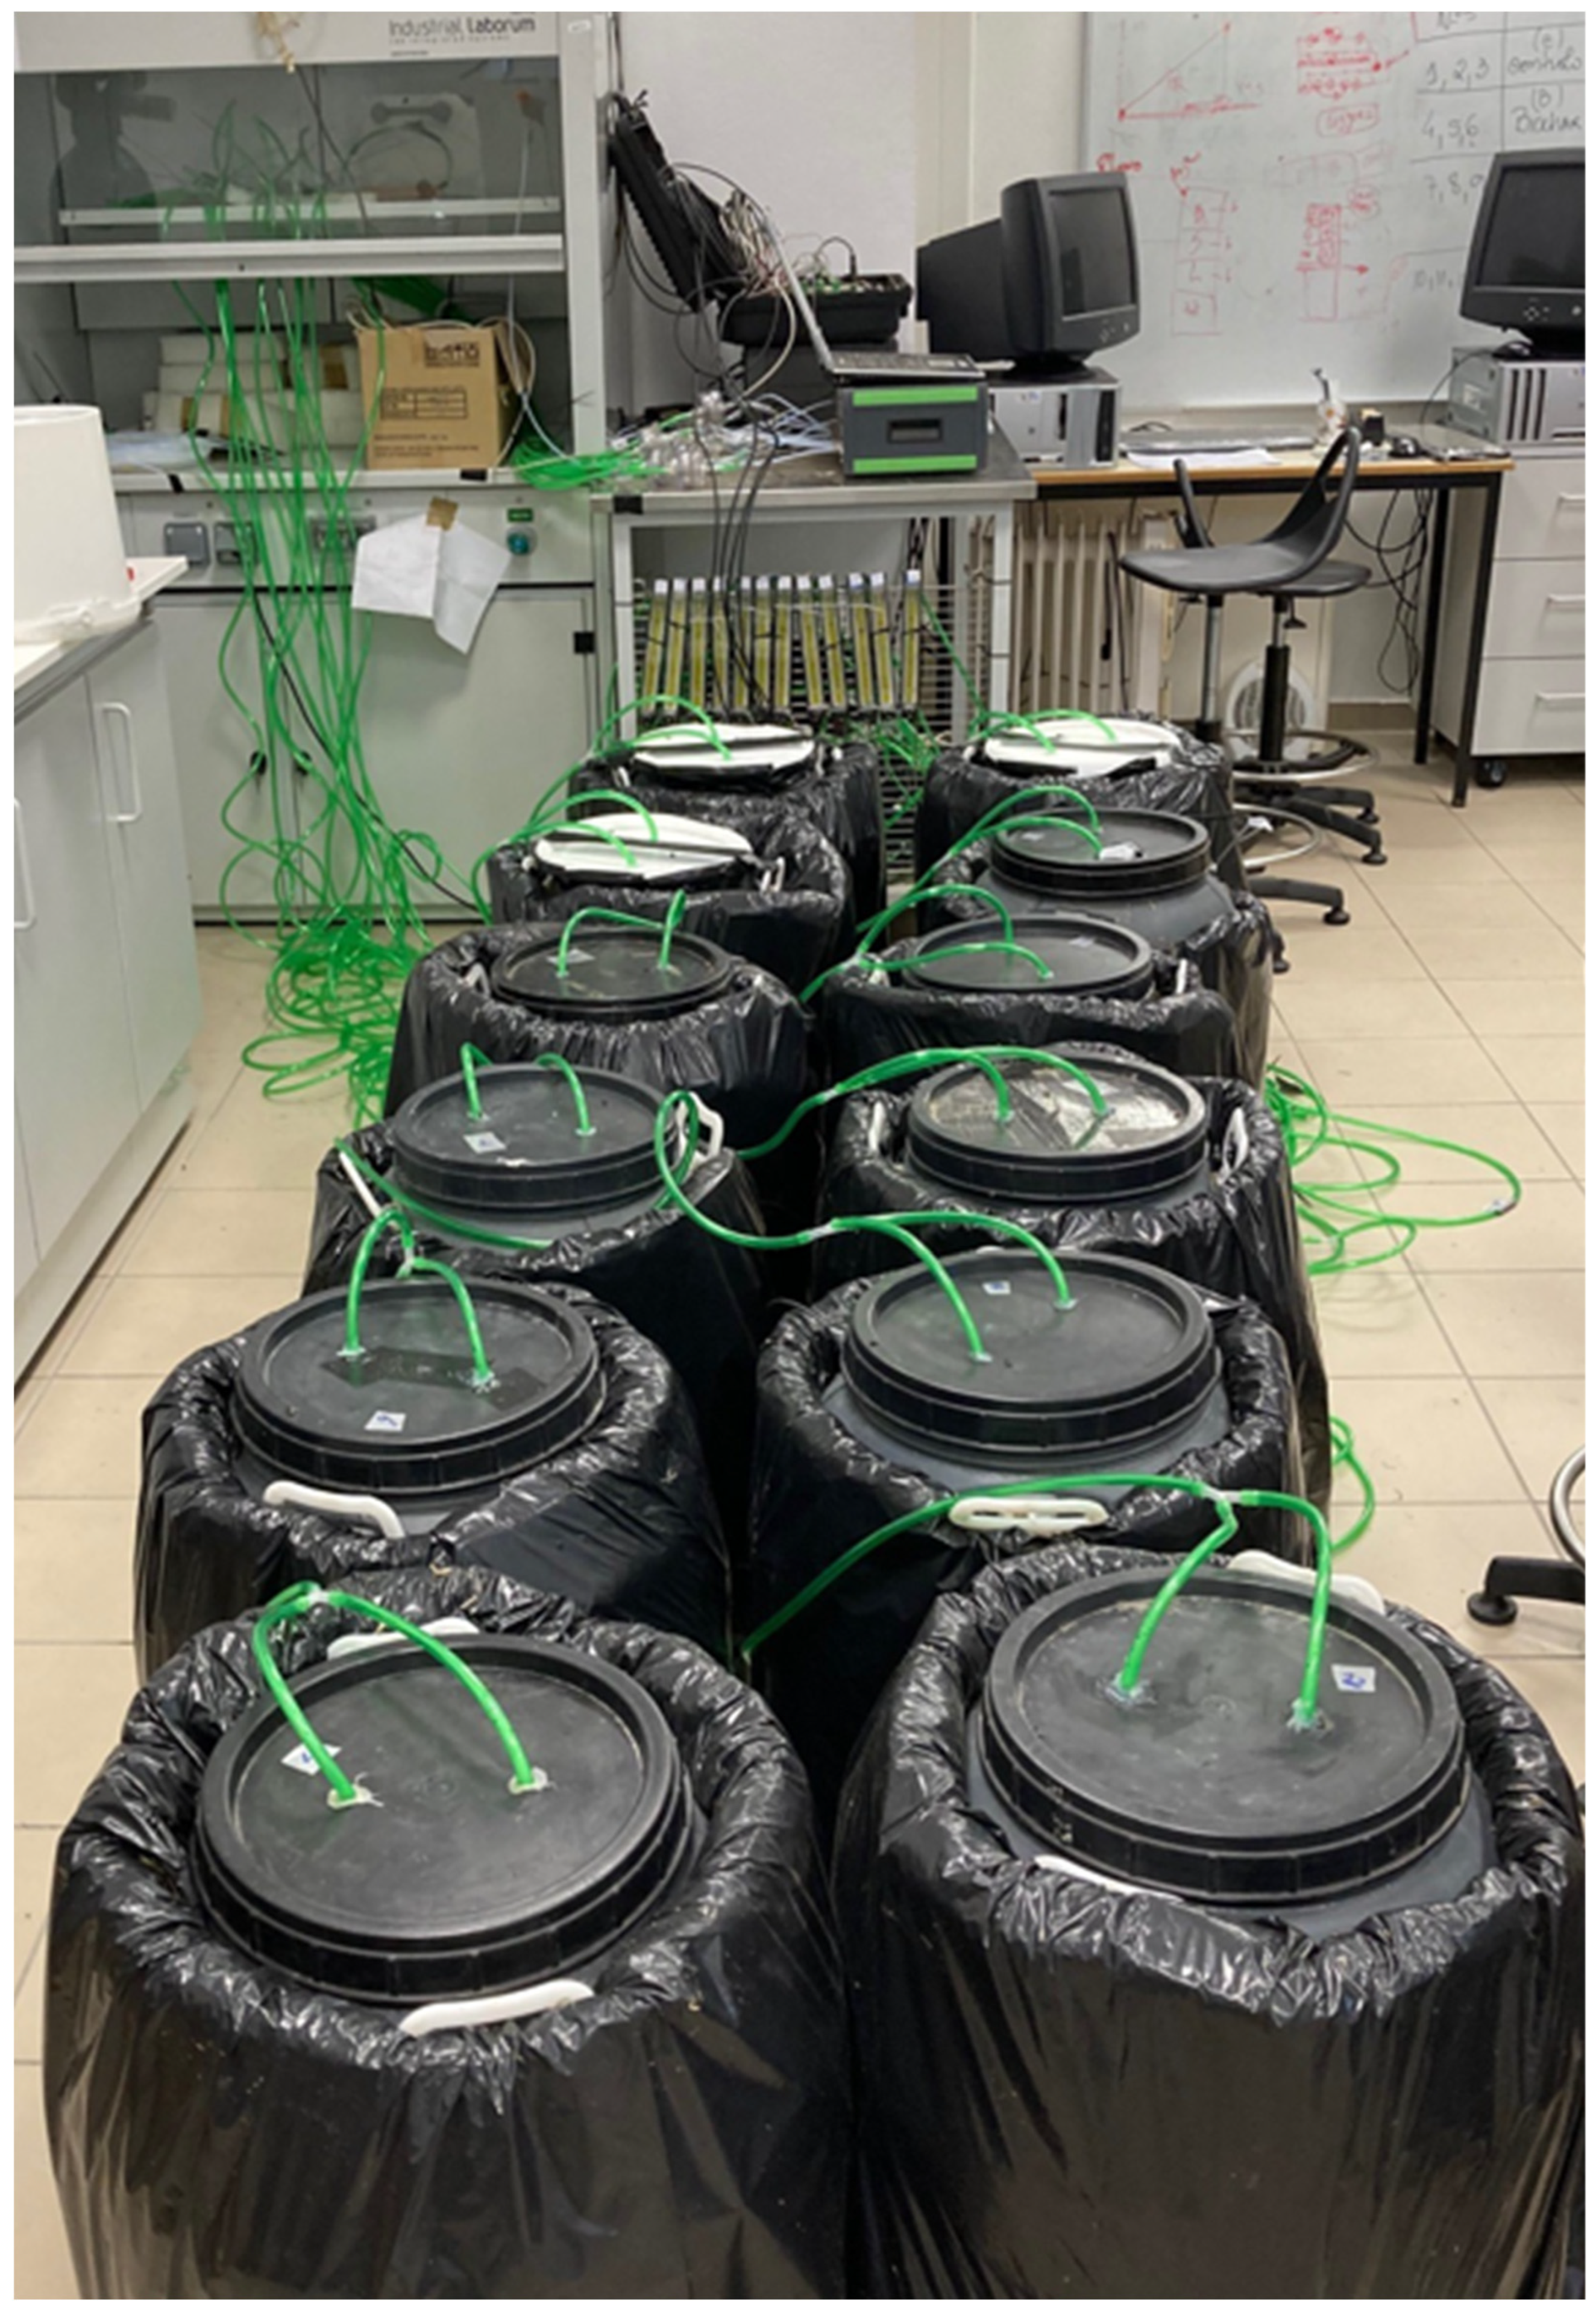
2.1. Experimental Design

A pilot scale composting experiment was performed at Agrarian Higher School of Viseu campus (Viseu, Portugal; N 40°38′20.656″, W 7°54′40.757″) for 150 days (Figure 1) by a similar procedure to the one described by Santos et al. [3,11]. Briefly, the compost was produced in 60 L insulated (mineral wool) reactors (0.65 m of height and 0.40 m of diameter) with mechanical air circulation and measurement of NH3, N2O, CO2, and CH4 emissions. The aeration was supplied continuously with one individual pump (Marina 100, Hagen, Leeds, UK) from the underside of the reactor, where a perforated plate was positioned between the base and the composting mixture. A flowmeter equipped with a needle valve (Aalborg™ FT10201SAVN, Aalborg, Denmark) was used to control the aeration rate at 0.34 L min−1 kg−1 DM (dry matter) of the composting mixture. The inlet air passed through NH3 trapping filters coated with oxalic acid and the exhaust air of the reactors was expelled outdoors.
The gas concentrations were measured in the outlet exhaust air with a photoacoustic multigas monitor (INNOVA 1412i-5, Lumasense Technologies, Ballerup, Denmark) and air samples were collected, in sequence (every 2 min), through one sampling point (Teflon tube with 3 mm internal diameter) per reactor, by a multipoint sampler (INNOVA 1409-12, Lumasense Technologies, Ballerup, Denmark) provided with polytetrafluoroethylene filters (1 µm pore size, Whatman, Ome, Japan) (Figure 1). A detailed description of the characteristics and detection limits of the photoacoustic monitor gas filters, including calibration and operating configuration, can be found in Pereira et al. [12].

2.2. Agro-Food Waste

Three types of agro-food waste were collected in local commercial farms and used in the composting experiments: (i) olive (Olea europaea L.) leaves from the olive oil extraction process; (ii) elderberry (Sambucus nigra L.) marc was collected from the berry stripping of the juice extraction process; and (iii) red grape (Vitis vinifera L.) marc was collected from the berry stripping of the winemaking process. The following four treatments with three replications were carried out using reactors receiving straw as control (treatment Control) and three treatments receiving mixtures of straw and olive (treatment Olive), elderberry (treatment Elderberry), or grape (treatment Grape) wastes.
Dry wheat straw was used as bulking material after being cut (20–30 mm) with scissors. The C/N ratio of the control treatment was corrected to 25 using wheat straw and urea. Two days before the composting experiment started, agro-food raw materials were cut (20–30 mm) with scissors and stored fresh at 4 °C until use. Each reactor was filled with 3 kg DM of the waste-straw mixture, in a proportion allowing an initial C/N ratio of 25, as calculated from the elemental contents of the raw materials (Table 1). The moisture of each reactor was corrected to 40–60% at the beginning of the experiment by frequent weighing and addition of water. The mixtures of each reactor were turned manually once a week during the most biooxidative phase (active phase) and then every 15 days until the end of the maturation period. The temperature was measured every 10 min by sensors (CS107, Campbell Scientific, Leicestershire, UK) located in the centre of the reactors and data were recorded in a micrologger (CR3000, Campbell Scientific, Leicestershire, UK).
The three replicates of each raw material and a composite sample from different areas of each reactor were collected on days 0, 5, 10, 20, 30, 90, and 150. The samples were ground (particle size < 1 mm), frozen (−18 °C), and stored for later analyses by standard procedures to the physicochemical and biological parameters presented in Table 1. Briefly, pH (H2O) was determined by potentiometry (EN 13037, Brussels, Belgium [13]), electrical conductivity by the electrometry method (EN 13038, Brussels, Belgium [14]), dry matter content by the gravimetric method (24 h at 105 °C) (EN 13040, Brussels, Belgium [15]), total C by the Dumas method, total N by the Kjeldahl method (EN 13654-1, Brussels, Belgium [16]), NH4+ and NO3− by absorption spectrophotometry (EN 13652, Brussels, Belgium [17]), total humic substances and fulvic acids by solubility in aqueous solutions (ISO 19822, Geneva, Switzerland [18]), germination index by germination and root elongation in seeds of Lactuca sativa L. (ISO 17126, Geneva, Switzerland [19]), Escherichia coli by colony count technique at 44 °C (ISO 16649-2, Geneva, Switzerland [20]) and Salmonella sp. by the horizontal method (ISO 6579, Geneva, Switzerland [21]).

2.3. Data Analysis

The data analysis followed a similar procedure to those described in Pereira et al. [12]. Briefly, for each reactor, the fluxes of NH3, N2O, CO2, and CH4 are calculated through a mass balance, calculating the average gas concentrations at each outlet and inlet sampling point, using the Equation (1):
F L U X = A E R A T I O N × ( O U T L E T I N L E T M A S S )
where FLUX is the gas emission (mg h−1 kg−1 initial DM), AERATION is the air flowrate in the reactor (m3 h−1), OUTLET is the outlet gas concentration (mg m−3), INLET is the inlet gas concentration (mg m−3) using background coefficients (NH3 = 2.66 µg m−3, N2O = 589.42 µg m−3, CO2 = 628,714.29 µg m−3, and CH4 = 1074.11 µg m−3 [12], and MASS (kg) is the initial mass of DM composted in each reactor.
The Equation (2) was used to determinate the reduction efficiencies (DECREASE, %) of the emission of gases from the agro-food treatments relative to the Control treatment.
D E C R E A S E = 100 ( ( A G R O F O O D / C O N T R O L ) × 100 )
where AGROFOOD is the mean value of the individual or cumulative gas values from treatment Olive, Elderberry, or Grape, and CONTROL is the mean value of the individual or cumulative gas values from the treatment Control.
The average fluxes between two consecutive sampling dates were used to determine the cumulative emission of each gas [12]. The global warming potential (GWP) in each reactor was determined using GWP coefficients for direct GHG emissions (N2O = 265, CO2 = 1, and CH4 = 28) and for indirect N2O emissions (N2O-N = 1% NH3-N volatilized) [12].
One-way analysis of variance was used to test the effects of each treatment on the compost composition and emission of gases, and the statistical significance (p < 0.05) of the means’ difference between treatments was determined by the Tukey’s test. All these data were analyzed by the statistical software package STATISTIX 10.0 (Analytical Software, Tallahassee, FL, USA).

3. Results and Discussion
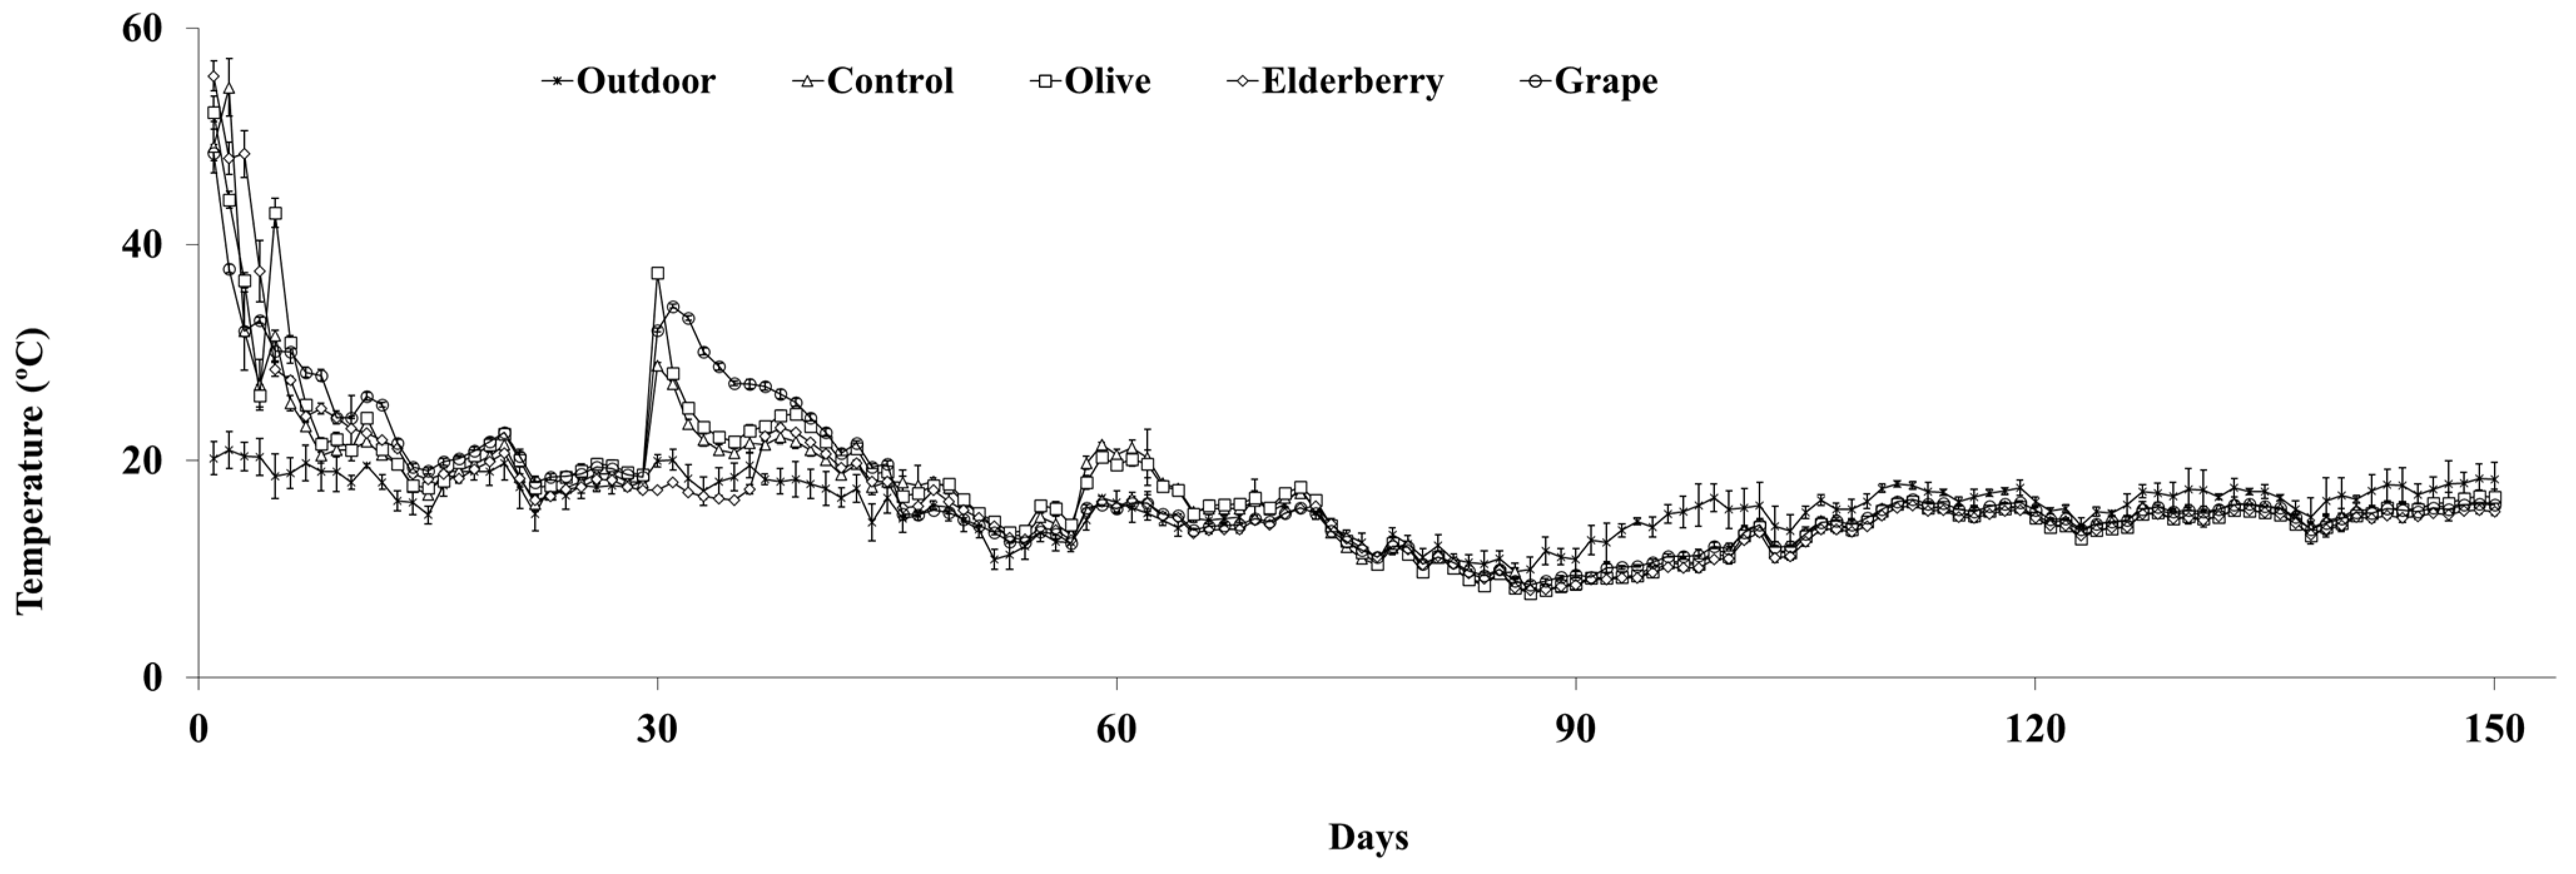
3.1. Temperature

The evolution of the temperature profile follows a similar trend of variation in all treatments and are presented in Figure 2. In all treatments, the temperatures peaked on day 1 (49–56 °C), followed by a progressive decrease until day 73 (from 55 to 16 °C), and then returned to or near ambient values (9–15 °C) until the end of the experiment (Figure 2). The pattern of temperature changed during composting, within the three phases known as thermophilic (45–75 °C) in the first two days, mesophilic (20–45 °C) from day three to sixty and maturity up to day sixty-one until the end of the experiment (Figure 2). During thermophilic and mesophilic phases and in most measurement days, the temperatures were significantly higher (p < 0.05) in treatments Olive and Grape relative to Control and Elderberry (Figure 2). However, during the maturity phase and in almost all measurements, no significant differences (p > 0.05) were observed between all treatments (Figure 2).
Previous studies [2,5,11] reported aeration of the initial mixtures, moisture, organic matter and C/N ratio increased microbial metabolic activities, which could explain the strong increase in temperatures in the first days of composting (Figure 2). As can be seen in Figure 2, the Elderberry treatment presented a longer thermophilic phase and this could be explained by the greater amount of easily degradable compounds in elderberry wastes [22], as compared to the other agro-food wastes (Table 1). On the other hand, a longer mesophilic phase was observed in the Olive and Grape treatments (Figure 2), probably because the wastes contained an organic matter more resistant to microbial degradation such as hemicellulose, cellulose, lignin, and lignocellulose [23,24,25].

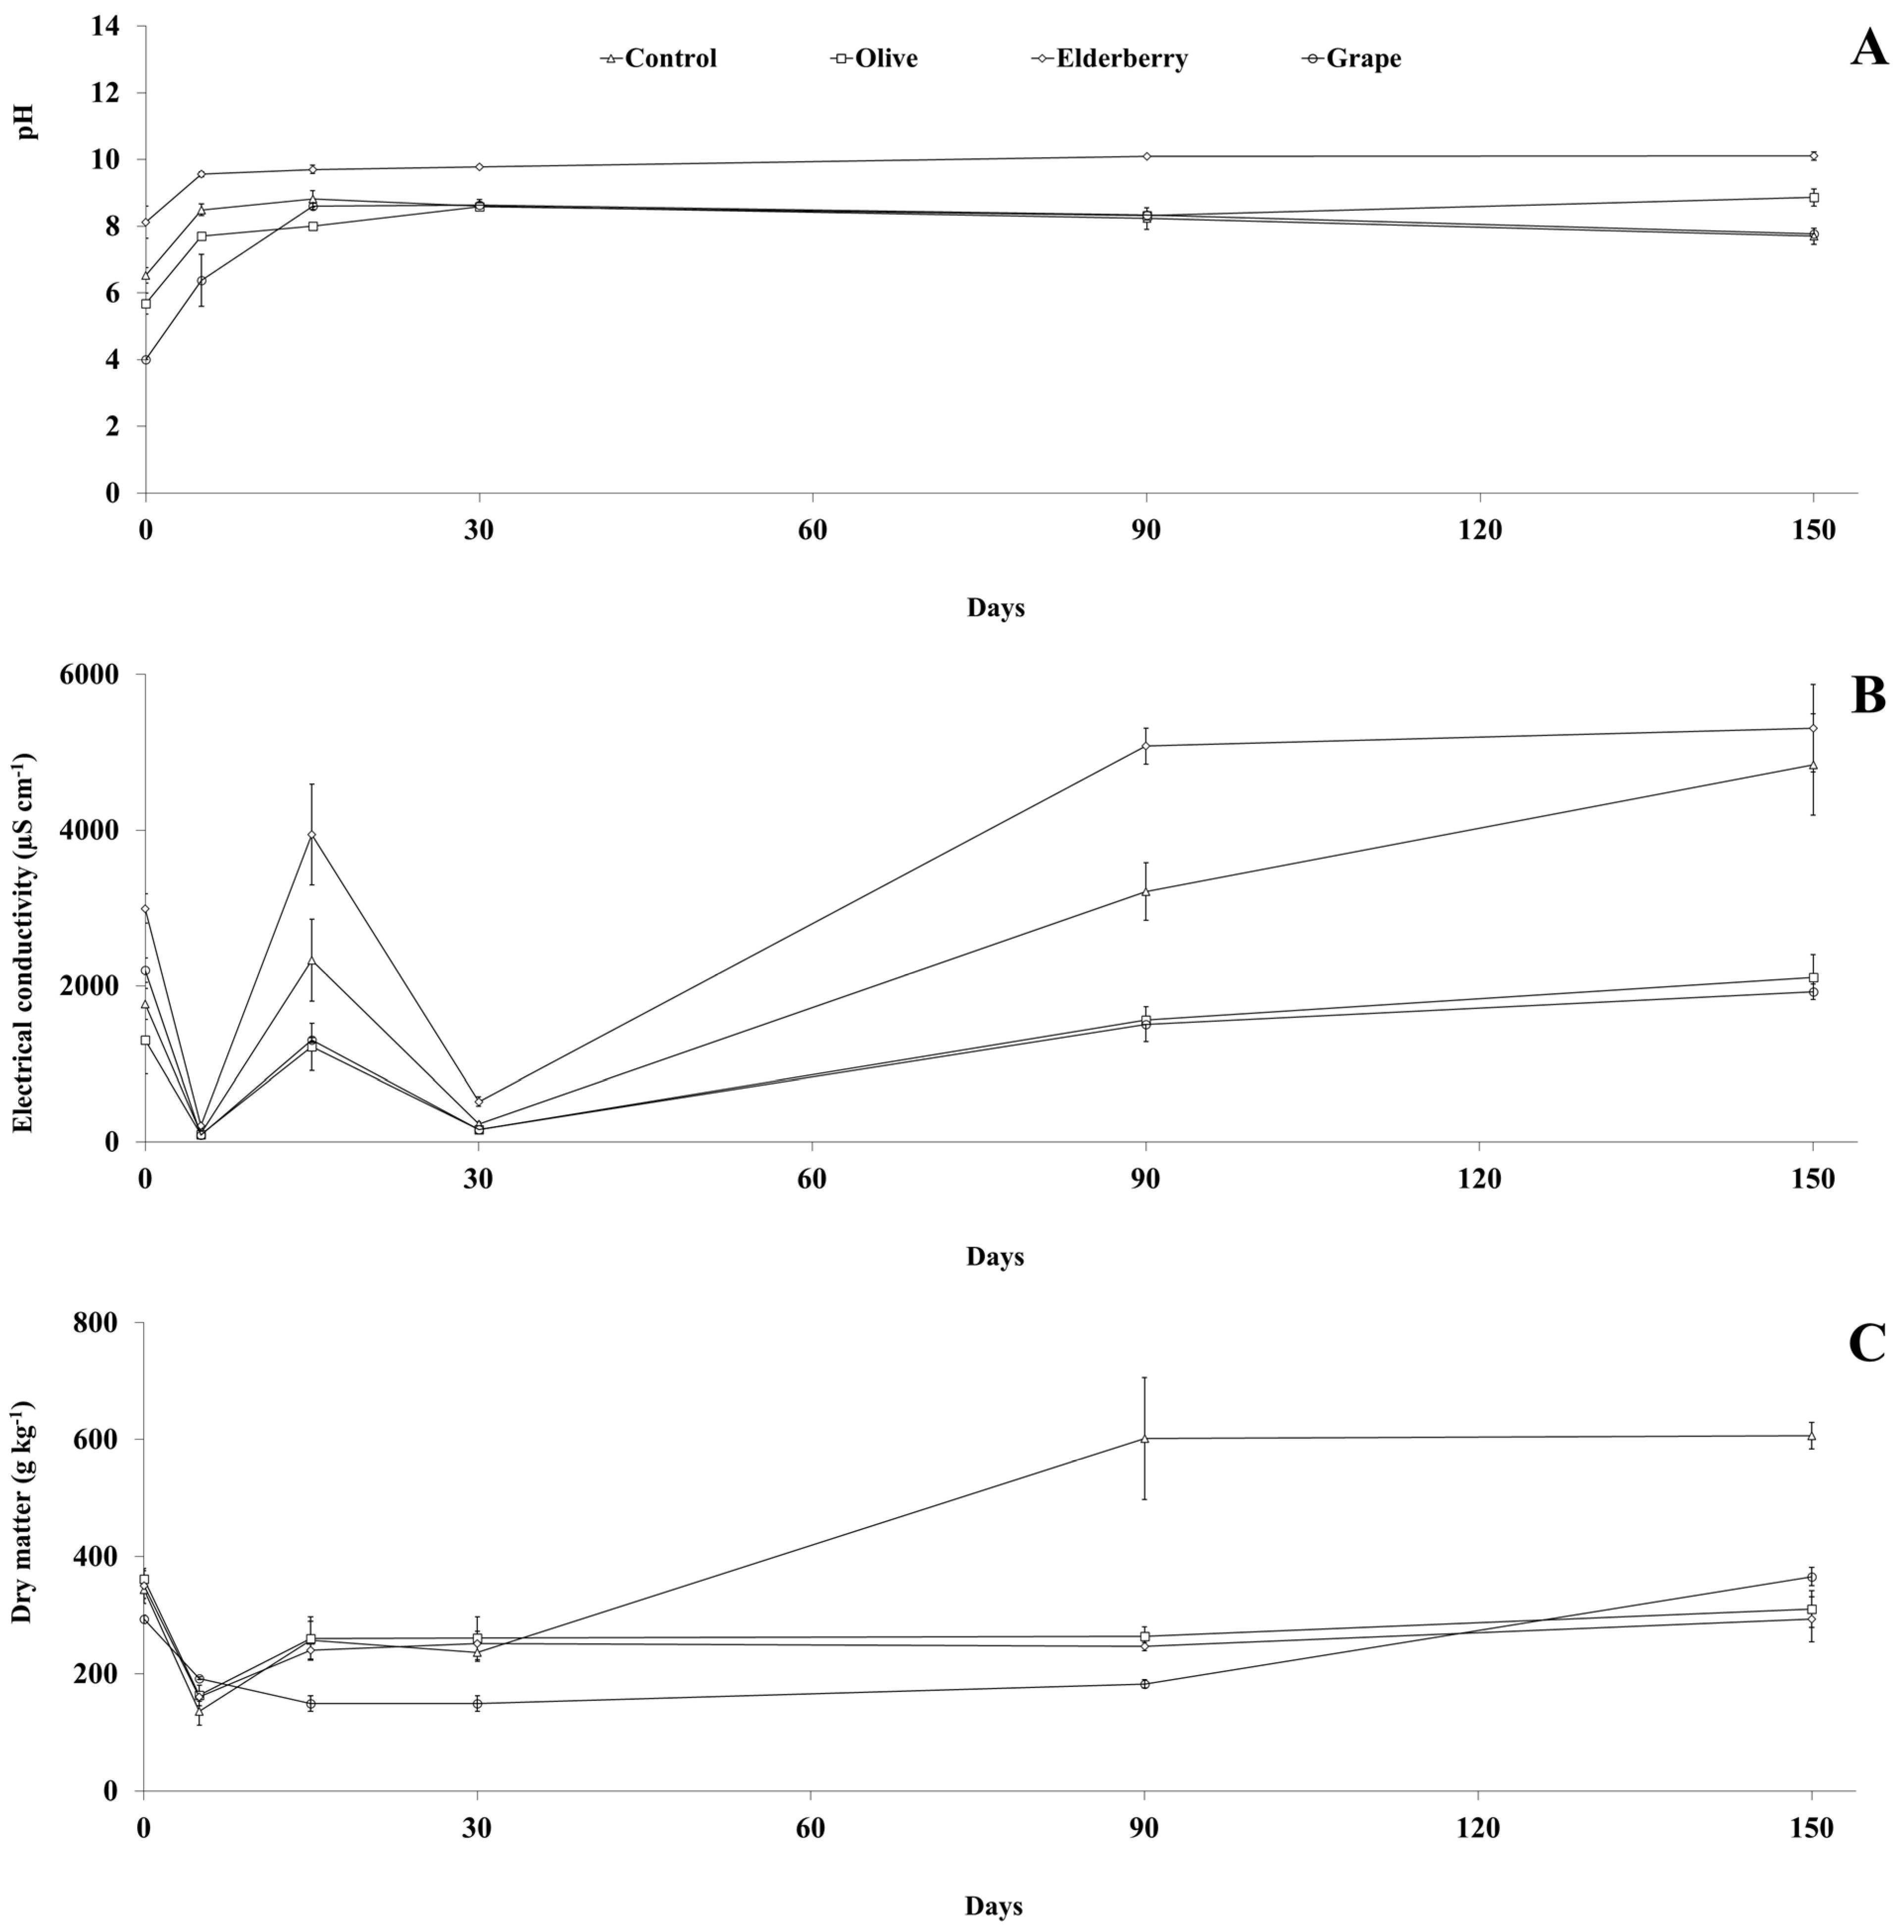
3.2. Physicochemical Parameters

The composition of the raw materials, initial straw-waste mixtures and final composts are presented in Table 1. Compared to the Control treatment, the pH of the initial straw-waste mixtures was significantly higher (p < 0.05) in the Elderberry treatment (8.1) and significantly lower (p < 0.05) in the Olive and Grape treatments (4.0 to 5.7) (Table 1). As can be seen in Figure 3A, the pH increased in all treatments during the first 15 days and then remained constant until the end of the experiment, which could be attributed to the lower microbial activities and the stabilisation of the composts [3]. The pH of the final composts was significantly higher (p < 0.05) in the Elderberry and Olive treatments (8.9 for Olive and 10.1 for Elderberry) compared to the Control and Grape treatments (7.7 to 7.8) (Table 1).
The electrical conductivity (EC) of the initial straw-waste mixtures did not differ significantly (p > 0.05) between the Control and the Olive and Grape treatments (1.3 to 2.2 dS m−1), being significantly higher (p < 0.05) in the Elderberry treatment (3.0 dS m−1) (Table 1). The total C of the initial straw-waste mixtures did not differ significantly (p > 0.05) between the Control and the Olive and Grape treatments (486 to 496 g kg−1), being significantly lower (p < 0.05) in the treatment Elderberry (407 g kg−1 DM) (Table 1). Large variations were observed between treatments in EC and total C throughout the experiment, with higher values in the Elderberry treatment for EC (Figure 3B) and lower values in the Control treatment for total C (Figure 4A). As can be seen in Figure 4A, total C slowly decreases during composting because organic compounds are lost and increasing the proportion of conservative compounds [11]. Compared to the Control and Elderberry treatments (4.9 to 5.3 dS m−1 for EC and 414 to 417 g kg−1 DM for total C), the EC and total C of the final composts were significantly higher (p < 0.05) in the Olive and Grape treatments (1.9 to 2.1 dS m−1 for EC and 502 to 522 g kg−1 DM for total C) (Table 1). Chen et al. [26] recommended a maximum EC value of 3.0 dS m−1 for applying compost to the soil, with lower values being observed in the final composts of the Olive and Grape treatments (Table 1).
Dry matter (DM), total N, C/N ratio, and the NO3 of the initial straw-waste mixtures did not differ significantly (p > 0.05) between all treatments, with observed values ranging from 293 to 361 g kg−1 for DM, 17 to 22 g kg−1 DM for total N, 23 to 28 for the C/N ratio, and 0.1 to 0.2 mg kg−1 DM for the NO3 (Table 1). Compared to the Control treatment, the NH4+ of the initial straw-waste mixtures did not differ significantly (p > 0.05) among all other treatments (2835 mg kg−1 DM for Control against 1837 g kg−1 DM for other treatments) (Table 1). The DM content increased throughout the experiment in all treatments, with higher values being observed in the Control treatment (Figure 3C). In all treatments, total N increased progressively throughout the experiment while the C/N ratio decreased progressively (Figure 3B,C). As can be seen in Figure 4D, the NH4+ content increased in all treatments during the first 30 days and then decreased until the end of the experiment for values below 1000 mg kg−1 DM. Compared to the Control treatment, the DM of the final composts was significantly reduced (p < 0.05) in all other treatments (606 g kg−1 for Control versus 293–366 g kg−1 for other treatments) (Table 1). Total N, NO3, germination index, E. Coli, and Salmonella sp. of the final composts did not differ significantly (p > 0.05) between all treatments, with values ranging from 27 to 38 g kg−1 DM for total N, 0.1 mg kg−1 DM for NO3, 96 to 136% for germination index, 1 CFU mL−1, and the absence of Salmonella (Table 1). As can be observed in Figure 4B, total N increased during composting for all treatments, probably due to the concentration effect caused by weight loss associated with mineralisation of organic matter [11,27]. On the other hand, the high temperatures in the windrow kill the eggs of worms, pathogens, and bacteria that can be harmful to the health of people or animals. The C/N ratio and NH4+ of the final composts were significantly higher (p < 0.05), respectively, in the Grape (20 for C/N) and Elderberry (911 mg kg−1 DM for NH4+) treatments in relation to all other treatments (10–13 for C/N and 276 to 453 mg kg−1 DM for NH4+) (Table 1). A C/N ratio of 15 to 30 is recommended for rapid composting [28], which is in line with the results of this study. The NH4+contents of the final composts in the treatments except Elderberry were below the maximum value recommended for a mature compost (400 mg kg−1 DM) [3].
The total humic substances (THS) and fulvic acids (FA) of the final composts were significantly lower (p < 0.05) in the Elderberry and Grape treatments (71 to 100 g kg−1 for THS and 15 to 24 g kg−1 for FA) when compared with the Control and Olive treatments (186 to 220 g kg−1 for THS and 110 to 417 g kg−1 for FA) (Table 1). Zenjari et al. [29] reported an EC of less than 2 dS m−1 was considered optimal for producing THS and FA during composting, which may be related to the high amounts of these compounds observed in the Control and Olive treatments (Table 1 and Figure 3B). Moreover, Zhao et al. [30] observed initial composting mixtures with a high proportion of C-rich raw material favoured the partial transformation of organic matter into stabilized THS, as long as a high percentage of bulking agent was used to promote the structure of the biomass and consequently improve the conditions of aeration.

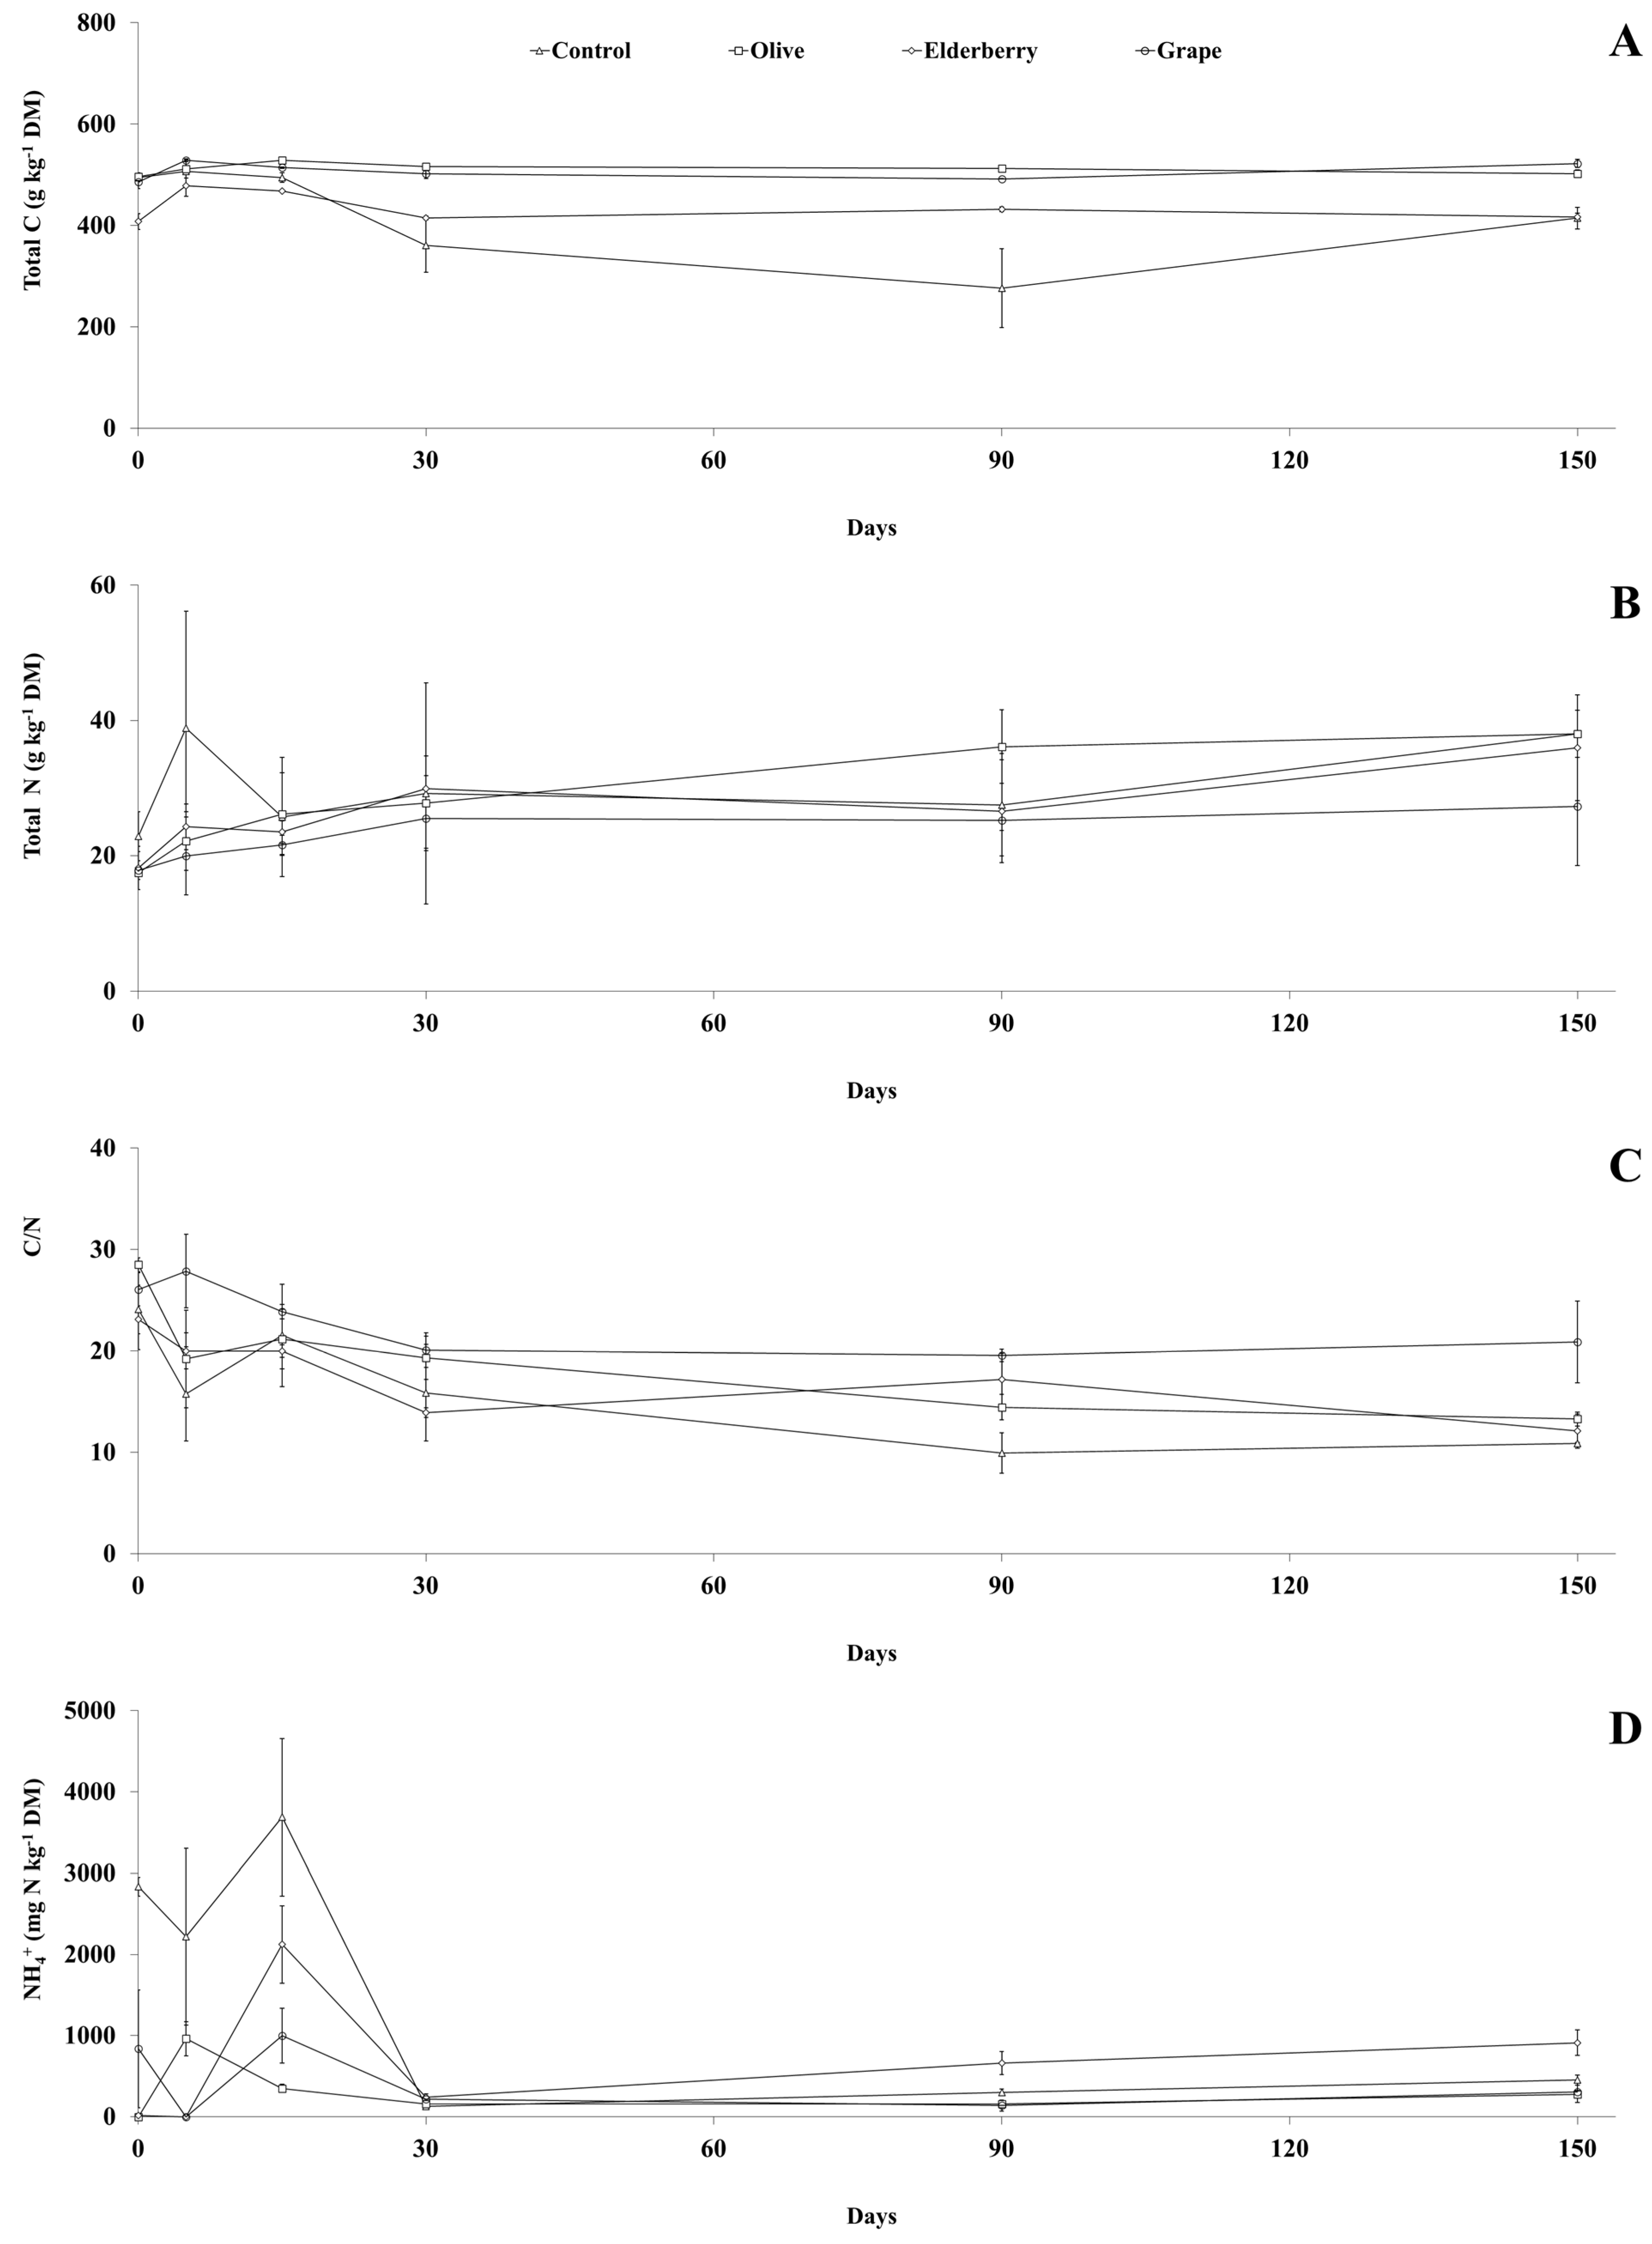
3.3. Nitrogen Emissions

As can be observed in Figure 5A, in all treatments the daily NH3 fluxes reached three times their peak in the first 56 days and decreased until the end of the experiment (1074 to 103 µg NH3 h−1 kg−1 initial DM), with higher fluxes in the Control and Grape treatments. Compared to the Control treatment, NH3 fluxes were significantly reduced (p < 0.05) by 58% in the Olive and Elderberry treatments and by 31% in the Grape treatment during the first 30 days of the experiment (Figure 5A). The average NH3 fluxes of the Olive and Elderberry treatments were significantly lower (p < 0.05) by 40% during the experiment when compared to the Control treatment, while these losses were significantly reduced (p < 0.05) by 17% in the treatment Grape (Figure 5A). Compared to the Control treatment, cumulative NH3 emissions from the Olive and Elderberry treatments decreased significantly (p < 0.05) by 48%, while these same losses were significantly reduced (p < 0.05) by 24% in the Grape treatment (Table 2).
Previous studies [31,32] reported the most important factors influencing NH3 emissions were the pH value, the NH4+/NH3 equilibrium, the amount and intensity of mineralisation of N compounds, the C/N ratio, the temperature, dry matter content, and wind velocity. The results obtained in the present study were in line with previous studies [3,11], where the increase in temperature (Figure 2) and pH (Figure 3A) increased NH3 emissions during composting. On the other hand, previous studies have observed chemical compounds, such as lignocelluloses and phenolics, which were characterized by a low rate of degradation, influenced the mechanisms involved and could reduce NH3 emissions [3]. Sánchez-Monedero et al. [33] reported the use of waste with a high lignocellulose content led to a reduction of around 25% in N losses during the composting process. In this study, cumulative NH3 emissions were not affected by the C/N ratio at the initial straw-waste mixtures, since no differences were observed between treatments (Table 1). However, in the initial mixtures of straw and wastes, the higher NH4+ contents observed in the Control and Grape treatments led to higher cumulative NH3 emissions compared to the Olive and Elderberry treatments (Table 1 and Table 2), due to the availability of NH4+ in these treatments for the volatilisation of NH3.
As could be seen in Figure 5B, in all treatments the daily N2O fluxes reached their peak in the first 15 days and continued to decrease until the end of the experiment (241 to 22 µg N2O h−1 kg−1 initial DM), being observed higher fluxes in the treatment Elderberry. In the first 40 days of the experiment, the N2O fluxes of the Control and Grape treatments did not differ significantly (p < 0.05), while the fluxes decreased significantly (p < 0.05) by 33% in the Olive treatment and increased significantly (p < 0.05) by 114% in the Elderberry treatment (Figure 5B). From this day until the end of the experiment, significantly lower N2O fluxes of 38% were observed in all other treatments compared to the Control treatment (Figure 5B). During the 150 days of experimentation, mean N2O fluxes were significantly reduced (p < 0.05) by 43 and 18% in the Olive and Grape treatments, respectively, and significantly increased (p < 0.05) by 34% in the Elderberry treatment in relation to treatment Control (Figure 5B). Cumulative N2O emissions decreased significantly (p < 0.05) by 46% in the Olive treatment when compared to all other treatments, although smaller losses of 23% were observed in the Grape treatment, but not statistically significant (Table 2).
Nitrous oxide was a byproduct of nitrification and denitrification found in aerobic and anaerobic conditions. Various parameters, including temperature, NO3 content, aeration rate, humidity and pH, can stimulate N2O production from nitrification as well as denitrification, shifting the balance from N2O to N2 in the final product [5,8]. As can be seen in Table 1, N2O losses occurred with NH3 oxidation and NO3 depletion—explaining that nitrifier denitrification dominates N2O production in all composting treatments [5,11,34]. As could be seen in Table 2, cumulative N2O emissions were lower in the Olive and Grape treatments compared to the Control and Elderberry treatments, which may be related to the low availability of degradable carbohydrates and the high content of cellulose and hemicellulose compounds that increased N2O emissions during composting [3,35].

3.4. Carbon Emissions

As can be seen in Figure 6A, in all treatments the daily CO2 fluxes peaked in the first three days and then decreased until the end of the experiment (343 to 44 mg CO2 h−1 kg−1 initial DM), being observed higher fluxes in treatment Olive. In the first three days of the experiment, CO2 fluxes decreased significantly (p < 0.05) from 15 to 31% in all other treatments compared to the Control treatment (Figure 6A). From this day until the end of the experiment, significantly lower CO2 fluxes by 36% were observed in the Olive treatment compared to the other treatments (Figure 6A). During the 150 days of the experiment, the average CO2 fluxes were significantly reduced (p < 0.05) by 35% in treatments Olive compared to the other treatments (Figure 6A). Cumulative CO2 emissions decreased significantly (p < 0.05) by 32% in the Olive treatment when compared to the other treatments (Table 2).
Carbon dioxide comes from the aerobic and anaerobic decomposition of plant material during composting. The rate of CO2 emissions is a sign of rapid total organic matter breakdown and high microbial activity, with temperature peaks and degradation of organic matter being the main cause of the increase in emissions. [5,36]. As can be seen in Table 2, cumulative CO2 emissions from the Olive treatment did not differ between the Elderberry and Grape treatments, but were lower than those from the Control treatment. Such reduction in CO2 emission from Olive treatment may be related to the low availability of labile C and the rate of degradation of C compounds rich in lignocelluloses and phenolics [3]. Santos et al. [11] observed a decrease in CO2 levels indicated lower microbial activity, more stable composted organic matter, with high levels of THS and FA being observed in the final compost from the Olive treatment (Table 1).
As can be seen in Figure 6B, in all treatments the daily CH4 fluxes peaked on day one and then decreased progressively until the end of the experiment (2543 to 96 µg CH4 h−1 kg−1 initial DM), with higher fluxes being observed in the Grape treatment. In the first eight days of the experiment, compared to the Control treatment, CH4 fluxes decreased significantly (p < 0.05) by around 30% in the Olive and Elderberry treatments and increased significantly (p < 0.05) by 35% in the Grape treatment (Figure 6B). From this day until the end of the experiment, significantly lower CH4 fluxes were observed by 32 and 26%, respectively, in the Olive and Elderberry treatments in relation to the Control treatment (Figure 6B). During the 150 days of the experiment, the average CH4 fluxes were significantly reduced (p < 0.05) by about 29% in the Olive treatment in relation to the other treatments (Figure 6B). Cumulative CH4 emissions did not differ significantly (p > 0.05) between the Control and Grape treatments, while these emissions decreased significantly (p < 0.05) by around 29% in the Olive and Elderberry treatments (Table 2).
Methane is generally formed during the composting process due to the anaerobic condition that can be established in some parts of the composted material, such as intermediate zones of a pile, which suffer from insufficient oxygen (O2) diffusion [8]. The size of the anaerobic zones depends on several factors and process conditions, but is related to a greater demand for O2 than can be met by aeration measures such as ventilation and diffusion [37]. Methane is produced by strictly anaerobic methanogenic archaea, but a substantial proportion is aerobically oxidised to CO2 on the surface of the compost by methanotrophic bacteria [38,39]. As could be observed in Table 2, the greater CH4 emissions from the Control and Grape treatments in relation to the Olive and Elderberry treatments may be related to the large amounts of nutrients and easily degradable organic compounds that stimulated microbial activities, thus reducing available O2 and promoting optimal conditions for methanogenic bacteria [11].
The cumulative GWP was not significantly different (p > 0.05) between the Control, Elderberry, and Grape treatments, but significantly decreased (p < 0.05) by 34% in the Olive treatment when compared to all treatments (Table 2).

4. Conclusions

This composting study indicated NH3 and CH4 emissions were reduced by 48 and 29% by the Olive and Elderberry treatments, while only NH3 loss was reduced by 24% by the Grape treatment. Nitrous oxide, CO2, and GWP emissions were reduced by 46, 32, and 34% by the Olive treatment, while these losses were not reduced by the Elderberry or Grape treatments. Regarding the influence of the studied agro-food waste on gaseous losses during composting, we conclude olive waste can effectively reduce NH3 and GWP, while elderberry and grape wastes are also effective in reducing NH3, but not GWP. Thus, the addition of agro-food waste appears to be a promising mitigation strategy to reduce gaseous losses from the composting process.

Author Contributions

Conceptualization, J.L.S.P.; methodology, J.L.S.P. and T.C.; software, J.L.S.P. and T.C.; validation, J.L.S.P., T.C., V.F., F.M., A.P., M.E.F.S., I.B. and D.F.W.; formal analysis, J.L.S.P. and T.C.; investigation, J.L.S.P., T.C., V.F., F.M., A.P., M.E.F.S. and I.B.; resources, J.L.S.P., T.C., V.F., F.M., A.P., M.E.F.S., I.B. and D.F.W.; data curation, J.L.S.P., T.C., A.P., M.E.F.S. and I.B.; writing—original draft preparation, J.L.S.P.; writing—review and editing, J.L.S.P., T.C., V.F., F.M., A.P., M.E.F.S., I.B. and D.F.W.; visualization, J.L.S.P. and T.C.; supervision, J.L.S.P.; project administration, J.L.S.P. and D.F.W.; funding acquisition, J.L.S.P. and D.F.W. All authors have read and agreed to the published version of the manuscript.

Funding

This work was supported by National Funds from FCT—Portuguese Foundation for Science and Technology, under the projects UIDB/00681/2020 (https://doi.org/10.54499/UIDB/00681/2020), UIDB/04033/2020 (https://doi.org/10.54499/UIDB/04033/2020), UIDB/50006/2020 and UIDP/50006/2020 (Fundação para a Ciência e Tecnologia), and projects WASTECLEAN PROJ/IPV/ID&I/019 (Polytechnic Institute of Viseu) and WASTE2VALUE PDR2020-1.0.1-FEADER-032314 (Ministério da Agricultura).

Institutional Review Board Statement

Not applicable.

Informed Consent Statement

Not applicable.

Data Availability Statement

Data are contained within the article.

Acknowledgments

The authors would like to appreciate the graduate student Tatiane Silva from the Polytechnic Institute of Viseu.

Conflicts of Interest

The authors declare no conflict of interest.

References

  1. Czekała, W.; Janczak, D.; Pochwatka, P.; Nowak, M.; Dach, J. Gases Emissions during Composting Process of Agri-Food Industry Waste. Appl. Sci. 2022, 12, 9245. [Google Scholar] [CrossRef]
  2. Pinto, R.; Correia, C.; Mourão, I.; Moura, L.; Brito, L.M. Composting Waste from the White Wine Industry. Sustainability 2023, 15, 3454. [Google Scholar] [CrossRef]
  3. Santos, C.; Goufo, P.; Fonseca, J.; Pereira, J.L.S.; Ferreira, L.; Coutinho, J.; Trindade, H. Effect of lignocellulosic and phenolic compounds on ammonia, nitric oxide and greenhouse gas emissions during composting. J. Clean. Prod. 2018, 171, 548–556. [Google Scholar] [CrossRef]
  4. Santos, F.T.; Goufo, P.; Santos, C.; Botelho, D.; Fonseca, J.; Queirós, A.; Costa, M.S.S.M.; Trindade, H. Comparison of five agro-industrial waste-based composts as growing media for lettuce: Effect on yield, phenolic compounds and vitamin C. Food Chem. 2016, 209, 293–301. [Google Scholar] [CrossRef] [PubMed]
  5. Yasmin, N.; Jamuda, M.; Panda, A.K.; Samal, K.; Nayak, J.K. Emission of greenhouse gases (GHGs) during composting and vermicomposting: Measurement, mitigation, and perspectives. Energy Nexus 2022, 7, 100092. [Google Scholar] [CrossRef]
  6. Nordahl, S.L.; Preble, C.V.; Kirchstetter, T.W.; Scown, C.D. Greenhouse Gas and Air Pollutant Emissions from Composting. Environ. Sci. Technol. 2023, 57, 2235–2247. [Google Scholar] [CrossRef] [PubMed]
  7. IPCC. 2019 Refinement to the 2006 IPCC Guidelines for National Greenhouse Gas Inventories; Calvo Buendia, E., Tanabe, K., Kranjc, A., Baasansuren, J., Fukuda, M., Ngarize, S., Osako, A., Pyrozhenko, Y., Shermanau, P., Federici, S., Eds.; IPCC: Geneva, Switzerland, 2019; Available online: http://www.ipcc-nggip.iges.or.jp (accessed on 13 December 2023).
  8. Sayara, T.; Sánchez, A. Gaseous Emissions from the Composting Process: Controlling Parameters and Strategies of Mitigation. Processes 2021, 9, 1844. [Google Scholar] [CrossRef]
  9. Maeda, K.; Hanajima, D.; Morioka, R.; Toyoda, S.; Yoshida, N.; Osada, T. Mitigation of greenhouse gas emission from the cattle manure composting process by use of a bulking agent. Soil Sci. Plant Nutr. 2013, 59, 96–106. [Google Scholar] [CrossRef]
  10. Lim, S.L.; Lee, L.H.; Wu, T.Y. Sustainability of using composting and vermicomposting technologies for organic solid waste biotransformation: Recent overview, greenhouse gases emissions and economic analysis. J. Clean. Prod. 2016, 111, 262–278. [Google Scholar] [CrossRef]
  11. Santos, C.; Fonseca, J.; Aires, A.; Coutinho, J.; Trindade, H. Effect of different rates of spent coffee grounds (SCG) on composting process, gaseous emissions and quality of end-product. Waste Manag. 2017, 59, 37–47. [Google Scholar] [CrossRef]
  12. Pereira, J.L.S.; Perdigão, A.; Marques, F.; Wessel, D.F.; Trindade, H.; Fangueiro, D. Mitigating Ammonia and Greenhouse Gas Emissions from Stored Pig Slurry Using Chemical Additives and Biochars. Agronomy 2022, 12, 2744. [Google Scholar] [CrossRef]
  13. EN 13037; Soil Improvers and Growing Media—Determination of pH. European Committee for Standardization: Brussels, Belgium, 2011.
  14. EN 13038; Soil Improvers and Growing Media—Determination of Electrical Conductivity. European Committee for Standardization: Brussels, Belgium, 1999.
  15. EN 13040; Soil Improvers and Growing Media—Sample Preparation for Chemical and Physical Tests, Determination of Dry Matter Content, Moisture Content and Laboratory Compacted Bulk Density. European Committee for Standardization: Brussels, Belgium, 1999.
  16. EN 13654-1; Soil Improvers and Growing Media—Determination of Nitrogen—Part 1: Modified Kjeldahl Method. European Committee for Standardization: Brussels, Belgium, 2002.
  17. EN 13652; Soil Improvers and Growing Media—Extraction of Water Soluble Nutrients and Elements. European Committee for Standardization: Brussels, Belgium, 2002.
  18. ISO 19822; Fertilizers and Soil Conditioners—Determination of Humic and Hydrophobic Fulvic Acids Concentrations in Fertilizer Material. International Organization for Standardization: Geneva, Switzerland, 2018.
  19. ISO 17126; Soil Quality—Determination of the Effects of Pollutants on Soil Flora—Screening Test for Emergence of Lettuce Seedlings (Lactuca sativa L.). International Organization for Standardization: Geneva, Switzerland, 2005.
  20. ISO 16649-2; Microbiology of Food and Animal Feeding Stuffs. Horizontal Method for the Enumeration of Beta-Glucuronidase-Positive Escherichia coli. International Organization for Standardization: Geneva, Switzerland, 2001.
  21. ISO 6579; Microbiology of Food and Animal Feeding Stuffs—Horizontal Method for the Detection of Salmonella spp. International Organization for Standardization: Geneva, Switzerland, 2002.
  22. Gavilanes-Terán, I.; Jara-Samaniego, J.; Idrovo-Novillo, J.; Bustamante, M.A.; Moral, R.; Paredes, C. Windrow composting as horticultural waste management strategy—A case study in Ecuador. Waste Manag. 2016, 48, 127–134. [Google Scholar] [CrossRef] [PubMed]
  23. Wang, M.; Wang, X.; Wu, Y.; Wang, X.; Zhao, J.; Liu, Y.; Chen, Z.; Jiang, Z.; Tian, W.; Zhang, J. Effects of thermophiles inoculation on the efficiency and maturity of rice straw composting. Bioresour. Technol. 2022, 354, 127195. [Google Scholar] [CrossRef] [PubMed]
  24. Wang, L.; Wang, T.; Xing, Z.; Zhang, Q.; Niu, X.; Yu, Y.; Teng, Z.; Chen, J. Enhanced lignocellulose degradation and composts fertility of cattle manure and wheat straw composting by Bacillus inoculation. J. Environ. Chem. Eng. 2023, 11, 109940. [Google Scholar] [CrossRef]
  25. Yu, J.; Gu, J.; Wang, X.; Lei, L.; Guo, H.; Song, Z.; Sun, W. Exploring the mechanism associated with methane emissions during composting: Inoculation with lignocellulose-degrading microorganisms. J. Environ. Manag. 2023, 325, 116421. [Google Scholar] [CrossRef]
  26. Chen, M.; Huang, Y.; Liu, H.; Xie, S.; Abbas, F. Impact of different nitrogen source on the compost quality and greenhouse gas emissions during composting of garden waste. Process Saf. Environ. Prot. 2019, 124, 326–335. [Google Scholar] [CrossRef]
  27. Hwang, H.Y.; Kim, S.H.; Shim, J.; Park, S.J. Composting Process and Gas Emissions during Food Waste Composting under the Effect of Different Additives. Sustainability 2020, 12, 7811. [Google Scholar] [CrossRef]
  28. Zhu, P.; Shen, Y.; Pan, X.; Dong, B.; Zhou, J.; Zhang, W.; Li, X. Reducing odor emissions from feces aerobic composting: Additives. RSC Adv. 2021, 11, 15977–15988. [Google Scholar] [CrossRef]
  29. Zenjari, B.; El Hajjouji, H.; Baddi, G.A.; Bailly, J.R.; Revel, J.C.; Nejmeddine, A.; Hafidi, M. Eliminating toxic compounds by composting olive mill wastewater-straw mixtures. J. Hazard. Mater. 2006, 138, 433–437. [Google Scholar] [CrossRef]
  30. Zhao, B.; Wang, Y.; Sun, H.; Xu, Z. Analysis of humus formation and factors for driving the humification process during composting of different agricultural wastes. Front. Environ. Sci. 2022, 10, 954158. [Google Scholar] [CrossRef]
  31. Yuan, J.; Chadwick, D.; Zhang, D.; Li, G.; Chen, S.; Luo, W.; Du, L.; He, S.; Peng, S. Effects of aeration rate on maturity and gaseous emissions during sewage sludge composting. Waste Manag. 2016, 56, 403–410. [Google Scholar] [CrossRef] [PubMed]
  32. Wang, Y.; Liu, S.J.; Xue, W.T.; Guo, H.; Li, X.R.; Zuo, G.Y.; Zhao, T.K.; Dong, H.M. The Characteristics of Carbon, Nitrogen and Sulfur Transformation During Cattle Manure Composting-Based on Different Aeration Strategies. Int. J. Environ. Res. Public Health 2019, 16, 3930. [Google Scholar] [CrossRef] [PubMed]
  33. Sánchez-Monedero, M.A.; Serramiá, N.; Civantos, C.G.O.; Fernandez-Hernandez, A.; Roig, A. Greenhouse gas emissions during composting of two-phase olive mill wastes with different agroindustrial by-products. Chemosphere 2010, 81, 18–25. [Google Scholar] [CrossRef] [PubMed]
  34. Cao, Y.; Wang, X.; Zhang, X.; Misselbrook, T.; Bai, Z.; Ma, L. Nitrifier denitrification dominates nitrous oxide production in composting and can be inhibited by a bioelectrochemical nitrification inhibitor. Bioresour. Technol. 2021, 341, 125851. [Google Scholar] [CrossRef] [PubMed]
  35. Yang, X.; Duan, P.; Liu, Q.; Wang, K.; Li, D. Addition of cellulose and hemicellulose degrading strains promotes nitrous oxide emission during composting. Bioresour. Technol. 2024, 393, 130100. [Google Scholar] [CrossRef]
  36. Wu, C.; Li, W.; Wang, K.; Li, Y. Usage of pumice as bulking agent in sewage sludge composting. Bioresour. Technol. 2015, 190, 516–521. [Google Scholar] [CrossRef]
  37. Li, Y.; Luo, W.; Lu, J.; Zhang, X.; Li, S.; Wu, Y.; Li, G. Effects of digestion time in anaerobic digestion on subsequent digestate composting. Bioresour. Technol. 2018, 267, 117–125. [Google Scholar] [CrossRef]
  38. Lleó, T.; Albacete, E.; Barrena, R.; Font, X.; Artola, A.; Sánchez, A. Home and vermicomposting as sustainable options for biowaste management. J. Clean. Prod. 2013, 47, 70–76. [Google Scholar] [CrossRef]
  39. Preble, C.V.; Chen, S.S.; Hotchi, T.; Sohn, M.D.; Maddalena, R.L.; Russell, M.L.; Brown, N.J.; Scown, C.D.; Kirchstetter, T.W. Air pollutant emission rates for dry anaerobic digestion and composting of organic municipal solid waste. Environ. Sci. Technol. 2020, 54, 16097–16107. [Google Scholar] [CrossRef]
Figure 1. View of the pilot scale composting experiment and equipment used to measure gaseous emissions.
Agronomy 14 00220 g001
Figure 2. Temperature profile of the composting experiment treatments. Vertical bars represent the standard deviation (n = 3).
Agronomy 14 00220 g002
Figure 3. Evolution of pH (A), electrical conductivity (B), and dry matter (C) during the composting experiment treatments. Vertical bars represent the standard deviation (n = 3).
Agronomy 14 00220 g003
Figure 4. Evolution of total C (A), total N (B), C/N ratio (C), and NH4+ (D) during the composting experiment treatments. Vertical bars represent the standard deviation (n = 3).
Agronomy 14 00220 g004
Figure 5. Fluxes of NH3 (A) and N2O (B) during the composting experiment treatments. Vertical bars represent standard deviation of 24 h measurements (n = 3).
Agronomy 14 00220 g005
Figure 6. Fluxes of CO2 (A) and CH4 (B) during the composting experiment treatments. Vertical bars represent standard deviation of 24 h measurements (n = 3).
Agronomy 14 00220 g006
Table 1. Physicochemical characterization of the raw materials, initial straw-waste mixtures, and final composts (mean ± standard deviation).
ParameterspHECDMTCTNC/NNH4+NO3THSFAGIColiSalm
dS m−1g kg−1g kg−1 DMg kg−1 DM mg N kg−1 DMmg N kg−1 DMg kg−1 DMg kg−1 DM%CFU mL−1
Raw materials
Straw5.8 ± 0.1 a0.3 ± 0.1 b230.7 ± 6.4 b524.0 ± 3.9 b37.6 ± 0.9 a13.9 ± 0.2 a162 ± 17 c1 ± 1 c
Olive wastes4.0 ± 0.1 b0.1 ± 0.1 c156.4 ± 1.2 c515.6 ± 0.7 b13.3 ± 1.0 b38.7 ± 3.1 a413 ± 59 b34 ± 1 a
Elderberry wastes4.0 ± 0.1 b0.1 ± 0.1 c277.9 ± 22.9 b532.2 ± 3.7 ab19.9 ± 4.9 b26.7 ± 9.4 a846 ± 149 a24 ± 2 b
Grape wastes5.8 ± 0.1 a1.3 ± 0.1 a417.2 ± 17.1 a549.8 ± 10.1 a16.1 ± 4.5 b34.2 ± 18.2 a562 ± 96 b1 ± 1 c
Initial mixtures
Control6.5 ± 0.2 b1.8 ± 0.2 bc343.9 ± 15.4 a494.9 ± 9.2 a22.9 ± 3.6 a24.1 ± 2.4 a2835 ± 114 a0.2 ± 0.1 a
Olive5.7 ± 0.3 c1.3 ± 0.4 c361.4 ± 15.0 a496.9 ± 5.3 a17.5 ± 1.0 a28.5 ± 0.7 a1 ± 1 b0.1 ± 0.1 a
Elderberry8.1 ± 0.5 a3.0 ± 0.2 a350.2 ± 29.9 a407.9 ± 15.6 b18.2 ± 3.2 a23.1 ± 3.0 a17 ± 2 b0.2 ± 0.1 a
Grape4.0 ± 0.1 d2.2 ± 0.2 b293.1 ± 6.9 a486.4 ± 13.8 a17.8 ± 2.8 a26.1 ± 1.6 a837 ± 724 b0.1 ± 0.1 a
Final composts
Control7.7 ± 0.2 c4.9 ± 0.7 a606.3 ± 22.9 a414.8 ± 21.4 b38.0 ± 3.5 a10.9 ± 0.1 b453 ± 61 b0.1 ± 0.1 a186.8 ± 19.4 a110.7 ± 0.9 a136 ± 21 a1 ± 1 aAbsence
Olive8.9 ± 0.3 b2.1 ± 0.3 b311.0 ± 31.3 b502.3 ± 7.8 a37.9 ± 3.4 a13.3 ± 0.7 ab276 ± 47 b0.1 ± 0.1 a220.7 ± 10.4 a120.7 ± 3.1 a96 ± 13 a1 ± 1 aAbsence
Elderberry10.1 ± 0.1 a5.3 ± 0.6 a293.2 ± 38.7 b417.3 ± 7.5 b35.9 ± 7.8 a12.1 ± 1.7 b911 ± 157 a0.1 ± 0.1 a100.9 ± 11.2 b15.8 ± 2.1 b104 ± 3 a1 ± 1 aAbsence
Grape7.8 ± 0.2 c1.9 ± 0.1 b366.1 ± 15.5 b522.6 ± 7.8 a27.3 ± 8.7 a20.9 ± 4.0 a308 ± 135 b0.1 ± 0.1 a71.6 ± 6.9 b24.3 ± 2.7 b121 ± 6 a1 ± 1 aAbsence
Note: n = 3: three replications per treatment. pH: pH (H2O), electrical conductivity: EC (dS m−1), dry matter: DM (g kg−1), total C: TC (g kg−1 DM), total N: TN (g kg−1 DM), C/N: C:N ratio, NH4+: NH4+-N (mg N kg−1 DM), NO3: NO3-N (mg N kg−1 DM), THS: total humic substances (g kg−1 DM), FA: fulvic acids (g kg−1 DM), GI: germination index (%), Coli: Escherichia coli (colony-forming units (CFU) mL−1), Salm: absence of Salmonella sp. by ISO 6579:2002. Values presented with different lowercase letters within rows were significantly different (p < 0.05) by Tukey’s test.
Table 2. Cumulative emission of gases from the composting experiment treatments (mean ± standard deviation).
ParametersControlOliveElderberryGrape
NH3 (mg kg−1 initial DM)804 ± 13 a407 ± 9 c438 ± 6 c614 ± 11 b
N2O (mg kg−1 initial DM)122 ± 3 a66 ± 1 b141 ± 15 a93 ± 2 ab
CO2 (g kg−1 initial DM)186 ± 2 a127 ± 2 b169 ± 12 ab172 ±9 ab
CH4 (mg kg−1 initial DM)951 ± 1 a644 ± 6 b704 ± 1 b936 ± 22 a
GWP (g CO2-eq. kg−1 initial DM)245 ± 3 a162 ± 2 b226 ± 16 ab223 ± 10 ab
Note: n = 3: three replications per treatment. Values presented with different lowercase letters within rows were significantly different (p < 005) according to the Tukey’s test. DM: dry matter, GWP: global warming potential (CO2 = 1, CH4 = 28, direct N2O = 265, indirect N2O = 1% of NH3-N volatilised).
Disclaimer/Publisher’s Note: The statements, opinions and data contained in all publications are solely those of the individual author(s) and contributor(s) and not of MDPI and/or the editor(s). MDPI and/or the editor(s) disclaim responsibility for any injury to people or property resulting from any ideas, methods, instructions or products referred to in the content.

