Article

Effect of Mineral Fertilization and Microbial Inoculation on Cabbage Yield and Nutrition: A Field Experiment

by
Wilfrand F. Bejarano-Herrera
1,
Carlos A. Marcillo-Paguay
1,
Daniel F. Rojas-Tapias
2 and
German A. Estrada-Bonilla
2,*
1
Corporación Colombiana de Investigación Agropecuaria (AGROSAVIA)—C.I. Obonuco, Pasto 520038, Colombia
2
Corporación Colombiana de Investigación Agropecuaria (AGROSAVIA)—C.I. Tibaitatá, Mosquera 250047, Colombia
*
Author to whom correspondence should be addressed.
Agronomy 2024, 14(1), 210; https://doi.org/10.3390/agronomy14010210
Submission received: 19 December 2023 / Revised: 13 January 2024 / Accepted: 17 January 2024 / Published: 18 January 2024

Abstract

:
Cabbage serves as an important food and nutrition source for numerous communities in the world, yet its production requires substantial quantities of chemical fertilizers. In this study, we assessed the impact of both increasing nitrogen and phosphorus mineral (NP) fertilization, along with the application of plant growth-promoting bacteria (PGPB) on the N and P uptake, quality, and yield of cabbage. To this end, we conducted two consecutive field experiments following a randomized block design with four replicates and two factors: NP doses and PGPB inoculation. PGPB inoculation used a bacterial consortium comprising Azospirillum brasilense D7, Herbaspirillum sp. AP21, and Rhizobium leguminosarum T88. Our results showed a significant influence of both biofertilization and NP fertilization across both crop cycles; however, no interaction between these factors was observed. In the first crop cycle, 75% of NP mineral fertilization (equivalent to 93.6 kg ha−1 of N and 82.1 kg ha−1 of P) positively impacted yield and N uptake. Also, microbial inoculation significantly influenced crop yield, resulting in a 9-ton increase in crop yield per hectare due to biofertilization. In the second crop cycle, we observed a significant positive effect of mineral fertilization on cabbage yield and nutritional quality. The relative agronomic effectiveness (RAE) index showed that combining biological fertilization with 50% and 75% of the NP fertilization, respectively, increased yield by 66% and 48% compared to the commercial NP dosage without PGPB. Collectively, our results demonstrated that within our experimental setup, NP fertilization dosage can be reduced without any detrimental impact on yield. Moreover, biofertilization could enhance cabbage quality and yield in field conditions.

1. Introduction

Cabbage (Brassica oleracea var. capitata L.) stands out as a prominent widely consumed vegetable consumed worldwide, valued for its affordability, widespread availability, and numerous health benefits, including high fiber content, vitamin C, and antioxidant compounds. It also represents a staple in global cuisines and diets, making it one of the most consumed brassica vegetables in the world [1]. In Colombia, cabbage is also a significant source of essential nutrients in people’s diets. Its production primarily centers in five states: Cundinamarca, Boyacá, Norte de Santander, Antioquia, and Nariño [2].
Successful production of this leafy vegetable demands balanced nutrition, mainly of nitrogen (N), phosphorus (P), and potassium (K), which are generally provided in the form of mineral fertilizers. Notably, farmers commonly apply high mineral fertilizer doses regardless of the real needs of the crops [3], potentially leading to significant social, economic, and environmental impacts on the production system. The costs associated with mineral fertilization, therefore, pose a significant threat to the economical sustainability of cabbage production, considering the substantial expenses involved. Additionally, the use of mineral N and P fertilizers can lead to a significant increase in the emissions of greenhouse gases, particularly nitrous oxide, and contribute to the eutrophication of aquatic bodies [4].
Plant growth-promoting bacteria (PGPB) are a group of microorganisms that can stimulate plant growth and development via multiple direct or indirect mechanisms. Their use has the potential to improve nutrient efficiency and, therefore, increase the sustainability of cabbage by reducing the environmental impact of conventional practices and enhancing crop yields and quality [5]. The utilization of PGPB-based biofertilizers in horticultural crops has shown to increase plant nutrition through an increase in the uptake of micronutrients and macronutrients [6]. Furthermore, PGPB can also potentially contribute to the mobilization of P in soils, thus increasing its availability for plant uptake. This is particularly significant considering that P is a limited resource as it represents a non-renewable mineral source [7].
While the success of employing a single microbial strain for biofertilization is well-established, the use of bacterial consortia holds the potential for significantly enhanced efficacy. This improvement primarily arises from the combination of multiple and synergistic PGPB traits. Among these traits, the conversion of atmospheric N into a plant-accessible form is critical for plant nutrition [8]. Both Azospirillum and Herbaspirillum, for instance, contain species capable of fixing atmospheric N [9]. Also, the capacity of some microbes to release soluble P from insoluble forms can positively affect plant growth. Inoculation of Rhizobium in non-leguminous plants, for example, resulted in an increased transformation of P from unavailable to available forms in soil, thereby enhancing plant nutrition [10]. Co-inoculation of strains possessing multiple PGP traits, therefore, has the potential to improve nutrient utilization. For red cabbage (Brassica oleracea var. capitata), the combination of Trichoderma harzianum and Pseudomonas fluorescens demonstrated significant potential to enhance multiple growth parameters, including root length, macronutrient uptake (N, P, and K), heading percentage, head diameter, and overall weight [11]. These findings collectively emphasize the promising impact of bacteria on crop productivity.
In this study, we evaluated the influence of a PGPB consortium on N and P use efficiency and cabbage yield and quality. Our hypothesis was that employing PGPB could potentially decrease mineral fertilizer dosages required for cabbage production. Thus, our objectives were twofold: (i) to investigate the effects of a microbial consortium on both cabbage yield and quality in comparison to the mineral fertilizer input typically used by farmers, and (ii) to assess the bio-fertilizer’s potential in reducing mineral doses while ensuring satisfactory cabbage development and productivity.

2. Materials and Methods

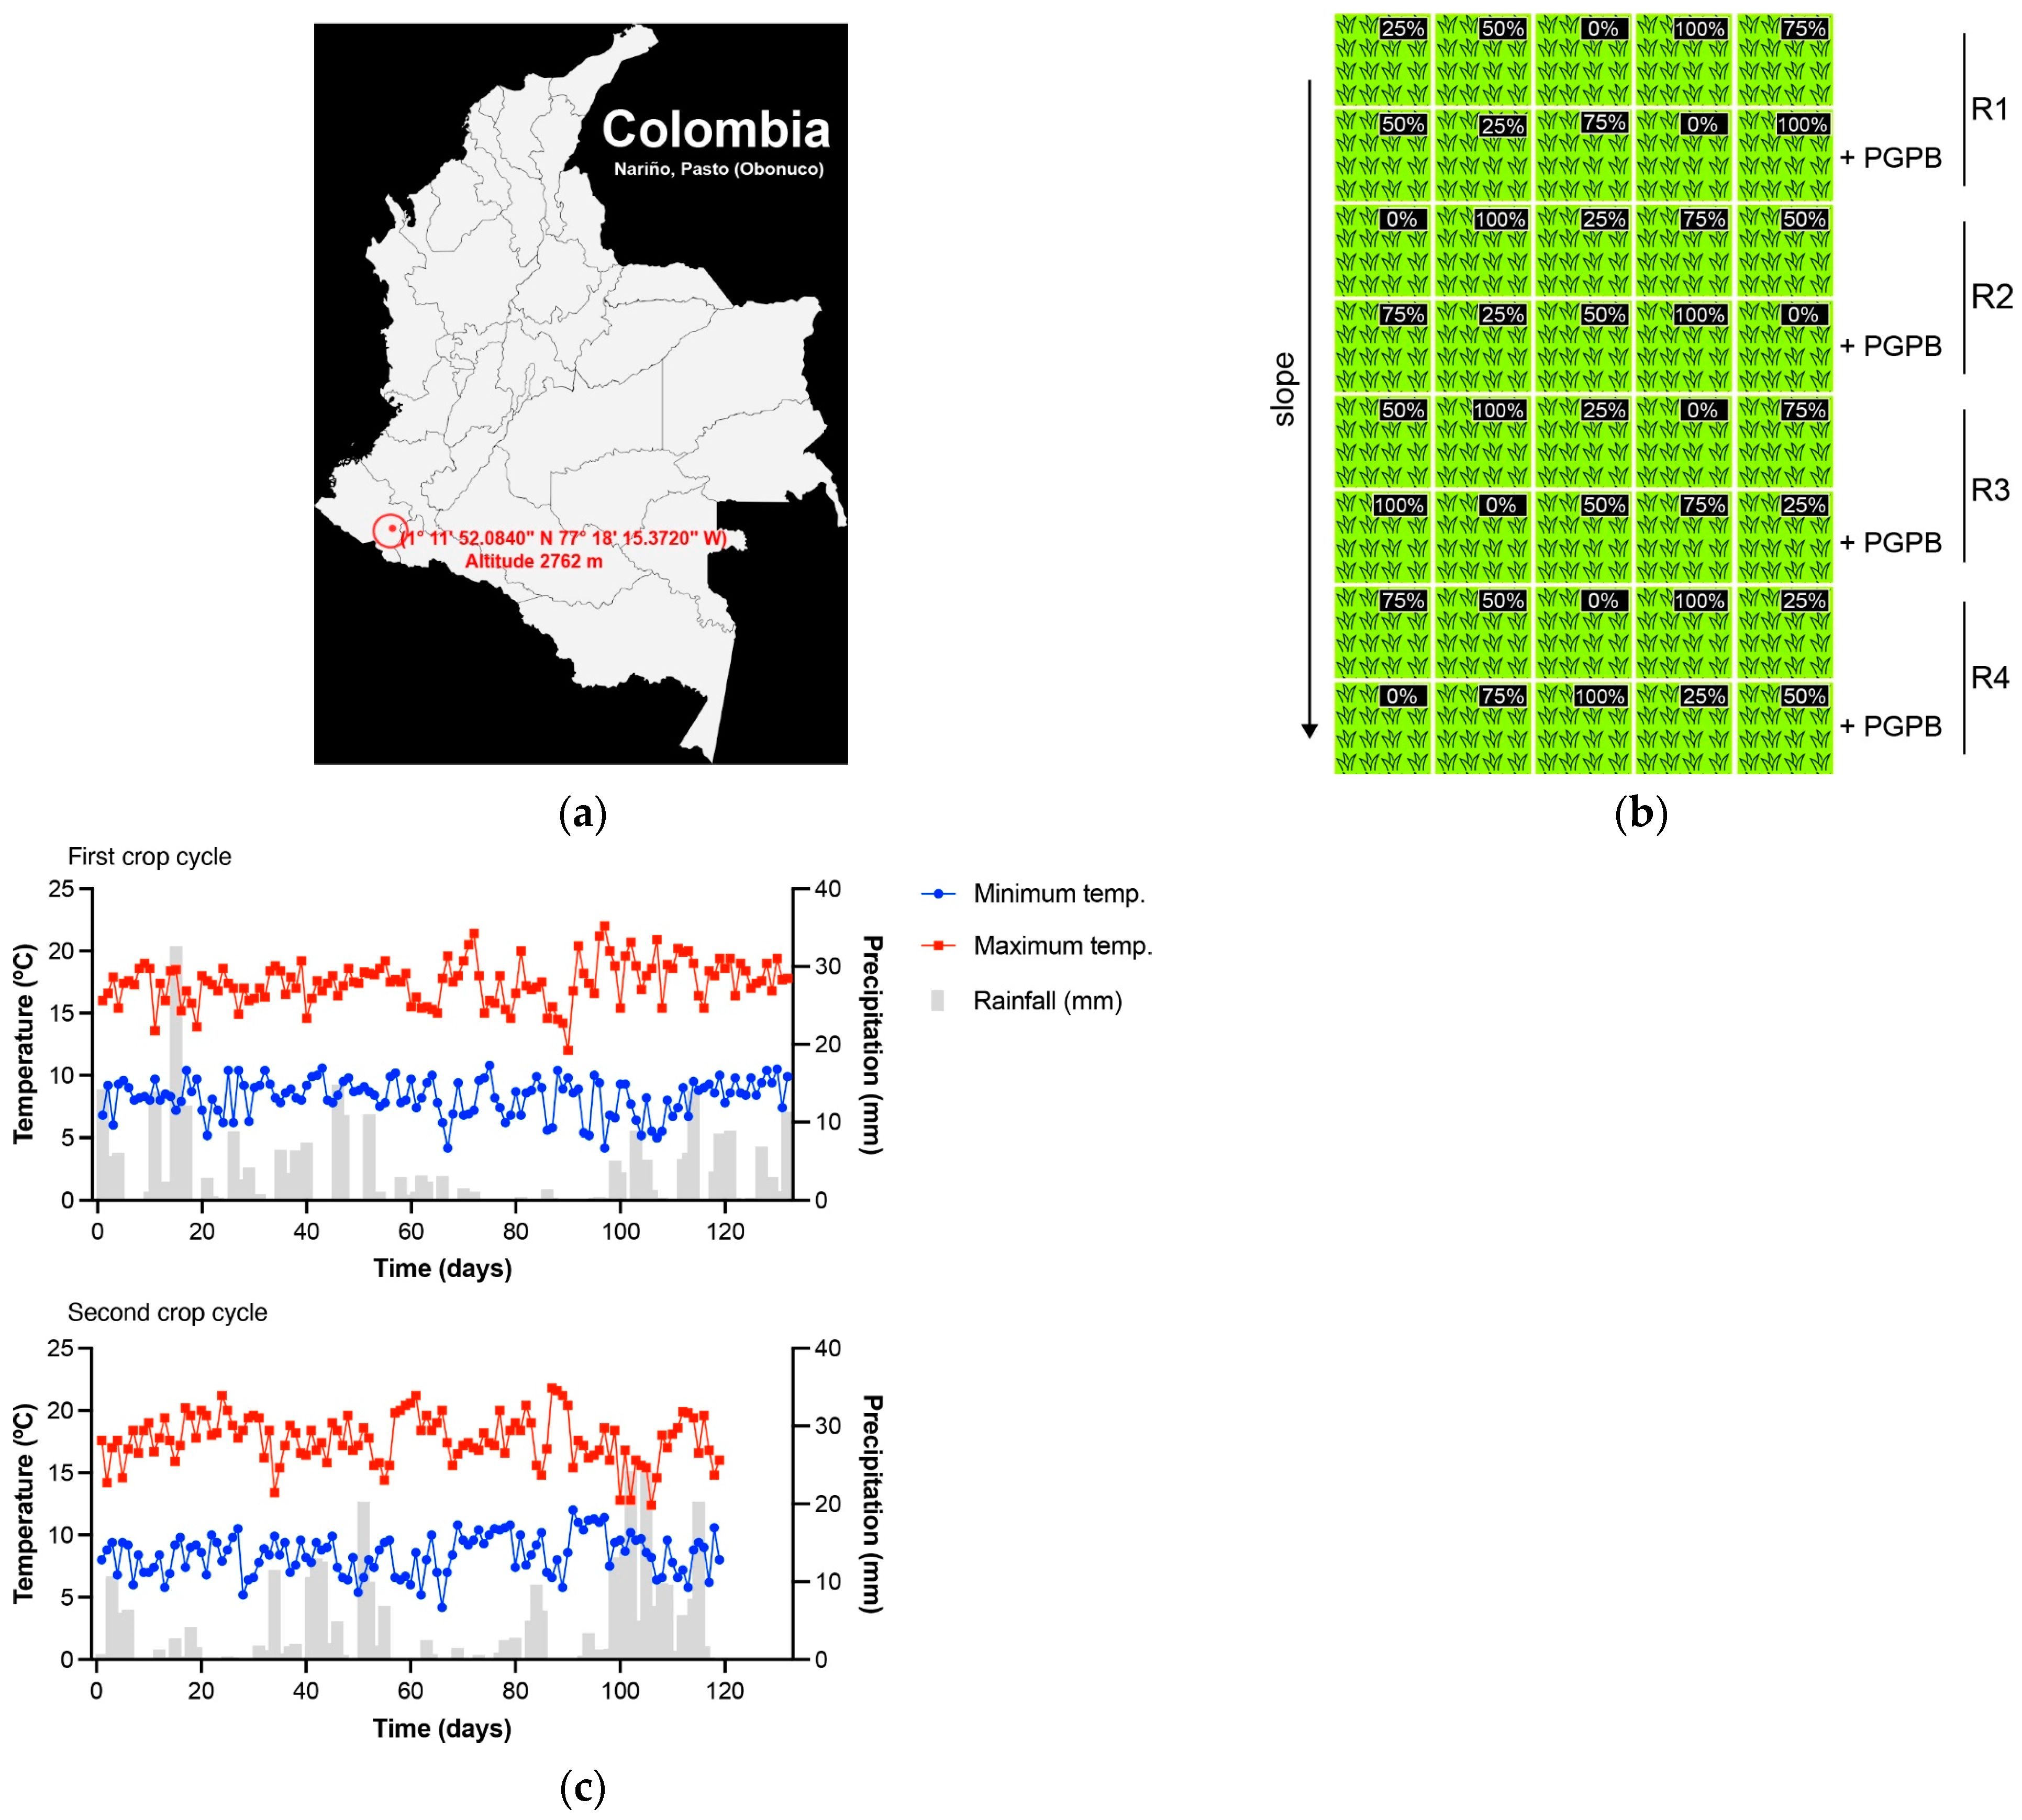
2.1. Experimental Design and Field Experiment Conditions

A field experiment was conducted in the Obonuco Research Center (1°11′52.55″ N; 77°18′25.67″ W) of AGROSAVIA in the city of Pasto, Nariño, Colombia (Figure 1a). The soil at the experiment site is characterized by a loamy texture and falls under the classification of Vitric Haplustands AMBc within the Andisol order [12].
A physicochemical analysis was carried out for the characterization of nutrient contents and apparent density, using the following methodologies: soil pH was determined in a soil/water solution (1:2.5 w/v) [13]. Soil organic matter content was assessed following the method described by Walkley & Black [14]. Available phosphorus was determined using the Bray II method [15]. Exchangeable K, Na, Ca, and Mg were measured through atomic absorption spectrophotometry using an ammonium acetate extraction method [16]. Soil micronutrients (Mn, Fe, and Zn) were determined by atomic absorption spectrophotometry using the double acid solution extractor Mehlich I [17], while S and B were quantified as described by Raij et al. [18]. The physicochemical characteristics of the soil were: pH 6.2, organic matter (34.1 g kg−1), P (77.54 mg kg−1), K (1.01 cmol kg−1), S (6.95 mg kg−1), Ca (6.06 cmol kg−1), Mg (1.16 cmol kg−1), Fe (335.61 mg kg−1), B (0.46 mg kg−1), Mn (5.69 mg kg−1), Cu (2.45 mg kg−1), Zn (3.61 mg kg−1), and apparent density (1.42 g cm−3).
This study covered two consecutive agronomic cycles of cabbage var. Green Ball, using similar management practices for both cycles. Cabbage seedlings (30 days old) were transplanted into the field at a planting density of 41,500 plants per hectare. Each experimental unit consisted of 60 plants within a 14.5 m2 area (5.8 m long and 2.5 m wide) (Figure 1b). The second crop cycle was initiated 40 days after harvesting the first cycle. Field soil was prepared conventionally, and any crop residues were cleared before preparing the soil for the subsequent cycle. Pest and disease control adhered to conventional management practices, and irrigation was carried out via sprinklers according to prevailing weather conditions.
The regional climate was classified as a warm summer Mediterranean climate (Csb) (C: temperate; s: rainy season in two periods; b: warm summer), according to the Köppen–Geiger climate classification [19]. Throughout the field experiment period (June 2022–March 2023), the average precipitation measured 300 and 336 mm in the first and second cycle, respectively. The average air temperature was 12.9 and 13.1 °C throughout the duration of the experiment [20] (Figure 1c). Irrigation was performed using a sprinkler system when the soil’s moisture level reached 75% of its field capacity.

2.2. Microbial Strains and Inoculum Culture Conditions

We used a consortium consisting of Azospirillum brasilense D7 (SAMN16830199), Herbaspirillum sp. AP21 (SAMN15498633), and Rhizobium leguminosarum T88 (SAMN15498640). These strains were chosen because of their capability to stimulate plant growth under nutritional stress conditions [21,22] and were provided by the Microorganisms Germplasm Collection of Microorganisms of the Colombian Corporation for Agricultural Research—AGROSAVIA, Mosquera, Colombia. A. brasilense D7 and Herbaspirillum sp. AP21 were routinely cultivated on DYGS medium (composition per liter: yeast extract, 0.5 g; glucose, 10 g; malic acid, 3 g; NH4Cl, 0.2 g; K2HPO4, 0.2 g; MgSO4·7H2O, 0.2 g; pH 6.8) at 30 °C for 48 h. R. leguminosarum T88 was cultured on YM medium (composition per liter: yeast extract, 0.5 g; mannitol, 10 g; CaCl2, 0.02 g; MgSO4·7H2O, 0.2 g; K2HPO4, 0.2 g; pH 7.0) at 30 °C for 72 h.
In the experiments, cells were cultivated in a 5.0 L Miniforce bioreactor (INFORS HT, Bottmingen, Switzerland) with a working volume of 3.5 L. The cells were cultured under standard conditions: 150 rpm, 30 °C temperature, and aeration set at 1.0 vvm. A. brasilense D7 and Herbaspirillum sp. AP21 were propagated in DYGS broth with an initial pH of 6.8, while R. leguminosarum T88 was cultured in YM medium with an initial pH of 7.0. The specified time and temperature conditions previously defined for each strain were applied to the fermentation process. Viable cell quantification was conducted via a plate count method using the appropriate culture medium. Microbial inoculation occurred at two distinct stages: during cabbage transplantation and 28 days post-transplantation. The consortium was prepared by combining equal proportions of each strain before application. In the inoculant applied, each strain was applied at a final concentration of 1 × 10⁸ CFU mL−1. The inoculation process involved drenching directed toward the plants, administering a dosage of 2.0 L ha−1. For the uniform application of the inoculum, we diluted it in distilled water at a ratio of 2.0 L of inoculant to 200 L of distilled water. In the uninoculated treatments, an equivalent volume of distilled water was applied to maintain consistency across all experimental conditions.

2.3. N and P Fertilization

The treatment labelled as 100% NP fertilization represents the standard commercial fertilization practiced in farm management, corresponding to 130 kg ha−1 of N and 114 kg ha−1 of P. From the standard management dosage, the treatments were set by reducing to 25%, 50%, 75%. Urea and diammonium phosphate (DAP) served as the sources of N and P for all treatments. The treatment labelled as 0% represents the negative control devoid of any mineral fertilization. Potassium (K) remained constant across treatments, administered at a consistent concentration of 50 kg ha−1 in the form of KCl. The N dosage was corrected based on the DAP rate applied, considering 180 g kg−1 of N present in DAP (Table 1). Mineral fertilization was applied 30 days after cabbage transplantation.

2.4. Evaluation of Cabbage Growth and Yield

When the cabbage head started to form, dry matter production and nutrient content were assessed. At this stage, four cabbage heads from each treatment were harvested, and the shoot was dried at 65 °C for 72 h to obtain the dry matter (DM). Additionally, four cabbage heads from each treatment were harvested to obtain the N and P content. For this purpose, shoot samples were oven-dried for 72 h at 60 °C, and chemical digestion was performed for the N content by using the Kjeldahl method [23]. Shoot P content was quantified by inductively coupled plasma–optical emission spectrometry (ICP-OES) analysis [24] at the Chemical Soil Laboratory of AGROSAVIA, Mosquera, Colombia.
N and P uptake were calculated as the product of the N and P concentration and DM cabbage yield, applying Equation (1):
N   o r   P   u p t a k e k g   h a 1 = ( N   o r   P   c o n t e n t   ( g   k g 1 ) × D M   y i e l d   ( k g   h a 1 ) ) 1000
At the final maturation stage, cabbage heads were classified by fresh weight, following the Colombian technical standard—NTC 1125 (Colombian Institute of Technical Standards and Certification—ICONTEC, 1979). Cabbage heads weighing over 2000 g were categorized as large, those ranging from 801 to 2000 g were classified as medium-sized, and those between 500 and 800 g were considered small. The agronomic yield was also calculated: all plants in the useful plot (22 plants; 5.31 m2) were harvested and the shoot dry weight was obtained by incubating at 65 °C for 72 h. The experimental yield (t ha−1) was estimated according to Equation (2):
A E   ( k g   k g 1 ) = [ D M f   ( k g   h a 1 ) D M c   ( k g   h a 1 ) ] F   ( k g   h a 1 )
where DMf is the yield with added nutrient fertilizers; DMc is the yield in control, without fertilization; and F is the nutrient applied via fertilizer.
Additionally, the relative agronomic effectiveness of biofertilization to the recommended dosage of N and P was calculated from the yield response relationships using Equation (3):
R A E % = ( Y i Y 0 N B ) ( Y 100 N B Y 0 N B ) × 100
where Yi is cabbage yield in the treatments with added NP fertilizers including biofertilization (t ha−1); Y100NB is the yield with the recommended dosage of N and P without biofertilization (reference fertilizer treatment, RAE = 100%) treatment; and Y0NB is the yield without NP fertilizer nor biofertilization (control).

2.5. Statistical Analysis

A two-way ANOVA analysis was conducted to evaluate the agronomic data. In the absence of interaction, Tukey’s test (p = 0.05) was used to evaluate the isolated effect of biofertilization. The effect of the NP dosage was adjusted to a linear or quadratic regression model. Relative agronomic effectiveness (RAE) was compared using Dunnett’s test. For analysis, we used the R software v.4.3.1 [25] and the AgroR package [26]. Data were submitted for Shapiro–Wilk’s normality test and Bartlett’s homogeneity test, and variables that did not meet the normality assumptions were normalized using the square root transformation of X + 0.5. Outliers were removed using standard deviation analysis if necessary [27].

3. Results

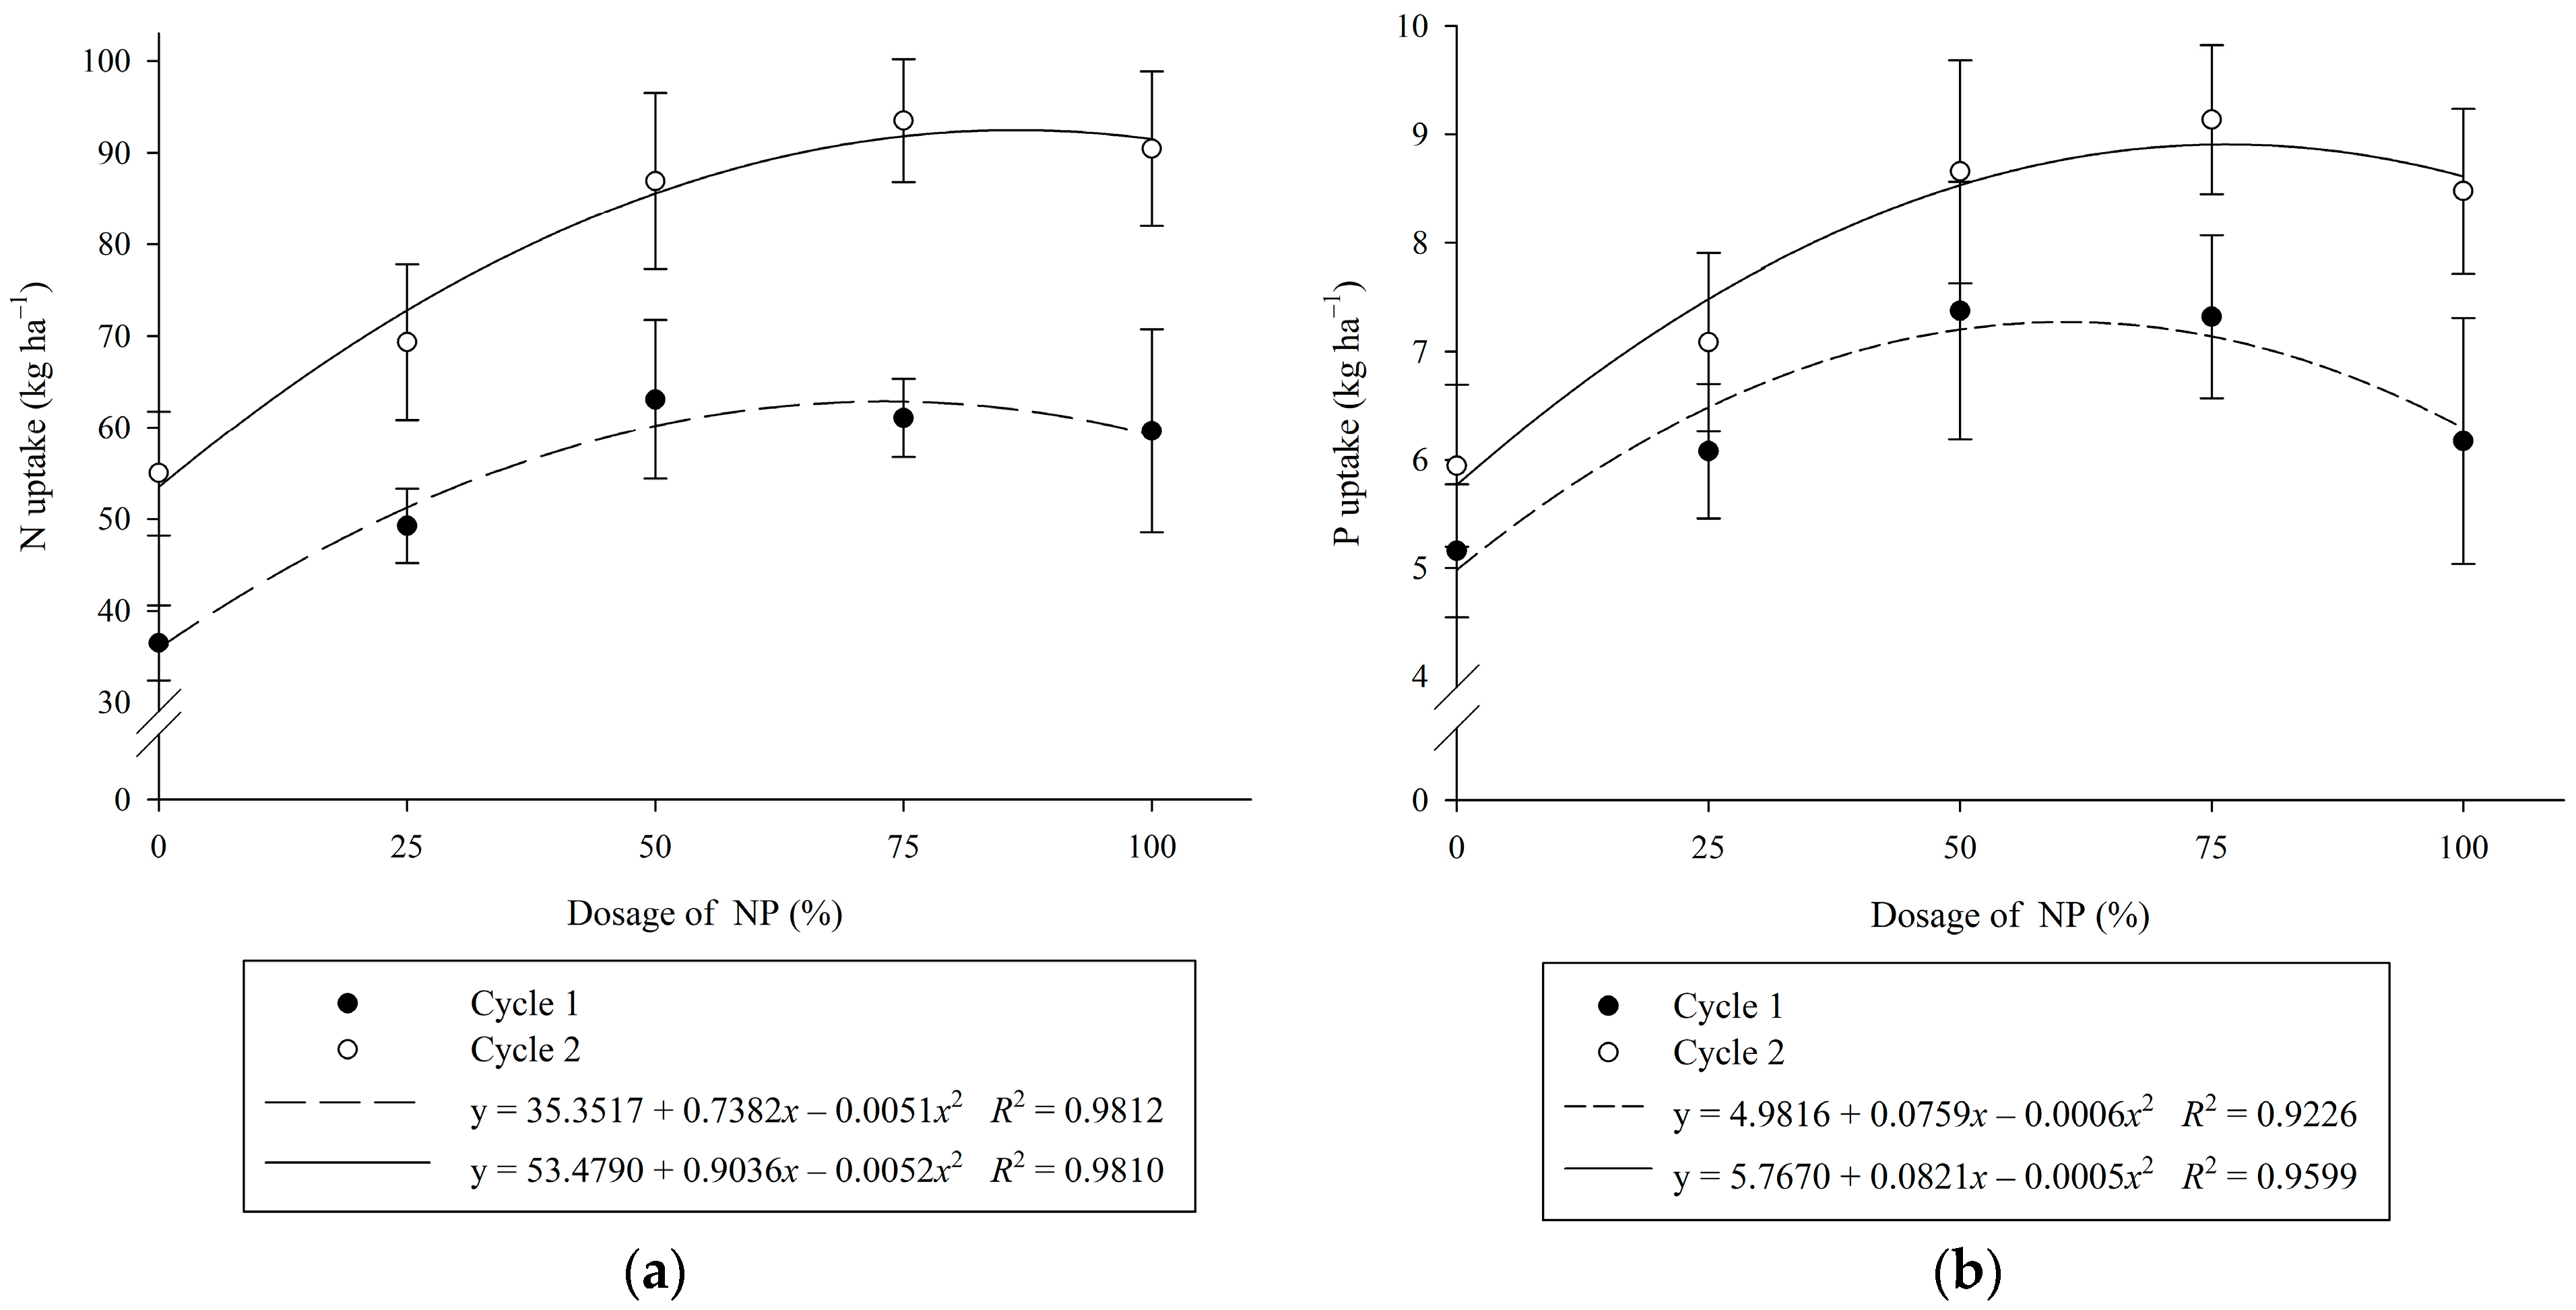
3.1. Impact of Mineral and Biological Fertilization on N and P Uptake

We studied the role of NP fertilization and biofertilization on N and P uptake. The results showed that NP fertilization had a significant impact on N and P uptake in shoots during cabbage head formation, while biofertilization had no discernible effects across both crop cycles (Table 2). We then performed correlation analyses between N and P uptake and NP fertilization doses, where we observed that the largest N uptake during the first crop cycle (62 kg ha−1) occurred at 72% of NP fertilization, while during the second cycle (92 kg ha−1), it was achieved at 86% of the NP dosage (Figure 2a). P uptake in the first and second cycles reached its highest level at 63% and 82% (9.1 kg ha−1) of NP fertilization, respectively (Figure 2b). Across both crop cycles, no interaction between NP fertilization and biofertilization was observed (Table 2).

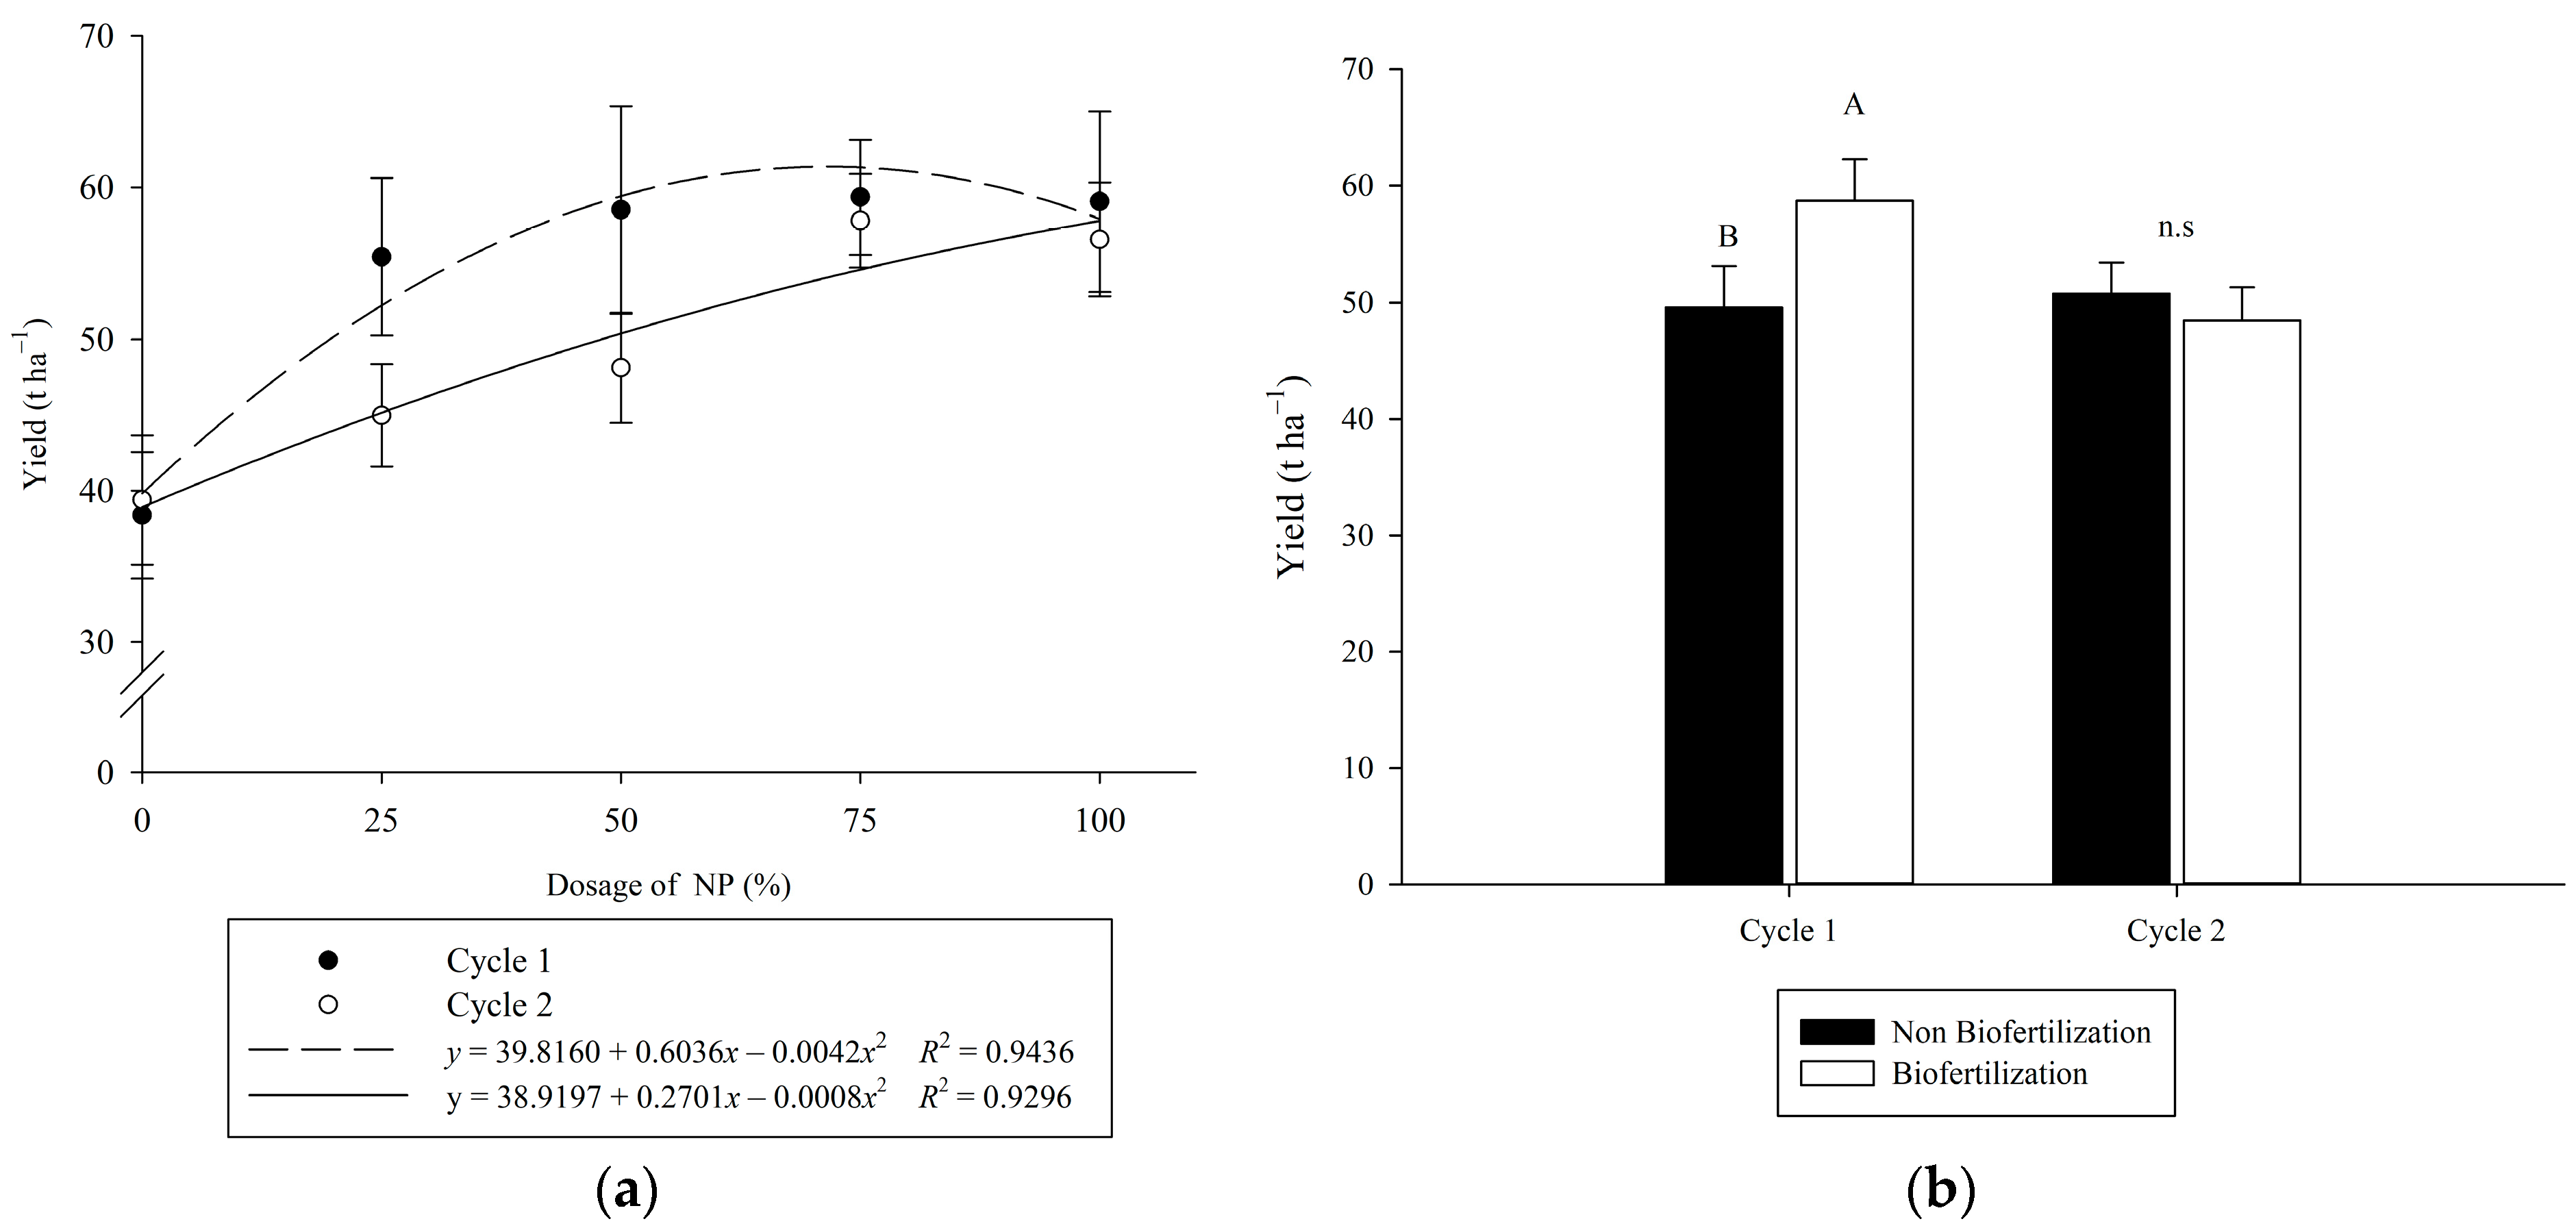
3.2. Impact of Mineral and Biological Fertilization on Cabbage Yield

Assessment of the role of fertilization on cabbage yield revealed a significant effect of both NP fertilization and PGPB usage; however, no observable effect was seen for the interaction between both factors. Correlation analyses showed that during the first crop cycle, 72% of the mineral fertilization dosage (93.6 kg ha−1 of N and 82.1 kg ha−1 of P) resulted in the maximum crop yield (61.5 t ha−1). In the second cycle, we noted a direct correlation between mineral fertilization and crop yield, with the most substantial impact on cabbage yield seen at 100% NP fertilization (Figure 3a). Moreover, biofertilization resulted in an average increase of 9 t ha−1 in crop yield during the first crop cycle compared to the control (Figure 3b). In contrast, during the second cycle, biofertilization had no significant effect on cabbage yield (Figure 3b).

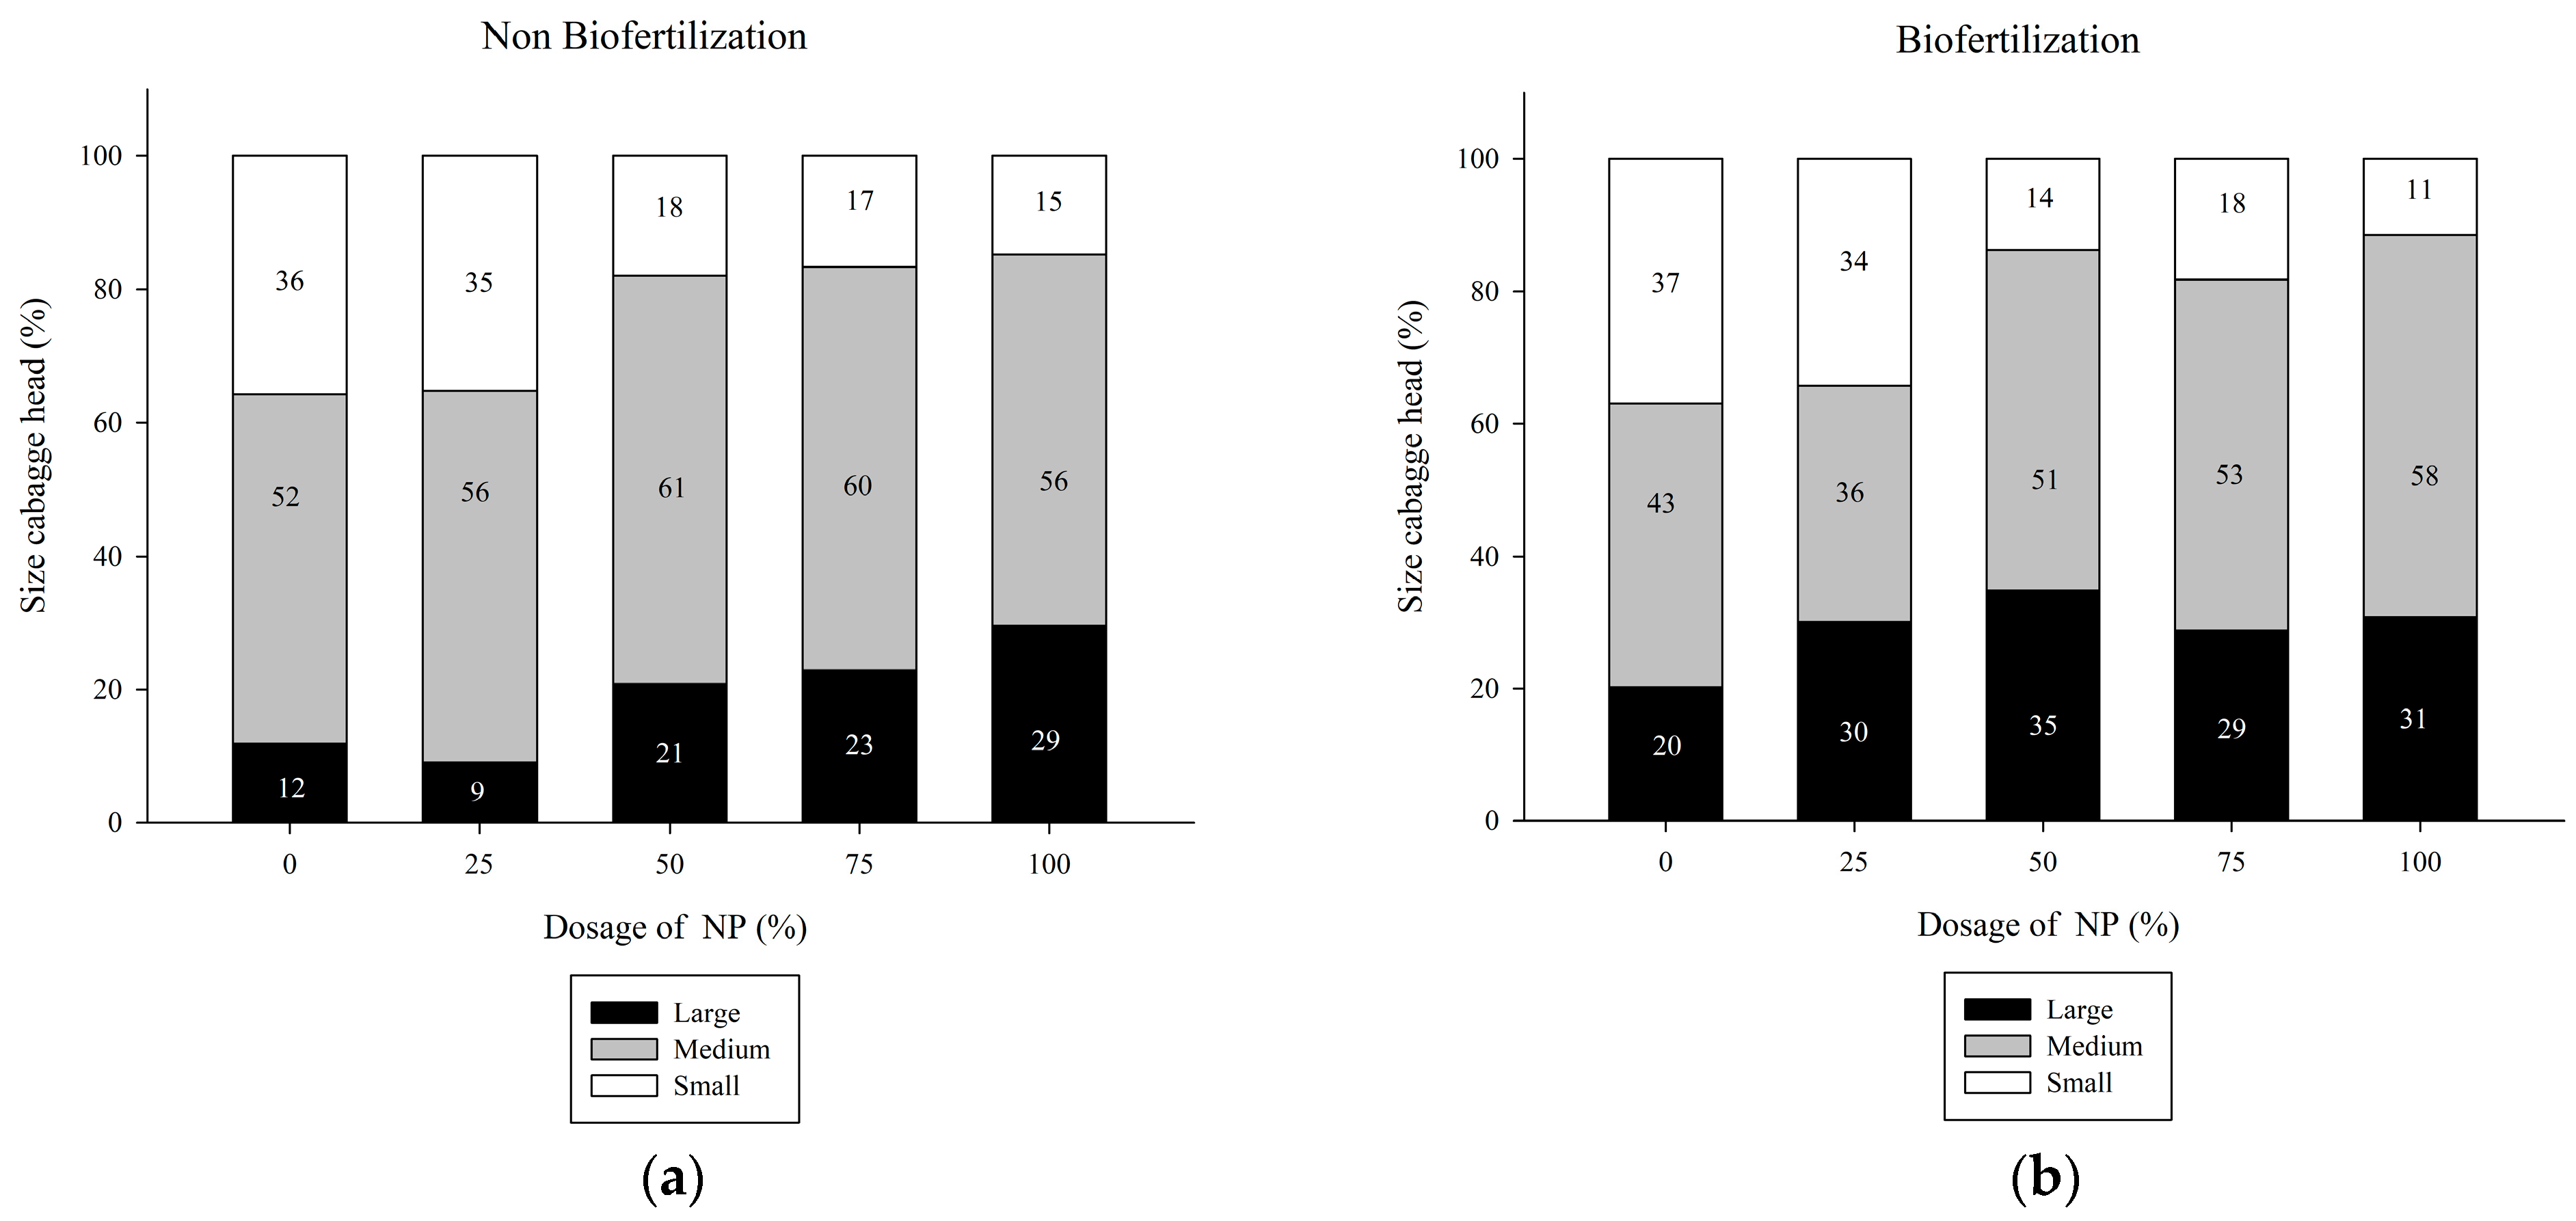
3.3. Effect of Mineral and Biological Fertilization on Cabbage Head Weight

The analysis of head cabbage weight indicated a notable increase in cabbage head size due to mineral fertilization (Figure 4). The highest proportion of largest cabbage heads was observed at 50% of mineral fertilization combined with biofertilization, as well as at 100% of fertilization without the bacterial consortium (Figure 4a). Plants that were treated with biofertilizer showed considerably greater sizes across various fertilization levels, except when the fertilization was at 100% of the recommended dosage. The analysis of medium-sized cabbage heads revealed a contrasting effect. Across all NP concentrations, plants untreated with PGPB exhibited the highest percentage of medium-sized cabbages (Figure 4b). Conversely, an inverse relationship between size and mineral fertilization was noted in small-sized cabbage heads, with no notable differences attributed to biofertilization (Figure 4a,b). These combined results highlight the influence of both mineral fertilization and biofertilization in the quality distribution of cabbage head sizes, ultimately favoring the growth of larger heads.

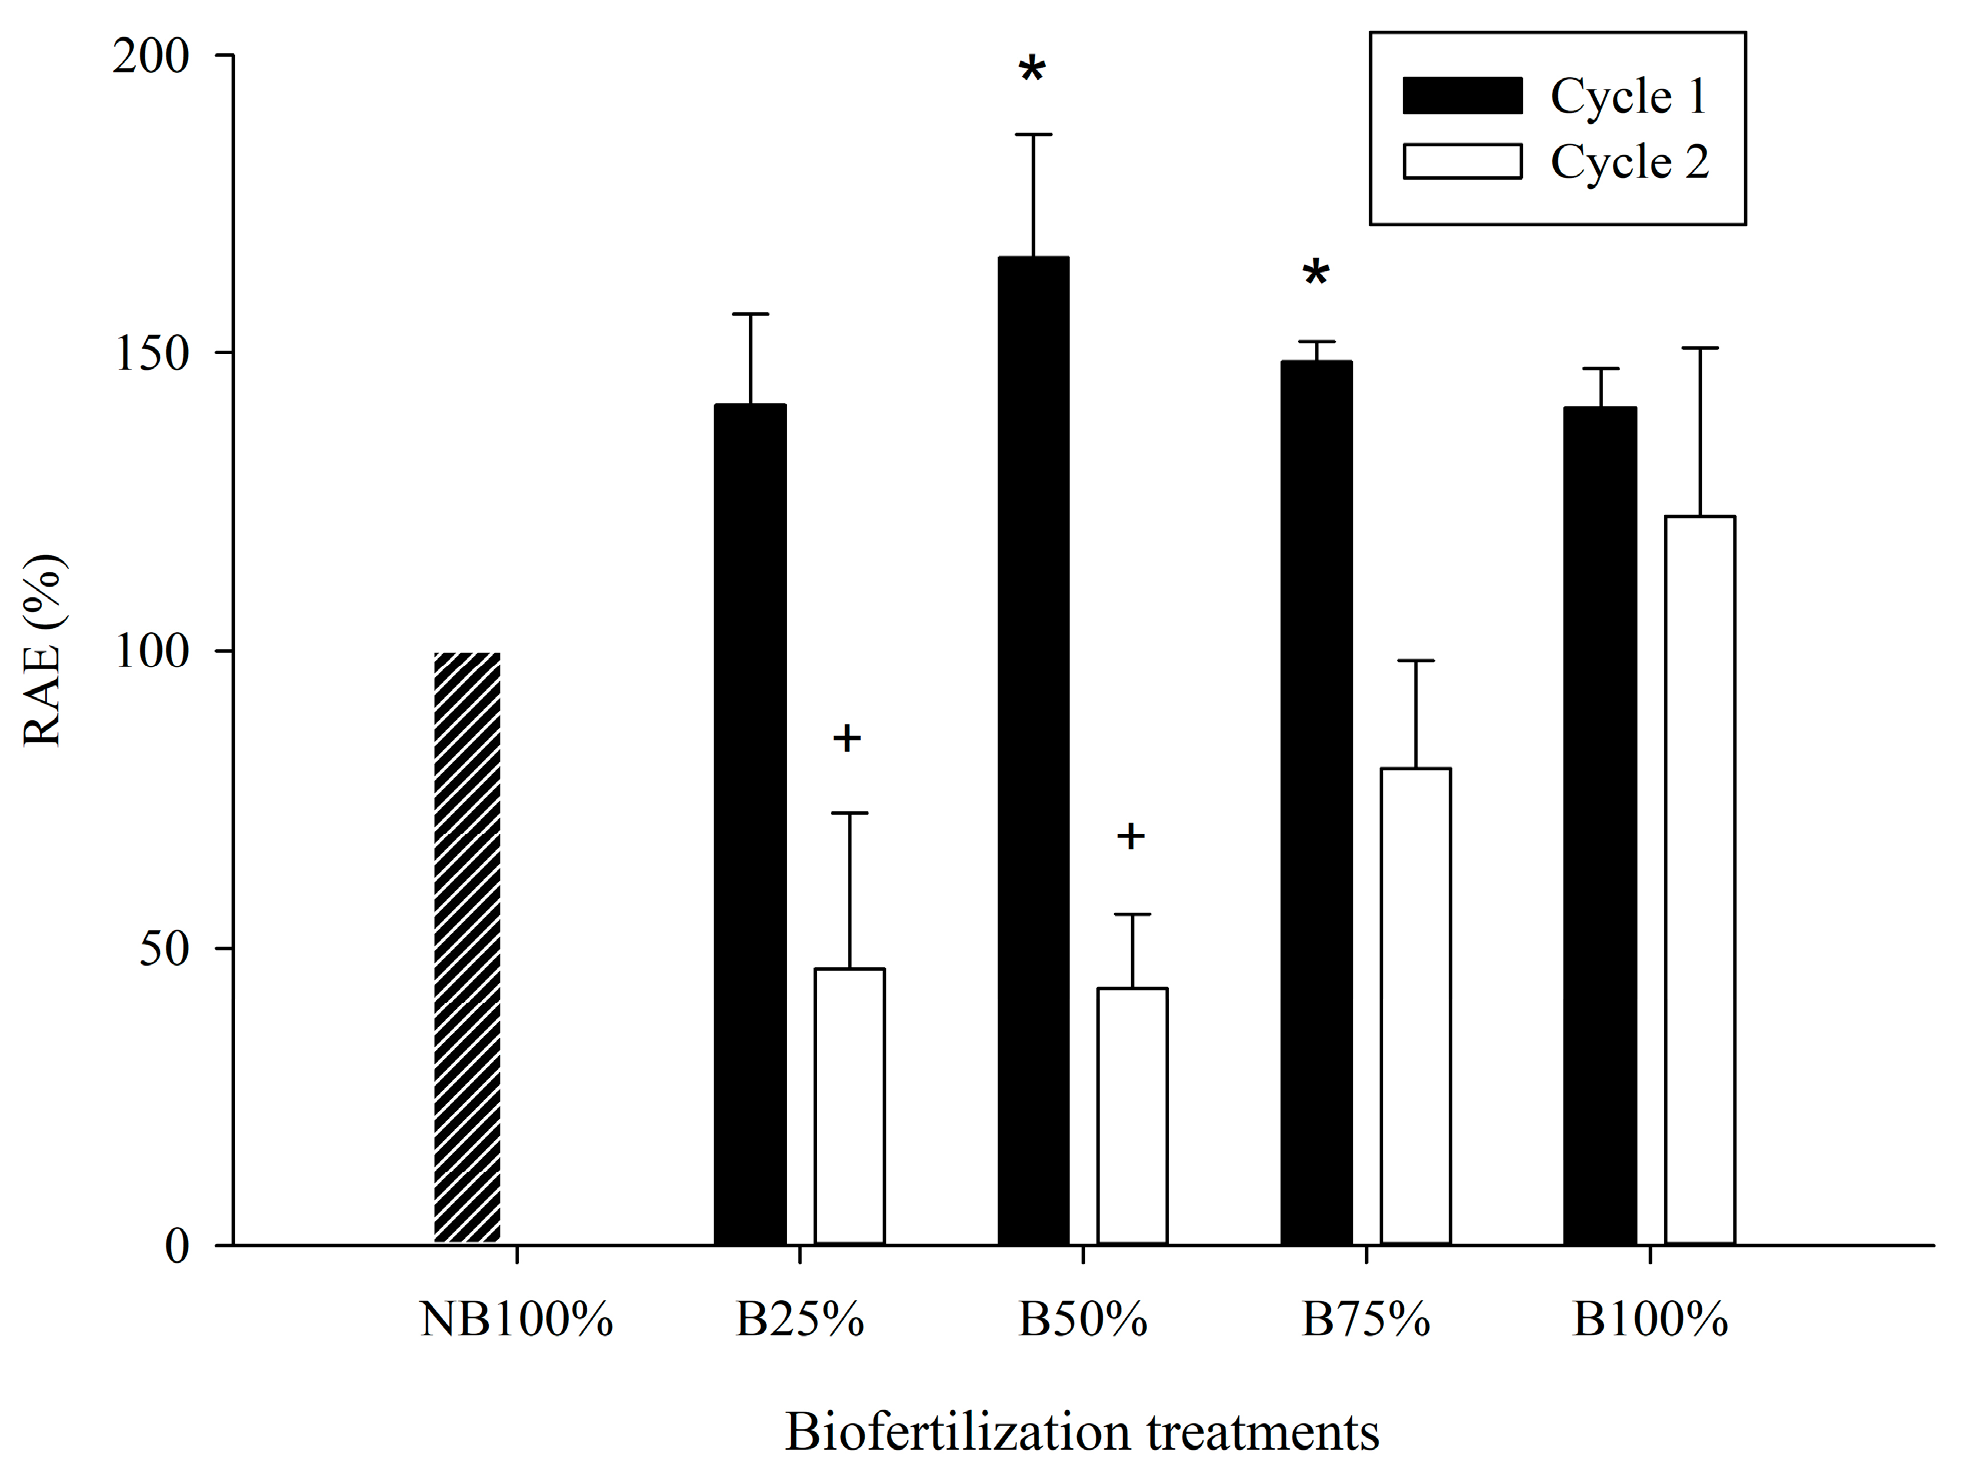
3.4. Relative Effect of Biological Fertilization on Agronomic Efficiency

In the first crop cycle, biofertilization notably improved the relative agronomic effectiveness (RAE) when used alongside 50% (65.0 kg ha−1 of N and 57.0 kg ha−1 of P) and 75% (97.5 kg ha−1 of N and 85.5 kg ha−1 of P) of mineral fertilization (Figure 5). Conversely, in the second cycle, the application of biofertilizer led to a decrease in the RAE. At 100% fertilization, the effect of biofertilization on RAE was negligible, indicating a potential decrease in effectiveness or a possible interaction between the two fertilization methods which occurs solely at higher fertilizer rates.

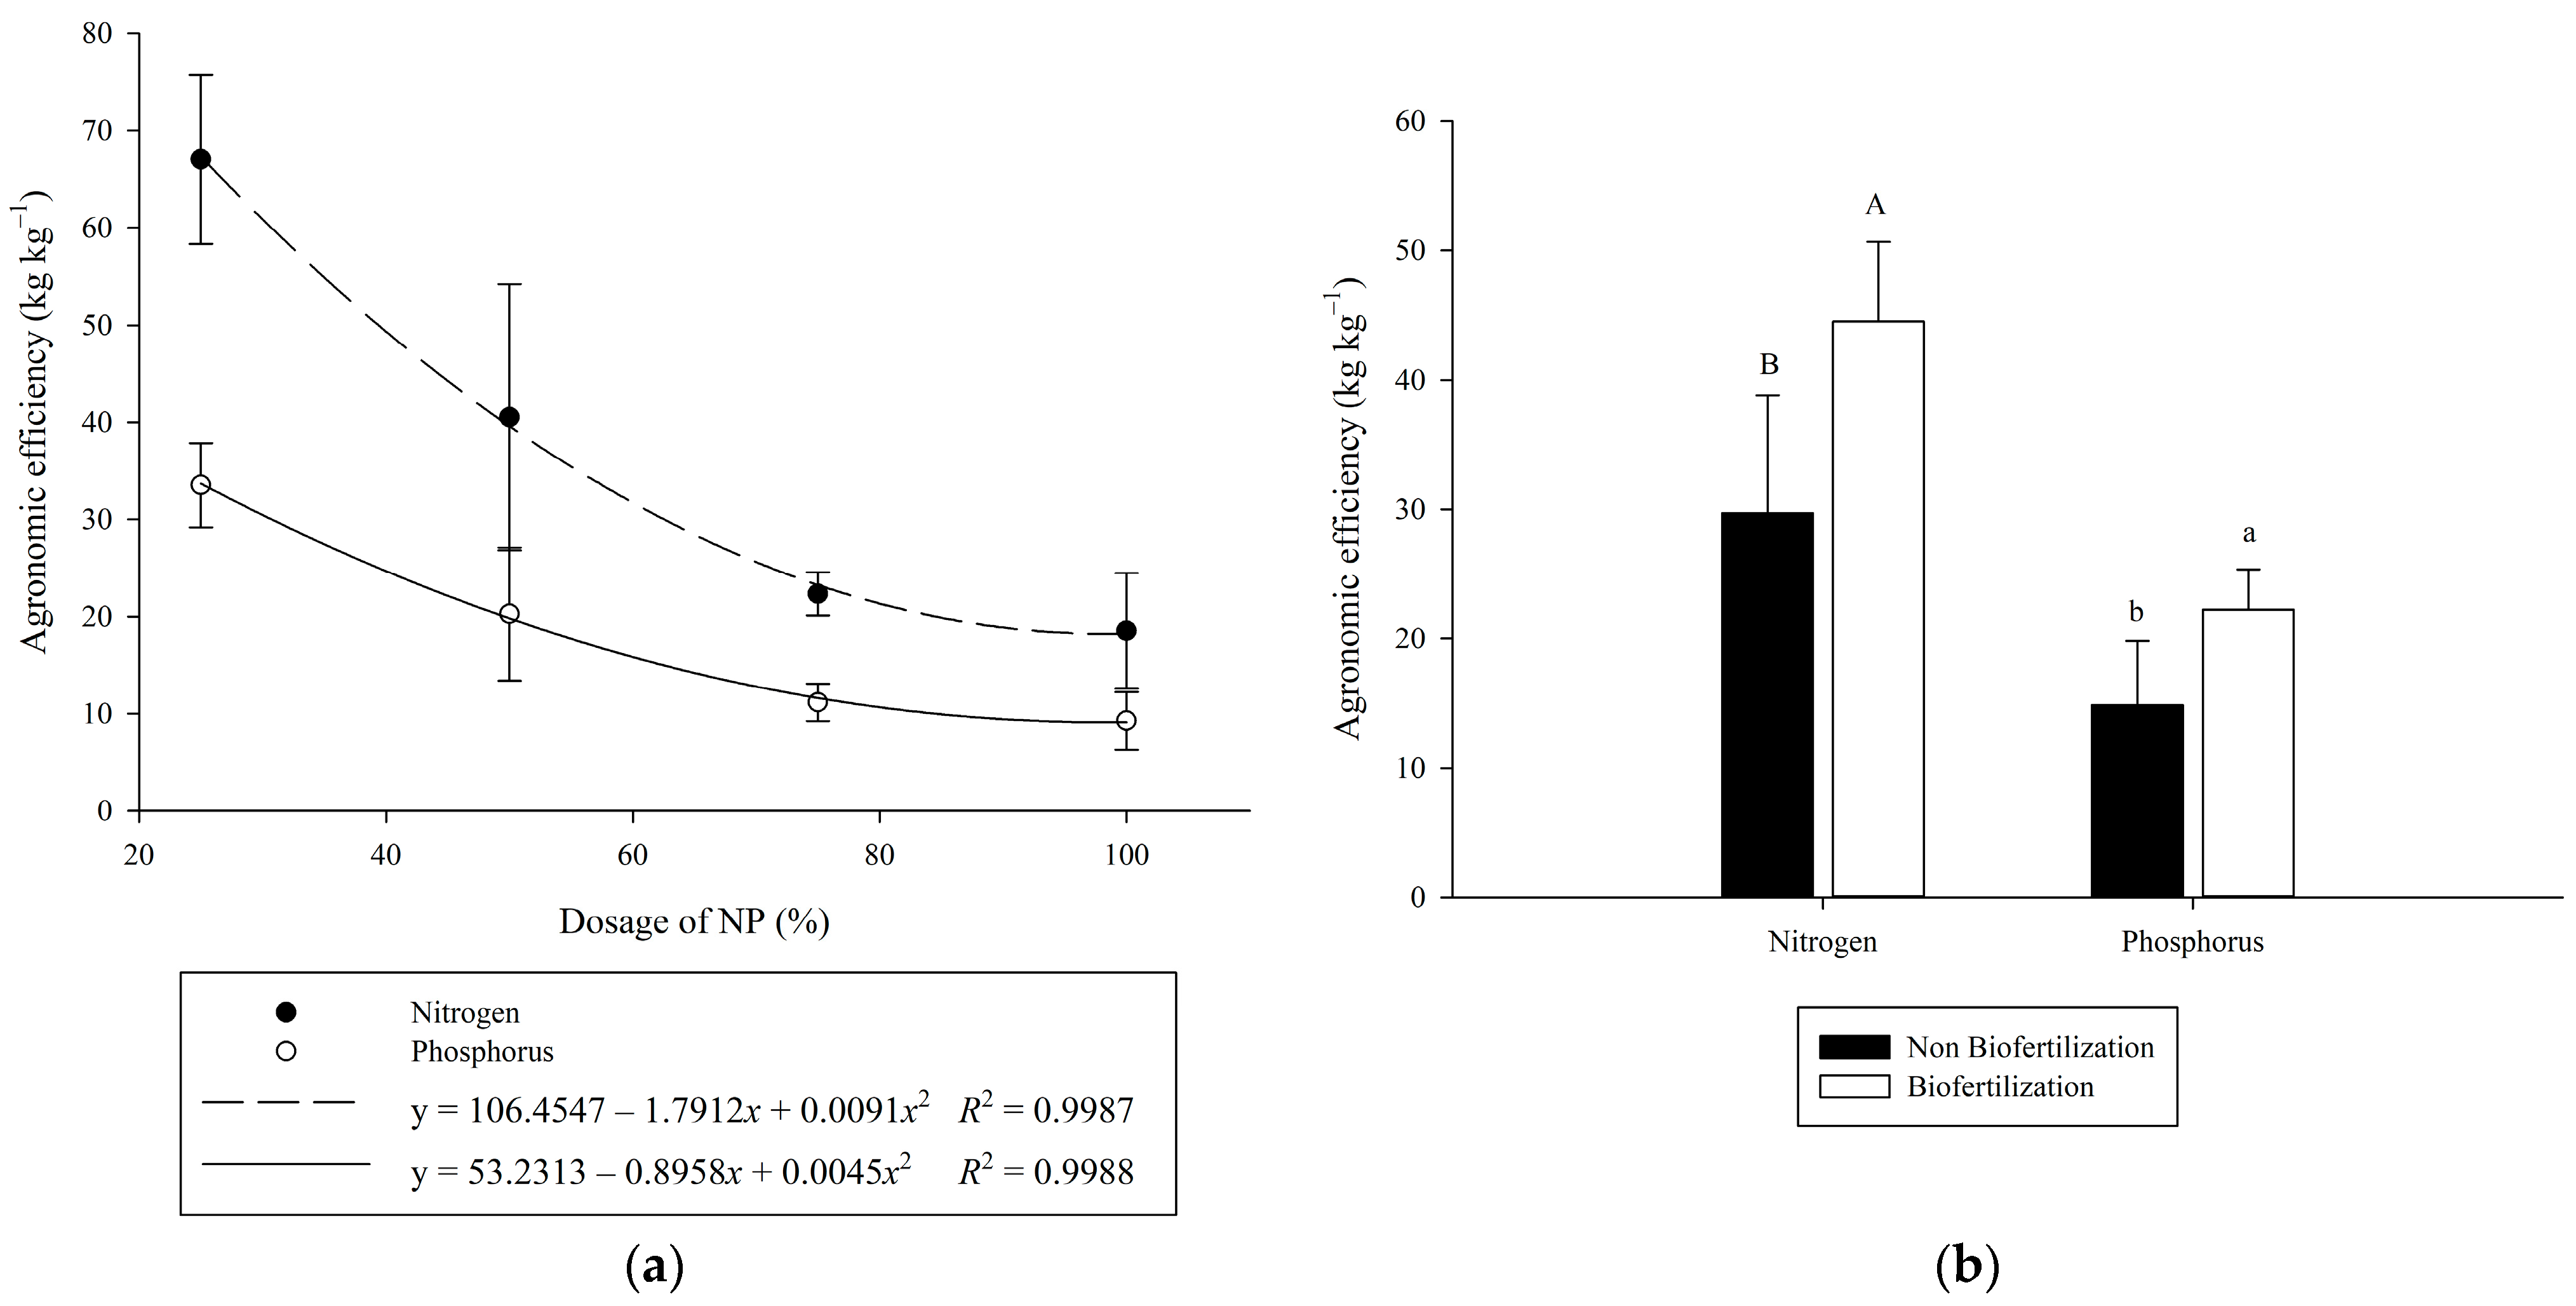
3.5. Agronomic Efficiency of Nitrogen and Phosphorus

The analysis of agronomic efficiency revealed that the N agronomic efficiency surpassed the P agronomic efficiency. Additionally, the highest efficiencies for both nutrients, N and P, occurred at lower mineral fertilizer dosages, followed by a decrease in efficiency as fertilizer dosages increased (Figure 6a). Concerning biofertilization, the consortium inoculation notably enhanced the agronomic efficiency of both nutrients, showing a 15 kg kg−1 increase in the N agronomic efficiency and a 7 kg kg−1 rise in the P agronomic efficiency (Figure 6b).

4. Discussion

Mineral fertilization and biofertilization are crucial factors shaping the productivity of cabbage. The application of appropriate dosages of fertilizers, considering the specific nutritional requirement of cabbage plants, directly impacts their growth, development, and final quality [28]. Similarly, plant growth-promoting bacteria can influence plant growth and development, thereby impacting overall crop performance. Cabbage stands out as a primary open-field vegetable crop characterized by a substantial N demand and moderate P absorption [29]. Hence, the generation of agronomical recommendations of fertilization that integrate both mineral and biological inputs are likely to result in increased crop yield, while also reducing the associated fertilization costs and the negative impact on the environment.
The application of mineral fertilizers resulted in an increased yield, quality, and nutritional content of cabbage. Furthermore, a simultaneous rise in both crop yield and nutritional quality was noted with the increase in the concentration of mineral fertilizers. This positive trend was evident up to approximately 75% of NP fertilization. Crop cycle also had a significant effect on plant nutrition and yield, which was evident in our experiments by differential N and P uptake. This demonstrates that historical land management substantially affects agronomic efficiency [30]. In our work, the first crop cycle was initiated after twelve months of fallow, with this extended period contributing to a substantial increase in the soil nutrient reservoir, positively impacting cabbage yield [31]. The second crop cycle was established immediately after the first harvest. Notably, in this cycle, we noticed reduced crop yields, especially in the treatments with lower mineral fertilizer dosages. This outcome highlights the importance of crop management to include appropriate fertilization rates and timing to maximize the benefits of both mineral fertilization and biofertilization for sustainable cabbage cultivation.
Biofertilization with the PGPB consortium had a positive impact on cabbage quality and yield. Consortium formulation with multiple PGPB has proven successful to improve plant development and yield under abiotic and nutritional stresses [32]. These effects can be attributed to the role of bacteria in increasing nutrient absorption and plant growth under adverse conditions. Some bacteria can use one or multiple strategies to influence plant growth in a direct or indirect manner. In terms of direct plant nutrition, biological N fixation and P mineralization and solubilization represent the two key mechanisms involved in plant growth stimulation. Further, increasing N and P availability has the potential to reduce the dosages of exogenous fertilization, thus decreasing the crop’s dependence on synthetic chemical fertilizers, as well as its associated negative impact on the environment.
Biological N fixation is defined as the microbial capacity to convert atmospheric N into assimilable forms [33]. In non-legume plants, this process naturally relies on the plant’s associated diazotroph community. Therefore, this process can be potentially enhanced by inoculation with nitrogen-fixing bacteria [34]. In this study, we used the strains Herbaspirillum sp. AP21 and A. brasilense D7 that are endophytic diazotrophs with multiple traits to promote plant growth, including the production of indole compounds and exopolysaccharides, biofilm formation, and ACC deaminase activity [35]. Interestingly, we observed an increase in the usage of N by cabbage, which can be potentially attributed to these PGP traits. In other studies, we also showed that inoculation with AP21 and D7 reduced applied N doses in forage crops by up to 50%, while simultaneously enhanced shoot N content and improved forage quality [21].
Phosphorus-solubilizing bacteria also play a significant role by converting insoluble P into plant-available forms, facilitating nutrient uptake [36]. Notably, the strains used in this study, R. leguminosarum T88 and Herbaspirillum sp. AP21, produce diverse organic acids, phosphomonoesterases, and phytases [37], which are associated with P solubilization and mineralization [38]. The enhanced efficiency of P usage observed may thus be attributed to the role of microbes in the mobilization of adsorbed soil P minerals and the mineralization of organic matter [39]. The individual and combined PGP traits of each strain within the consortium likely resulted in the increase in the relative agronomic efficiency at low doses of NP.

5. Conclusions

The present study highlights the efficacy of biofertilization and optimized mineral NP fertilization in enhancing cabbage yield and quality while reducing mineral fertilizer usage. These findings thus serve as a technological recommendation for cabbage farmers, indicating the appropriate use of chemical and biological fertilization to achieve the optimal crop response. However, it is necessary to validate these results in various soil types and replicate the experiment over successive crop cycles to ensure the reliability and generalizability of the findings.

Author Contributions

All authors made direct intellectual contributions to the manuscript. Conceptualization, All authors; methodology, All authors; software, W.F.B.-H. and C.A.M.-P.; formal analysis, W.F.B.-H. and C.A.M.-P.; investigation, All authors; resources, G.A.E.-B.; data curation, W.F.B.-H.; writing—original draft preparation, All authors; writing—review and editing, W.F.B.-H., D.F.R.-T. and G.A.E.-B.; visualization, W.F.B.-H. and D.F.R.-T. supervision, G.A.E.-B.; project administration, G.A.E.-B.; funding acquisition, G.A.E.-B. All authors have read and agreed to the published version of the manuscript.

Funding

This study is part of the science, technology, and innovation project “Fortalecimiento de capacidades para la innovación en la agricultura campesina familiar y comunitaria tendiente a mejorar los medios de vida de la población vulnerable frente a los impactos del COVID-19 en la subregión Centro del departamento de Nariño” supported by the Science, Technology, and Innovation Fund of the Colombian general royalties’ system (Code BPIN2020000100702). COLCIENCIAS, Colombia (Colombian Department of Science, Technology and Innovation, 2014/call 646) supported the fellowship of the first author.

Data Availability Statement

Data are contained within the article.

Acknowledgments

The authors thank Bruna Arruda for her valuable contribution to this manuscript and Lady Molano for the administrative management of this project. The authors are also grateful to the members of the Sistemas Agropecuarios Sostenibles research group and the research personnel at the C.I. Obonuco, Pasto, Colombia.

Conflicts of Interest

Wilfrand F. Bejarano-Herrera, Carlos A. Marcillo-Paguay, Daniel F. Rojas-Tapias and German A. Estrada-Bonilla were employed by company “Corporación Colombiana de Investigación Agropecuaria”. The authors declare that the research was conducted in the absence of any commercial or financial relationships that could be construed as a potential conflict of interest.

References

  1. Moreb, N.; Murphy, A.; Jaiswal, S.; Jaiswal, A.K. Cabbage. In Nutritional Composition and Antioxidant Properties of Fruits and Vegetables; Elsevier: Amsterdam, The Netherlands, 2020; pp. 33–54. [Google Scholar]
  2. MADR. Cadena de Las Hortalizas; Ministerio de Agricultura y Desarrollo Rural: Bogotá, Colombia, 2021. Available online: https://sioc.minagricultura.gov.co/Hortalizas/Documentos/2019-06-30%20Cifras%20Sectoriales.pdf (accessed on 18 December 2023).
  3. Jin, L.; Jin, N.; Wang, S.; Li, J.; Meng, X.; Xie, Y.; Wu, Y.; Luo, S.; Lyu, J.; Yu, J. Changes in the Microbial Structure of the Root Soil and the Yield of Chinese Baby Cabbage by Chemical Fertilizer Reduction with Bio-Organic Fertilizer Application. Microbiol. Spectr. 2022, 10, e01215-22. [Google Scholar] [CrossRef] [PubMed]
  4. Kanter, D.R.; Chodos, O.; Nordland, O.; Rutigliano, M.; Winiwarter, W. Gaps and Opportunities in Nitrogen Pollution Policies around the World. Nat. Sustain. 2020, 3, 956–963. [Google Scholar] [CrossRef]
  5. Poria, V.; Dębiec-Andrzejewska, K.; Fiodor, A.; Lyzohub, M.; Ajijah, N.; Singh, S.; Pranaw, K. Plant Growth-Promoting Bacteria (PGPB) Integrated Phytotechnology: A Sustainable Approach for Remediation of Marginal Lands. Front. Plant. Sci. 2022, 13, 999866. [Google Scholar] [PubMed]
  6. Emmanuel, O.C.; Babalola, O.O. Productivity and Quality of Horticultural Crops through Co-Inoculation of Arbuscular Mycorrhizal Fungi and Plant Growth Promoting Bacteria. Microbiol. Res. 2020, 239, 126569. [Google Scholar] [CrossRef] [PubMed]
  7. Demay, J.; Ringeval, B.; Pellerin, S.; Nesme, T. Half of Global Agricultural Soil Phosphorus Fertility Derived from Anthropogenic Sources. Nat. Geosci. 2023, 16, 69–74. [Google Scholar]
  8. Raymond, J.; Siefert, J.L.; Staples, C.R.; Blankenship, R.E. The Natural History of Nitrogen Fixation. Mol. Biol. Evol. 2004, 21, 541–554. [Google Scholar] [CrossRef] [PubMed]
  9. Cassán, F.; Coniglio, A.; López, G.; Molina, R.; Nievas, S.; de Carlan, C.L.N.; Donadio, F.; Torres, D.; Rosas, S.; Pedrosa, F.O.; et al. Everything You Must Know about Azospirillum and Its Impact on Agriculture and Beyond. Biol. Fertil. Soils 2020, 56, 461–479. [Google Scholar] [CrossRef]
  10. Beltran-Medina, I.; Romero-Perdomo, F.; Molano-Chavez, L.; Gutiérrez, A.Y.; Silva, A.M.M.; Estrada-Bonilla, G. Inoculation of Phosphate-Solubilizing Bacteria Improves Soil Phosphorus Mobilization and Maize Productivity. Nutr. Cycl. Agroecosyst. 2023, 126, 21–34. [Google Scholar] [CrossRef]
  11. Sarkar, D.; Sankar, A.; Devika, O.S.; Singh, S.; Shikha; Parihar, M.; Rakshit, A.; Sayyed, R.Z.; Gafur, A.; Ansari, M.J.; et al. Optimizing Nutrient Use Efficiency, Productivity, Energetics, and Economics of Red Cabbage Following Mineral Fertilization and Biopriming with Compatible Rhizosphere Microbes. Sci. Rep. 2021, 11, 15680. [Google Scholar]
  12. IUSS Working Group WRB. World Reference Base for Soil Resources 2014 International Soil Classification System for Naming Soils and Creating Legends for Soil Maps; 2014; FAO: Rome, Italy; Available online: https://www.fao.org/3/i3794en/I3794en.pdf (accessed on 18 December 2023).
  13. Peech, M. Hydrogen-Ion Activity. In Methods of Soil Analysis: Part 2 Chemical and Microbiological Properties; American Society of Agronomy: Madison, WI, USA, 2016; pp. 914–926. Available online: https://acsess.onlinelibrary.wiley.com/doi/abs/10.2134/agronmonogr9.2.c9 (accessed on 18 December 2023).
  14. Walkley, A.; Black, I.A. An Examination Of The Degtjareff Method For Determining Soil Organic Matter, and A Proposed Modification of the Chromic Acid Titration Method. Soil Sci. 1934, 37, 29–38. [Google Scholar] [CrossRef]
  15. Bray, R.H.; Kurtz, L.T. Determination of Total, Organic, and Available Forms of Phosphorus in Soils. Soil Sci. 1945, 59, 39–46. [Google Scholar] [CrossRef]
  16. Sparks, D.; Bartels, J. Part 3 Chemical Methods. In Methods of Soil Analysis; Soil Science Society of America: Madison, WI, USA, 1996; Available online: https://acsess.onlinelibrary.wiley.com/doi/book/10.2136/sssabookser5.3 (accessed on 18 December 2023).
  17. Mehlich, A. New Extractant for Soil Test Evaluation of Phosphorus, Potassium, Magnesium, Calcium, Sodium, Manganese and Zinc. Commun. Soil Sci. Plant. Anal. 1978, 9, 477–492. [Google Scholar]
  18. Raij, B.; Andrade, J.C.; Cantarella, H.; Quaggio, J.A. Análise Química Para Avaliação Da Fertilidade de Solos Tropicais. Instituto Agronômico: Campinas, Brazil, 2001. Available online: https://lab.iac.sp.gov.br/Publicacao/Raij_et_al_2001_Metod_Anal_IAC.pdf (accessed on 18 December 2023).
  19. Köppen, W.; Geiger, R. Klimate der Erde. Verlag Justus Perthes, Wall-Map 150 cm × 200 cm. 1928, pp. 91–102. Available online: https://www.scirp.org/reference/ReferencesPapers?ReferenceID=2093052 (accessed on 18 December 2023).
  20. Instituto de Hidrología Meteorología y Estudios Ambientales (IDEAM). Datos Hidrometeorológicos; IDEAM: Bogotá, Colombia, 2023. Available online: https://www.datos.gov.co/Ambiente-y-Desarrollo-Sostenible/Catalogo-Estaciones-IDEAM/n6vw-vkfe (accessed on 18 December 2023).
  21. Pardo-Díaz, S.; Romero-Perdomo, F.; Mendoza-Labrador, J.; Delgadillo-Duran, D.; Castro-Rincon, E.; Silva, A.M.M.; Rojas-Tapias, D.F.; Cardoso, E.J.B.N.; Estrada-Bonilla, G.A. Endophytic PGPB Improves Plant Growth and Quality, and Modulates the Bacterial Community of an Intercropping System. Front. Sustain. Food Syst. 2021, 5, 715270. [Google Scholar] [CrossRef]
  22. Torres-Cuesta, D.; Mora-Motta, D.; Chavarro-Bermeo, J.P.; Olaya-Montes, A.; Vargas-Garcia, C.; Bonilla, R.; Estrada-Bonilla, G. Phosphate-Solubilizing Bacteria with Low-Solubility Fertilizer Improve Soil P Availability and Yield of Kikuyu Grass. Microorganisms 2023, 11, 1748. [Google Scholar] [CrossRef] [PubMed]
  23. Nelson, D.W.; Sommers, L.E. Determination of Total Nitrogen in Plant Material. Agron. J. 1973, 65, 109–112. [Google Scholar] [CrossRef]
  24. Wieczorek, D.; Żyszka-Haberecht, B.; Kafka, A.; Lipok, J. Determination of Phosphorus Compounds in Plant Tissues: From Colourimetry to Advanced Instrumental Analytical Chemistry. Plant Methods 2022, 18, 22. [Google Scholar] [CrossRef] [PubMed]
  25. R Core Team. RStudio: Integrated Development Environment for R. 2023-06-16; R Core Team: Vienna, Austria, 2023. [Google Scholar]
  26. Shimizu, G.D.; Marubayashi, R.Y.; Goncalves, L.S. AgroR: Experimental Statistics and Graphics for Agricultural Sciences. 2023. Available online: https://agronomiar.github.io/AgroR_package/index.html (accessed on 1 January 2024).
  27. Aguinis, H.; Gottfredson, R.K.; Joo, H. Best-Practice Recommendations for Defining, Identifying, and Handling Outliers. Organ. Res. Methods 2013, 16, 270–301. [Google Scholar] [CrossRef]
  28. Coolong, T.; Cassity-Duffey, K.; Ribeiro da Silva, A.L.B. Influence of Nitrogen Rate, Fertilizer Type, and Application Method on Cabbage Yield and Nutrient Concentrations. Horttechnology 2022, 32, 134–139. [Google Scholar]
  29. Kosson, R.; Felczyński, K.; Szwejda-Grzybowska, J.; Grzegorzewska, M.; Tuccio, L.; Agati, G.; Kaniszewski, S. Nutritive Value of Marketable Heads and Outer Leaves of White Head Cabbage Cultivated at Different Nitrogen Rates. Acta Agric. Scand. B Soil Plant Sci. 2017, 67, 524–533. [Google Scholar] [CrossRef]
  30. Qu, Z.; Qi, X.; Wang, J.; Chen, Q.; Li, C. Effects of Nitrogen Application Rate and Topdressing Times on Yield and Quality of Chinese Cabbage and Soil Nitrogen Dynamics. Environ. Pollut. Bioavailab. 2019, 31, 1–8. [Google Scholar] [CrossRef]
  31. Tian, G.; Kang, B.T.; Kolawole, G.O.; Idinoba, P.; Salako, F.K. Long-Term Effects of Fallow Systems and Lengths on Crop Production and Soil Fertility Maintenance in West Africa. Nutr. Cycl. Agroecosyst. 2005, 71, 139–150. [Google Scholar]
  32. Liu, X.; Mei, S.; Salles, J.F. Inoculated Microbial Consortia Perform Better than Single Strains in Living Soil: A Meta-Analysis. Appl. Soil Ecol. 2023, 190, 105011. [Google Scholar] [CrossRef]
  33. Burris, R.H.; Roberts, G.P. Biological Nitrogen Fixation. Annu. Rev. Nutr. 1993, 13, 317–335. [Google Scholar] [CrossRef] [PubMed]
  34. Guo, K.; Yang, J.; Yu, N.; Luo, L.; Wang, E. Biological Nitrogen Fixation in Cereal Crops: Progress, Strategies, and Perspectives. Plant. Commun. 2023, 4, 100499. [Google Scholar] [PubMed]
  35. Cortés-Patiño, S.; Vargas, C.; Álvarez-Flórez, F.; Bonilla, R.; Estrada-Bonilla, G. Potential of Herbaspirillum and Azospirillum Consortium to Promote Growth of Perennial Ryegrass under Water Deficit. Microorganisms 2021, 9, 91. [Google Scholar] [PubMed]
  36. Rawat, P.; Das, S.; Shankhdhar, D.; Shankhdhar, S.C. Phosphate-Solubilizing Microorganisms: Mechanism and Their Role in Phosphate Solubilization and Uptake. J. Soil Sci. Plant Nutr. 2021, 21, 49–68. [Google Scholar] [CrossRef]
  37. Santos-Torres, M.; Romero-Perdomo, F.; Mendoza-Labrador, J.; Gutiérrez, A.Y.; Vargas, C.; Castro-Rincon, E.; Caro-Quintero, A.; Uribe-Velez, D.; Estrada-Bonilla, G.A. Genomic and Phenotypic Analysis of Rock Phosphate-Solubilizing Rhizobacteria. Rhizosphere 2021, 17, 100290. [Google Scholar]
  38. Ye, D.; Li, T.; Zhang, X.; Zheng, Z.; Dai, W. Rhizosphere P Composition, Phosphatase and Phytase Activities of Polygonum Hydropiper Grown in Excess P Soils. Biol. Fertil. Soils 2017, 53, 823–836. [Google Scholar] [CrossRef]
  39. Cheng, Y.; Narayanan, M.; Shi, X.; Chen, X.; Li, Z.; Ma, Y. Phosphate-Solubilizing Bacteria: Their Agroecological Function and Optimistic Application for Enhancing Agro-Productivity. Sci. Total Environ. 2023, 901, 166468. [Google Scholar] [CrossRef]
Figure 1. (a) Location of the experimental site at the Obonuco Research Center, Pasto, Nariño (Colombia); (b) field experimental design, using a full factorial block scheme (2 × 5) n = 4; (c) climate of the experimental site, with maximum and minimum temperatures and rainfall distribution during the field experiment period (June 2022–March 2023).
Agronomy 14 00210 g001
Figure 2. Regression analysis between NP mineral fertilization doses and NP uptake: (a) N uptake (kg ha−1); (b) P uptake (kg ha−1) as affected by NP dosages (%) of two consecutive cabbage harvests. Regression analysis was used to determine the relationship between fertilization doses and N and P uptake. Black and white dots indicate uptake results for the first and second cycle, respectively. Dashed and continuous lines depict the regression lines that best fit the data for the first and second cycles, respectively. Error bars indicate the standard deviation of the means.
Agronomy 14 00210 g002
Figure 3. Effect of fertilization doses on cabbage yield. Yield (t ha−1) of cabbage as affected by NP dosages (%) of two consecutive harvests (cycle 1 and cycle 2): (a) Black and white dots indicate yield results for the first and second cycle, respectively. Dashed and continuous lines indicate the regression that fits best for the first and second cycle, respectively. Error bars (T) represent the standard error of the means; (b) biofertilization comparison: columns followed by the same uppercase letter do not differ statistically by Tukey’s multiple range test (p < 0.05) in the first crop cycle. n.s. non significance.
Agronomy 14 00210 g003
Figure 4. Effect of fertilization NP doses on cabbage quality. Size of cabbage head based on weight (%) as affected by NP dosages (%): (a) Non-biofertilization treatments; (b) biofertilization in the first crop cycle. Classification of the cabbage heads by weight, in large (>2000 g), medium (801–2000 g), and small (500–800 g). Black bars indicate large size cabbage head results for the biofertilization and non-biofertilization treatments, respectively. Gray bars indicate medium size cabbage head results for the biofertilization and non-biofertilization treatments, respectively. White bars indicate small size cabbage head results for the biofertilization and non-biofertilization treatments, respectively.
Agronomy 14 00210 g004
Figure 5. Relative effect of bacterial fertilization on agronomic efficiency. NB denotes the non-biofertilization treatment with 100% of fertilization and B indicates the treatment with biofertilization (simultaneous inoculation with Herbaspirillum sp. AP21, Azospirillum brasilense D7, and Rhizobium leguminosarum T88). Black and white bars indicate first and second crop cycle, respectively. Percentages underneath bars indicate fertilization doses with respect to the recommended doses based on soil chemical analyses. Columns followed by * differ statistically by Dunnet’s multiple range test (p < 0.05) in cycle 1, and columns followed by + differ statistically by Dunnet’s multiple range test t in cycle 2. Each bar corresponds to the arithmetic mean of the inoculated treatments divided by the mean of the respective uninoculated treatments at each fertilization dosage.
Agronomy 14 00210 g005
Figure 6. Agronomic efficiency of N and P. Agronomic efficiency of N and P of cabbage (kg kg−1) as affected by NP dosages (%) of the first crop cycle: (a) Regression analysis was used to determine the relationship between fertilization doses and agronomic efficiency. Black and white dots indicate agronomic efficiency results for nitrogen and phosphorus, respectively. Similarly, dashed and continuous lines indicate the regression that fits best for N and P, respectively. Error bars (T) represent the standard error of the means; (b) biofertilization comparison: columns followed by the same uppercase letter do not differ statistically by Tukey’s multiple range test (p < 0.05) for N agronomic efficiency. Columns followed by the same lowercase letter do not differ statistically by Tukey’s multiple range test (p < 0.05) for P agronomic efficiency.
Agronomy 14 00210 g006
Table 1. Mineral fertilizer treatments evaluated in the field experiment with cabbage.
DosesNPK
%kg ha−1
00.00.050.0
2532.528.550.0
5065.057.050.0
7597.585.550.0
100 1130.0114.050.0
1 The treatment 100% represents the standard commercial fertilization farm management.
Table 2. Two-way analysis of variance (ANOVA) was conducted to assess the impact on cabbage yield, as well as nitrogen (N) and phosphorus (P) uptake. The factors examined included NP mineral fertilization dosages (0%, 25%, 50%, 75%, and 100%) and biofertilization (inoculation with consortia or control). The experiment spanned two consecutive crop cycles (2022–2023) under field conditions in Pasto, Nariño (Colombia).
p-Value
FactorYield
(t ha−1)
N Uptake
(kg ha−1)
P Uptake
(kg ha−1)
Crop cycle 1
Biofertilization0.0232 *0.5370 n.s.0.5490 n.s.
NP mineral dosages (%)0.0066 *0.0060 *0.0320 *
Interaction (Biofertilization × Dosage)0.3670 n.s.0.7206 n.s.0.9109 n.s.
Crop cycle 2
Biofertilization0.4604 n.s.0.9900 n.s.0.7490 n.s.
NP mineral dosages (%)0.0042 *0.0004 *0.0098 *
Interaction (Biofertilization × Dosage)0.7550 n.s.0.4750 n.s.0.4450 n.s.
The symbols * and n.s. denote significant and non-significant differences, respectively, based on the results of Student’s t-test.
Disclaimer/Publisher’s Note: The statements, opinions and data contained in all publications are solely those of the individual author(s) and contributor(s) and not of MDPI and/or the editor(s). MDPI and/or the editor(s) disclaim responsibility for any injury to people or property resulting from any ideas, methods, instructions or products referred to in the content.

