Abstract
FHY3 and FAR1 serve as positive regulators of the phyA-mediated far-red light signal pathway, influencing plant growth and development by regulating the expression of downstream genes. However, little is known about the FAR1/FHY3 family in Brassica species. A total of 21 members of the BnFAR1/FHY3 gene family were identified in the Brassica napus genome, exhibiting an uneven distribution across ten B. napus chromosomes. A phylogenetic analysis showed that the BnFAR1/FHY3 family could be divided into four subfamilies. Putative cis-elements in the BnFAR1/FHY3 promoter regions were also identified, which were potentially involved in phytohormone, light and abiotic stress responses (shading, low-temperature, etc.). Additionally, qRT-PCR results indicated that the expression levels of BnFAR1-10, BnFAR1-11, BnFAR1-21 and BnFAR1-4 decreased under shading stress. The expression of BnFAR1-10, BnFAR1-11 and BnFAR1-21 increased under low-temperature stress, whereas the expression of BnFAR1-4 did not change. In addition, the results of the tissue expression analysis showed that most of the genes exhibited the lowest expression in pollen and the highest expression in the 54-day silique. This study screened a batch of BnFHY3/BnFAR1 gene resources, which will contribute to further research on the functional characteristics of BnFHY3/BnFAR1 family members in growth, development and the stress response.
1. Introduction
Plants, due to their sessile nature, are always exposed to a variety of abiotic and biotic stressors [1]. These environmental factors, such as light, low-temperature, drought, diseases and insect pests, inevitably have a strong influence on plant physiology and development [2,3,4]. To effectively adapt to environmental changes, plants have developed sophisticated sensory systems for detecting external cues and translating them into internal signaling pathways [4,5]. As one of the most crucial environmental factors, light not only serves as the ultimate energy source for all organisms by photosynthesis, but also serves as a complex signaling pathway involved in a variety of physiological and biochemical processes, such as plant growth and development, chloroplast development, photomorphogenesis and flowering [5,6,7]. Therefore, a series of photoreceptors, including phytochromes, cryptochromes, phototropins and ultraviolet-B receptors, are employed to recognize light information [4,5]. Among them, phytochromes mainly detect red and far-red wavelengths, whereas cryptochromes and phototropins sense the blue/ultraviolet-A region of the spectrum [5]. At present, phytochromes are the most widely studied, and there are five phytochromes (AtPHYA, AtPHYB, AtPHYC, AtPHYD and AtPHYE) identified in Arabidopsis thaliana [8]. The proteins AtPHYB, AtPHYC, AtPHYD and AtPHYE have similar functions in regulating light responses under continuous red and white light, whereas AtPHYA is the primary photoreceptor responsible for perceiving and mediating various far-red light-mediated responses, such as the inhibition of hypocotyl elongation, control of flowering, accumulation of anthocyanin and expansion of cotyledons [7,9].
Studies have confirmed that far-red elongated hypocotyl 3 (FHY3) and far-red impaired response 1 (FAR1) are two homologous proteins responsible for the photo-induced phytochrome A (phyA)-controlled far-red responses and subsequent photoreactions in plants, which have evolved from mutator-like transposons [10,11]. Both FAR1 and FHY3 proteins consist of three domains, including the N-terminal C2H2 zinc finger domain with DNA-binding activity, the middle putative core transposase domain and the C-terminal SWIM zinc finger domain with transcriptional activation [12]. Additionally, FAR1 and FHY3 are involved in regulating many other plant growth and development processes, including hormone responses [13], leaf senescence [14], flowering time [15,16], plant immunity [17], oxidative stress responses [18] and starch synthesis [19]. So far, the FHY3/FAR1 transcription factor family has been identified and reported in many plant species, including A. thaliana [9], Arachis hypogaea [5], Camellia sinensis [7] and Eucalyptus grandis [20]. However, research into the FHY3/FAR1 family in Brassica species is currently lacking.
The plants of the genus Brassica, belonging to the cruciferous family, are important oil crops and vegetable crops [21,22]. The genus Brassica contains six species, including Brassica rapa, Brassica oleracea, Brassica nigra, Brassica carinata, Brassica napus and Brassica juncea, in U’s triangle model [22]. The most economically important species of the genus Brassica is B. napus. B. napus is not only valuable as a vegetable and an edible oil [23], but can also be used for ornamental purposes, as a source of nectar, in the remediation of heavy metal pollution and as an industrial raw material crop [24,25]. Moreover, B. napus cake contains higher protein, making it suitable for use as high-quality feed, with a positive impact on promoting and developing the breeding industry [24,25,26,27]. Zhao et al. (2019) found that B. napus rotation can increase the nutrient content of the soil and improve the biological characteristics of the soil, thereby increasing the yield of subsequent crops and contributing to the green and sustainable development of agriculture [28].
However, B. napus, faces challenges due to decreasing planting areas and declining interest from growers, resulting in insufficient production. In addition, B. napus is affected by various environmental factors that can restrict normal growth and hinder industry development [29]. Consequently, increasing B. napus yield has become the primary objective of breeding efforts. Yield traits, such as plant appearance, silique number and branch number, are closely associated with B. napus yield [30]. Modifying the expression of phytochrome-related genes has been shown to alter plant appearance [31], branching [32] and planting density [33], thereby increasing crop yield [34]. Furthermore, abiotic stresses, such as light, drought, temperature and salinity, significantly limit crop yield. In particular, light plays a key role in regulating embryonic development, making it one of the abiotic stresses affecting the yield and quality of B. napus. However, little is known about the effects of light on the growth and development of B. napus. The B. napus FAR1/FHY3 gene family members have not yet been identified and characterized, and the functions of FAR1/FHY3 in B. napus are still poorly understood.
In the present study, we identified 21 BnFAR1/FHY3 genes in B. napus and analyzed their phylogenetic relationships, gene structure composition, chromosomal distribution, conserved motifs, gene duplications and predicted cis-acting regulatory elements (CAREs). In addition, we analyzed the expression patterns of BnFAR1/FHY3 under shading and low-temperature responses using quantitative real-time PCR (qRT-PCR). This study screened a batch of BnFHY3/BnFAR1 gene resources, which will contribute to further research on the functional characteristics of BnFHY3/BnFAR1 family members in growth, development and the stress responses.
2. Materials and Methods
2.1. Plant Materials and Stress Treatment
B. napus L. cultivar “Zhongshuang 11 (ZS11)” was supplied and nursed by the Hu-nan Key Laboratory of Economic Crops Genetic Improvement and Integrated Utilization, Hunan University of Science and Technology, China. The B. napus cultivar “ZS11” was grown in Hoagland solution in the greenhouse under a photoperiod of 16 h light/8 h dark and a humidity of 70% at 25 °C for 16 days. Then, the seedlings were used for low-temperature and shading experiments.
For the low-temperature treatment, the seedlings were divided into two groups: one at 25 °C and the other at 4°C for 10 days (five-leaf stage) under the same photoperiod and humidity. For the shading treatment, seedlings at the five-leaf stage were divided into two groups: one with leaves wrapped in tinfoil and the other without for 24 h under the same photoperiod, humidity and temperature. Three leaves were collected randomly from three individual seedlings of the same treatment group and were combined as one biological replicate. Three biological replicates were assessed for each treatment. All of the samples were frozen in liquid nitrogen immediately after sampling and stored at −80 °C until total RNA extraction [35].
2.2. Data Sources
The FAR1 protein sequences of A. thaliana and Z. mays were obtained from the PlantTFDB database [36] (http://planttfdb.gao-lab.org/, accessed on 5 September 2023). The B. napus genome sequences, protein sequences and GFF3 file were sourced from the BnPIR database [37] (http://cbi.hzau.edu.cn/bnapus/index.php, accessed on 5 September 2023). The hmm file used in the analysis was derived from the InterPro database [38] (http://www.ebi.ac.uk/interpro/, accessed on 5 September 2023). The expression analysis data were obtained from the B. napus transcriptome database [39] (http://yanglab.hzau.edu.cn/BnTIR, accessed on 5 September 2023).
2.3. The BnFAR1/FHY3 Family in B. napus Were Identified Based on Protein Sequences
To identify members of the BnFAR1/FHY3 family, a blastp analysis was conducted using TBtools software (v.1.0971) with default parameters, and the duplicate results were removed [40]. Furthermore, the protein sequences of B. napus, the hmm file and Pfam IDs (PF03101, PF04434 and PF10551) were used for the HMM analysis in the “simple HMM search” of TBtools software. Results with an E-value < 1 × 10⁻⁵ were excluded. The blastp results were integrated with the hmm search results. Finally, the results were further validated through conservative domain analysis in the CDD of the NCBI database (https://www.ncbi.nlm.nih.gov/cdd, accessed on 6 September 2023) and the Interpro database (http://www.ebi.ac.uk/interpro/, accessed on 6 September 2023), retaining only those sequences containing the FAR1, MULE and SWIM structural domains [35,41].
2.4. Physicochemical Properties and Subcellular Localization Were Analyzed Based on Protein Sequences
The physicochemical properties of the BnFAR1/FHY3 proteins were analyzed using the BnFAR1/FHY3 protein sequences in Expasy (https://www.expasy.org/, accessed on 14 September 2023) [42]. The subcellular localization of the BnFAR1/FHY3 proteins was predicted using WoLF PSORT (https://www.genscript.com/wolf-psort.html/, accessed on 14 September 2023) [43].
2.5. Phylogenetic Tree Was Constructed Based on Protein Sequences
The FAR1/FHY3 protein sequences of B. napus, A. thaliana and Zea mays were aligned using the Clustal W program in MEGA software (v.5.3.3) [44]. The phylogenetic tree was constructed using the neighbor-joining (NJ) method, with a Bootstrap value set to 1000. Finally, the phylogenetic tree was beautified using the EvolView website (https://www.evolgenius.info/, accessed on 20 October 2023) [45].
2.6. Conserved Motifs Were Analyzed Based on Protein Sequences
A motif analysis was performed in TBtools using BnFAR1/FHY3 protein sequences. The number of motifs was set to 10 [35,40].
2.7. Gene Structures, Cis-Acting Elements, Gene Location and Collinearity Were Analyzed Based on Gene Sequences
Gene structure analysis of BnFAR1/FHY3 genes were performed using the Gene IDs and GFF3 file of B. napus in TBtools. Furthermore, a 2000 bp sequence upstream of the BnFAR1/FHY3 genes was extracted in TBtools for the promoter analysis using the PlantCARE website (http://bioinformatics.psb.ugent.be/webtools/plantcare/html/, accessed on 25 October 2023) [46]. The obtained results were screened to identify the desired cis-acting elements. Finally, the results were visualized using TBtools [40]. A collinearity analysis of the BnFAR1/FHY3 genes in B. napus was conducted using TBtools, and the resulting image was refined [40].
2.8. Expression Analysis and qRT-PCR Analysis
For the tissue-specific expression analysis of the BnFAR1/FHY3 genes in B. napus, the downloaded transcriptome data of B. napus tissues were uploaded to TBtools software. This was followed by column scaling (zero to one) and image beautification [40].
In addition, RNA-seq data from the line “B. napus with purple leaves and white flowers” subjected to shading treatments, as obtained from our previous study (unpublished data, the expression data from RNA-seq of the BnFAR1/FHY3 family are shown in Table S1), were used to analyze the expression levels of BnFHY3/FAR1s.
Then, qRT-PCR was employed to analyze the expression levels of eight selected genes under shading and low-temperature stresses.
RNA extraction was conducted using AG RNAex Pro Reagent (Accurate Biotechnology, Changsha, China), and the extracted RNA was reverse-transcribed into cDNA using the Evo M-MLV RT Mix Kit with gDNA Clean (Accurate Biotechnology, Changsha, China). To investigate gene expression, gene sequences were acquired from the BnPIR database (http://cbi.hzau.edu.cn/bnapus/index.php, accessed on 15 November 2023) [37] of B. napus. Specific fluorescent quantitative primers were designed using the PrimerQuest online tool [47] (https://sg.idtdna.com/PrimerQuest/Home/Index, accessed on 15 November 2023) and were synthesized by Sangon Biotech. For the analysis, the BIOER FQD-96C Real-Time System (Bioer Technology, Hangzhou, China) was utilized with a reaction system of 20 μL. Actin was utilized as the internal reference gene, and the specific gene primers are listed in Table S2. The PCR amplification conditions included 40 cycles of the following steps: pre-denaturation at 95 °C for 20 s, denaturation at 95 °C for 15 s and annealing at 55 °C for 20 s. An additional melting step was included. The method was employed to calculate the relative expression levels of the BnFAR1/FHY3 family members, and t-tests were conducted to ascertain the significance of any observed differences [20,35]. To ensure the credibility of the results, three biological replicates and three technical replicates were performed.
3. Results
3.1. Identification and Analysis of the BnFAR1/FHY3 Genes
A total of 21 BnFAR1/FHY3 genes were identified from the whole genome of B. napus and were named BnFAR1-1 to BnFAR1-21. To understand their individual characteristics, we analyzed the physicochemical properties of these genes, including amino acid numbers, molecular weight (MW), isoelectric point (PI), instability index, grand average of hydropathy (GRAVY) and subcellular location. The results shown in Table 1 and Table S1 indicate that the amino acid numbers ranged from 660 (BnFAR1-21) to 841 (BnFAR1-7) and the MW ranged from 76,303.34 Da (BnFAR1-21) to 96,538.52 Da (BnFAR1-11). The pI ranged from 5.35 (BnFAR1-9) to 8.47 (BnFAR1-20), with 11 proteins being acidic and the others being alkaline. Based on the instability index predictions, BnFAR1-21 and BnFAR1-6 were considered stable proteins, as their instability index values were less than 40. The GRAVY values (−0.307 to −0.671) were all negative, indicating that all 21 proteins were hydrophilic. In addition, the subcellular location information showed that all BnFAR1/FHY3 proteins were located in the nucleus (Table 1 and Table S3).

Table 1.
Physicochemical properties and subcellular localization of BnFAR1/FHY3 proteins.
3.2. Phylogenetic Analysis of BnFAR1/FHY3 Genes
To explore the evolutionary relationships between B. napus, A. thaliana and Z. mays FAR1/FHY3 proteins, a phylogenetic tree was constructed using 53 protein sequences (21 from B. napus, 17 from A. thaliana and 15 from Z. mays). Based on sequence similarity, the members were classified into five groups, named Group I, Group II, Group III, Group IV and Group V (Figure 1). Fifteen BnFAR1/FHY3 proteins (BnFAR1-7, BnFAR1-11, BnFAR1-12, BnFAR1-17, BnFAR1-3, BnFAR1-13, BnFAR1-2, BnFAR1-9, BnFAR1-1, BnFAR1-10, BnFAR1-18, BnFAR1-6, BnFAR1-21, BnFAR1-14 and BnFAR1-15), seven AtFAR1/FHY3 proteins (AT3G22170, AT4G15090, AT4G19990, AT1G76320, AT2G32250, AT1G52520 and AT1G80010) and four ZmFAR1/FHY3 proteins (GRMZM2G104268, GRMZM2G106653, GRMZM2G117108 and GRMZM2G155980) were categorized into Group I. Two BnFAR1/FHY3 proteins (BnFAR1-4 and BnFAR1-19), six AtFAR1/FHY3 proteins (AT1G10240, AT5G28530, AT4G12850, AT3G59470, AT2G43280 and AT3G07500) and nine ZmFAR1/FHY3 proteins (GRMZM2G114461, GRMZM2G129311, GRMZM2G406651, GRMZM2G406651, GRMZM2G043250, GRMZM2G034868, GRMZM2G048987, GRMZM2G083374 and GRMZM2G001663) were classed into Group II. However, Group IV (BnFAR1-5, BnFAR1-20, AT3G06250 and AT5G18960) and Group V (BnFAR1-8, BnFAR1-16, AT4G38180 and AT2G27110) consisted only of A. thaliana and B. napus proteins. Additionally, Group III specifically included two ZmFAR1/FHY3 proteins (GRMZM2G148940 and GRMZM2G302323).
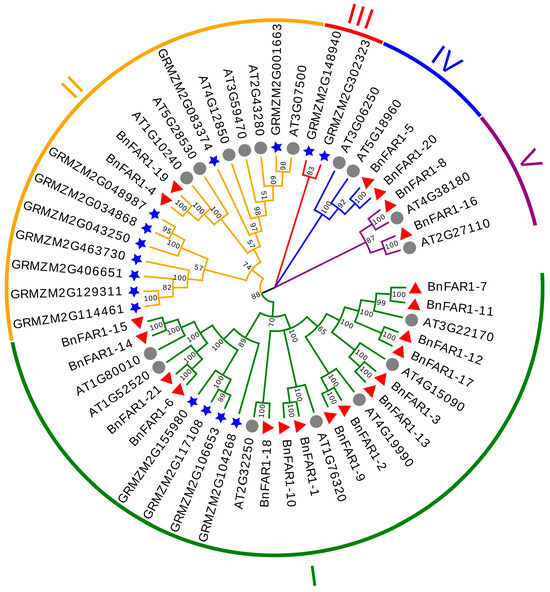
Figure 1.
Phylogenetic tree of the FAR1/FHY3 family in B. napus, A. thaliana and Z. mays. The star represents Z. mays, the circle represents A. thaliana and the triangle represents B. napus. The 53 FAR1/FHY3 protein sequences were divided into five groups (I to V), with the same branch color representing one group.
At the same time, a phylogenetic tree was constructed specifically for the 21 BnFAR1/FHY3 proteins, which could be divided into four groups, named Group I, Group II, Group III and Group IV (Figure 2A). Group I contained two proteins (BnFAR1-19 and BnFAR1-4), whereas both Group II (BnFAR1-16, BnFAR1-8, BnFAR1-20 and BnFAR1-5) and Group III (BnFAR1-15, BnFAR1-14, BnFAR1-21 and BnFAR1-6) consisted of four proteins, and Group IV consisted of eleven proteins (BnFAR1-9, BnFAR1-2, BnFAR1-18, BnFAR1-10, BnFAR1-1, BnFAR1-13, BnFAR1-3, BnFAR1-17, BnFAR1-12, BnFAR1-11 and BnFAR1-7).
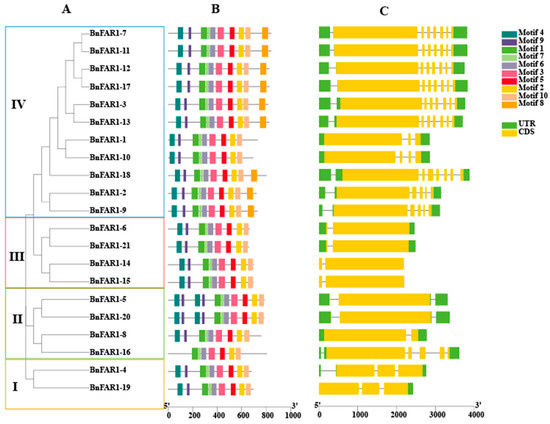
Figure 2.
Conserved motifs and gene structure analysis of the BnFAR1/FHY3 family. (A) Phylogenetic tree of the BnFAR1/FHY3 family in B. napus. Groups I to IV represent the BnFAR1/FHY3 family divided into four groups. (B) Distribution of the 10 conserved motifs of the BnFAR1/FHY3 family in B. napus (different motifs indicated by different colored boxes); (C) Gene structure distribution of the BnFAR1/FHY3 family in B. napus (CDSs and UTRs are shown in yellow and green solid boxes, respectively).
3.3. Analysis of Conserved Motifs and Gene Structures
To analyze the differences in protein sequences, we analyzed 10 conserved motifs among the 21 BnFAR1/FHY3 genes. It was revealed that all the genes contained Motif 1, Motif 2, Motif 3, Motif 5, Motif 6, Motif 7, Motif 9 and Motif 10. Notably, BnFAR1-5 and BnFAR1-20 in group II contained two Motif 4 and two Motif 9. All the genes contained Motif 4, except for BnFAR1-16 in Group II. Moreover, Motif 8 was present in Group IV, except for in BnFAR1-1 and BnFAR1-10 (Figure 2).
The gene structure analysis revealed variations among the 21 BnFAR1/FHY3 genes. Six BnFAR1/FHY3 genes included two 5′-UTRs and one 3′-UTR (BnFAR1-3, BnFAR1-13, BnFAR1-18, BnFAR1-2, BnFAR1-9 and BnFAR1-16). Two BnFAR1/FHY3 genes contained two 3′-UTRs and one 5′-UTR (BnFAR1-5 and BnFAR1-20). Two BnFAR1/FHY3 genes in the group lacked a UTR region (BnFAR1-14 and BnFAR1-15). One BnFAR1/FHY3 gene only contained 3′-UTR (BnFAR1-19), whereas the remaining ten genes contained one 5′-UTR and one 3′-UTR. Additionally, the number and arrangement of exons differed among the four groups, suggesting potential functional distinctions among the FAR1/FHY3 family members in B. napus (Figure 2).
3.4. Analysis of Cis-Acting Elements
The cis-acting element analysis of the 21 BnFAR1/FHY3 genes uncovered various regulatory elements related to light responses, stress responses, hormone responses and plant growth and development (Figure 3 and Table S4). Ten cis-acting elements, including MSA-like, circadian, RY-element, O2-site, CAT-box, Motif I, GCN4_motif, HD-Zip 1 and MBSI, were identified in plant growth and development. Eight cis-acting elements, including TGA-element, TATC-box, TCA-element, ABRE, CGTCA-motif, TGACG-motif, GARE-motif and P-box, were identified in hormone responses. Six cis-acting elements, including ARE, GC-motif, LTR, MBS, TC-rich repeats and WUN-motif, were identified in stress responses. Furthermore, a total of twenty-three cis-acting elements were identified in light responses, with the G-box present in almost all of the BnFAR1/FHY3 family members. Notably, elements related to plant growth and development were identified in all 17 BnFAR1/FHY3 genes, except for BnFAR1-5, BnFAR1-16, BnFAR1-15 and BnFAR1-21.
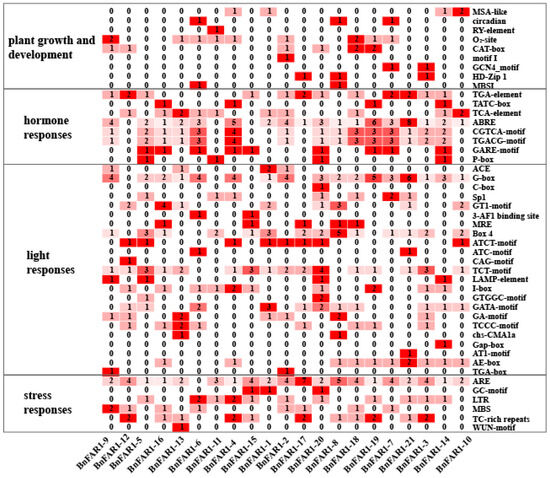
Figure 3.
Cis-acting element analysis of the BnFAR1/FHY3 genes. The leftmost column represents the function of the cis-elements, and the rightmost column represents the types of cis-elements. The numbers in the box represent the numbers of cis-elements. A darker red color means a higher number of cis-acting elements.
3.5. Analysis of Gene Location and Collinearity
The distribution of BnFAR1/FHY3 genes in B. napus was not uniform, with genes located on 10 different chromosomes (Figure 4). Specifically, there were two genes each on chromosomes C01 (BnFAR1-17 and BnFAR1-2), A01 (BnFAR1-9 and BnFAR1-12), C03 (BnFAR1-20 and BnFAR1-8), C05 (BnFAR1-19 and BnFAR1-7), A03 (BnFAR1-5 and BnFAR1-16) and A07 (BnFAR1-15 and BnFAR1-1), and one gene each on chromosomes C04 (BnFAR1-18) and A06 (BnFAR1-4). Chromosome A05 (BnFAR1-13, BnFAR1-6 and BnFAR1-11) contained three genes, whereas chromosome C06 (BnFAR1-21, BnFAR1-3, BnFAR1-14 and BnFAR1-10) had the highest number, with four genes.
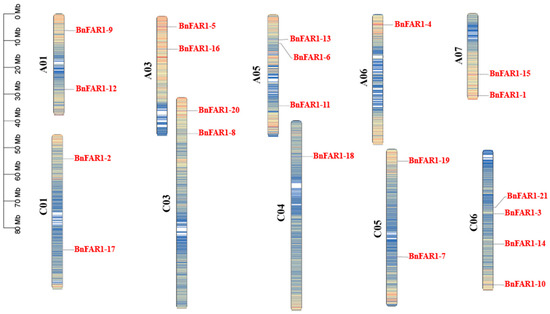
Figure 4.
Distribution of 21 BnFAR1/FHY3 genes on B. napus chromosomes. The scale bar on the left indicates the chromosome lengths (Mb). Color represents gene density. Darker colors represent higher gene density.
The evolutionary analysis of BnFAR1/FHY3 genes in B. napus revealed that there were no tandem duplication events among the family members. However, 14 pairs of segmental duplication events (involving 18 genes, excluding BnFAR1-8, BnFAR1-16 and BnFAR1-18) were identified (BnFAR1-12/BnFAR1-11, BnFAR1-9/BnFAR1-2, BnFAR1-12/BnFAR1-17, BnFAR1-12/BnFAR1-7, BnFAR1-5/BnFAR1-20, BnFAR1-13/BnFAR1-11, BnFAR1-11/BnFAR1-17, BnFAR1-11/BnFAR1-7, BnFAR1-13/BnFAR1-3, BnFAR1-6/BnFAR1-21, BnFAR1-4/BnFAR1-19, BnFAR1-15/BnFAR1-14, BnFAR1-1/BnFAR1-10 and BnFAR1-17/BnFAR1-7), indicating that segmental duplication played a significant role in the expansion of the BnFAR1/FHY3 family during evolution (Figure 5 and Table S5).
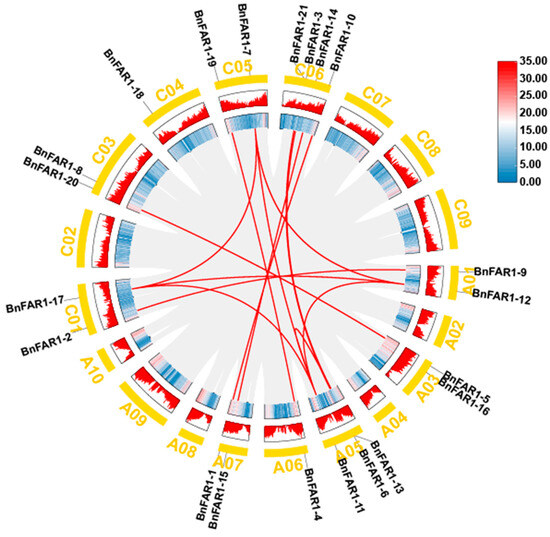
Figure 5.
Homologous relationships of the 14 BnFAR1/FHY3 genes in B. napus. The gray line indicates the collinear relationships of all genes, and the red line indicates the fragment duplication gene pairs of BnFAR1/FHY3s. “A01–A10” and “C01–C09” represent chromosomes in A subgenome and C subgenome.
3.6. Expression Analysis and qRT-PCR Analysis
To understand the tissue-specific expression pattern of BnFAR1/FHY3s, we analyzed the transcriptomes of twelve tissues, including pollen, stem peel (lower), leaf (22), silique (54 DAF), bud (2 mm), root, seed (54 DAF), cotyledon, petal, filament and sepal (Figure 6). The results show that the genes with the highest expression in each tissue were located in Group IV, among which BnFAR1-7 had the highest expression in filament and bud, BnFAR1-11 had the highest expression in petal, filament and sepal, BnFAR1-17 had the highest expression in leaf, pollen, cotyledon, silique, root and seed, BnFAR1-3 had the highest expression in petal, BnFAR1-1 had the highest expression in stem peel and seed and BnFAR1-10 had the highest expression in stem peel. Three genes (BnFAR1-18, BnFAR1-2 and BnFAR1-9) in Group IV, three genes (BnFAR1-6, BnFAR1-21 and BnFAR1-15) in Group III and two genes (BnFAR1-8 and BnFAR1-16) showed low expression levels in all the tissues. Notably, all the genes in Group I had similar expression patterns.
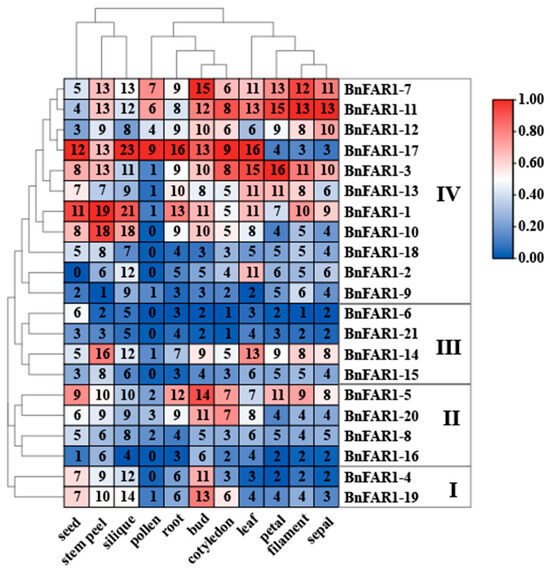
Figure 6.
Tissue-specific expression profile of BnFAR1/FHY3 genes in B. napus. Red indicates high levels of expression, and blue indicates low levels of expression. The numbers in the box represent the tissue expression profiles of the BnFAR1/FHY3 genes. Groups I to IV represent the phylogenetic tree of the BnFAR1/FHY3 family in B. napus.
To analyze the expression levels of BnFHY3/FAR1s under shading treatments, transcriptomes of the line “B. napus with purple leaves and white flowers” were generated (shown in Figure 7). As shown in the heatmap in Figure 7, the genes may respond to light or shading, except for the genes BnFAR1-2, BnFAR1-13, BnFAR1-19, BnFAR1-15 and BnFAR1-6. In particular, the gene BnFAR1-3 may significantly respond to light, whereas BnFAR1-16 may significantly respond to shading stress (Figure 7).
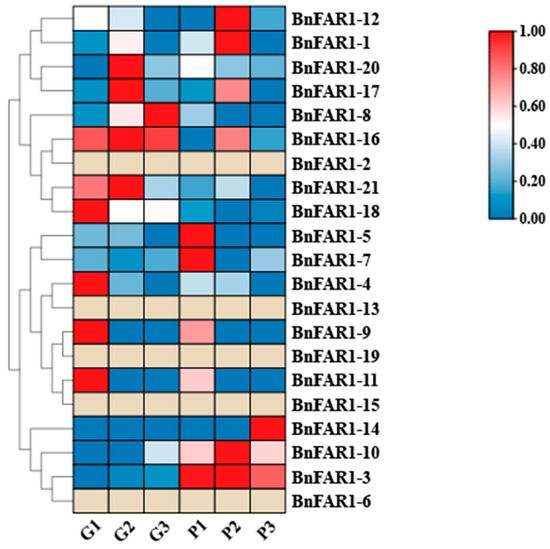
Figure 7.
Heatmaps of the expression patterns of differentially expressed genes (DEGs) in the BnFAR1/FHY3 family after shading treatment in the line “B. napus with purple leaves and white flowers”. Red indicates high levels of expression, blue indicates low levels of expression and khaki grey indicates no differential expression of the gene. “G” represents the shading treatment, and “P” represents the unshaded treatment.
Eight BnFAR1/FHY3 genes, forming four groups (Group I: BnFAR1-4; Group II: BnFAR1-5 and BnFAR1-20; Group III: BnFAR1-21; Group IV: BnFAR1-3, BnFAR1-10, BnFAR1-11 and BnFAR1-17) were chosen for expression pattern analysis under shading and low-temperature stresses using qRT-PCR (Figure 8). Unfortunately, four BnFAR1/FHY3 genes (BnFAR1-5 and BnFAR1-20 from Group II and BnFAR1-3 and BnFAR1-17 from Group IV) were omitted due to their Ct values being greater than 35. The results of the low-temperature stress tests showed that the expression levels of BnFAR1-10, BnFAR1-11 and BnFAR1-21 were significantly higher in the treatment group compared to the control group, with BnFAR1-10 exhibiting the highest expression. Additionally, the expression level of BnFAR1-4 in the treatment group closely resembled that of the control group. The shading stress results showed that the expression levels of BnFAR1-4, BnFAR1-10, BnFAR1-11 and BnFAR1-21 were lower than those of the control, especially BnFAR1-4, which indicates that BnFAR1/FHY3s may be involved in the light responses. Furthermore, most of the genes showed the lowest expression in pollen (except for BnFAR1-17, BnFAR1-11 and BnFAR1-7) and the highest expression in silique (54 DAF).
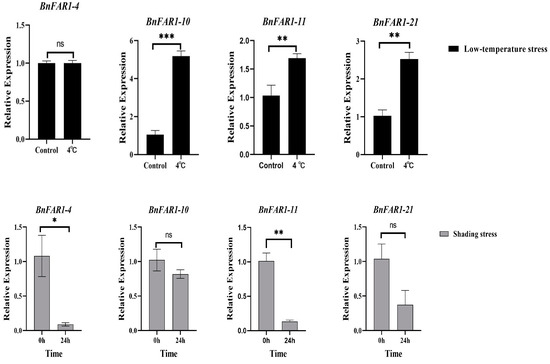
Figure 8.
Expression levels of BnFAR1/FHY3 genes under shading and low-temperature stresses. Black represents low-temperature stress, and gray represents shading stress. *** p < 0.001; ** p < 0.01; * p < 0.05; “ns” indicates no statistical significance.
4. Discussion
Light plays a crucial role in plant growth and development. Photoreceptors in plants can detect red light and far-red light to regulate the expression of downstream genes, ultimately impacting plant development [48]. FAR1/FHY3 proteins, known as positive regulators of PhyA-mediated far-red light signaling, have been identified in various plant species, including A. thaliana [9], C. sinensis [7] and Populus trichocarpa [49]. However, the FAR1/FHY3 family in B. napus has not been extensively studied, and its role in improving yield remains largely unexplored. Therefore, this study aimed to perform genome-wide identification of the FAR1/FHY3 family in B. napus (ZS11) using bioinformatics approaches.
In the current study, 21 BnFAR1/FHY3 genes were identified from the whole genome of B. napus, which was less than that in C. sinensis (25 CsFHY3/FAR1s) [7], P. trichocarpa (51 PtrFAR1/FHY3s) [49] and E. grandis (33 EgFAR1/FHY3s) [20]. It is speculated that these genes may have undergone loss and gain evolutionary events [50]. An analysis of subcellular location revealed that all BnFAR1/FHY3 proteins were located in the nucleus, which was different from the results of C. sinensis [7] and P. trichocarpa [49], but was identical to the results obtained in A. thaliana [9]. It is hypothesized that A. thaliana and B. napus are herbaceous plants, whereas C. sinensis and P. trichocarpa are woody plants, leading to functional divergence during evolution. This implies that no new potential functions of these genes have evolved in B. napus. The conserved motif analysis revealed that all BnFAR1/FHY3 genes contained Motif 4, except for BnFAR1-16 in Group II. Moreover, Motif 8 was present only in Group IV (except for BnFAR1-1 and BnFAR1-10), implying that it may be unique to Group IV. Additionally, the number of exons and motifs of the BnFAR1/FHY3 genes differed among the four groups. There seems to be potential functional distinctions among the FAR1/FHY3 family members in B. napus. These findings are consistent with previous reports regarding A. thaliana [9] and C. sinensis [7].
Cis-acting elements usually determine gene function. The analysis of cis-acting elements in the 21 BnFAR1/FHY3 genes identified ten cis-acting elements (O2-site, etc.) in plant growth and development, twenty-three cis-acting elements (G-box and TCT-motif, etc.) in the light responses, eight cis-acting elements (ABRE, etc.) in hormone responses and six cis-acting elements (ARE, etc.) in stress responses. These findings indicate that the BnFAR1/FHY3 family members play important roles in the light responses, hormone responses, stress responses and growth and development.
The expansion of gene families in plants is often driven by segmental and tandem duplications. However, the collinearity analysis of the BnFAR1/FHY3 family in B. napus showed no evidence of tandem duplication events among the family members. Instead, 14 pairs of segment duplication events (including 18 genes) were identified, indicating that segment duplication was the primary driver of the expansion of the BnFAR1/FHY3 family during evolution. These findings differ from reports in E. grandis [20] and tomato [35], suggesting that the FAR1/FHY3 gene family expanded differently among species. It is speculated that the FAR1/FHY3 gene family in these plants has diverse origins in evolution. The absence of collinearity for the three genes BnFAR1-8, BnFAR1-16 and BnFAR1-18 suggests that these genes may have emerged before divergence of the B. napus species. Furthermore, based on the chromosomal localization analysis, it was observed that the distribution of the BnFAR1/FHY3 family members in B. napus was not uniform, with genes located on ten different chromosomes, indicating that they have their own distinct expression patterns.
Gene expression profiles provide valuable insights into gene function. Previous studies have indicated that the FAR1/FHY3 family may exhibit tissue-specific expression patterns in different plant species. For example, in tomato, genes in Group I were predominantly expressed in fruits, whereas genes in Groups II to IV showed higher expression levels during the flower bud stage [35]. In tea plants, most members of the CsFHY3/FAR1 family exhibited high expression in leaves [7]. In our study, the genes with the highest expression levels in each tissue were located in Group IV, presumably due to the number of Motif 8 and CDS in Group IV. Three genes (BnFAR1-18, BnFAR1-2 and BnFAR1-9) in Group IV, three genes (BnFAR1-6, BnFAR1-21 and BnFAR1-15) in Group III and two genes (BnFAR1-8 and BnFAR1-16) exhibited low expression levels in all the tissues. In addition, most of the genes showed the lowest expression in pollen and the highest expression in silique (54 DAF). Overall, BnFAR1/FHY3s may have different functions in different tissues.
The expression patterns of the BnFAR1/FHY3 family were analyzed to study their transcriptional response to shading and low-temperature stresses. Of the eight selected genes, we found that three genes (BnFAR1-10 (highest), BnFAR1-11 and BnFAR1-21) significantly responded to low-temperature stress, whereas one gene (BnFAR1-4) significantly responded to shading stress. These findings suggest that BnFAR1/FHY3 genes are probably involved in the resistance response to low-temperature and light responses. Overall, our results reveal the potential biological functions of BnFAR1/FHY3 gene family, which may provide information for in-depth functional verification.
5. Conclusions
A total of 21 BnFAR1/FHY3 genes were identified, exhibiting uneven distribution across ten B. napus chromosomes. Segmental duplication may be the main driver of BnFAR1/FHY3 gene amplification. Putative cis-elements in the BnFAR1/FHY3 promoter regions were also identified, which were potentially involved in phytohormone, light and abiotic stress responses. The qRT-PCR results showed that BnFAR1/FHY3s responded to shading and low-temperature stresses. This study screened a batch of BnFHY3/BnFAR1 gene resources, which will contribute to further research on the functional characteristics of BnFHY3/BnFAR1 family members in growth, development and the stress responses.
Supplementary Materials
The following supporting information can be downloaded at: https://www.mdpi.com/article/10.3390/agronomy14010202/s1, Table S1: Phylogenetic analysis of the FAR1/FHY3 genes; Table S2: Promoter cis-element analysis of the BnFAR1/FHY3 genes; Table S3: Fourteen gene pairs with fragment duplication; Table S4: Primer sequences for qRT-PCR; Table S5: Expression data of the BnFAR1/FHY3 family from RNA-seq data for the line “B. napus with purple leaves and white flowers” under shading treatments.
Author Contributions
Conceptualization, Y.H. and D.Z. (Dinggang Zhou); methodology, Y.H., D.Z. (Dinggang Zhou) and M.Y.; software, Y.H., H.C., Y.J., X.W., X.L. and D.Z. (Dawei Zhang); validation, Y.H., D.Z. (Dinggang Zhou), J.W. and L.L.; writing—original draft preparation, Y.H. and D.Z. (Dinggang Zhou); writing—review and editing, J.W., D.Z. (Dawei Zhang), L.L., M.Y. and D.Z. (Dinggang Zhou); project administration, L.L. and D.Z. (Dinggang Zhou). All authors have read and agreed to the published version of the manuscript.
Funding
This research was funded by the “National Natural Science Foundation of China, grant number U19A2029 and 32071965”, the “Funding of Hunan Provincial Department of Education, grant number 22B0492” and the “College Student Innovation and Entrepreneurship Training Project in Hunan Province, grant number S202310534013”.
Data Availability Statement
Data are contained within the article and Supplementary Materials.
Conflicts of Interest
The authors declare no conflicts of interest.
References
- Mohsin, N.; Jianfan, S.; Samina, S.; Ali, K.W.; Guangqian, R.; Xiaojun, N.; Yanwen, B.; Qaiser, J.; Daolin, D.; Christian, S. A review of plants strategies to resist biotic and abiotic environmental stressors. Sci. Total Environ. 2023, 900, 165832. [Google Scholar]
- Liu, Y.; Jiang, Y.; Liu, X.; Cheng, H.; Han, Y.; Zhang, D.; Wu, J.; Liu, L.; Yan, M.; Que, Y.; et al. Identification and expression analysis of Hexokinases family in Saccharum spontaneum L. under drought and cold stresses. Plants 2023, 12, 1215. [Google Scholar] [CrossRef] [PubMed]
- Liu, Y.; Liu, X.; Yang, D.; Yin, Z.; Jiang, Y.; Ling, H.; Huang, N.; Zhang, D.; Wu, J.; Liu, L.; et al. A comprehensive identification and expression analysis of VQ motif-containing proteins in Sugarcane (Saccharum spontaneum L.) under phytohormone treatment and cold stress. Int. J. Mol. Sci. 2022, 23, 6334. [Google Scholar] [CrossRef] [PubMed]
- Paik, I.; Huq, E. Plant photoreceptors: Multi-functional sensory proteins and their signaling networks. In Seminars in Cell & Developmental Biology; Academic Press: Cambridge, MA, USA, 2019; Volume 92, pp. 114–121. [Google Scholar]
- Lu, Q.; Liu, H.; Hong, Y.; Liang, X.; Li, S.; Liu, H.; Li, H.; Wang, R.; Deng, Q.; Jiang, H.; et al. Genome-wide identification and expression of FAR1 gene family provide insight into pod development in Peanut (Arachis hypogaea). Front. Plant Sci. 2022, 13, 893278. [Google Scholar] [CrossRef] [PubMed]
- Huai, J.; Zhang, X.; Li, J.; Ma, T.; Zha, P.; Jing, Y.; Lin, R. SEUSS and PIF4 coordinately regulate light and temperature signaling pathways to control plant growth. Mol. Plant 2018, 11, 928–942. [Google Scholar] [CrossRef] [PubMed]
- Liu, Z.; An, C.; Zhao, Y.; Xiao, Y.; Bao, L.; Gong, C.; Gao, Y. Genome-wide identification and characterization of the CsFHY3/FAR1 gene family and expression analysis under biotic and abiotic stresses in Tea Plants (Camellia sinensis). Plants 2021, 10, 570. [Google Scholar] [CrossRef] [PubMed]
- Chen, S.; Chen, Y.; Liang, M.; Qu, S.; Shen, L.; Zeng, Y.; Hou, N. Genome-wide identification and molecular expression profile analysis of FHY3/FAR1 gene family in walnut (Juglans sigillata L.) development. BMC Genom. 2023, 24, 673. [Google Scholar] [CrossRef] [PubMed]
- Lin, R.; Wang, H. Arabidopsis FHY3/FAR1 gene family and distinct roles of its members in light control of Arabidopsis development. Plant Physiol. 2004, 136, 4010–4022. [Google Scholar] [CrossRef]
- Wang, H.; Deng, X.W. Arabidopsis FHY3 defines a key phytochrome A signaling component directly interacting with its homologous partner FAR1. EMBO J. 2002, 21, 1339–1349. [Google Scholar] [CrossRef]
- Wang, H.; Wang, H. Multifaceted roles of FHY3 and FAR1 in light signaling and beyond. Trends Plant Sci. 2015, 20, 453–461. [Google Scholar] [CrossRef]
- Lin, R.; Teng, Y.; Park, H.J.; Ding, L.; Black, C.; Fang, P.; Wang, H. Discrete and essential roles of the multiple domains of Arabidopsis FHY3 in mediating phytochrome A signal transduction. Plant Physiol. 2008, 148, 981–992. [Google Scholar] [CrossRef] [PubMed]
- Tang, W.; Ji, Q.; Huang, Y.; Jiang, Z.; Bao, M.; Wang, H.; Lin, R. FAR-RED ELONGATED HYPOCOTYL3 and FAR-RED IMPAIRED RESPONSE1 transcription factors integrate light and abscisic acid signaling in Arabidopsis. Plant Physiol. 2013, 163, 857–866. [Google Scholar] [CrossRef] [PubMed]
- Xie, Y.; Ma, M.; Liu, Y.; Wang, B.; Wei, H.; Kong, D.; Wang, H. Arabidopsis FHY3 and FAR1 function in age gating of leaf senescence. Front. Plant Sci. 2021, 12, 770060. [Google Scholar] [CrossRef]
- Xie, Y.; Zhou, Q.; Zhao, Y.; Li, Q.; Liu, Y.; Ma, M.; Wang, B.; Shen, R.; Zheng, Z.; Wang, H. FHY3 and FAR1 integrate light signals with the miR156-SPL module-mediated aging pathway to regulate Arabidopsis flowering. Mol. Plant 2020, 13, 483–498. [Google Scholar] [CrossRef]
- Zhong, M.C.; Jiang, X.D.; Cui, W.H.; Hu, J.Y. Expansion and expression diversity of FAR1/FRS-like genes provides insights into flowering time regulation in roses. Plant Divers. 2021, 43, 173–179. [Google Scholar] [CrossRef]
- Wang, W.; Tang, W.; Ma, T.; Niu, D.; Jin, J.B.; Wang, H.; Lin, R. A pair of light signaling factors FHY3 and FAR1 regulates plant immunity by modulating chlorophyll biosynthesis. J. Integr. Plant Biol. 2016, 58, 91–103. [Google Scholar] [CrossRef] [PubMed]
- Ma, L.; Tian, T.; Lin, R.; Deng, X.W.; Wang, H.; Li, G. Arabidopsis FHY3 and FAR1 regulate light-induced myo-inositol biosynthesis and oxidative stress responses by transcriptional activation of MIPS1. Mol. Plant 2016, 9, 541–557. [Google Scholar] [CrossRef]
- Ma, L.; Xue, N.; Fu, X.; Zhang, H.; Li, G. Arabidopsis thaliana FAR-RED ELONGATED HYPOCOTYLS3 (FHY3) and FAR-RED-IMPAIRED RESPONSE1 (FAR1) modulate starch synthesis in response to light and sugar. New Phytol. 2017, 213, 1682–1696. [Google Scholar] [CrossRef]
- Dai, J.; Sun, J.; Peng, W.; Liao, W.; Zhou, Y.; Zhou, X.R.; Qin, Y.; Cheng, Y.; Cao, S. FAR1/FHY3 transcription factors positively regulate the salt and temperature stress responses in Eucalyptus grandis. Front. Plant Sci. 2022, 13, 883654. [Google Scholar] [CrossRef]
- Kang, L.; Qian, L.; Zheng, M.; Chen, L.; Chen, H.; Yang, L.; You, L.; Yang, B.; Yan, M.; Gu, Y.; et al. Genomic insights into the origin, domestication and diversification of Brassica juncea. Nat. Genet. 2021, 53, 1392–1402. [Google Scholar] [CrossRef]
- Wei, D.; Li, N.; Zhang, N.; Liu, F.; Wu, J.; Zhao, S.; Shen, J.; Wang, Z.; Peng, L.; Fan, Y.; et al. Selective modes affect gene feature and function differentiation of tetraploid Brassica species in their evolution and domestication. Front. Plant Sci. 2023, 14, 1142147. [Google Scholar] [CrossRef]
- Chen, Y.Y.; Lu, H.Q.; Jiang, K.X.; Wang, Y.R.; Wang, Y.P.; Jiang, J.J. The Flavonoid Biosynthesis and Regulation in Brassica napus: A Review. Int. J. Mol. Sci. 2022, 24, 357. [Google Scholar] [CrossRef]
- Fu, D.; Jiang, L.; Mason, A.S.; Xiao, M.; Zhu, L.; Li, L.; Zhou, Q.; Shen, C.; Huang, C. Research progress and strategies for multifunctional rapeseed: A case study of China. J. Integr. Agric. 2016, 15, 1673–1684. [Google Scholar] [CrossRef]
- Yang, Y.; Zhu, K.; Li, H.; Han, S.; Meng, Q.; Khan, S.U.; Fan, C.; Xie, K.; Zhou, Y. Precise editing of CLAVATA genes in Brassica napus L. regulates multilocular silique development. Plant Biotechnol. J. 2018, 16, 1322–1335. [Google Scholar] [CrossRef]
- Zong, H.Z.; Abdul, S.; Zhi, P.C.; Maliha, F.; Wen, Y.Z.; Qing, X.Q.; Yu, H.L.; Xue, Z.J.; Hong, Z.; Yong, L.; et al. Effects of microscopic testa color and morphologyon the water uptake ability and drought tolerance of germination-stage rapeseed (Brassica napus L.). Bioengineered 2021, 12, 9341–9355. [Google Scholar]
- Yin, Y.; Liao, X.; Yu, B.; Wang, H.Z. Regional distribution evolvement and development tendency of Chinese rapeseed production. Chin. J. Oil Crop Sci. 2010, 32, 147–151. [Google Scholar]
- Zhao, W.; Chao, H.; Zhang, L.; Ta, N.; Zhao, Y.; Li, B.; Zhang, K.; Guan, Z.; Hou, D.; Chen, K.; et al. Integration of QTL mapping and gene fishing techniques to dissect the multi-main stem trait in rapeseed (Brassica napus L.). Front. Plant Sci. 2019, 10, 1152. [Google Scholar] [CrossRef] [PubMed]
- Wang, X.; Zhang, Y.; Tian, J.; Zhao, X.; Guan, Z. Research progress of high photosynthetic efficiency breeding of Brassica napus. Chin. Agric. Sci. Bull. 2015, 31, 114–120. [Google Scholar]
- Zhang, J.; Pu, X.; Li, H.; Zhang, Q.; Jiang, L. Correlation analysis between major agronomil characters and yield per plant in rapeseed (Brassica nanpus L.) from different sources. Southwest China J. Agric. Sci. 2007, 20, 587–590. [Google Scholar]
- Garg, A.K.; Sawers, R.J.; Wang, H.; Kim, J.K.; Walker, J.M.; Brutnell, T.P.; Parthasarathy, M.V.; Vierstra, R.D.; Wu, R.J. Light-regulated overexpression of an Arabidopsis phytochrome A gene in rice alters plant architecture and increases grain yield. Planta 2006, 223, 627–636. [Google Scholar] [CrossRef] [PubMed]
- Xie, Y.; Liu, Y.; Ma, M.; Zhou, Q.; Zhao, Y.; Zhao, B.; Wang, B.; Wei, H.; Wang, H. Arabidopsis FHY3 and FAR1 integrate light and strigolactone signaling to regulate branching. Nat. Commun. 2020, 11, 1955. [Google Scholar] [CrossRef]
- Liu, Y.; Wei, H.; Ma, M.; Li, Q.; Kong, D.; Sun, J.; Ma, X.; Wang, B.; Chen, C.; Xie, Y.; et al. Arabidopsis FHY3 and FAR1 regulate the balance between growth and defense responses under shade conditions. Plant Cell 2019, 31, 2089–2106. [Google Scholar] [CrossRef] [PubMed]
- Gururani, M.A.; Ganesan, M.; Song, P.S. Photo-biotechnology as a tool to improve agronomic traits in crops. Biotechnol. Adv. 2015, 33, 53–63. [Google Scholar] [CrossRef] [PubMed]
- Chen, Y.; Deng, J.; Chen, J.; Zeng, T.; Yu, T.; Huang, Q.; Chen, P.; Liu, Q.; Jian, W.; Yang, X. Genome-wide identification and expression analysis of FAR1/FHY3 transcription factor family in tomato. Plant Physiol. J. 2021, 57, 1983–1995. [Google Scholar]
- Lin, R.; Ding, L.; Casola, C.; Ripoll, D.R.; Feschotte, C.; Wang, H. Transposase-derived transcription factors regulate light signaling in Arabidopsis. Science 2007, 318, 1302–1305. [Google Scholar] [CrossRef]
- Song, J.M.; Liu, D.X.; Xie, W.Z.; Yang, Z.; Guo, L.; Liu, K.; Yang, Q.Y.; Chen, L.L. BnPIR: Brassica napus pan-genome information resource for 1689 accessions. Plant Biotechnol. J. 2021, 19, 412–414. [Google Scholar] [CrossRef]
- Paysan-Lafosse, T.; Blum, M.; Chuguransky, S.; Grego, T.; Pinto, B.L.; Salazar, G.A.; Bileschi, M.L.; Bork, P.; Bridge, A.; Colwell, L.; et al. InterPro in 2022. Nucleic Acids Res. 2023, 51, D418–D427. [Google Scholar] [CrossRef]
- Liu, D.; Yu, L.; Wei, L.; Yu, P.; Wang, J.; Zhao, H.; Zhang, Y.; Zhang, S.; Yang, Z.; Chen, G.; et al. BnTIR: An online transcriptome platform for exploring RNA-seq libraries for oil crop Brassica napus. Plant Biotechnol. J. 2021, 19, 1895–1897. [Google Scholar] [CrossRef] [PubMed]
- Chen, C.; Chen, H.; Zhang, Y.; Thomas, H.R.; Frank, M.H.; He, Y.; Xia, R. TBtools: An integrative toolkit developed for interactive analyses of big biological data. Mol. Plant 2020, 13, 1194–1202. [Google Scholar] [CrossRef] [PubMed]
- Na, Y.; Tong, W.; Tingli, L.; Yuwen, Y.; Yue, G.; Jing, L.; Baolong, Z.; Jianchang, D. Genome-wide analysis of the FAR1/FHY3 gene family in cotton. Cotton Sci. 2018, 30, 1–11. [Google Scholar]
- Artimo, P.; Jonnalagedda, M.; Arnold, K.; Baratin, D.; Csardi, G.; de Castro, E.; Duvaud, S.; Flegel, V.; Fortier, A.; Gasteiger, E.; et al. ExPASy: SIB bioinformatics resource portal. Nucleic Acids Res. 2012, 40, W597–W603. [Google Scholar] [CrossRef]
- Horton, P.; Park, K.J.; Obayashi, T.; Fujita, N.; Harada, H.; Adams-Collier, C.J.; Nakai, K. WoLF PSORT: Protein localization predictor. Nucleic Acids Res. 2007, 35, W585–W587. [Google Scholar] [CrossRef] [PubMed]
- Kumar, S.; Stecher, G.; Li, M.; Knyaz, C.; Tamura, K. MEGA X: Molecular evolutionary genetics analysis across computing platforms. Mol. Biol. Evol. 2018, 35, 1547–1549. [Google Scholar] [CrossRef]
- Zhang, H.; Gao, S.; Lercher, M.J.; Hu, S.; Chen, W.H. EvolView, an online tool for visualizing, annotating and managing phylogenetic trees. Nucleic Acids Res. 2012, 40, W569–W572. [Google Scholar] [CrossRef] [PubMed]
- Lescot, M.; Déhais, P.; Thijs, G.; Marchal, K.; Moreau, Y.; Van de Peer, Y.; Rouzé, P.; Rombauts, S. PlantCARE, a database of plant cis-acting regulatory elements and a portal to tools for in silico analysis of promoter sequences. Nucleic Acids Res. 2002, 30, 325–327. [Google Scholar] [CrossRef]
- Thornton, B.; Basu, C. Rapid and simple method of qPCR primer design. Methods Mol. Biol. 2015, 1275, 173–179. [Google Scholar] [PubMed]
- Legris, M.; Ince, Y.; Fankhauser, C. Molecular mechanisms underlying phytochrome-controlled morphogenesis in plants. Nat. Commun. 2019, 10, 5219. [Google Scholar] [CrossRef]
- Du, J.; Zhang, L.; Ge, X.; Xiang, X.; Cao, D.; Yang, H.; Hu, J. Genome-Wide Identification and Characterization of the FAR1/FHY3 Family in Populus trichocarpa Torr. Gray and Expression Analysis in Light Response. Forests 2021, 12, 1385. [Google Scholar] [CrossRef]
- Cao, Y.; Han, Y.; Jin, Q.; Lin, Y.; Cai, Y. Comparative genomic analysis of the grf genes in Chinese pear (Pyrus bretschneideri Rehd), poplar (Populous), grape (Vitis vinifera), Arabidopsis and rice (Oryza sativa). Front. Plant Sci. 2016, 7, 1750. [Google Scholar] [CrossRef] [PubMed]
Disclaimer/Publisher’s Note: The statements, opinions and data contained in all publications are solely those of the individual author(s) and contributor(s) and not of MDPI and/or the editor(s). MDPI and/or the editor(s) disclaim responsibility for any injury to people or property resulting from any ideas, methods, instructions or products referred to in the content. |
© 2024 by the authors. Licensee MDPI, Basel, Switzerland. This article is an open access article distributed under the terms and conditions of the Creative Commons Attribution (CC BY) license (https://creativecommons.org/licenses/by/4.0/).