Article

Strip-Till Farming: Combining Controlled-Release Blended Fertilizer to Enhance Rainfed Maize Yield While Reducing Greenhouse Gas Emissions

Faculty of Agronomy, Inner Mongolia Agricultural University, Hohhot 010019, China
*
Author to whom correspondence should be addressed.
These authors contributed equally to this work.
Agronomy 2024, 14(1), 136; https://doi.org/10.3390/agronomy14010136
Submission received: 13 December 2023 / Revised: 31 December 2023 / Accepted: 2 January 2024 / Published: 4 January 2024
(This article belongs to the Special Issue Integration of Agronomic Practices for Sustainable Crop Production)

Abstract

:
The two major concerns of sustainable agriculture are safeguarding food security and reducing greenhouse gas emissions. Studies on the performance of strip-till with controlled-release blended fertilizer on rainfed maize grain yield, greenhouse gas emissions, and net ecosystem economic budget are scarce in the hilly region of northeast China. In this study, the differences between strip-till (RST) and conventional ridge cropping (CP), straw off-field no-tillage (NT), and no-tillage with straw mulching (RNT) were comparatively investigated in the conventional fertilizer (Sd) mode. And meanwhile, four fertilization modes were also set up under strip-till (RST): conventional fertilization (Sd), controlled-release nitrogen fertilizer blended with normal urea 3:7 (30%Cr), controlled-release nitrogen fertilizer blended with normal urea 5:5 (50%Cr), and no-nitrogen fertilization. We analyzed maize yield, greenhouse gas emissions (GHG), greenhouse gas intensity (GHGI), net income and net ecosystem economic budget (NEEB) for different treatments. The results showed that, under conventional fertilizer (Sd) mode, the maize yield of RST increased by 4.2%, 6.0% and 7.2% compared with NT, CP and RNT and the net income increased by 7.0%, 9.7% and 10.0%, respectively. Compared with CP and NT, although RST increased CO2 and N2O emissions, the GHGI of RST was not significantly different from CP and NT, and was 8.0% lower than that of RNT. The NEEB of RST increased by 6.8%, 9.7% and 11.0%, respectively, compared with NT, CP and RNT. Under strip-till, compared with 30%Cr and Sd, the yield of 50%Cr increased by 4.0% and 9.2% and the net income increased by 3.5% and 6.9%, respectively. There was no significant difference in GHGI between 50%Cr and 30%Cr, and 50%Cr decreased by 10.4% compared with Sd. The NEEB of 50%Cr increased by 3.8% and 7.4% compared to 30%Cr and Sd. Strip-till combines controlled-release nitrogen fertilizer blended with normal urea 5:5 (50%Cr) and can be applied as a sustainable strategy to improve the economic efficiency of maize and reduce environmental costs in the hilly region of northeast China.

1. Introduction

The main greenhouse gas emissions from agricultural sources are N2O, CO2 and CH4. These account for about 14% of the total greenhouse gases produced by human activities and are the main factors causing global warming [1,2]. China’s agricultural greenhouse gas emissions account for about 17% of total global greenhouse gas emissions [3]. Extreme climatic conditions such as high temperatures and droughts events emerged frequently during the past decades over the world due to excessive greenhouse gas emissions, leading to the concern about declined crop yields. The reduction in greenhouse gas emissions from agricultural sources is an indispensable requirement for sustainable agricultural development. As the world’s largest maize producer, China’s maize production is faced with an excessive input of nitrogen fertilizer, a low rate of straw return to the field and frequent plowing [4,5,6]. How to achieve greater maize productivity and nitrogen utilization efficiency with lower GHG emissions from limited farmland has been a hotspot of interest in global agricultural production.
The spring drought is the main factor limiting maize production in the hilly region of northeast China. Straw mulching is an effective measure to improve water content [7]. Straw mulching is beneficial to the absorption of water and nutrients by maize because of the downward growth of maize root [8]. However, no tillage with 100% residue coverage reduces soil temperature, affects the early growth of maize, and leads to lower yield, which is difficult to popularize in production [9]. The research of Trevini et al. [10] and Licht et al. [11] shows that strip-till can solve the above problems, increase soil temperature, improve seedling rate and increase crop yield. Previous research showed that changes in soil temperature and moisture due to straw mulching can have a strong impact on GHG emissions from the soil and into the atmosphere [12]. Several studies investigating GHG emissions under straw-mulched conditions in agricultural fields have reported inconsistent results due to inconsistent investigations of agronomical measures, as well as the corresponding geological, mineralogical, and meteorological characteristics [13,14,15]. The research of Gao et al. [16] shows that maize straw mulching can enhance the activity of nitrifying and denitrifying bacteria in soil, thus increasing the emissions of N2O in soil. Jarecki et al. [17] conducted a study which demonstrated that the application of straw mulch does not have any significant impact on soil N2O emissions. Straw mulching in a field will increase CO2 emission from farmland soil, and straw returned to a field will provide more C for soil microorganisms, which may stimulate the emissions of CH4 and CO2 from soil [18]. In the hilly region of northeast China, whether strip-till can increase maize yield and reduce the environmental cost of maize production needs to be verified.
Fertilizer with N in farmland plays an important role in N2O production via nitrification and denitrification processes. In agricultural soil, N2O is mainly generated through two microbial processes: nitrification, the aerobic oxidation of NH4+ to NO2 and NO3, and denitrification, the anaerobic reduction of NO3 to NO2, NO, N2O and N2 [19,20]. Previous studies in field-manipulative experiments showed that N fertilizer application effects on N2O, CH4 and CO2 fluxes varied widely in different agricultural soils [21]. Controlled-release nitrogen fertilizer has the advantage of lasting and stable fertilizer efficiency, which can reduce NH4+ and NO3 residues in farmland, promote nitrogen absorption by maize, and reduce greenhouse gas emissions [22]. Compared with conventional urea, the gradual release of nitrogen from controlled-release nitrogen fertilizer decreased and delayed the peak of N2O flux [23]. However, the release rate of controlled-release nitrogen is easily affected by environmental factors, and low temperature or drought can easily reduce the release rate, resulting in nitrogen deficiency in the early growth stage and surplus in the later growth stage, thus reducing the yield of maize [24,25]. Controlled-release blended fertilizer is an effective way to reduce the cost of labor and mechanical operations, reduce greenhouse gas emissions from farmland, and enhance maize yield. Zheng et al. [26] found that in summer maize production areas, controlled-release nitrogen fertilizers blended with normal urea can improve maize nitrogen uptake capacity and increase maize yield. Yao et al. [27] showed that a 1:1 ratio of controlled-release urea to normal urea at the same N application rate significantly reduced the emission of N2O and environmental costs of maize production in southwest China. Additionally, Zhang et al. [28] discovered that a blend of controlled-release urea and normal urea with 1:1 ratio obtained the highest economic return, and also significantly decreased the net global warming potential. Studies investigating the optimal ratio of controlled-release urea to normal urea in previous studies were slightly different due to different farming methods and environmental factors in different regions. The net ecosystem economic budget (NEEB) is often used to evaluate agricultural practices for their economic feasibility and environmental sustainability [29]. Thus, we can use NEEB to evaluate rainfed maize production and identify an effective strategy to enhance maize yield and reduce environmental losses in the hilly region of northeast China.
Previous studies on strip-till were mostly concentrated in the subhumid plain areas of China and there was a lack of relevant studies in the hilly region of northeast China [30]. This study conducted a comprehensive analysis from the perspective of maize yield, greenhouse gas emissions and economic and ecological benefits, compared the differences between different tillage methods, and explored the suitable nitrogen fertilizer management measures of trip-till. Therefore, we hypothesized that (1), compared with other tillage methods, strip-till can increase the yield of rainfed maize without increasing greenhouse gas emission intensity and reduce NEEB in the hilly region of northeast China. (2) Strip-till combined with controlled-release blended fertilizer management strategies can enhance maize yield and also reduce greenhouse gas emissions and loss into the environment. The results of this study will provide a theoretical basis with which to improve the economic efficiency of maize and reduce environmental costs in the hilly region of northeast China.

2. Materials and Methods

2.1. Experimental Site and Experimental Materials

The trial was conducted in 2021 and 2022 at the experimental base in Zhalaite Banner, Xing’ an League, Inner Mongolia Autonomous Region, China (46°45′ N, 122°47′ E). The average annual temperature in the region is 3.24 °C, the average annual rainfall is 400 mm, and the frost-free period is 120–140 days. The number of sunshine hours and rainfall for the whole reproductive period were 1138.2 h and 650.5 mm in 2021 and 1352.3 h and 390.1 mm in 2022. The soil type of the trial plot is sandy clay loam. The organic matter content of soil was 17.5 g kg−1, alkaline dissolved nitrogen was 101 mg kg−1, fast-acting phosphorus was 32.5 mg kg−1, fast-acting potassium was 115.9 mg kg−1, and the pH was 7.9.
The experiment had a randomized block design with three replications, and the maize variety for test was Dachang Guoyu 918 (Gansu Province Dachang Shengshi seed industry Co., Ltd., Lanzhou, China), planted at a density of 75,000 plants/ha. Equally spaced planting was adopted, with a row spacing of 65 cm, 8-row zones, a row length of 30 m, and a plot area of 156 m2. The seeds were sown on 4 May 2021 and harvested on September 28th; and the seeds were sown on 9 May 2022 and harvested on September 30th.

2.2. Experimental Design

In this study, two experiments were set up with different tillage methods in conventional fertilization and different fertilization patterns under straw mulch strip-tillage:
Experiment 1: Four types of tillage methods were set up: conventional ridge cropping (CP), straw off-field no-tillage (NT), no-tillage with straw mulching (RNT), and strip-till (RST).
(1)
Conventional ridge cropping (CP): The conventional tillage method of ridging is adopted by local farmers. After harvesting maize in autumn, all the maize straws are removed out of field. In the spring of the following year, the fields are prepared with ridges and sown using planters.
(2)
Straw off-field no-tillage (NT): After harvesting maize in autumn, all the maize straw is removed from the field. In the spring the following year, the no-till planter is used for maize sowing.
(3)
No-tillage with straw mulching (RNT): After harvesting maize in autumn, the stalks are left to stubble at a height of 30 cm, and all the stalks cover the field over winter. In the spring of the following year, the no-till planter is used for maize sowing.
(4)
Strip-till (RST): After harvesting maize in autumn, the stalks are left to stubble at a height of 30 cm, and all the stalks cover the field over winter. Before sowing in the second year, a 1ST-300 type strip tiller is used (Kangda agricultural machinery Co., Ltd., Siping, China) to clean up the no-straw belt and deep pine, perform deep ploughing (25–30 cm deep and 25–30 cm wide), crush and compact the soil, and mulch between the rows of straw. Then, the no-till planter is used for maize sowing in the no-straw belt.
All four treatments were fertilized with local conventional fertilization modes, applying N: 225 kg ha−1, P2O5: 97.5 kg ha−1, and K2O: 58.5 kg ha−1. Specifically, 450 kg ha−1 mixed fertilizer (N: P2O5: K2O = 16-22-13) was applied as a base fertilizer, and 333 kg ha−1 urea was applied at the jointing stage of maize (6-leaf stage of maize).
Experiment 2: Under strip-till (RST) conditions, four fertilization modes were set up: conventional fertilization (Sd), controlled-release nitrogen fertilizer blended with normal urea 3:7 (30%Cr), and controlled-release nitrogen fertilizer blended with normal urea 5:5 (50%Cr), with a nitrogen-free zone (0 N).
(1)
Nitrogen-free zone (0 N): Without nitrogen fertilizer, potassium chloride and superphosphate were applied, and the amount of phosphorus and potassium fertilizer was the same as that produced with other treatments.
(2)
Conventional fertilization (Sd): 450 kg ha−1 of mixed fertilizer (N-P2O5-K2O = 16-22-13) was applied as base fertilizer, and 333 kg ha−1 of urea was applied at jointing stage of maize (6-leaf stage of maize).
(3)
Controlled-release nitrogen fertilizer blended with normal urea 3:7 (30%Cr): we used polyurethane controlled-release urea with a controlled-release N ratio of 30% (N: P2O5: K2O = 30-13-8) at a fertilizer application rate of 750.0 kg ha−1 in a one-time application at the time of sowing, and no fertilizer was applied during the reproductive period of maize.
(4)
Controlled-release nitrogen fertilizer blended with normal urea 5:5 (50%Cr): we used polyurethane controlled-release urea with a controlled-release N ratio of 50% (N: P2O5: K2O = 30-13-8) at a fertilizer application rate of 750.0 kg ha−1 in a one-time application at the time of sowing, and no fertilizer was applied during the reproductive period of maize. The polyurethane controlled-release urea was kindly provided by MOITH New Fertilizer Co., Ltd. (Shandong, China) and has a 90-day release longevity.

2.3. Sampling and Measurement

2.3.1. Greenhouse Gas Emissions, Global Warming Potential (GWP), and Greenhouse Gas Intensity (GHGI)

Greenhouse gas sampling was conducted using the static closed-chamber approach [31]. The static box was made of an opaque PVC plastic plate and the dimensions were 65 cm (length) × 40 cm (width) × 30 cm (height). Reflective heat insulation film was pasted onto the surface of the device to reduce temperature changes in the box during sampling. A small fan and thermometer were placed in the middle of the box, and a hole was punched in the middle of one side of the box to allow the entry of a silicone tube for gas collection. Each treatment used three gas chambers. After applying base fertilizer in the field, three steel bases (65 × 40 × 10 cm) were installed in each experimental plot. A water trough (2 cm wide and 2 cm high) was set up on the upper part of the base. Before gas collection, the water tank was filled with water to a height of about 1.5 cm and the static box was then placed in the water tank on the base. Greenhouse gases were collected and measured every day within one week of fertilization and every 10 days in the remaining period. When a single period of rainfall exceeds 30 mm, it is necessary to increase the number of gas collection and measurement after rainfall. The collection time was 9:00–11:00 am and gases were extracted with a 50 mL plastic syringe at 0, 10, 20 and 30 min. The air temperature in the static box was recorded at the same time. The N2O, CO2, and CH4 concentrations were analyzed via gas chromatography (7890A, Agilent, Santa Clara, CA, USA). The N2O, CO2, and CH4 fluxes were calculated as follows [32]:
F N 2 O ,   F CO 2 ,   F CH 4 = ρ   ×   H   ×   273 ( 273 + T ) × d c d t
where F (μg m−2 h−1 for N2O, and mg m−2 h−1 for CO2 and CH4) is the flux, ρ is the gas density under the standard state (1.964 kg m−3 for N2O and CO2, and 0.714 kg m−3 for CH4), H (m) is the chamber height, T (°C) is the air temperature in the chamber, and dc/dt (mg m−2 h−1) is the change in gas accumulation per unit time. Interpolation was used to calculate cumulative greenhouse gas emissions during the growing season for maize.
GWP was calculated as follows [33]:
GWP = 25 × GCH4 + 298 × GN2O + GCO2
where GWP (kg CO2 eq ha−1) is the global warming potential, GCH4 is the total emission of CH4 during the maize growing season, 25 is the radiative forcing potential of CH4 (referring to the 100-year time frame), GN2O is the total emission of N2O during the maize growing season, 298 is the radiative forcing potential of N2O (referring to the 100-year time frame), and GCO2 is the total emission of CO2 during the maize growing season.
GHGI (kg CO2 eq kg −1 yield) was calculated as follows [34]:
GHGI = GWP/Grain yield
where GHGI (kg CO2 eq kg −1 yield) is the greenhouse gas intensity.

2.3.2. Net Income and Net Ecosystem Economic Budget (NEEB)

Detailed records of maize production inputs, including the cost of purchased seed, fertilizers, pesticides, fuel consumption, labor, etc., are produced over the entire reproductive period from sowing to harvest.
Net income = Yield gains − Agriculture activity costs
The Net Ecosystem Economic Budget (NEEB) was calculated as follows:
NEEB = Yield gains − Agricultural activity costs-GWP costs
where yield gains are calculated from the current crop-grain price (maize, 2300 CNY t−1) and maize-grain yield. Agricultural activity costs comprise the expenses from mechanical tillage (7.3 CNY L−1), seed (1020 CNY ha−1), conventional NPK compound fertilizer (3200 CNY t−1), controlled-release nitrogen fertilizer (3200 CNY t−1), common urea (2000 CNY t−1), pesticides and herbicides (450 CNY ha−1), and the price of labor (24 CNY ha−1) according to current pricing. The GWP costs were calculated on the basis of carbon-trade prices (103.7 CNY t−1 CO2-eq.) and GWP [29].

2.3.3. Yield and Yield Components

In the physiological maturity stage, two rows in the middle of the measured production area were selected, and all plants in these rows were harvested after the removal of side plants. The number of harvested ears was counted. Ten plants with uniform ear growth were selected for the determination of ear rows, row grains, 1000-grain weight, and grain water content (measured with an LDS-1G moisture content detector), which were converted into maize yield (converted into hectare yield with 14% water content).

2.4. Statistical Analysis

Analysis of variance (ANOVA) was performed using SPSS 22 (IBM, Inc., Armonk, NY, USA). The differences among means of the experimental treatments were separated using the least-significant difference (LSD) test at a 0.05 probability level. Origin 2019 (Origin Lab, Northampton, MA, USA) software was used to plot graphs.

3. Results

3.1. Effects of Different Tillage and Fertilization Modes on Maize Yield

The yield of maize in different tillage method in two years was RST > NT > CP > RNT. The RST had the highest yield of 12.25 Mg ha−1 and 11.74 Mg ha−1 in 2021 and 2022, respectively. The average yields of RST in two years were 4.3%, 6.2% and 7.1% higher than those of the NT, CP and RNT. Furthermore, yield component results demonstrated that the ear number (p < 0.01) and kernel number per ear (p < 0.05) of maize significantly displayed variance between treatments. The ear number of RST was 2.2%, 8.5% and 7.7% higher than that of NT, CP and RNT on average (Table 1). The increase in RST yield was mainly due to the significant increase in the effective ear number of maize.
Under strip-till (RST), the maize yield from 50%Cr and 30%Cr was significantly higher than that of Sd in two years (p < 0.05). The average yield of 50%Cr was 13.1 Mg ha−1 in two years, which was 4.0% and 9.2% higher than that of 30%Cr and Sd, respectively. From the perspective of yield components, the fertilization mode mainly affects the kernel number per ear and thousand-kernel weight of maize (p < 0.01). The kernel number per ear and thousand-kernel weight of 50%Cr were the largest, which was not significantly at variance from 30%Cr, but significantly higher than Sd. Compared with Sd, the kernel number per ear of 50%Cr increased by 2.5% on average, and the thousand-kernel weight increased by 3.3% on average (Table 2).

3.2. Effects of Different Tillage and Fertilization Modes on Greenhouse Gas Emissions

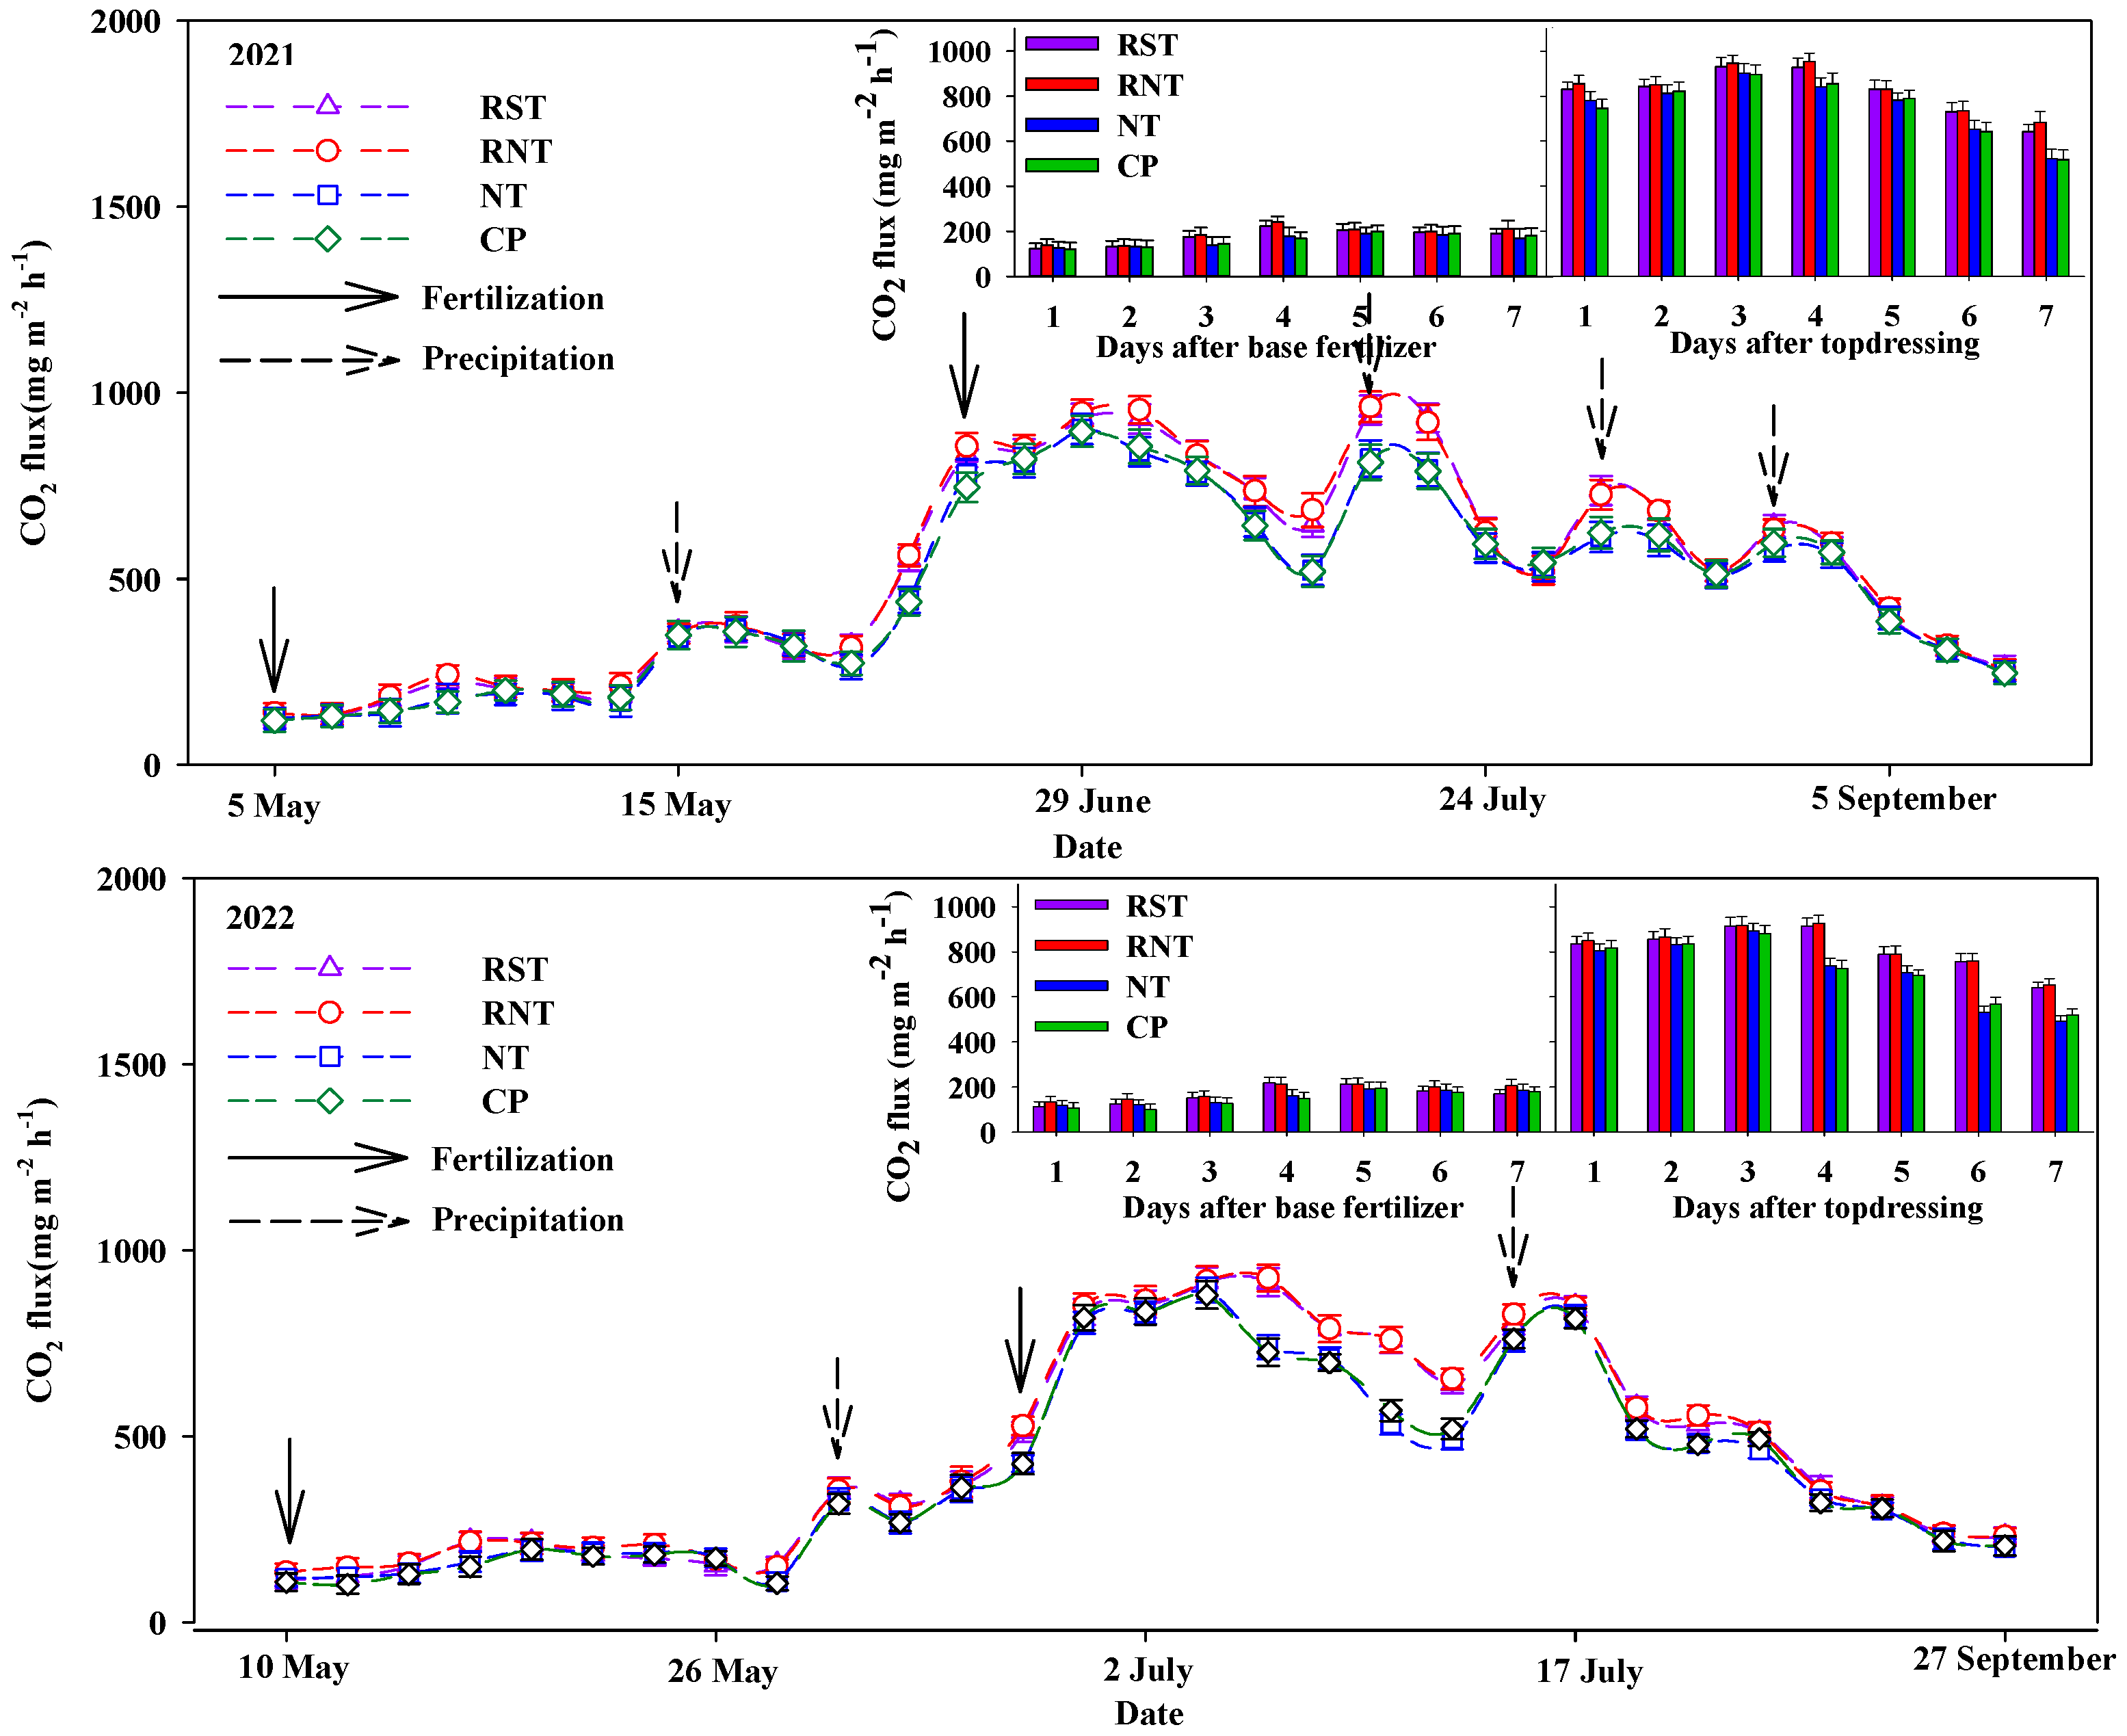
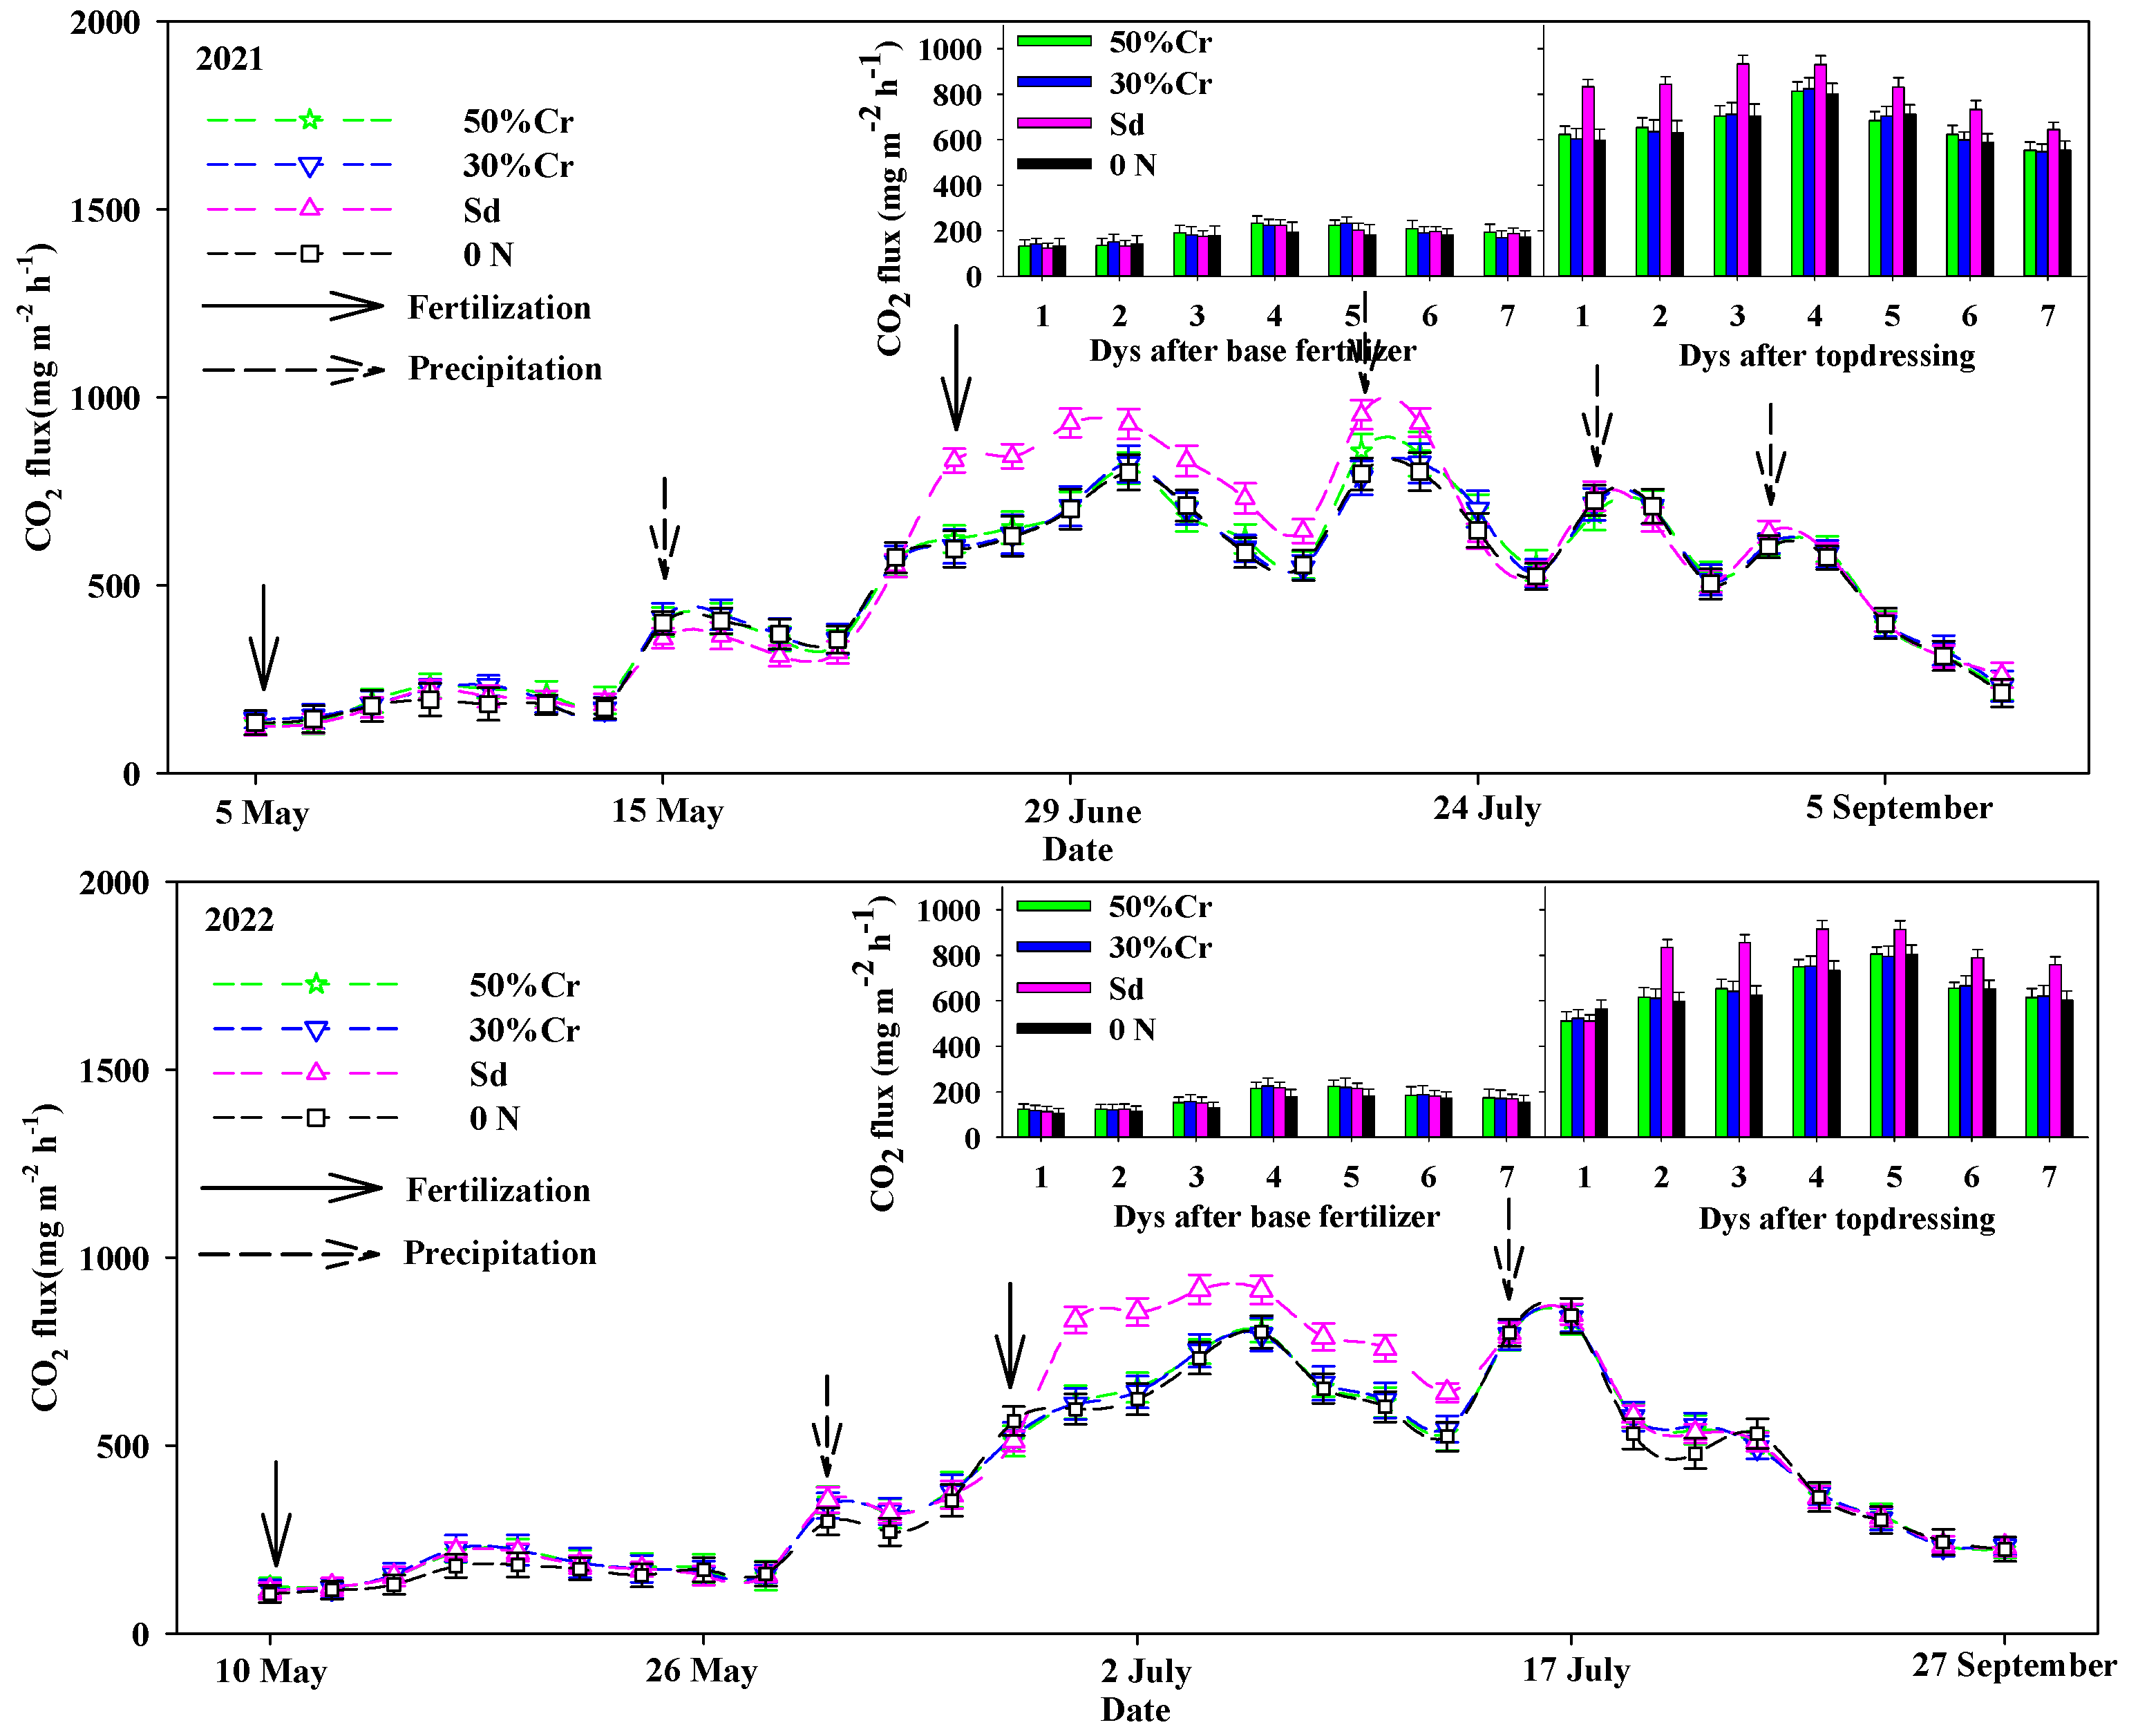
3.2.1. Effects of Different Tillage and Fertilization Modes on CO2 Emission Flux

Our studies have shown that straw mulching increased the CO2 emission flux from farmland. The CO2 emission flux of farmland has obvious seasonal variation characteristics. The emission flux of each treatment was low in the early stage of maize growth. It showed a trend of increasing first and then decreasing with the advancement of maize growth process. The peak of emissions appeared in July (Figure 1). There was an increase in emission flux both with fertilizer application and after rainfall. Between the different tillage methods, peak emissions occurred 3–4 days after fertilizer application in all treatments, and the peaks of RNT and RST were higher than those of NT and CP. The RNT had the highest two-year average maximum emission flux of 943.7 mg m−2 h−1 and CP was the smallest at 887.9 mg m−2 h−1. The CO2 emission flux from the farmland of the RNT and RST in July–August was higher than those in other treatments.
Under strip-till, the trend of CO2 emission flux was consistent among different fertilization modes, with the peak CO2 emission flux of 50%Cr and 30%Cr fields lower than that of Sd. The CO2 emission flux of Sd was higher than that of other treatments after fertilization at the jointing stage of maize. The reason for this may be that the fertilization operation disturbed the straw and topsoil, promoted the degradation of straw and soil organic matter, and increased the CO2 emission flux of farmland after fertilization (Figure 2).

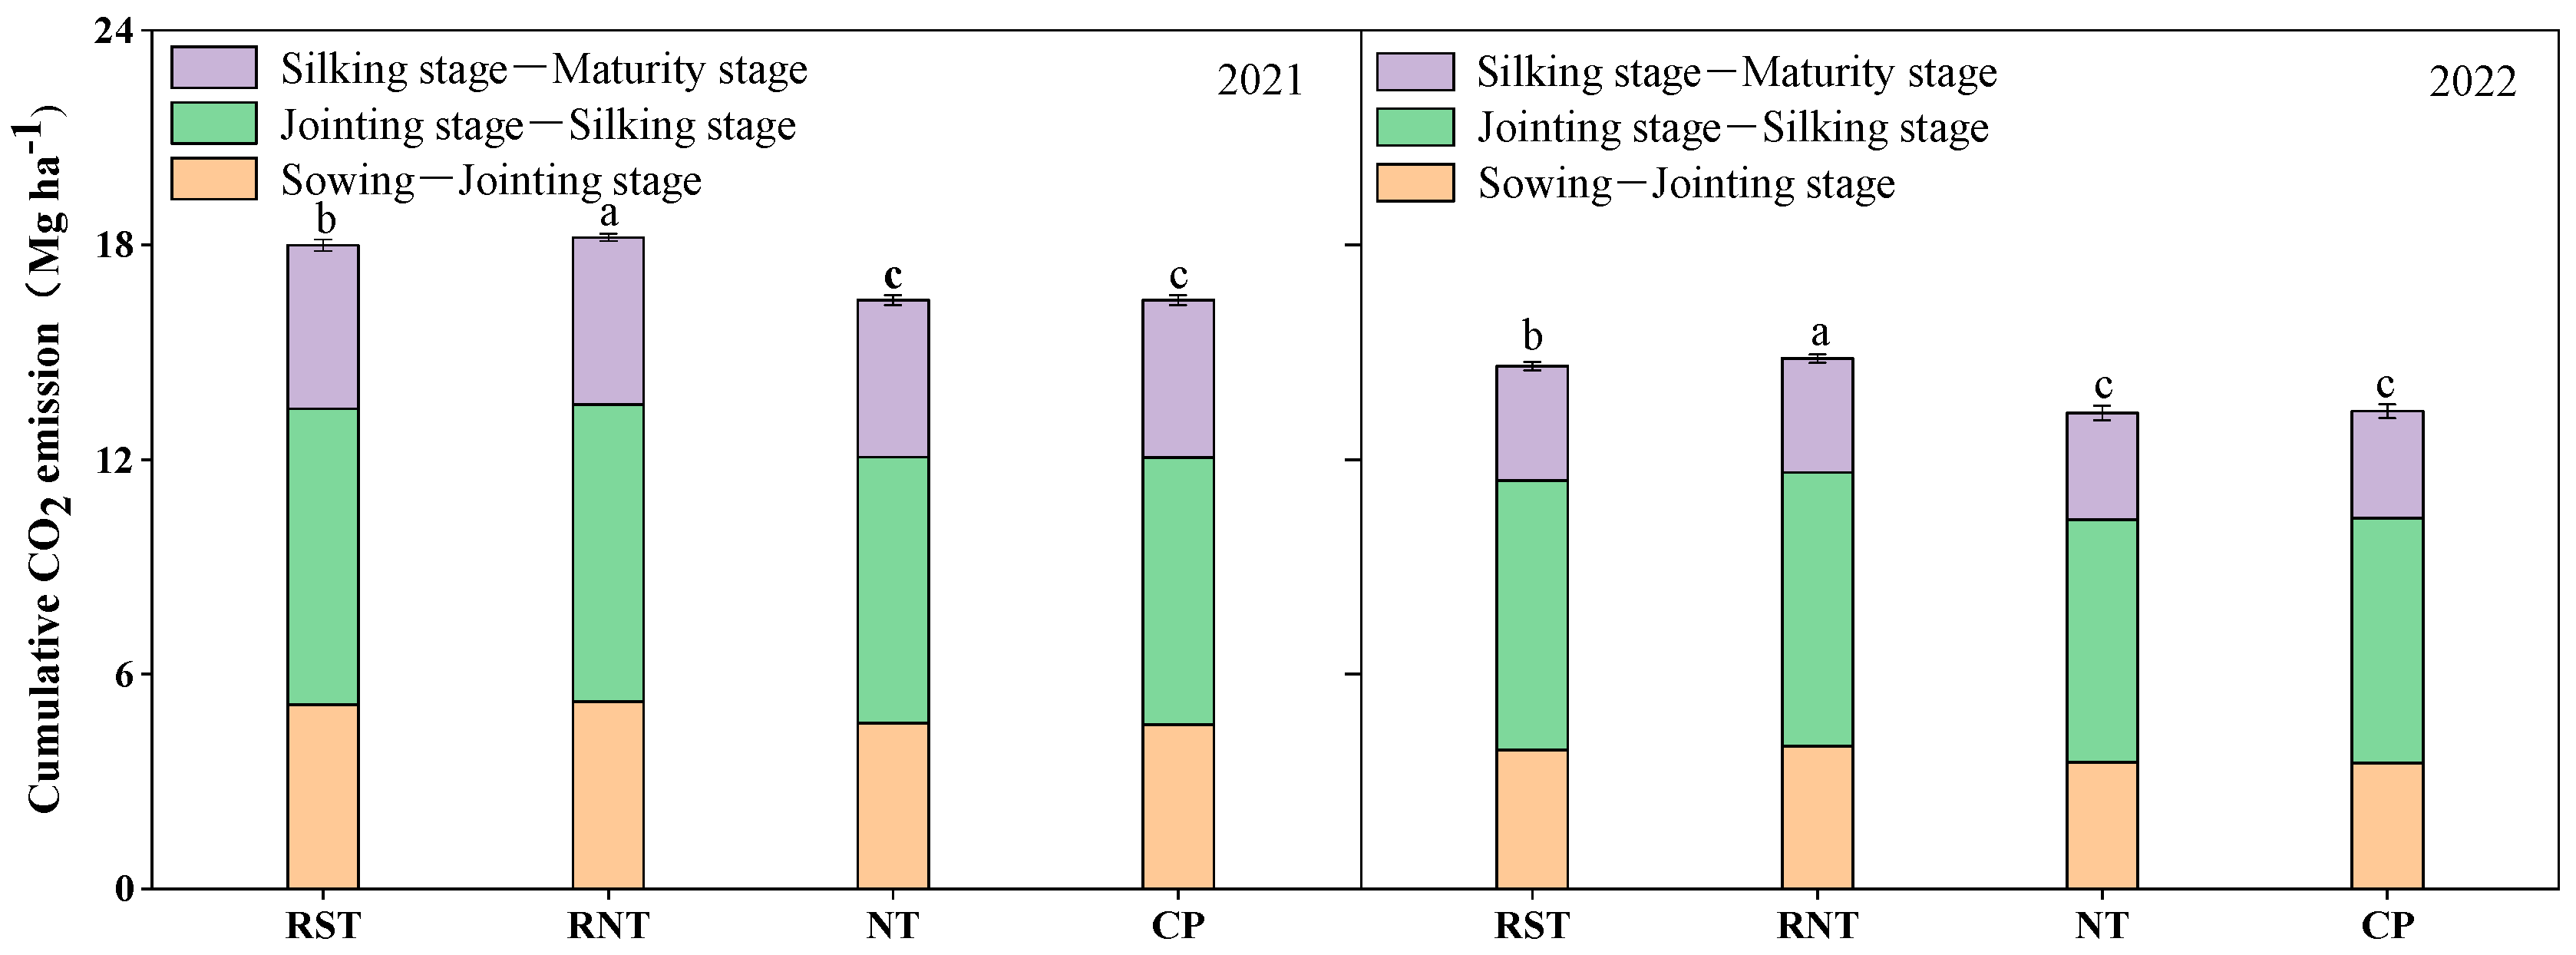
3.2.2. Effects of Different Tillage and Fertilization Modes on Cumulative CO2 Emissions

Tillage methods induced significant (p < 0.05) changes in cumulative CO2 emissions during the whole growth period of maize (Figure 3), and straw mulching significantly increased the cumulative CO2 emissions from farmland. The two-year average cumulative emissions showed RNT (16.5 Mg ha−1) > RST (16.3 Mg ha−1) > NT (14.87 Mg ha−1) > CP (14.9 Mg ha−1), the RNT treatment was 11% and 10.8% higher than those of the NT and CP, and RST treatment was 9.6% and 9.4% higher than those of the NT and CP. The cumulative emissions of CO2 in different growth stages of maize showed the largest values at the jointing–silking stage, accounting for 46~48.8%, and the proportions of sowing–jointing stage and silking–maturity stage were 27.1~27.9% and 23.6~24.6%, respectively.
Under strip-till, 50%Cr and 30%Cr treatments significantly reduced cumulative CO2 emissions from the farmland compared to conventional fertilization (p < 0.05). Compared to Sd, 50%Cr (16.0 Mg ha−1) and 30%Cr (15.9 Mg ha−1) were reduced by 2.1% and 2.3%, respectively. The proportions of the sowing–jointing stage, jointing–silking stage and silking–maturity stage was 27.6~28.5%, 47.1~48.8% and 23.7~24.8%, respectively (Figure 4). The results indicated that the CO2 emission of maize field in the hilly region of northeast China mainly occurred before the silk stage, and that the proportion after the silk stage was relatively small.

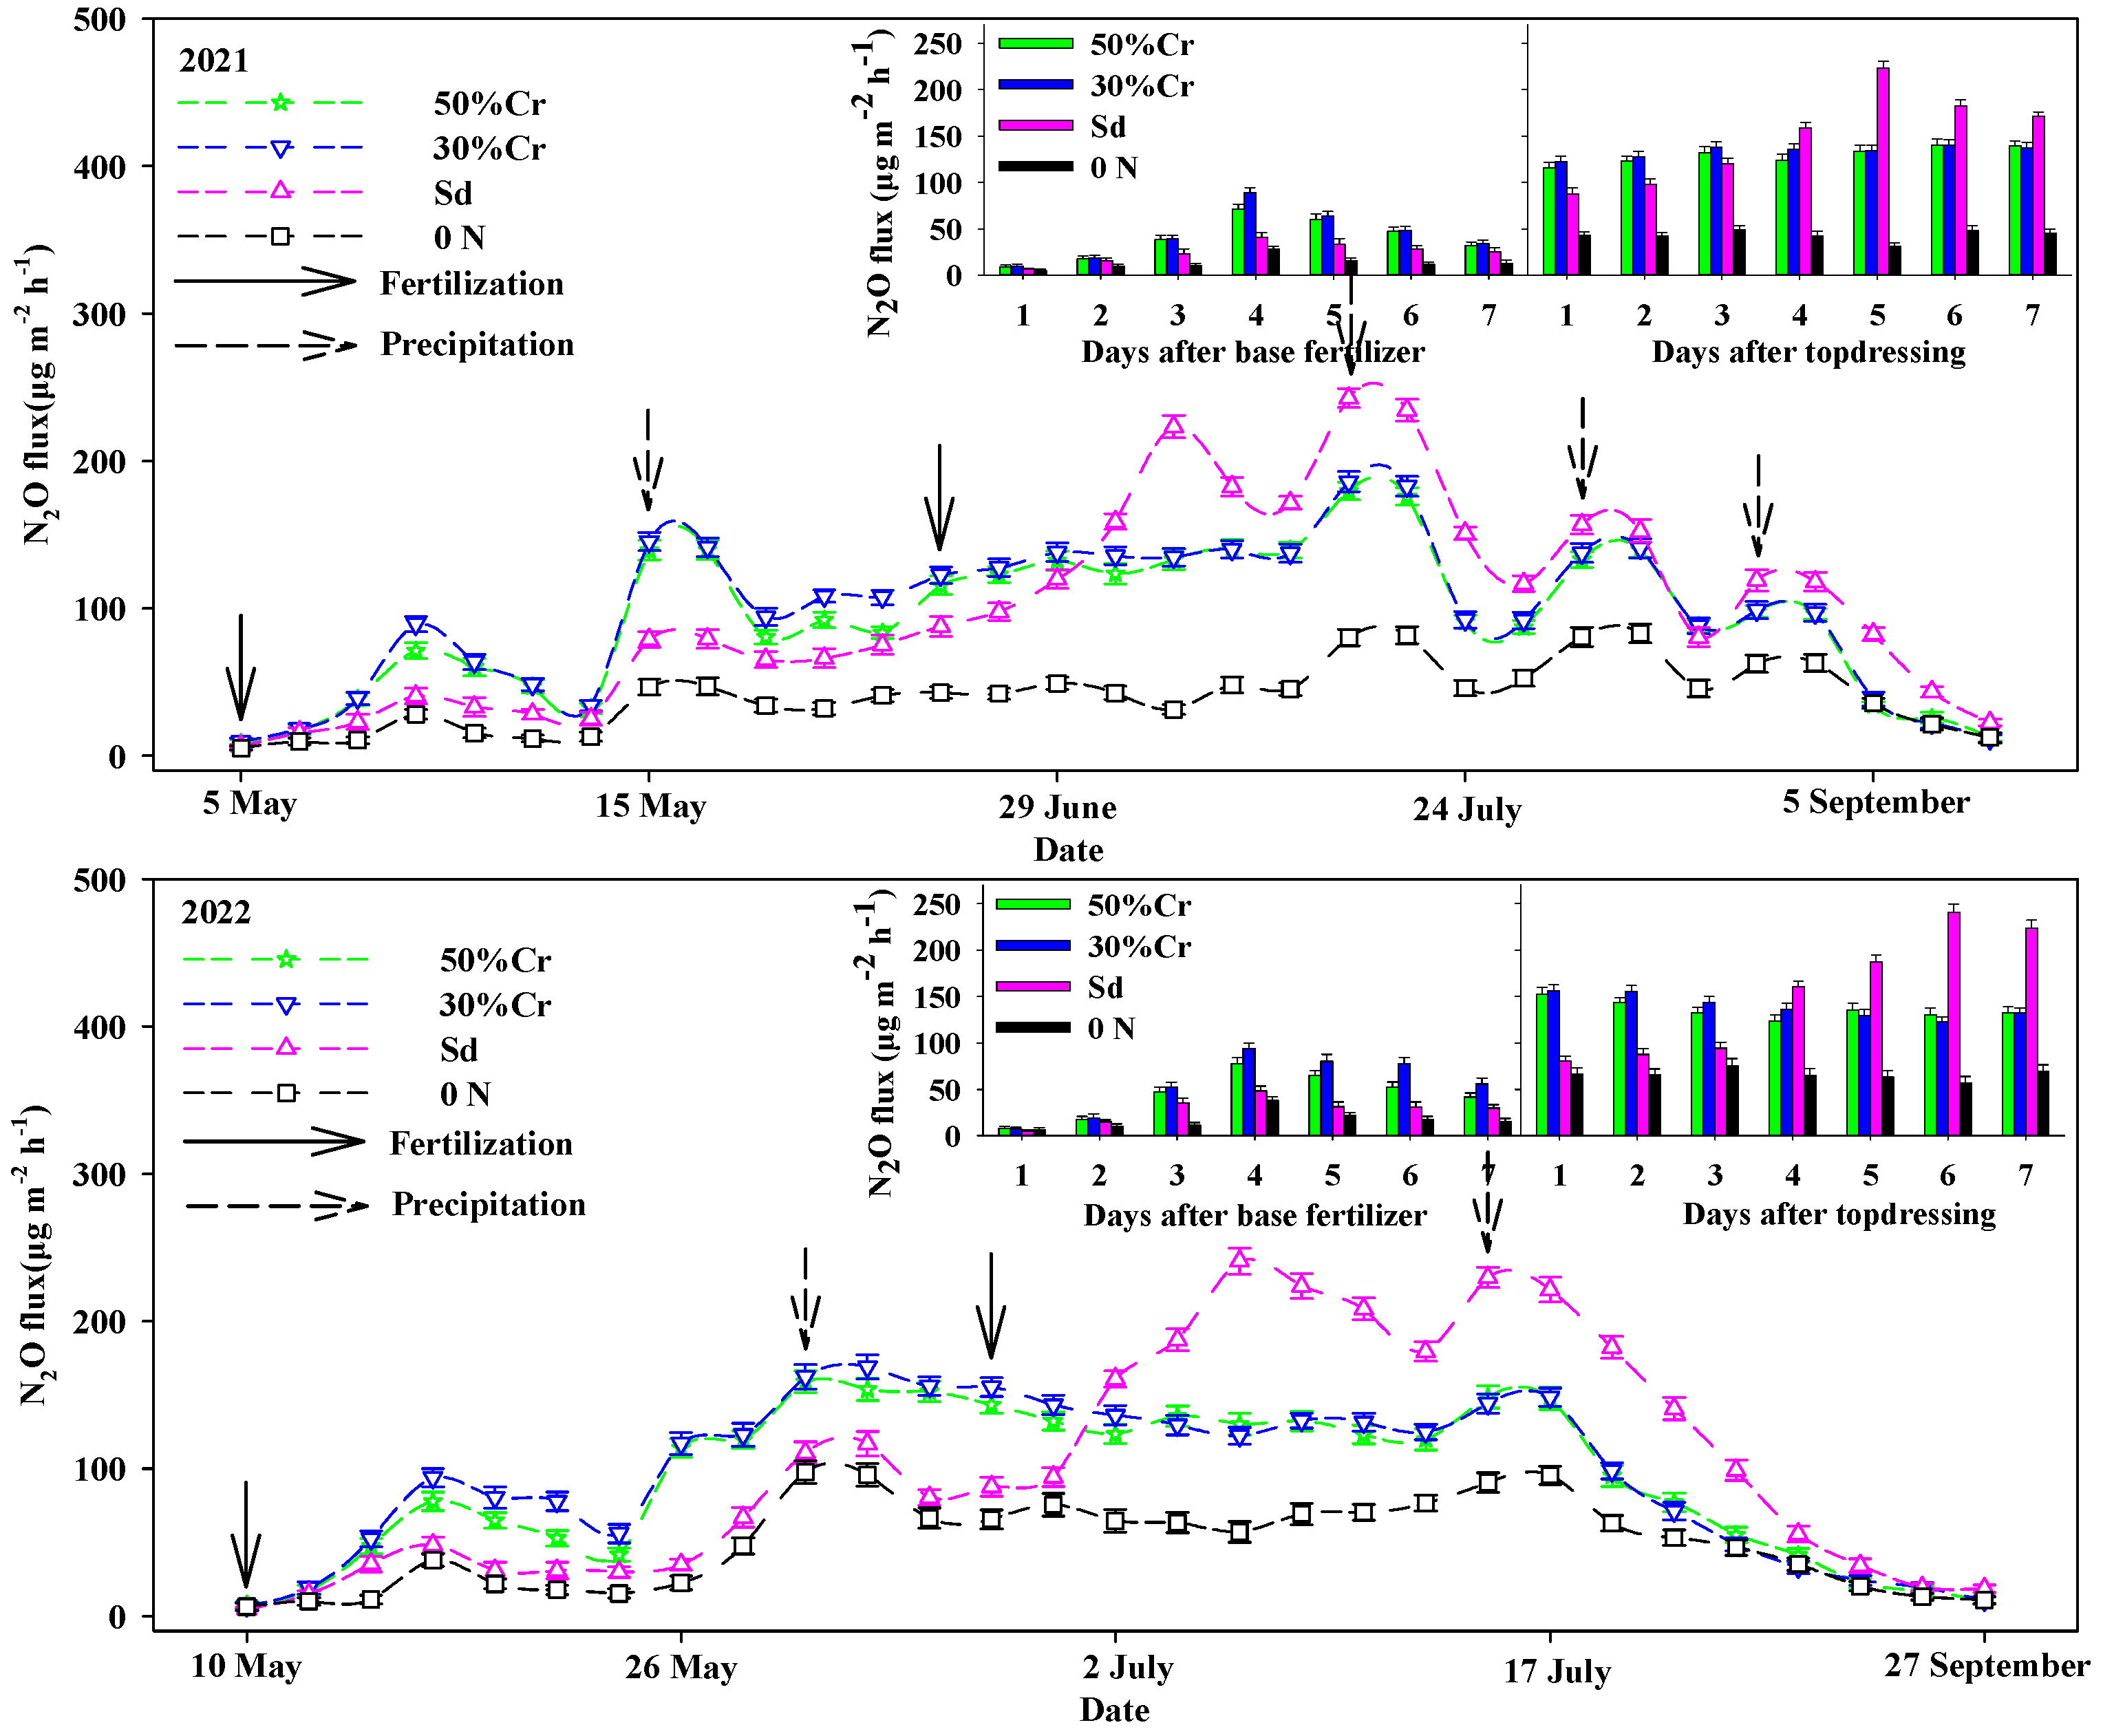
3.2.3. Effects of Different Tillage and Fertilization Modes on N2O Emission Flux

The results of our study showed that straw-mulched can increase N2O emission flux after fertilization, and the maximum N2O emission flux of each tillage method was not significantly different in the growth period of maize. From 1 to 4 days after fertilization, the N2O emission fluxes of RNT and RST were higher than those of CP and NT. As the maize growth process moved from sowing to harvesting, the trend of N2O emission on each cultivation method increased first and then decreased. Both fertilizer application and the post-rainfall period caused increases in emission flux (Figure 5).
Under strip-till, the N2O emission flux of 50%Cr and 30%Cr was higher than that of Sd after basal fertilizer application. The N2O emission flux of Sd increased gradually after fertilization at jointing stage, and the maximum emission fluxes of 50%Cr and 30%Cr decreased by 29.8% and 34.0% on average compared with Sd during maize growth period (Figure 6). In conclusion, 50%Cr and 30%Cr treatment can reduce the peak N2O emission and have a positive effect on reducing N2O emissions in farmland.

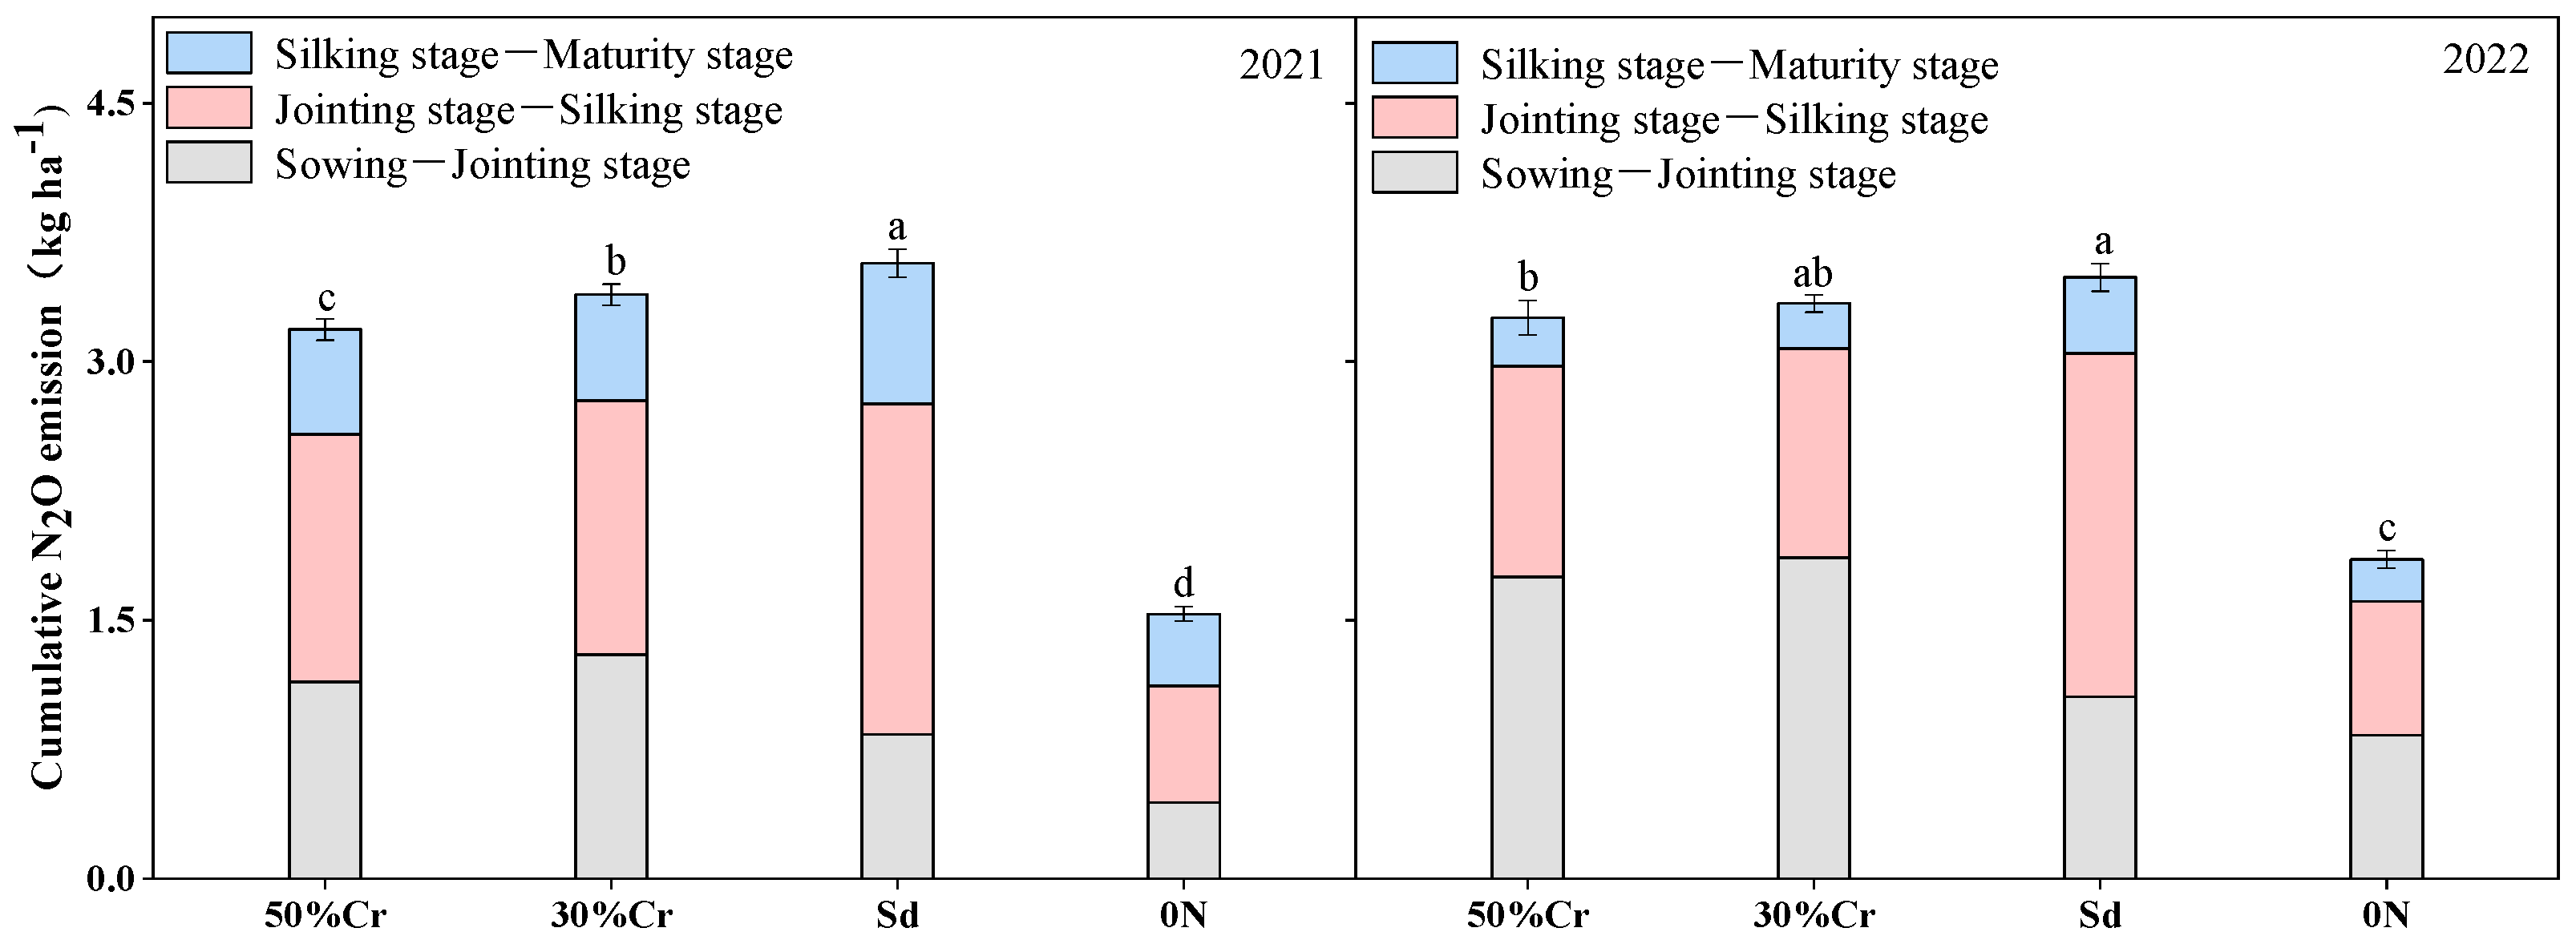
3.2.4. Effects of Different Tillage and Fertilization Modes on Cumulative N2O Emissions

Maize straw mulching increased the cumulative emissions of N2O in farmland soil. In 2021, the N2O cumulative emission of the RNT was 3.7 kg ha−1, which was significantly higher than that NT and CP (p < 0.05). Compared with NT and CP, the two-year average cumulative N2O emissions of the RNT were increased by 5.3% and 5.8%, and the cumulative N2O emissions of RST increased by 3.9% and 4.4%, respectively. The cumulative emissions of maize in different growth stages of each treatment were largest in the jointing stage–silking stage, where they were 55.4~57.1%. The proportions in the sowing–jointing stage and silking stage–maturity stage was 26~26.8% and 16.5~17.8% (Figure 7).
Under strip-till, the cumulative emission of N2O was significantly different among different fertilization modes (p < 0.05). Compared with Sd, 30%Cr (3.4 kg ha−1) and 50%Cr (3.2 kg ha−1) decreased by 2.9% and 8.6%, respectively. Compared with conventional fertilization, controlled-release blended fertilizer slightly increased the cumulative N2O emissions from the sowing to jointing stage, but significantly reduced the cumulative N2O emissions from the jointing to silking stage (Figure 8). This suggests that the use of controlled-release blended fertilizer in a strip-till mode can significantly reduce the cumulative N2O emissions and that the 50%Cr treatment has the most obvious effect, which is due to the significant reduction in the cumulative N2O emissions in the jointing stage–silking stage.

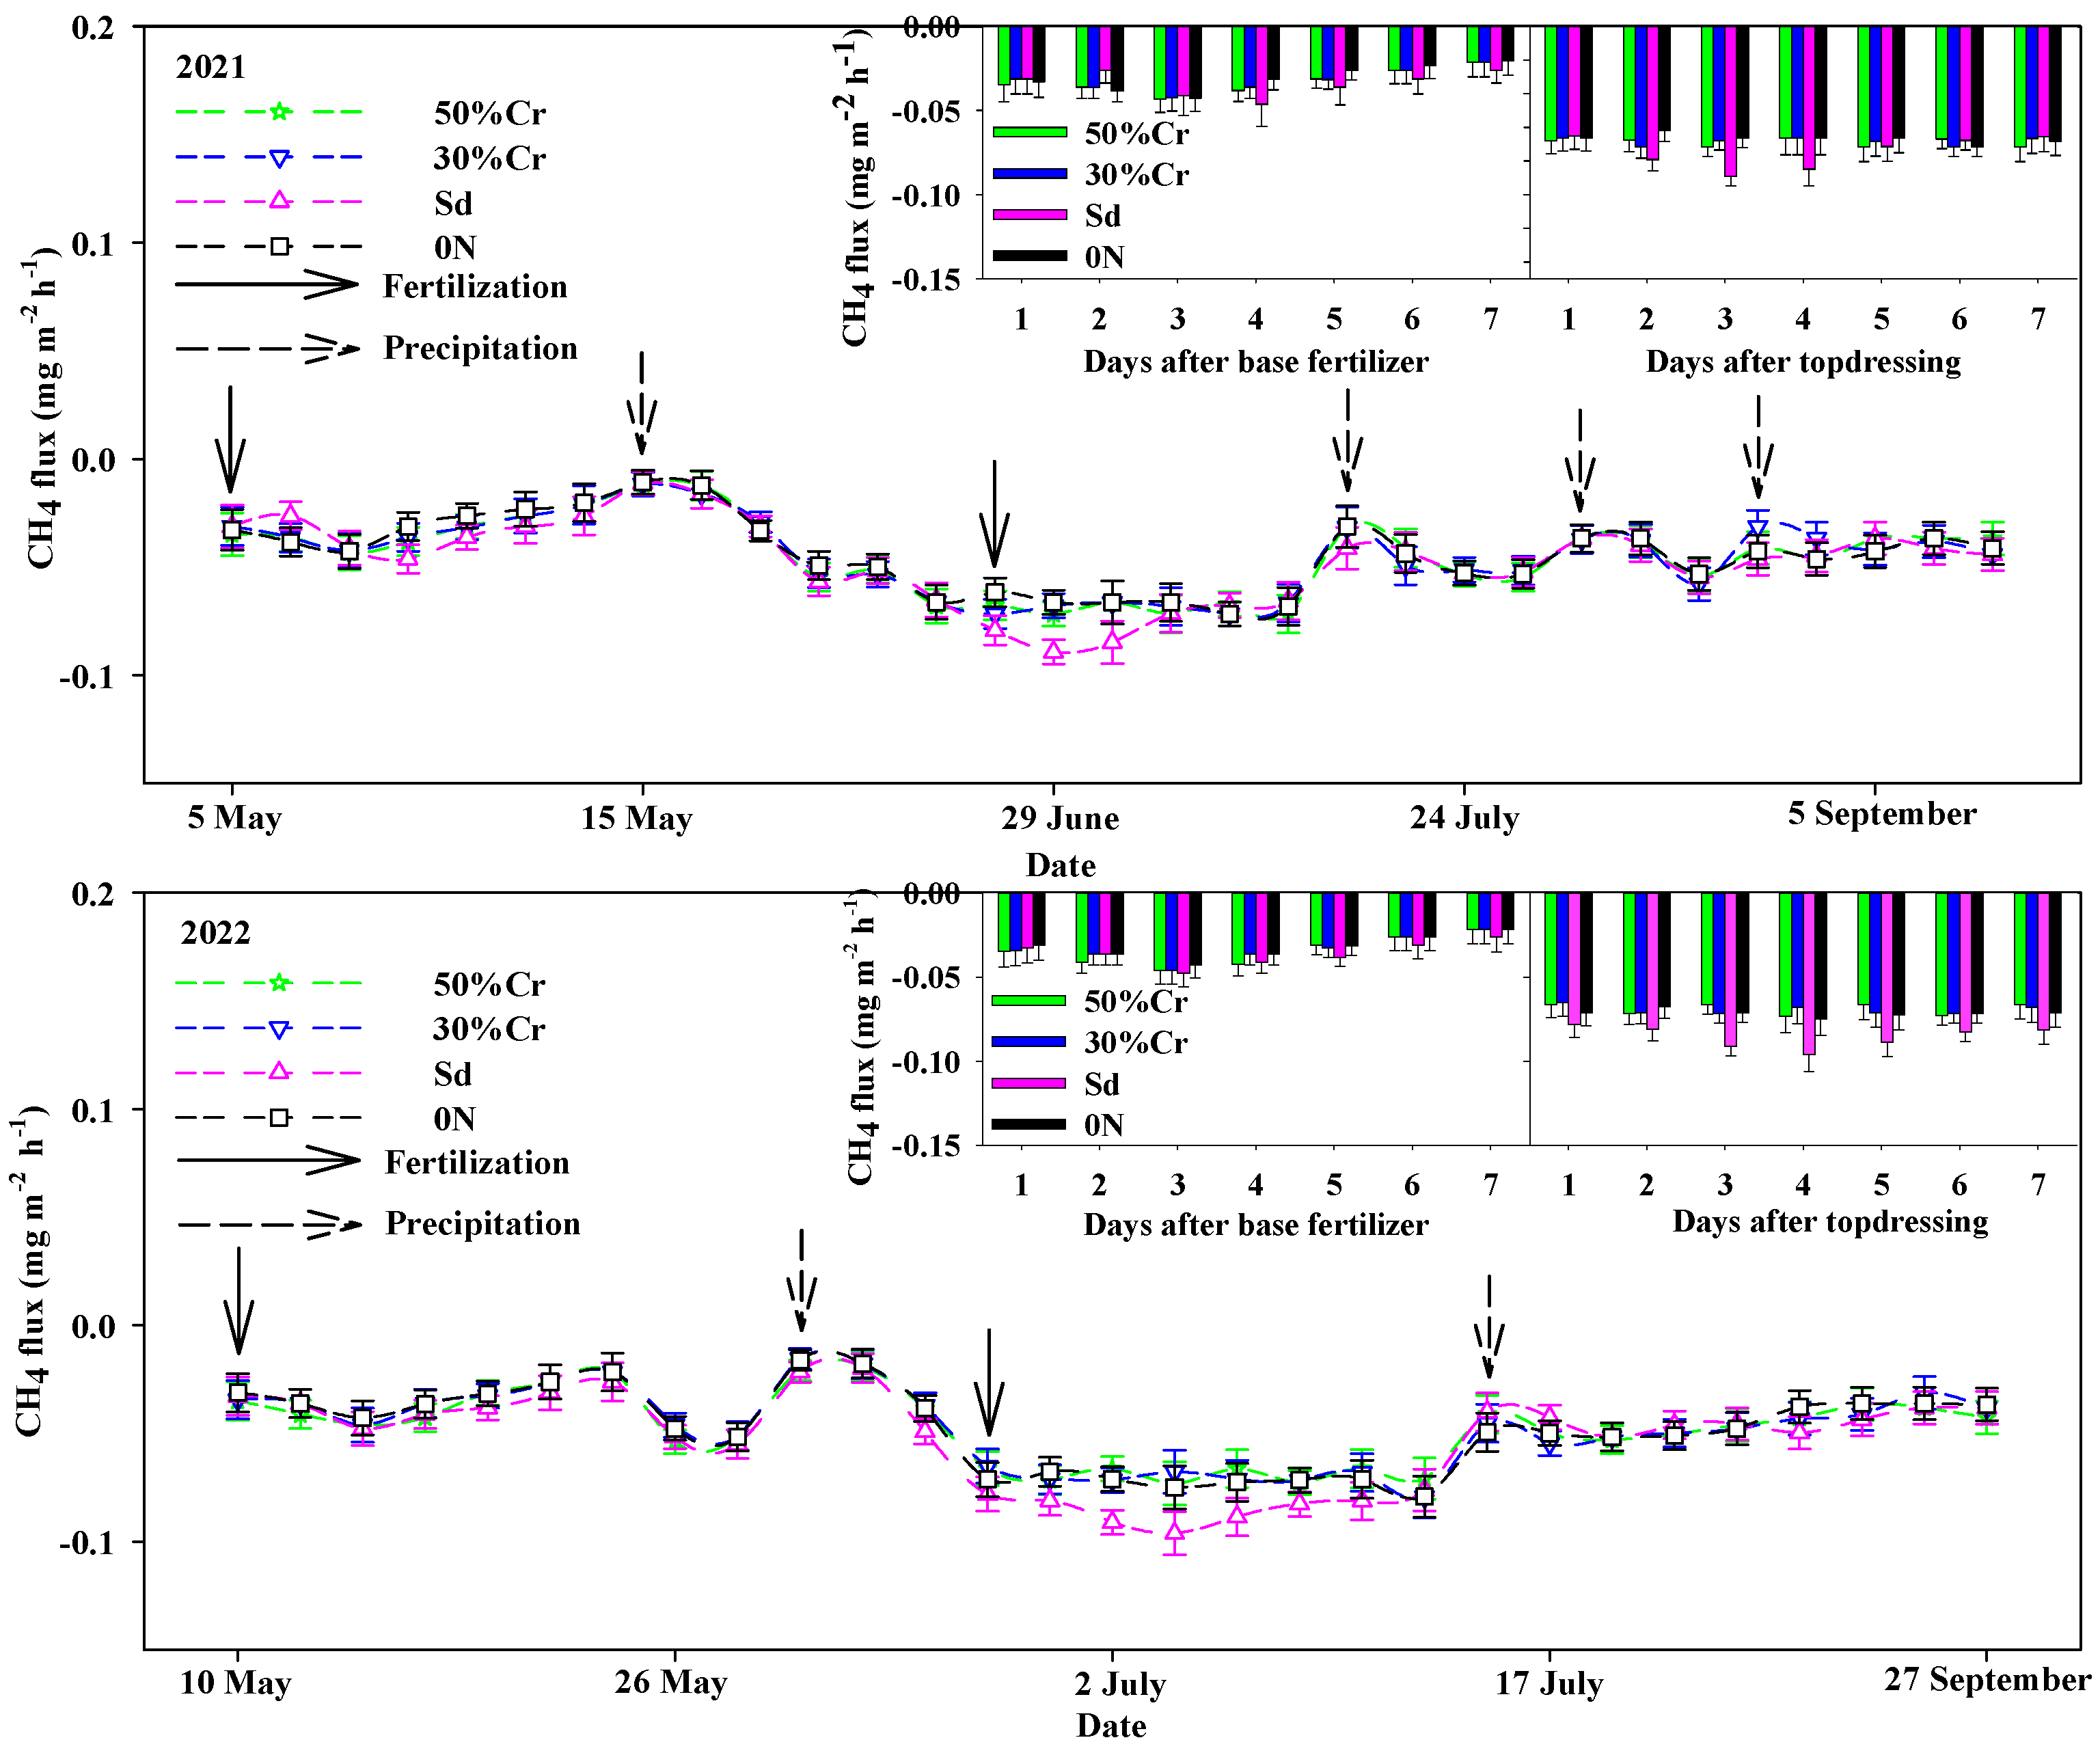
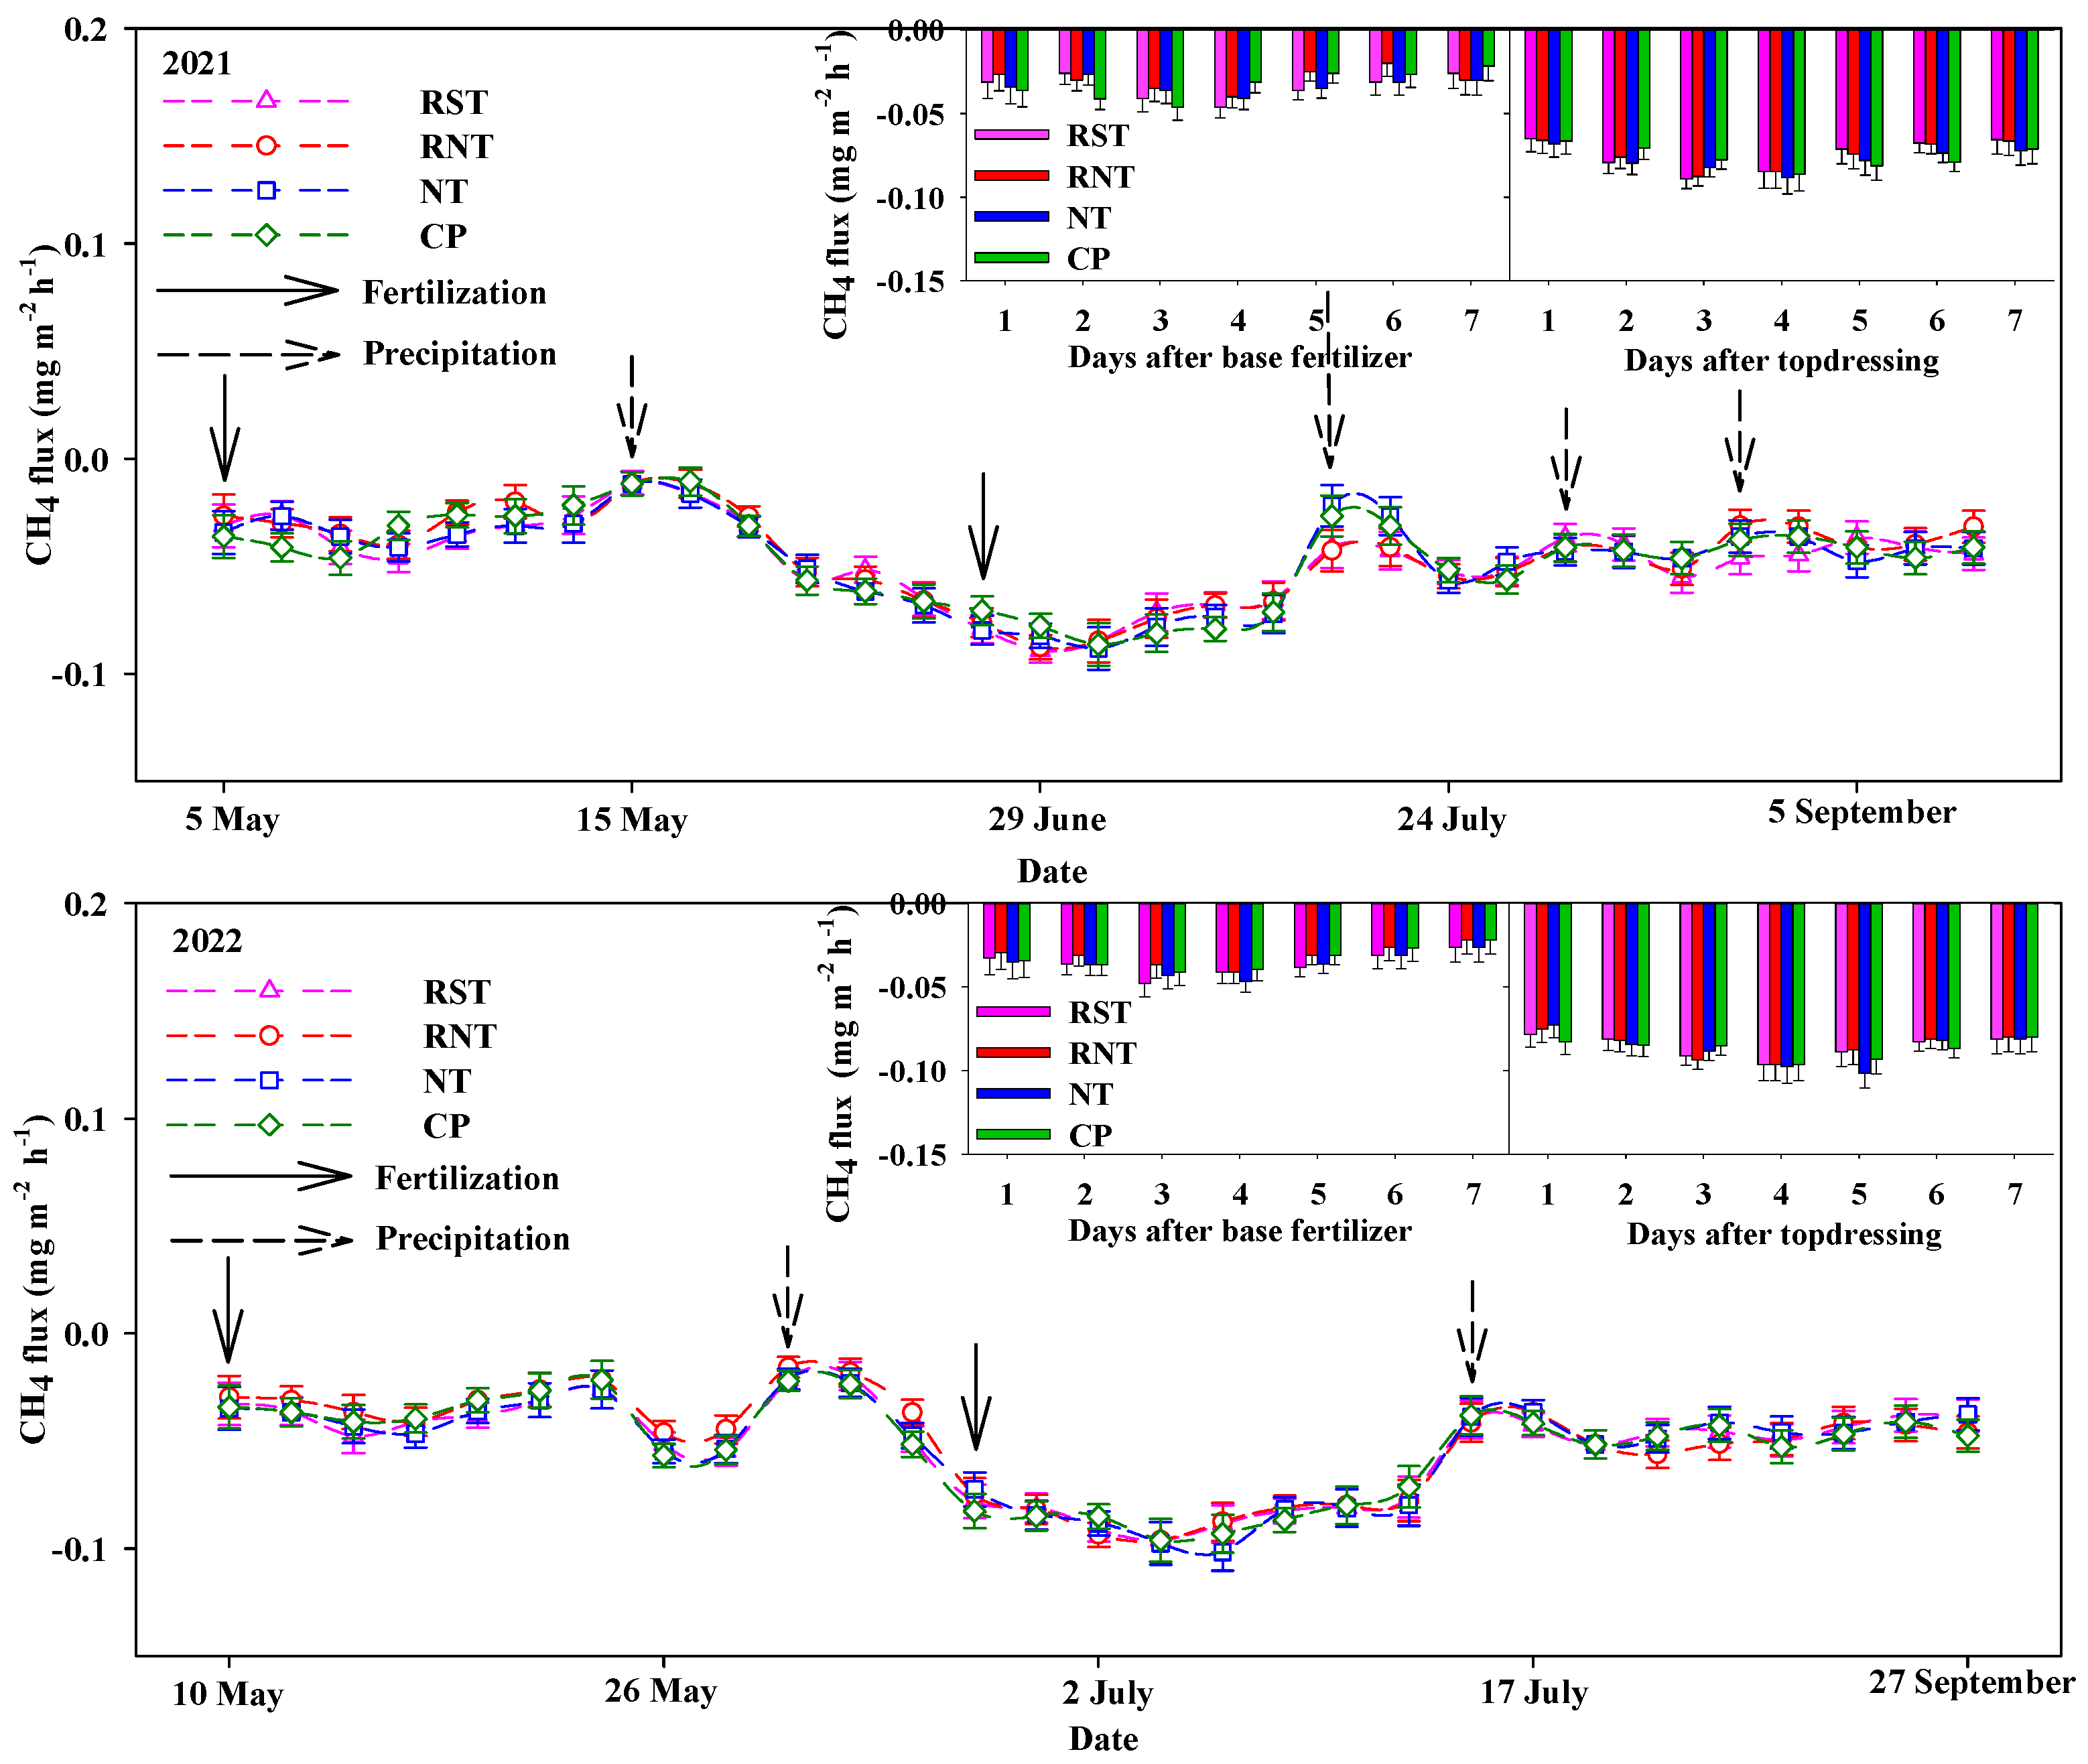
3.2.5. Effects of Different Tillage and Fertilization Modes on CH4 Emission Fluxes

The trends of CH4 uptake fluxes were basically the same among different tillage methods, and the maximum uptake fluxes during the reproductive period did not differ significantly among treatments (Figure 9). Furthermore, the CH4 emission fluxes between different tillage and fertilization modes were all negative (Figure 9 and Figure 10), indicating that during the maize reproductive period the farmland CH4 was in an absorptive state, and that the maize farmland was a weak carbon sink for CH4. Peak CH4 uptake occurred 2–4 days after fertilizer application. The CH4 uptake flux was significantly reduced when there was rainfall.
Under strip-till, the CH4 uptake flux of Sd increased slightly after fertilization at the jointing stage, which may be due to the uptake of fertilization to soil and the increase in air circulation, thus promoting the uptake of CH4 in soil (Figure 10).

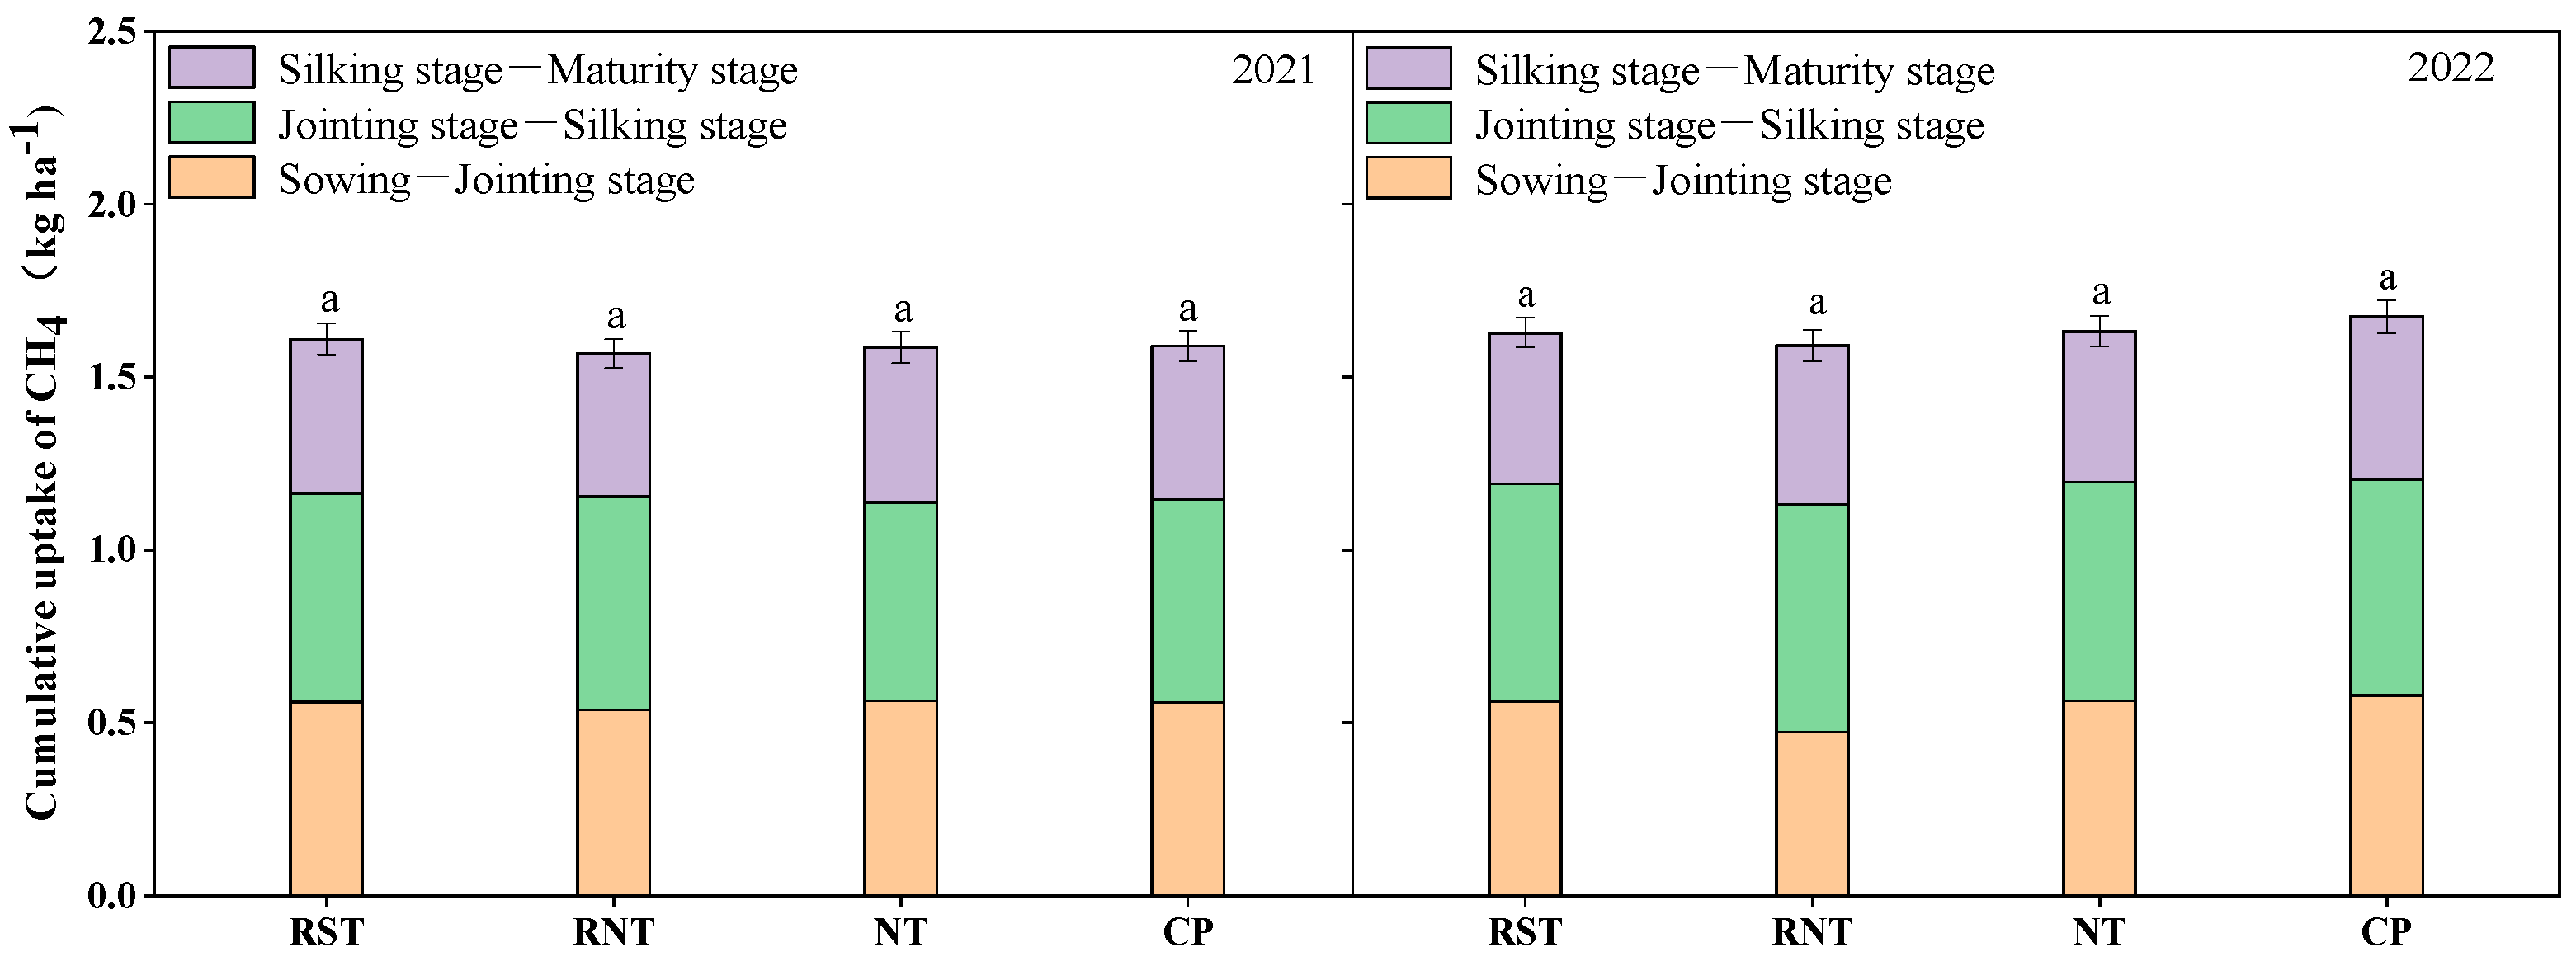
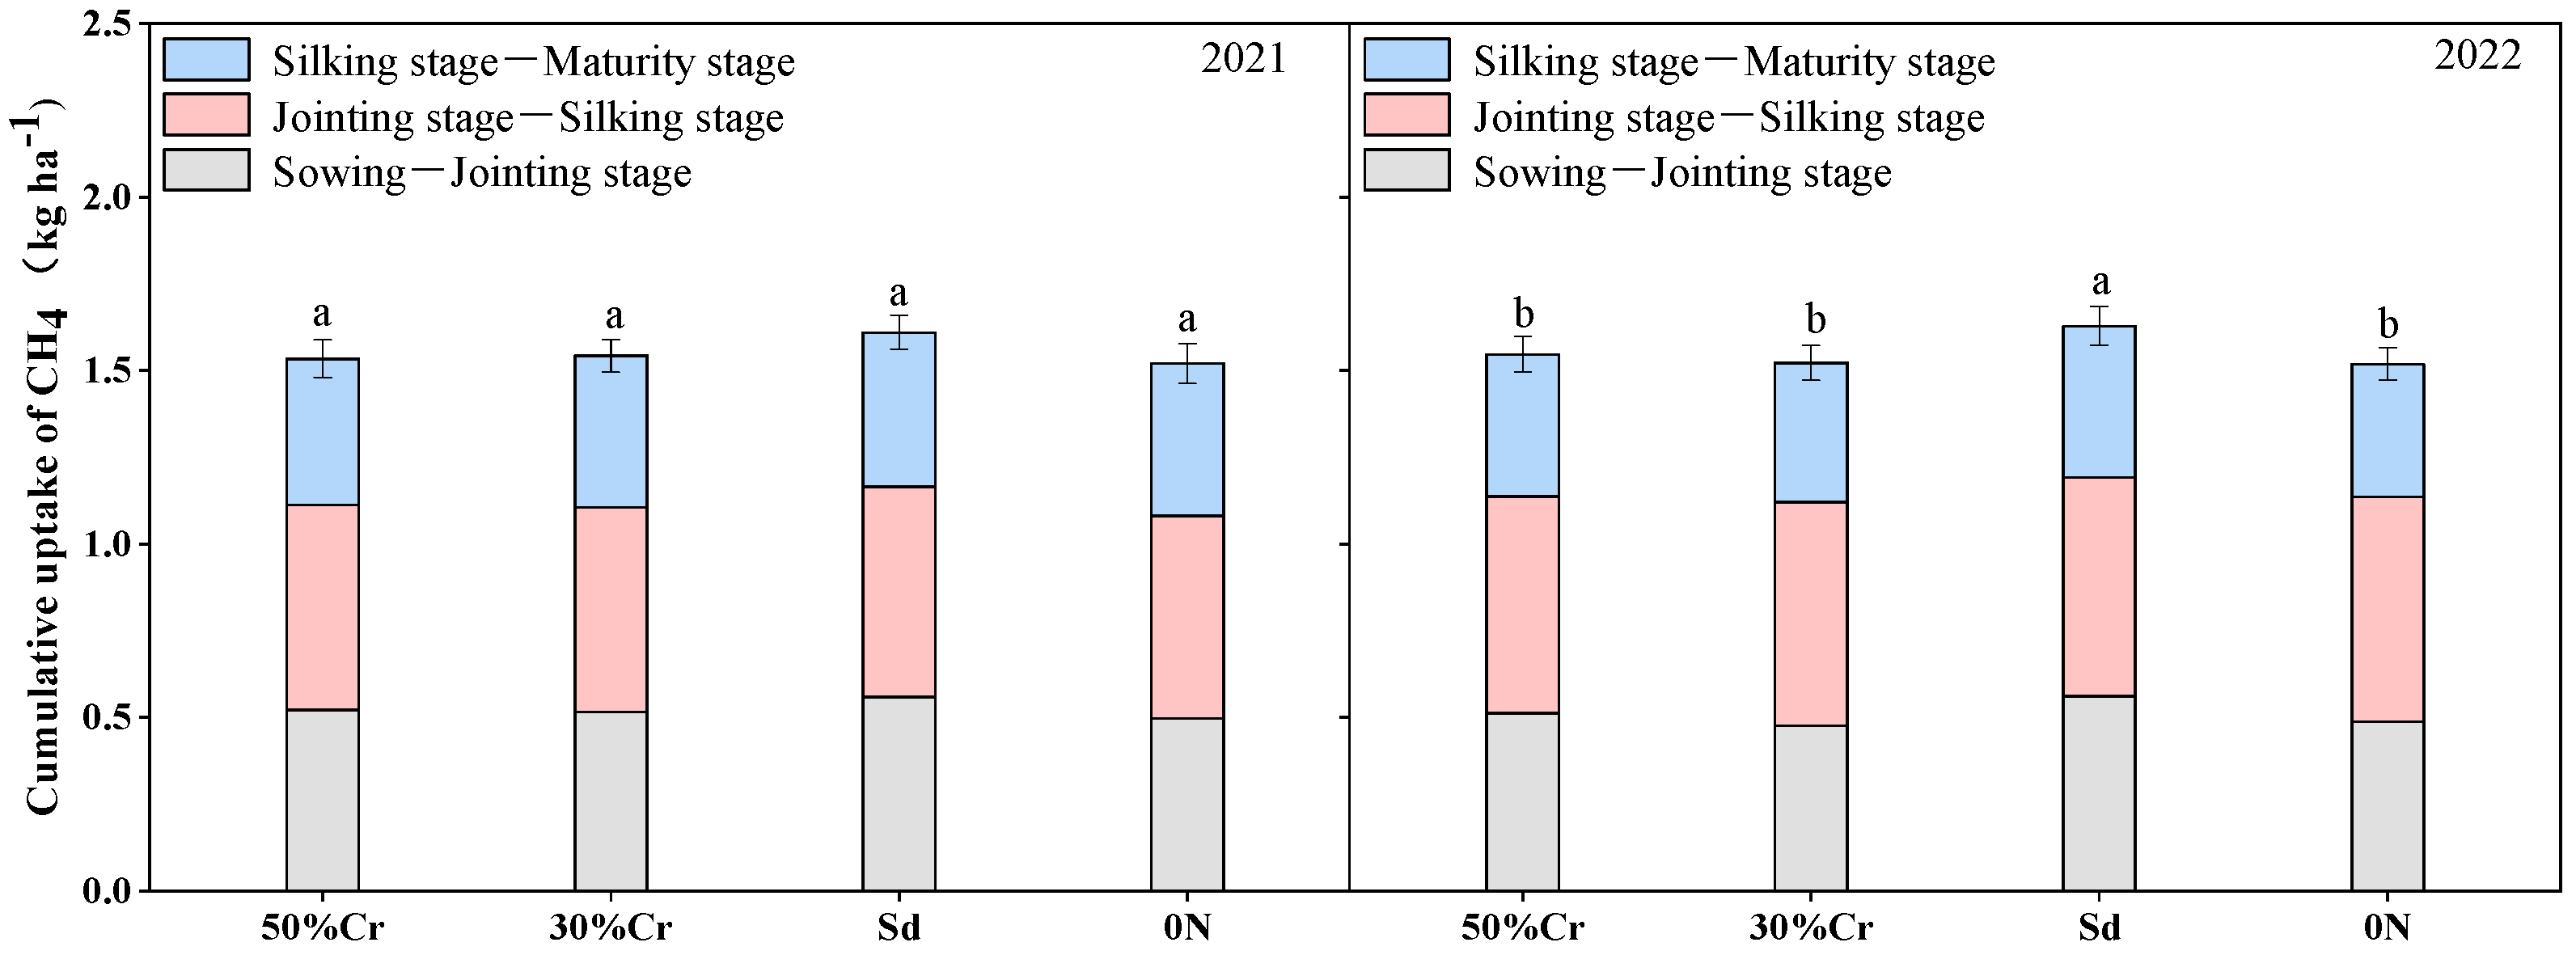
3.2.6. Effects of Different Tillage and Fertilization Modes on Cumulative CH4 Uptake

As shown in Figure 11, the cumulative CH4 uptake of NT and CP did not differ significantly among different tillage methods during the whole growing period, with a range of 1.57~1.63 kg ha−1 among treatments. The proportions of sowing–jointing stage, jointing–silking stage and silking–jointing stage were 31.9~34.9%, 37.1~40.4% and 27.2~28%, respectively.
Under strip-till, the Sd treatment had the highest average cumulative CH4 uptake of 1.6 kg ha−1 in both years, and Sd treatment values were significantly higher than those in other treatments in 2022 (p < 0.05) (Figure 12).

3.3. Effects of Different Tillage and Fertilization Modes on GWP and GHGI

As shown in Table 3 and Table 4, during the growth period of maize, the contribution of GWP mainly comes from CO2 (13,298.8–18,209.5 kg ha−1), followed by N2O (950.6–1087.7 kg ha−1), and the offset effect of CH4 (−1.7–−1.5 kg ha−1) absorption in farmland is weak. Among different tillage methods, the GWP highest value at RNT, which was 10.5% (NT) and 10.4% (CP) higher than those of other treatments, and RST increased by 9.2% and 9.1%, respectively, compared with NT and CP. Compared with RNT, the GWP of RST decreased by 1.3% (Table 3). Under strip-till, nitrogen fertilization significantly increased GWP, and the GWP was the largest under conventional fertilization. Compared with Sd, the GWP of 50%Cr and 30%Cr decreased by an average of 2.5% and 2.4%, respectively (Table 4).
Analysis of the GHGI from farmland showed that NT, CP and RST did not reach significant levels (p > 0.05). Compared with RNT, GHGI of NT, CP and RST were reduced by 12.1%, 10.9% and 8.0%, respectively, (Table 3). Under strip-till, GHGI of controlled-release blended fertilizer was significantly lower compared to conventional fertilization treatments. The values of 50%Cr and 30%Cr were reduced by 10.4% and 7.3%, respectively, compared to Sd (Table 4).

3.4. Analysis of Economic and Environmental Benefits of Different Tillage and Fertilization Modes

As shown in Table 5, RST had the highest Net income among different tillage methods, which was 7%, 9.7% and 10% higher than NT, CP and RNT, respectively. A combined analysis of the economic and environmental benefits shows that the NEEB of RST was largest, which was 6.8%, 9.7% and 11.1% higher than those of NT, CP and RNT, respectively. At the same time, the result showed that although RST increased the GWP cost, it significantly increased the maize yield, thus achieving increases in net income and NEEB.
Under strip-till, controlled-release blended fertilizer significantly reduced GWP costs and increased Net income and NEEB. The net income and NEED values were the largest with 50%. Compared with 30%Cr and Sd, net income increased by 3.5% and 6.9%, NEEB increased by 3.8% and 7.4%. From the analysis of cost composition, it can be seen that although controlled-release blended fertilizer increases the cost of chemical fertilizer input, it reduces the cost of labor and mechanical operation. This indicates that controlled-release blended fertilizer under strip-till can increase farmers’ net income, improve the economic efficiency of maize cultivation, and reduce the environmental costs of maize production (Table 6).

4. Discussion

4.1. Effects of Different Tillage Methods on Maize Yield and Greenhouse Gas Emissions

The results of our study showed that strip-till (RST) could increase maize grain yield caused by increases in the ear number of maize. Compared with NT, CP and RNT, the maize yield of RST increased by 4.3%, 6.2% and 7.1%, respectively. This is consistent with the findings of Trevini et al. [10]. The majority of studies have reported that straw mulching increases soil water content, and the soil temperature of maize seedbed is increased by strip-till, thus increasing the maize emergence rate and promoting maize growth [11]. In addition, strip-till is beneficial to the downward growth of maize roots, promoting the absorption of water and nutrients by maize [30]. For example, Li et al. [8] indicated that residue coverage increased soil organic C and nutrients in the 0–5 cm soil layer and soil water content in 0–30 cm soil layers. In addition, we found that no tillage with straw mulching (RNT) decreased yield in maize compared with other treatments. Existing research has shown that no-tillage with 100% residue coverage can decrease maize yield due to lower soil temperature during the early stages of maize growth and delay the time of emergence and phenological period [35].
A large number of studies have shown that returning straw to the field increases the cumulative CO2 emissions from soil. However, there are differences in the results of previous studies in terms of the effects of tillage methods on N2O emissions. The meta-analysis found that soil CO2 emission under conditions of returning straw increased by 6 times compared with that without straw returning [36]. Wang et al. [37] showed that no matter what kind of straw used, the returning method would increase soil CO2 emission compared with not returning straw. Buchkina et al. [38] showed that straw return to the field provided substrates for soil microbial nitrification and denitrification, which contributed to N2O emissions from agricultural fields. Our results of this study showed that straw mulching to the field increased the flux of CO2 emission and that the difference in maximum emission flux of N2O between different tillage methods was not significant. However, straw mulching increased the cumulative emission of N2O in farmland soil. Compared with NT and CP, RST and RNT increase cumulative emissions of CO2 and N2O. Among them, compared with NT and CP, the cumulative CO2 emissions of RNT increased by 11.0% and 10.8% and the cumulative CO2 emissions of RST increased by 9.6% and 9.4% respectively. Compared with NT and CP, the cumulative N2O emissions of the RNT were increased by 5.3% and 5.8% and the cumulative N2O emissions of RST increased by 3.9% and 4.4%, respectively. The main reason for this is that straw addition will increase soil water content and produce a large amount of soluble organic carbon, stimulate the growth and respiration of soil microorganisms, and thus promote the emission of CO2 and N2O from the farmland [39,40,41]. The cumulative emissions of each treatment at different growth stages showed the largest at the jointing–silking stage. The reason may be that the jointing stage to the silking stage is a period of vigorous growth of maize, and the roots and microbial respiration are strong. In addition, the soil temperature is high and the rainfall is large during this period, which accelerates the decomposition of farmland straw and the nitrification and denitrification of soil, resulting in an increase in the cumulative emissions of CO2 and N2O [42,43].
CH4 uptake or emission in soil is affected by soil tillage, fertilization, rainfall and other factors, and is determined by the redox dynamics of CH4 via methane-oxidizing and methanogenic bacteria in the soil, and dryland soils are a sink for CH4 [44]. In this study, the change trend of CH4 uptake flux between different tillage methods was basically the same. There was no significant difference in the maximum absorption flux between the treatments during the growth period of maize, and the cumulative absorption amount of the straw-mulching treatment (RST and RNT) was slightly lower than that of other treatments, which did not reach a significant variance. This is consistent with the findings of Zhang et al. [45]. To analyze the reason for this, microorganisms decompose under the straw mulch the straw to compete for oxygen in the soil and inhibit the respiration of methane-oxidizing bacteria, leading to a decrease in the rate of methane oxidation and a reduction in methane uptake. Many scholars have studied and analyzed the effect of CH4 gas emissions from agricultural fields under nitrogen application, but there are no uniform results [46].

4.2. Effects of Different Fertilization Modes on Maize Yield and Greenhouse Gas Emissions under Strip-Till

Controlled-release blended fertilizer can solve the problem of delayed nitrogen release caused by low temperatures. The results showed that, compared with the fractional application of common urea, controlled-release blended fertilizer significantly increased the yield of maize by 4.0–21.0% and wheat by 4.8–16.8%, respectively. The blended application of nitrogen, reduced by 1/3, still obtained the same grain yield as full application of common urea [26]. This study found that the controlled-release blended fertilizer significantly increased maize yield under strip-till, and the yield of 50%Cr was the highest, which increased by 4% and 9.2% compared with 30%Cr and Sd, respectively. The increase in maize yield is mainly due to the increase in the kernel number per ear and thousand-kernel weight. The main reason for this result was that the release rate of controlled-release blended fertilizer was more consistent with the growth of maize, which promoted the accumulation of biomass and nitrogen before flowering and the transport of biomass and nitrogen after flowering [47].
Fertilizer application is also a major factor affecting CO2 and N2O emissions from agricultural land, and factors in fertilization practices such as type of fertilizer, application rate, and application method all affect soil CO2 and N2O emissions [48,49]. Studies have shown that nitrogen application affects soil CO2 emissions in two ways: one is by directly providing nutrients for plant and microorganism growth. Second, by affecting soil pH value, the activity of microorganisms and the synthesis and decomposition of soil organic matter are changed, so that CO2 emissions are changed [50]. Zhou et al. [51] showed that the CO2 emission of controlled-release nitrogen fertilizer, blended with normal urea treatment, was significantly lower than that of normal urea treatment. Ji et al. [49] showed that controlled-release fertilizers blended with conventional urea can slow down the release of nitrogen from fertilizers, thus reducing the emission of N2O during soil nitrification and denitrification. This study showed that under strip-till, 50%Cr and 30%Cr treatments reduced soil CO2, N2O emission fluxes and cumulative emissions compared to conventional fertilization. Compared with Sd, the cumulative CO2 emissions reduced by 2.1% and 2.3% for 50%Cr and 30%Cr, and the cumulative N2O emissions were reduced by 4.7% and 8.8%, respectively. The results also show that the N2O emission is mainly concentrated before the jointing stage of maize, which can adequately inhibit the emission of N2O caused by rainfall and the temperature rise in the middle and late stages of growth. In conclusion, compared with multiple applications of common urea, one-time application of controlled-release nitrogen fertilizer can reduce CO2 and N2O emissions in rainfed farmland and promote carbon sequestration and emission reduction under the premise of maintaining high crop yield [52].
In this study, under straw mulching, the CH4 uptake fluxes in maize farmland with different nitrogen application modes were negative and the variance between treatments was not significant, and the cumulative CH4 uptake of controlled-release blended fertilizer was slightly lower than that of conventional fertilizer. This might be due to the fact that the conventional fertilizer treatment increased the number of mechanical operations and disturbed the farmland more, which inhibited the formation of anaerobic conditions in the farmland [53].

4.3. Analysis of Economic and Environmental Benefits of Different Tillage Methods

Greenhouse gas intensity (GHGI) can provide a scientific and comprehensive theoretical basis for evaluating the sustainable development of agriculture [54]. In this study, although RST increased greenhouse gas emissions and global warming potential, it also increased maize grain yield, so the GHGI difference between RST and NT and CP was not significant. This suggests that increasing crop yield is an effective measure to reduce GHGI [55].
In terms of economic benefits, RST significantly increased maize yield, and thus increased net income by 7.0%, 9.7% and 10.0%, respectively, compared with NT, CP and RNT treatments. Farmland economic benefit analysis often focuses on yield profit and input cost, but neglects the relationship between economic benefit and environmental impact [56]. The net ecosystem economic budget is determined by yield benefit, planting cost and GWP cost, and the environmental and economic benefits are comprehensively analyzed [34]. In this study, NEEB was determined by maize yield gains, agricultural inputs, and GWP costs, enabling an accurate and comprehensive assessment of the economic viability and environmental sustainability of different tillage and fertilization treatments. The NEEB of RST was the largest among the different tillage patterns, which was 6.8%, 9.7% and 11.0% higher than NT, CP and RNT, respectively. Although RST increased GWP costs, it also significantly enhanced maize yield, resulting in an increase in net income and NEEB.

4.4. Analysis of Economic and Environmental Benefits of Different fertilization Modes under Strip-Till

Under strip-till, 50%Cr and 30%Cr reduced GWP by 2.5% and 2.4% and GHGI by 10.4% and 7.3%, respectively, compared with Sd. It suggests that 50%Cr reduces greenhouse gas emissions by promoting efficient nitrogen utilization. This is consistent with the findings of Velthof et al. [57].
In terms of economic benefits, although 50%Cr and 30%Cr increased the cost of chemical fertilizer input, they reduced the cost of labor and mechanical operation, and significantly increased the yield of maize. Among these outcomes, the net income of 50%Cr treatment was the largest, which increased by 6.7% compared with Sd, which was consistent with the research of Yao et al. [27]. The use of 50%Cr increased the yield benefit and reduced the GWP cost, thus increasing the NEEB. The NEEB of 50%Cr increased by 3.8% and 7.4% compared with 30%Cr and Sd. Overall, these findings specified that the combination of strip-till and controlled-release blended fertilizer (ratio 5:5) is a possible management method for obtaining the economic and environmental benefits of maize production in the hilly region of northeast China.

5. Conclusions

Taken together, our results showed that returning straw to fields could increase cumulative CO2, N2O emissions, and GWP. Compared with RNT, strip-tillage have lower greenhouse gas emissions and GHGI, as well as higher maize grain yield caused by an increase in the ear number of maize. Strip-tillage has highest net income and NEEB, with values that were 7.0–10.0% and 6.8–11.0% higher than those of other treatments, respectively. This suggests that strip-tillage is an effective measure to improve maize yield and balance GHGI. Under strip-till, 50%Cr increased maize yield, the net income and NEEB by 4.0–9.2%, 3.5–6.9% and 3.8–7.4%, respectively, while GWP and GHGI reduced compared with 30%Cr and Sd. Therefore, the use of strip-till and controlled-release nitrogen fertilizer blended with normal urea 5:5 (50%Cr) can be applied as an effective strategy to improve maize yield and economic efficiency, while reducing environmental costs in the hilly region of northeast China.

Author Contributions

Formal analysis, Writing—original draft preparation, Z.C. and L.B.; Methodology, Z.W. (Zhen Wang); Conceptualization, H.L. and F.W.; Software, M.R. and Y.W. (Yukai Wang); Investigation, Z.C., H.L. and Y.W. (Yongqiang Wang); Data curation, Z.C.; Writing—review and editing, Z.W. (Zhigang Wang) and L.B.; Funding acquisition, Z.W. (Zhigang Wang). All authors have read and agreed to the published version of the manuscript.

Funding

This study was supported by the following funding sources: National Key Research and Development Program projects (2022YFD1500902-4); National Natural Science Foundation of China (32160507); Inner Mongolia Autonomous Region Key R&D and Achievement Transformation Project (2022YFDZ0041); Inner Mongolia Agricultural University high-level/excellent doctoral talent introduction scientific research start-up project (NDY B 2022-10).

Data Availability Statement

The data reported in this study are contained within the article.

Conflicts of Interest

The authors declare that they have no conflicts of interest.

References

  1. Wang, X.L.; Chen, Y.; Yang, K.P.; Duan, F.Y.; Liu, P.; Wang, Z.G.; Wang, J.W. Effects of legume intercropping and nitrogen input on net greenhouse gas balances, intensity, carbon footprint and crop productivity in sweet maize cropland in south China. J. Clean. Prod. 2021, 314, 127997. [Google Scholar] [CrossRef]
  2. IPCC. Climate Change 2013: The Physical Science Basis [EB/OL]. IPCC, [2022-10-08]. Available online: https://www.globalchange.gov/browse/reports/ipcc-climate-change-2013-physical-science-basis (accessed on 20 October 2022).
  3. Dong, H.M.; Li, Y.E.; Tao, X.P.; Peng, X.P. China greenhouse gas emissions from agricultural activities and its mitigation strategy. Chin. Trans. CSAE 2008, 24, 269–273. (In Chinese) [Google Scholar]
  4. Tan, Y.C.; Xu, C.; Liu, D.X.; Wu, W.L.; Lal, R.T.; Meng, F.Q. Effects of optimized n fertilization on greenhouse gas emission and crop production in the north China plain. Field Crops Res. 2017, 205, 135–146. [Google Scholar] [CrossRef]
  5. Wang, X.B.; Cai, D.X.; Hoogmoed, W.B.; Oenema, O. Regional distribution of nitrogen fertilizer uses and n-saving potential for improvement of food production and nitrogen use efficiency in China. J. Sci. Food Agric. 2011, 91, 2013–2023. [Google Scholar] [CrossRef] [PubMed]
  6. Van Kessel, C.; Venterea, R.; Six, J.; Adviento-Borbe, M.A.; Linquist, B.; van Groenigen, K.J. Climate, duration, and N placement determine N2O emissions in reduced tillage systems: A meta-analysis. Glob. Chang. Biol. 2013, 19, 33–44. [Google Scholar] [CrossRef] [PubMed]
  7. Zhang, S.; Lovdahl, L.; Grip, H.; Jansson, P.E.; Tong, Y. Modelling the effects of mulching and fallow cropping on water balance in the Chinese Loess Plateau. Soil Tillage Res. 2007, 93, 283–298. [Google Scholar] [CrossRef]
  8. Li, R.P.; Zheng, J.Y.; Xie, R.Z.; Ming, B.; Peng, X.H.; Li, S.K. Potential mechanisms of maize yield reduction under short-term no-tillage combined with residue coverage in the semi-humid region of Northeast China. Soil Tillage Res. 2022, 217, 105289. [Google Scholar] [CrossRef]
  9. Chen, Y.; Liu, S.; Li, H.; Li, X.F.; Song, C.Y.; Cruse, R.M.; Zhang, X.Y. Effects of conservation tillage on corn and soybean yield in the humid continental climate region of northeast China. Soil Tillage Res. 2011, 115, 56–61. [Google Scholar] [CrossRef]
  10. Trevini, M.; Benincasa, P.; Guiducci, M. Strip tillage effect on seedbed tilth and maize production in northern Italy as case-study for the southern Europe environment. Eur. J. Agron. 2013, 48, 50–56. [Google Scholar] [CrossRef]
  11. Licht, M.A.; Al-Kaisi, M. Strip-tillage effect on seedbed soil temperature and other soil physical properties. Soil Tillage Res. 2005, 80, 233–249. [Google Scholar] [CrossRef]
  12. Liu, J.L.; Zhu, L.; Luo, S.S.; Bu, L.D.; Chen, X.P. Response of nitrous oxide emission to soil mulching and nitrogen fertilization in semi-arid farmland. Agric. Ecosyst. Environ. 2014, 188, 20–28. [Google Scholar] [CrossRef]
  13. Smith, P.; Martino, D.; Cai, Z.; Gwary, D.; Janzen, H.; Kumar, P.; McCarl, B.; Ogle, S.; O’Mara, F.; Rice, C.; et al. Greenhouse gas mitigation in agriculture. Philos. Trans. R. Soc. B 2008, 363, 789–813. [Google Scholar] [CrossRef] [PubMed]
  14. Lenka, N.K.; Lal, R. Soil aggregation and greenhouse gas flux after 15 years of wheat straw and fertilizer management in a no-till system. Soil Tillage Res. 2013, 126, 78–89. [Google Scholar] [CrossRef]
  15. Cuello, J.P.; Hwang, H.Y.; Gutierrez, J.; Kim, S.Y.; Kim, P.J. Impact of plastic film mulching on increasing greenhouse gas emissions in temperate upland soil during maize cultivation. Appl. Soil Ecol. 2015, 91, 48–57. [Google Scholar] [CrossRef]
  16. Gao, N.; Wei, Y.; Zhang, W.W.; Yang, B.; Shen, Y. Carbon footprint, yield and economic performance assessment of different mulching strategies in a semi-arid spring maize system. Sci. Total Environ. 2022, 826, 154021. [Google Scholar] [CrossRef] [PubMed]
  17. Jarecki, M.K.; Parkin, T.B.; Chan, A.S.K.; Kaspar, T.C. Cover crop effects on nitrous oxide emission from a manure-treated mollisol. Agric. Ecosyst. Environ. 2009, 134, 29–35. [Google Scholar] [CrossRef]
  18. Wang, L.; Li, X.; Guan, Z.; Jia, B.; Turner, N. The effects of plastic-film mulch on the grain yield and root biomass of maize vary with cultivar in a cold semiarid environment. Field Crops Res. 2018, 216, 89–99. [Google Scholar] [CrossRef]
  19. Kuypers, M.M.; Marchant, H.K.; Kartal, B. The microbial nitrogen-cycling network. Nat. Rev. Microbiol. 2018, 16, 263–276. [Google Scholar] [CrossRef]
  20. Prosser, J.I.; Hink, L.; Gubry-Rangin, C.; Nicol, G.W. Nitrous oxide production by ammonia oxidizers: Physiological diversity, niche differentiation and potential mitigation strategies. Glob. Chang. Biol. 2020, 26, 103–118. [Google Scholar] [CrossRef]
  21. Wang, H.; Köbke, S.; Dittert, K. Use of urease and nitrification inhibitors to reduce gaseous nitrogen emissions from fertilizers containing ammonium nitrate and urea-science Direct. Glob. Ecol. Conserv. 2020, 22, e00933. [Google Scholar]
  22. Zhang, W.S.; Liang, Z.Y.; He, X.M.; Wang, X.Z.; Shi, X.J.; Zou, C.Q.; Chen, X.P. The effects of controlled release urea on maize productivity and reactive nitrogen losses: A meta-analysis. Environ. Pollut. 2019, 246, 559–565. [Google Scholar] [CrossRef] [PubMed]
  23. Halvorson, A.D.; Grosso, S.J.D.; Alluvione, F. Nitrogen source effects on nitrous oxide emissions from irrigated no-till corn. J. Environ. Qual. 2010, 39, 1554–1562. [Google Scholar] [CrossRef] [PubMed]
  24. Guo, L.W.; Ning, T.Y.; Nie, L.P.; Li, Z.J.; Lal, R. Interaction of deep placed controlled-release urea and water retention agent on nitrogen and water use and maize yield. Eur. J. Agron. 2016, 75, 118–129. [Google Scholar] [CrossRef]
  25. Zhang, J.J.; Dang, Y.; Fan, T.L.; Zhao, G.; Wang, Y.; Wang, L. Effect on growth and development, yield and water use efficiency of winter wheat through controlled-release urea base and common urea with split application in loess plateau east of Gansu. Chin. J. Nucl. Agric. Sci. 2014, 28, 912–918. (In Chinese) [Google Scholar]
  26. Zheng, W.K.; Zhang, M.; Liu, Z.G.; Zhou, H.Y.; Chen, B.C. Combining controlled-release urea and normal urea to improve the nitrogen use efficiency and yield under wheat-maize double cropping system. Field Crops Res. 2016, 197, 52–62. [Google Scholar] [CrossRef]
  27. Yao, Z.; Zhang, W.S.; Wang, X.B.; Zhang, L.; Zhang, W.; Liu, D.Y.; Chen, X.P. Agronomic, environmental, and ecosystem economic benefits of controlled-release nitrogen fertilizers for maize production in southwest China. J. Clean. Prod. 2021, 312, 127611. [Google Scholar] [CrossRef]
  28. Zhang, L.; Liang, Z.Y.; Hu, Y.C.; Schmidhalter, U.; Zhang, W.S.; Ruan, S.Y.; Chen, X.P. Integrated assessment of agronomic, environmental and ecosystem economic benefits of blending use of controlled-release and common urea in wheat production. J. Clean. Prod. 2020, 287, 125572. [Google Scholar] [CrossRef]
  29. Li, B.; Fan, C.H.; Zhang, H.; Chen, Z.Z.; Sun, L.Y.; Xiong, Z.Q. Combined effects of nitrogen fertilization and biochar on the net global warming potential, greenhouse gas intensity and net ecosystem economic budget in intensive vegetable agriculture in southeastern China. Atmos. Environ. 2015, 100, 10–19. [Google Scholar] [CrossRef]
  30. Sha, Y.; Liu, Z.; Hao, Z.H.; Huang, Y.W.; Shao, H.; Feng, G.Z.; Chen, F.J.; Mi, G.H. Root growth, root senescence and root system architecture in maize under conservative strip tillage system. Plant Soil 2023. [Google Scholar] [CrossRef]
  31. Cha-un, N.; Chidthaisong, A.; Yagi, K.; Sudo, S. Greenhouse gas emissions, soil carbon sequestration and crop yield in a rain-fed field with crop rotation management. Agric. Ecosyst. Environ. 2017, 237, 109–120. [Google Scholar] [CrossRef]
  32. Zhang, Z.S.; Guo, L.J.; Liu, T.Q.; Li, C.F.; Cao, C.G. Effects of tillage practices and straw returning methods on greenhouse gas emissions and net ecosystem economic budget in rice–wheat cropping systems in central China. Atmos. Environ. 2015, 122, 636–644. [Google Scholar] [CrossRef]
  33. Lee, H.H.; Kim, S.U.; Han, H.R.; Hur, D.Y.; Hong, C.O. Mitigation of global warming potential and greenhouse gas intensity in arable soil with green manure as source of nitrogen. Environ. Pollut. 2021, 288, 117724. [Google Scholar] [CrossRef] [PubMed]
  34. Zheng, J.; Fan, J.; Zhang, F.; Guo, J.; Yan, S.; Zhuang, Q.; Cui, N.; Guo, L. Interactive effects of mulching practice and nitrogen rate on grain yield, water productivity, fertilizer use efficiency and greenhouse gas emissions of rainfed summer maize in northwest China. Agric. Water Manag. 2021, 248, 106778. [Google Scholar] [CrossRef]
  35. Li, R.; Hou, X.Q.; Jia, Z.K.; Han, Q.F.; Ren, X.L.; Yang, B.P. Effects on soil temperature, moisture, and maize yield of cultivation with ridge and furrow mulching in the rainfed area of the Loess Plateau, China. Agric. Water Manag 2013, 116, 101–109. [Google Scholar] [CrossRef]
  36. Lehtinen, T.; Schlatter, N.; Baumgarten, A.; Bechini, L.; Krüger, J.; Grignani, C.; Zavattaro, L.; Costamagna, C.; Spiegel, H. Effect of crop residue incorporation on soil organic carbon and greenhouse gas emissions in European agricultural soils. Soil Use Manag. 2014, 30, 524–538. [Google Scholar] [CrossRef]
  37. Wang, H.H.; Shen, M.X.; Hui, D.F.; Chen, J. Straw incorporation influences soil organic carbon sequestration, greenhouse gas emission, and crop yields in a Chinese rice (Oryza sativa L.)–wheat (Triticum aestivum L.) cropping system. Soil Tillage Res. 2019, 195, 104377. [Google Scholar] [CrossRef]
  38. Buchkina, N.P.; Balashov, E.V.; Rizhiya, E.Y.; Smith, K.A. Nitrous oxide emissions from a light-textured arable soil of north-western Russia: Effects of crops, fertilizers, manures and climate parameters. Nutr. Cycl. Agroecosystems 2010, 87, 429–442. [Google Scholar] [CrossRef]
  39. Qi, J.Y.; Jing, Z.H.; He, C.; Liu, Q.Y.; Zhang, H.L. Effects of tillage management on soil carbon decomposition and its relationship with soil chemistry properties in rice paddy fields. J. Environ. Manag. 2021, 279, 111595. [Google Scholar] [CrossRef]
  40. Zhu, Z.; Ge, T.; Luo, Y.; Liu, S.; Xu, X.; Tong, C. Microbial stoichiometric flexibility regulates rice straw mineralization and its priming effect in paddy soil. Soil Biol. Biochem. 2018, 121, 67–76. [Google Scholar] [CrossRef]
  41. Chen, H.X.; Liu, J.J.; Zhang, A.; Chen, J.; Cheng, G.; Sun, B.H.; Feng, H. Effects of straw and plastic film mulching on greenhouse gas emissions in Loess Plateau, China: A field study of consecutive wheat-maize rotation cycles. Sci. Total Environ. 2016, 579, 814–824. [Google Scholar] [CrossRef]
  42. Li, X.H.; Zhu, Z.L.; Dong, H.Y.; Yang, L.P.; Guo, H.H. Characteristics of Greenhouse Gas Emissions from the Wheat Fields with Different Returning Methods of Maize Straws. Chin. J. Agric. Resour. Environ. 2016, 33, 176–181. (In Chinese) [Google Scholar]
  43. Baggs, E.M.; Stevenson, M.; Pihlatie, M.; Regar, A.; Cook, H.; Cadisch, G. Nitrous oxide emissions following application of residues and fertiliser under zero and conventional tillage. Plant Soil 2003, 254, 361–370. [Google Scholar] [CrossRef]
  44. Dalal, R.C.; Allen, D.E.; Livesley, S.J. Magnitude and biophysical regulators of methane emission and consumption in the Australian agricultural, forest, and submerged landscapes: A review. Plant Soil 2008, 309, 43–76. [Google Scholar] [CrossRef]
  45. Zhang, X.S.; Shen, S.H.; Li, J.; Yu, Q. Soil CH4 uptake in winter wheat field in the North China Plain. Chin. J. Nanjing Inst. Meteorol. 2006, 2, 181–188. (In Chinese) [Google Scholar]
  46. Bodelier, P.L.E.; Laanbroek, H.J. Nitrogen as a regulatory factor of methane oxidation in soils and sediments. FEMS Microbiol. Ecol. 2004, 47, 265–277. [Google Scholar] [CrossRef]
  47. Ciampitti, I.A.; Vyn, T.J. Physiological perspectives of changes over time in maize yield dependency on nitrogen uptake and associated nitrogen efficiencies: A review. Field Crops Res. 2012, 133, 48–67. [Google Scholar] [CrossRef]
  48. Royer, I.; Angers, D.A.; Chantigny, M.H.; Simard, R.R.; Cluis, D. Dissolved organic carbon in runoff and tile-drain water under corn and forage fertilized with hog manure. J. Environ. Qual. 2007, 36, 855. [Google Scholar] [CrossRef]
  49. Ji, Y.; Zhang, X.Y.; Ma, J.; Li, X.P. Effects of applying controlled-release fertilizer and its combination with urea on nitrous oxide emission during rice growth period. Chin. Chin. J. Appl. Ecol. 2011, 22, 2031–2037. (In Chinese) [Google Scholar]
  50. Snyder, C.S.; Bruulsema, T.W.; Jensen, T.L. Review of greenhouse gas emissions from crop production systems and fertilizer management effects. Agric. Ecosyst. Environ. 2009, 133, 247–266. [Google Scholar] [CrossRef]
  51. Zhou, J.X.; Zhai, X.F.; Sun, H.R.; Tang, L.; Sheng, Y.F. Effects of controlled-release urea on CO2 emission from dry farmland under different mulching patterns. Chin. J. Agro-Environ. Sci. 2019, 8, 2429–2438. (In Chinese) [Google Scholar]
  52. Guo, J.M.; Wang, Y.H.; Blaylock, A.D.; Chen, X.P. Mixture of controlled release and normal urea to optimize nitrogen management for high-yielding (>15 Mg ha−1) maize. Field Crops Res. 2017, 204, 23–30. [Google Scholar] [CrossRef]
  53. Yang, R.; Zhang, J.; Fan, J.L.; Zhang, K.B.; Liao, Z.Q. Effects of different film mulching methods on greenhouse gas emissions and yield of dryland summer maize. Chin. Agric. Res. Arid Areas 2020, 38, 285–292+302. (In Chinese) [Google Scholar]
  54. Ghimire, R.; Norton, U.; Bista, P.; Obour, A.K.; Norton, J.B. Soil organic matter, greenhouse gases and net global warming potential of irrigated conventional, reduced-tillage and organic cropping systems. Nutr. Cycl. Agroecosystems 2017, 107, 49–62. [Google Scholar] [CrossRef]
  55. Zhang, S.H.; Wang, J.; Fang, Z.W.; Fu, X. Effect of winter cover cropping on soil greenhouse gas emissions in a dryland spring maize field on the loess plateau of China. Chin. Environ. Sci. 2022, 43, 4848–4857. (In Chinese) [Google Scholar]
  56. Li, C.J.; Xiong, Y.W.; Huang, Q.Z.; Xu, X.; Huang, G.H. Impact of irrigation and fertilization regimes on greenhouse gas emissions from soil of mulching cultivated maize (Zea mays L.) field in the upper reaches of Yellow River. J. Clean. Prod. 2020, 259, 120873. [Google Scholar] [CrossRef]
  57. Velthof, G.L.; Oenema, O.; Postma, R.; Beusichem, M.L.V. Effects of type and amount of applied nitrogen fertilizer on nitrous oxide fluxes from intensively managed grassland. Nutr. Cycl. Agroecosystems 1996, 46, 257–267. [Google Scholar] [CrossRef]
Figure 1. Dynamics of CO2 emissions fluxes (mean ± SD) during the 2021 and 2022 maize growing seasons in different tillage methods. CP: Conventional ridge cropping. NT: Straw off-field no-tillage. RNT: No-tillage with straw mulching. RST: Strip-till.
Agronomy 14 00136 g001
Figure 2. Dynamics of CO2 emissions fluxes (mean ± SD) during the 2021 and 2022 maize growing seasons in different fertilization modes. Sd: Conventional fertilization. 50%Cr: Controlled-release nitrogen fertilizer blended with normal urea 5:5. 30%Cr: Controlled-release nitrogen fertilizer blended with normal urea 3:7. 0 N: Nitrogen-free zone.
Agronomy 14 00136 g002
Figure 3. Dynamics of CO2 cumulative emissions (mean ± SD) during the 2021 and 2022 maize growing seasons in different tillage methods. CP: Conventional ridge cropping. NT: Straw off-field no-tillage. RNT: No-tillage with straw mulching. RST: Strip-till. Significant differences (p < 0.05) among treatments are presented by different lowercase letters.
Agronomy 14 00136 g003
Figure 4. Dynamics of CO2 cumulative emissions (mean ± SD) during the 2021 and 2022 maize growing seasons in different fertilization modes. Sd: Conventional fertilization. 50%Cr: Controlled-release nitrogen fertilizer blended with normal urea 5:5. 30%Cr: Controlled-release nitrogen fertilizer blended with normal urea 3:7. 0 N: Nitrogen-free zone. Significant differences (p < 0.05) among treatments are presented by different lowercase letters.
Agronomy 14 00136 g004
Figure 5. Dynamics of N2O emissions fluxes (mean ± SD) during the 2021 and 2022 maize growing seasons in tillage methods. CP: Conventional ridge cropping. NT: Straw off-field no-tillage. RNT: No-tillage with straw mulching. RST: Strip-till.
Agronomy 14 00136 g005
Figure 6. Dynamics of N2O emissions fluxes (mean ± SD) during the 2021 and 2022 maize growing seasons in different fertilization modes. Sd: Conventional fertilization. 50%Cr: Controlled-release nitrogen fertilizer blended with normal urea 5:5. 30%Cr: Controlled-release nitrogen fertilizer blended with normal urea 3:7. 0 N: Nitrogen-free zone.
Agronomy 14 00136 g006
Figure 7. Dynamics of N2O cumulative emissions (mean ± SD) during the 2021 and 2022 maize growing seasons in different tillage methods. CP: Conventional ridge cropping. NT: Straw off-field no-tillage. RNT: No-tillage with straw mulching. RST: Strip-till. Significant differences (p < 0.05) among treatments are presented by different lowercase letters.
Agronomy 14 00136 g007
Figure 8. Dynamics of N2O cumulative emissions (mean ± SD) during the 2021 and 2022 maize growing seasons in different fertilization modes. Sd: Conventional fertilization. 50%Cr: Controlled-release nitrogen fertilizer blended with normal urea 5:5. 30%Cr: Controlled-release nitrogen fertilizer blended with normal urea 3:7. 0 N: Nitrogen-free zone. Significant differences (p < 0.05) among treatments are presented by different lowercase letters.
Agronomy 14 00136 g008
Figure 9. Dynamics of CH4 emissions fluxes (mean ± SD) during the 2021 and 2022 maize growing seasons in different tillage methods. CP: Conventional ridge cropping. NT: Straw off-field no-tillage. RNT: No-tillage with straw mulching. RST: Strip-till.
Agronomy 14 00136 g009
Figure 10. Dynamics of CH4 emissions fluxes (mean ± SD) during the 2021 and 2022 maize growing seasons in different fertilization modes. Sd: Conventional fertilization. 50%Cr: Controlled-release nitrogen fertilizer blended with normal urea 5:5. 30%Cr: Controlled-release nitrogen fertilizer blended with normal urea 3:7. 0 N: Nitrogen-free zone.
Agronomy 14 00136 g010
Figure 11. Dynamics of CH4 cumulative uptake (mean ± SD) during the 2021 and 2022 maize growing seasons in different tillage methods. CP: Conventional ridge cropping. NT: Straw off-field no-tillage. RNT: No-tillage with straw mulching. RST: Strip-till. Significant differences (p < 0.05) among treatments are presented by different lowercase letters.
Agronomy 14 00136 g011
Figure 12. Dynamics of CH4 cumulative uptake (mean ± SD) during the 2021 and 2022 maize growing seasons in different fertilization modes. 50%Cr: Controlled-release nitrogen fertilizer blended with normal urea 5:5. 30%Cr: Controlled-release nitrogen fertilizer blended with normal urea 3:7. 0 N: Nitrogen-free zone. Significant differences (p < 0.05) among treatments are presented by different lowercase letters.
Agronomy 14 00136 g012
Table 1. Effects of different tillage methods on maize yield and yield components.
YearTreatmentsEar Number (Ears m−2)Kernel Number per EarThousand-Kernel Weight (g)Grain Yield (Mg ha−1)
2021CP6.62 ± 0.15 b591.87 ± 2.55 ab297.78 ± 2.13 a11.70 ± 0.17 b
NT7.07 ± 0.13 a578.13 ± 1.32 c291.74 ± 1.25 a11.93 ± 0.22 ab
RNT6.64 ± 0.06 b596.40 ± 3.65 a291.22 ± 1.35 a11.49 ± 0.19 b
RST7.05 ± 0.08 a586.53 ± 3.12 b296.38 ± 1.56 a12.25 ± 0.24 a
2022CP6.25 ± 0.13 c600.45 ± 4.31 b279.07 ± 3.17 ab10.93 ± 0.15 b
NT6.63 ± 0.15 b610.32 ± 5.65 b275.86 ± 2.56 b11.10 ± 0.17 b
RNT6.38 ± 0.08 c620.66 ± 3.89 a284.07 ± 1.89 a10.89 ± 0.25 b
RST6.91 ± 0.11 a618.73 ± 1.65 a277.16 ± 3.21 b11.74 ± 0.21 a
Source of variation
Year (Y)ns*****
Tillage method (T)***ns**
Y × T******
CP: Conventional ridge cropping. NT: Straw off-field no-tillage. RNT: No-tillage with straw mulching. RST: Strip-till. Standard errors are presented after “±”. Different small letters after the data in a column indicate significant variance among treatments in the same year (p < 0.05). **, p < 0.01; *, p < 0.05; ns, not significant variance.
Table 2. Effects of different fertilization modes on maize yield and yield components.
YearTreatmentsEar Number
(Ears m−2)
Kernel Number per EarThousand-Kernel Weight (g)Grain Yield (Mg ha−1)
2021Sd7.05 ± 0.11 a586.53 ± 4.32 b296.38 ± 3.16 c12.25 ± 0.13 c
50%Cr7.05 ± 0.09 a600.73 ± 3.59 a 312.35 ± 3.01 a13.23 ± 0.26 a
30%Cr6.95 ± 0.05 a601.27 ± 5.12 a307.34 ± 1.12 b12.84 ± 0.11 b
0 N6.90 ± 0.12 a565.33 ± 5.56 c263.01 ± 2.98 d10.26 ± 0.27 d
2022Sd6.91 ± 0.11 a618.73 ± 2.32 b281.69 ± 2.89 a11.74 ± 0.31 b
50%Cr6.96 ± 0.15 a634.83 ± 3.46 a284.55 ± 2.36 a12.89 ± 0.32 a
30%Cr6.90 ± 0.13 a633.56 ± 4.56 a283.65 ± 2.18 a12.38 ± 0.27 ab
0 N6.63 ± 0.14 b564.53 ± 5.23 c255.59 ± 3.14 b9.43 ± 0.24 c
Source of variation
Year (Y)ns***ns
Fertilization mode (F)ns******
Y × Fns*****
Sd: Conventional fertilization. 50%Cr: Controlled-release nitrogen fertilizer blended with normal urea 5:5. 30%Cr: Controlled-release nitrogen fertilizer blended with normal urea 3:7. 0 N: Nitrogen-free zone. Standard errors are presented after “±”. Different small letters after the data in a column indicate significant variance among treatments in the same year (p < 0.05). **, p < 0.01; *, p < 0.05; ns, not significant variance.
Table 3. Effects of different tillage methods on the global warming potential and greenhouse gas intensity.
YearsTreatmentsAccumulation Emission of N2O
(kg ha−1)
N2O GWP
(kg ha−1)
Accumulation Emission of CH4
(kg ha−1)
CH4 GWP
(kg ha−1)
Accumulation Emission of CO2
(kg ha−1)
GWP
(kg ha−1)
Yield
(kg ha−1)
GHGI
(kg CO2 eq kg −1 yield)
2021CP3.42 ± 0.1 b1019.2 ± 18.4 b−1.6 ± 0.07 a−40 ± 1.5 a16,456.5 ± 56.8 c17,435.7 ± 103.4 c11,704.9 ± 170.3 b1.48 ± 0.09 b
NT3.4 ± 0.07 b1013.2 ± 19.6 b−1.6 ± 0.06 a−39.8 ± 0.9 a16,455 ± 65.3 c17,428.5 ± 55.6 c11,935.1 ± 223.2 ab1.46 ± 0.07 b
RNT3.65 ± 0.09 a1087.7 ± 12.1 a−1.6 ± 0.08 a−39.3 ± 0.3 a18,209.5 ± 80.5 a19,257.9 ± 105.6 a11,489.6 ± 192.4 b1.68 ± 0.06 a
RST3.57 ± 0.1 ab1063.9 ± 5.3 ab−1.6 ± 0.06 a−40.3 ± 0.5 a17,987 ± 85.3 b19,010.6 ± 99.5 b12,258 ± 241.2 a1.55 ± 0.1 b
2022CP3.4 ± 0.12 a 998.3 ± 15.6 a−1.7 ± 0.09 a−41.8 ± 0.7 a13,352.9 ± 63.2 c14,309.5 ± 45.3 c10,934.5 ± 151.3 b1.31 ± 0.1 b
NT3.4 ± 0.06 a1013.2 ± 19.2 a−1.6 ± 0.07 a−40.8 ± 0.8 a13,298.8 ± 55.7 c14,271.2 ± 55.7 c11,097.9 ± 172.3 b1.29 ± 0.09 b
RNT3.5 ± 0.08 a1043 ± 18.2 a−1.6 ± 0.05 a−39.8 ± 0.1 a14,823.4 ± 85.6 a15,826.4 ± 99.5 a10,890.2 ± 253.2 b1.45 ± 0.05 a
RST3.5 ± 0.1 a1040 ± 21.2 a−1.6 ± 0.04 a−40.8 ± 0.5 a14,608.6 ± 56.2 b156,07.8 ± 67.3 b11,736.2 ± 213.7 a1.33 ± 0.06 b
Source of variation
Year (Y)**nsns*****
Tillage methods (C)nsnsnsns*******
Y × T**nsns******
CP: Conventional ridge cropping. NT: Straw off-field no-tillage. RNT: No-tillage with straw mulching. RST: Strip-till. GWP: Global warming potential. GHGI: Greenhouse gas intensity. Standard errors are presented after “±”. Different small letters after the data in a column indicate significant variance among treatments in the same year (p < 0.05). **, p < 0.01; *, p < 0.05; ns, not significant variance.
Table 4. Effects of different fertilization patterns on the warming potential and intensity of greenhouse gas emissions.
YearsTreatmentsAccumulation Emission of N2O
(kg ha−1)
N2O GWP
(kg ha−1)
Accumulation Emission of CH4
(kg ha−1)
CH4 GWP
(kg ha−1)
Accumulation Emission of CO2
(kg ha−1)
GWP
(kg ha−1)
Yield
(kg ha−1)
GHGI
(kg CO2 eq kg −1 yield)
2021Sd3.57 ± 0.11 a1063.9 ± 14.3 a−1.6 ± 0.09 a−40.3 ± 2.5 a17,987 ± 85.3 a19,010.6 ± 95.5 a12,258.0 ± 263.7 c1.55 ± 0.1 a
30%Cr3.4 ± 0.05 b1013.2 ± 19.6 b−1.5 ± 0.15 a−38.5 ± 1.9 a17,536.9 ± 65.3 b18,511.6 ± 55.6 b12,841.5 ± 113.2 b1.44 ± 0.07 ab
50%Cr3.19 ± 0.09 c950.6 ± 12.3 c−1.5 ± 0.16 a−38.3 ± 2.1 a17,604.6 ± 108.5 b18,517 ± 115.6 b13,231.2 ± 272.8 a1.4 ± 0.04 c
2022Sd3.49 ± 0.1 a1040 ± 21.2 a−1.6 ± 0.09 b−40.8 ± 1.5 b14,608.6 ± 52.2 a15,607.9 ± 67.3 a11,736.2 ± 315.2 b1.33 ± 0.06 a
30%Cr3.4 ± 0.08 ab1013.2 ± 19.2 ab−1.5 ± 0.08 a−38 ± 1.8 a14,298.4 ± 56.7 b15,273.6 ± 55.7 b12,378.4 ± 272.3 ab1.23 ± 0.09 b
50%Cr3.25 ± 0.05 b968.5 ± 18.2 b−1.6 ± 0.1 a−38.8 ± 2.1 a14,299.2 ± 105.6 b15,229 ± 99.5 b12,894.3 ± 238.3 a1.18 ± 0.05 b
Source of variation
Year (Y)nsnsnsns****ns**
Fertilization modes (F)****nsns*****
Y × F**nsns******
Scheme 50. Cr: Controlled-release nitrogen fertilizer blended with normal urea 5:5. 30%Cr: Controlled-release nitrogen fertilizer blended with normal urea 3:7. 0 N: Nitrogen-free zone. GWP: Global warming potential. GHGI: Greenhouse gas intensity. Standard errors are presented after “±”. Different small letters after the data in a column indicate significant variance among treatments in the same year (p < 0.05). **, p < 0.01; *, p < 0.05; ns, not significant variance.
Table 5. Analysis of economic and environmental benefits of different tillage methods.
TreatmentSeed Cost
(CNY ha−1)
Fertilizer Cost
(CNY ha−1)
Pesticide Cost
(CNY ha−1)
Labor Cost
(CNY ha−1)
Mechanical Operation Cost
(CNY ha−1)
GWP Cost
(CNY ha−1)
Production Income
(CNY ha−1)
Net Income
(CNY ha−1)
NEEB
(CNY ha−1)
CP10201506450157.59301646 ± 35.2 b26,035.3 ± 123.2 c21,971.8 ± 192.1 c20,325.8 ± 196.1 b
NT102015064501358551643.6 ± 45.2 b26,488 ± 163.2 b22,522 ± 164.3 b 20,878.4 ± 143.6 c
RNT10201506450907651819.1 ± 35.8 a25,736.8 ± 147.3 d21,905.8 ± 169.7 c20,086.7 ± 196.2 c
RST10201506450108.88401795 ± 22.4 a28,012.3 ± 182.2 a24,087.5 ± 156.8 a22,292.5 ± 189.4 a
CP: Conventional ridge cropping. NT: Straw off-field no-tillage. RNT: No-tillage with straw mulching. RST: Strip-till. NEEB: Net income and net ecosystem economic budget. Standard errors are presented after “±”. Different small letters after the data in a column indicate significant variance among treatments in the same year (p < 0.05).
Table 6. Analysis of economic and environmental benefits of different fertilization modes.
TreatmentSeed Cost
(CNY ha−1)
Fertilizer Cost
(CNY ha−1)
Pesticide Cost
(CNY ha−1)
Labor Cost
(CNY ha−1)
Mechanical Operation Cost
(CNY ha−1)
GWP Cost
(CNY ha−1)
Production Income
(CNY ha−1)
Net Income
(CNY ha−1)
NEEB
(CNY ha−1)
Sd10201506450108.88401795 ± 22.4 a28,012.3 ± 182.2 c24,087.5 ± 156.8 c22,292.5 ± 189.4 c
30%Cr1020177045086.37951751.8 ± 25.8 ab29,002.8 ± 146.2 b24,881.5 ± 180.3 b23,129.7 ± 165.8 b
50%Cr1020195045086.37951749.3 ± 20.3 b30,044.3 ± 150.3 a25,743 ± 123.4 a23,993.7 ± 153.2 a
Sd: Conventional fertilization. 50%Cr: Controlled-release nitrogen fertilizer blended with normal urea 5:5. 30%Cr: Controlled-release nitrogen fertilizer blended with normal urea 3:7. 0 N: Nitrogen-free zone. NEEB: Net income and net ecosystem economic budget. Standard errors are presented after “±”. Different small letters after the data in a column indicate significant variance among treatments in the same year (p < 0.05).
Disclaimer/Publisher’s Note: The statements, opinions and data contained in all publications are solely those of the individual author(s) and contributor(s) and not of MDPI and/or the editor(s). MDPI and/or the editor(s) disclaim responsibility for any injury to people or property resulting from any ideas, methods, instructions or products referred to in the content.

