Article

WheatSM V5.0: A Python-Based Wheat Growth and Development Simulation Model with Cloud Services Integration to Enhance Agricultural Applications

1
College of Agriculture, Fujian Agriculture and Forestry University, Fuzhou 350002, China
2
College of Resources and Environmental Sciences, China Agricultural University, Beijing 100193, China
3
Institute of Environment and Sustainable Development in Agriculture, Chinese Academy of Agricultural Sciences, Beijing 100081, China
4
Beijing Fuse Technology Co., Ltd., Beijing 100193, China
*
Author to whom correspondence should be addressed.
These authors contributed equally to this work.
Agronomy 2023, 13(9), 2411; https://doi.org/10.3390/agronomy13092411
Submission received: 8 August 2023 / Revised: 4 September 2023 / Accepted: 12 September 2023 / Published: 19 September 2023
(This article belongs to the Section Precision and Digital Agriculture)

Abstract

:
This project aims to improve the wheat growth and development simulation model (WheatSM) V4.0, a renowned wheat model, by addressing limitations in its structure and modules. The WheatSM V4.0 excelled numerically but lacked modularity, hindering maintenance, improvement, and secondary development. Therefore, the project undertook a software framework redesign, adopting a modular approach and implementing WheatSM V5.0 entirely in Python. Furthermore, the project conducted a sensitivity analysis of model parameters. Additionally, WheatSM V5.0 was seamlessly integrated into AgroStudio, an agricultural model system integration platform, enabling the provision of online cloud services. The Morris analysis indicated that photoperiod parameters significantly impacted the jointing and mature stages. Furthermore, biomass was highly sensitive to pmax (the maximum photosynthetic intensity at light saturation point), while yield was influenced by tr1 (the transfer rate of photosynthate to grain before heading). The simulated results demonstrated favorable performance in soil water storage, soil nitrate nitrogen content, winter wheat nitrogen accumulation, the development period, biomass, and yield. The NRMSE ranged from 1.2% to 15.1% for calibration and 1.0% to 18.7% for validation. The project successfully transformed WheatSM into a cloud-based service on AgroStudio, migrating from a PC-based application. Generally, this enhanced model exhibits potential for climate change assessment, wheat production optimization, and digital design.

1. Introduction

Wheat, as the third-largest crop, plays a crucial role in ensuring global food security worldwide. An estimated 35–40% of the global population relies on wheat as a primary dietary staple, highlighting the crucial relationship between the consistent production and supply of wheat and the stability of worldwide food security [1]. Beyond its substantial yield, wheat is vitally important for its nutritional contributions, serving as a significant source of protein and energy for the global populace [2]. China, being the largest wheat producer, experiences fluctuations in wheat production that directly impact national food security. However, the fluctuation of wheat production, the escalation of wheat price volatility, and economic inequality have occurred under a scenario of a 2 °C increase in global temperature [3]. Therefore, simulating wheat growth and development is essential for increasing wheat production to meet food demands.
The growth and development of wheat are influenced by various factors such as meteorology, soil conditions, cultivars, management practices, and their interactions. Wheat growth models serve as valuable tools in understanding the dynamics of wheat growth and development processes, facilitating management decision-making [4], identifying key impact factors [5], assessing risks [6], and optimizing resource allocation [7]. Importantly, they also contribute to the environmental sustainability of the production system by developing efficient and sustainable farming practices [8,9,10]. Generally, the development of a simulation model is not only significant for improving food security but also for promoting the sustainable utilization of environmental resources.
Since 1992, Liping Feng and his team at China Agricultural University have focused on exploring the relationship between the growth and development of wheat and the main environmental factors (temperature, light, and soil) based on extensive data collection and analysis from field experiments and artificial control experiments. They have established functional modules for various aspects of wheat growth and development, including developmental stage dynamics, leaf age dynamics, stem aspiration dynamics, organ formation, photosynthetic production, assimilation distribution, yield formation, as well as modules for soil water balance and nitrogen balance [11]. By connecting and assembling these modules through software development and program implementation, the wheat growth and development simulation model (WheatSM) has been developed. WheatSM is the first wheat simulation model in China with independent intellectual property rights, enabling the process and dynamic simulations of wheat growth and development [11,12]. Over time, the WheatSM model has continuously evolved, with the current version being V4.0. Its main functions include daily and hourly growth simulations [13], regional multi-point simulations [14], and automatic parameter adjustment [15], etc. The accuracy of WheatSM has been effectively verified across multiple regions and years, with simulated growth and development periods, biomass, yield, and soil moisture dynamics falling within reasonable error ranges. Currently, the successful establishment of a wheat management system has allowed for the effective management of wheat production. Gao et al. developed the Wheat Cultivational Simulation-Optimization-Decision Making System (WCSODS), which is based on the WheatSM model, and applied it to production management practice [16]. Notably, WheatSM performed with high simulation accuracy and has been extensively applied in national and provincial agro-meteorological services. Li et al. optimized WheatSM parameters using the EFAST method and SCE-UA algorithm [17]. Guo et al. analyzed WheatSM’s applicability for regional business applications and conducted a global sensitivity analysis using the EFAST method [18]. These studies identified 10 sensitive parameters, optimizing and calibrating them using SCE-UA and agricultural meteorological data. Jin et al. further developed an automatic adjustment system for WheatSM parameters using the PEST method to determine them quickly and accurately [15]. Hou et al. embedded the WheatSM model into the CGMS-China system and applied it to agro-meteorological business such as crop growth assessment, an agrometeorological disaster impact assessment, and crop yield forecast [19]. Sun et al. validated the applicability and high simulation accuracy of the WheatSM model in North China and used it to assess the climate risk [20]. However, the current version of WheatSM has been developed in VB language, prioritizing numerical performance. It lacks efficient simulation capabilities across multiple operating systems (PC, cloud, mobile) and different spatial scales (field, farm, region, global). Furthermore, its structure is complex, and its level of modularity is suboptimal, posing challenges for maintenance and secondary development. The advantages of the Python language include its simplicity and ease of learning, which enhances the flexibility and scalability of models. Moreover, it facilitates easy connections with databases, visualization tools, and statistical software packages. Therefore, a new version of WheatSM V5.0 developed in the Python language could address these limitations and provide several advantages.
Recently, the international project of the Agricultural Model Intercomparison and Improvement Project (AgMIP) has aimed to compare and enhance existing crop models [21]. AgMIP played a crucial role in the crop model comparison study, highlighting the potential for model enhancement through parameter optimization and structure refinement [22]. Bassu et al. [23] showcased the effectiveness of multi-model comparison and parameter optimization techniques in improving the accuracy and applicability of crop models, thereby offering reliable decision support tools. Meanwhile, there have been constant improvements in model software developments to meet new demands. For instance, Holzworth et al. [24] are developing a next-generation APSIM model, which runs on multiple operating systems, performs rapid simulations at various temporal and spatial scales, and addresses modern challenges and agricultural system model requirements. To facilitate the comparison and improvement of different crop models, Midingoyi et al. [25] developed the Crop2ML modeling framework, which eliminates platform differences and facilitates the description and assembly of crop model components. Similarly, de Wit et al. [26] constructed the Python Crop Simulation Environment (PCSE) framework and launched the WOFOST model based on Python 3.7 and 3.8 version software, enhancing model flexibility and providing a testing platform for new algorithms. Rodriguez et al. [27] developed the AquaCrop model in R language to expand its application and improve its capabilities. These constant improvements in model software development have enhanced model flexibility and applicability, providing a testing platform for new algorithms and facilitating the comparison and improvement of different crop models to better support agricultural production and decision making.
Here, our main focus is to enhance the following aspects: (i) Redesigning WheatSM software and improving simulation algorithms to re-establish a more accurate and efficient simulation of wheat growth and development; (ii) Developing WheatSM V5.0 using Python to enhance the functionality and usability of WheatSM, making it more accessible to users; (iii) Integrating the new WheatSM V5.0 into an agricultural model system integration platform (AgroStudio) based on cloud computing to provide improved flexibility and scalability for WheatSM, allowing rapid simulations across multiple operating systems and spatial scales. The enhanced WheatSM V5.0 offers practical and theoretical tools with higher precision and increased flexibility, thereby enabling informed decision making in wheat production management in China.

2. Materials and Methods

2.1. Data Resources

Winter wheat data were collected from the Wuqiao Experiment Station of China Agricultural University, located at 37°41′ N, 116°36′ E in Yaozhuang Village, Wuqiao County, Cangzhou City, Hebei Province. The data were obtained from field experiments conducted between 2017 and 2019, focusing on different irrigation and sowing dates [28,29]. To extract experimental data from the literature, the WebPlotDigitizer-4.2 software (https://automeris.io/WebPlotDigitizer/, accessed on 9 September 2021.) was employed. The extracted data mainly consisted of experiments conducted at the Wuqiao Experiment Station between 2011 and 2018. These experiments included the sowing date coupling irrigation experiment conducted from 2011 to 2014 [30], the irrigation experiment conducted from 2013 to 2016 [31], and the irrigation coupling nitrogen fertilizer experiment conducted from 2016 to 2018 [32] (Table 1). For this study, specific parameters were selected, including the key development period, soil water storage, soil nitrate nitrogen content, wheat nitrogen accumulation, leaf area index, above-ground biomass, and wheat yield. Additionally, management data such as variety types, sowing date, sowing density, fertilization time and amount, and irrigation time and amount were considered. Meteorological data stemmed from China Meteorological Administration, and soil parameters can be found in Reference [28].

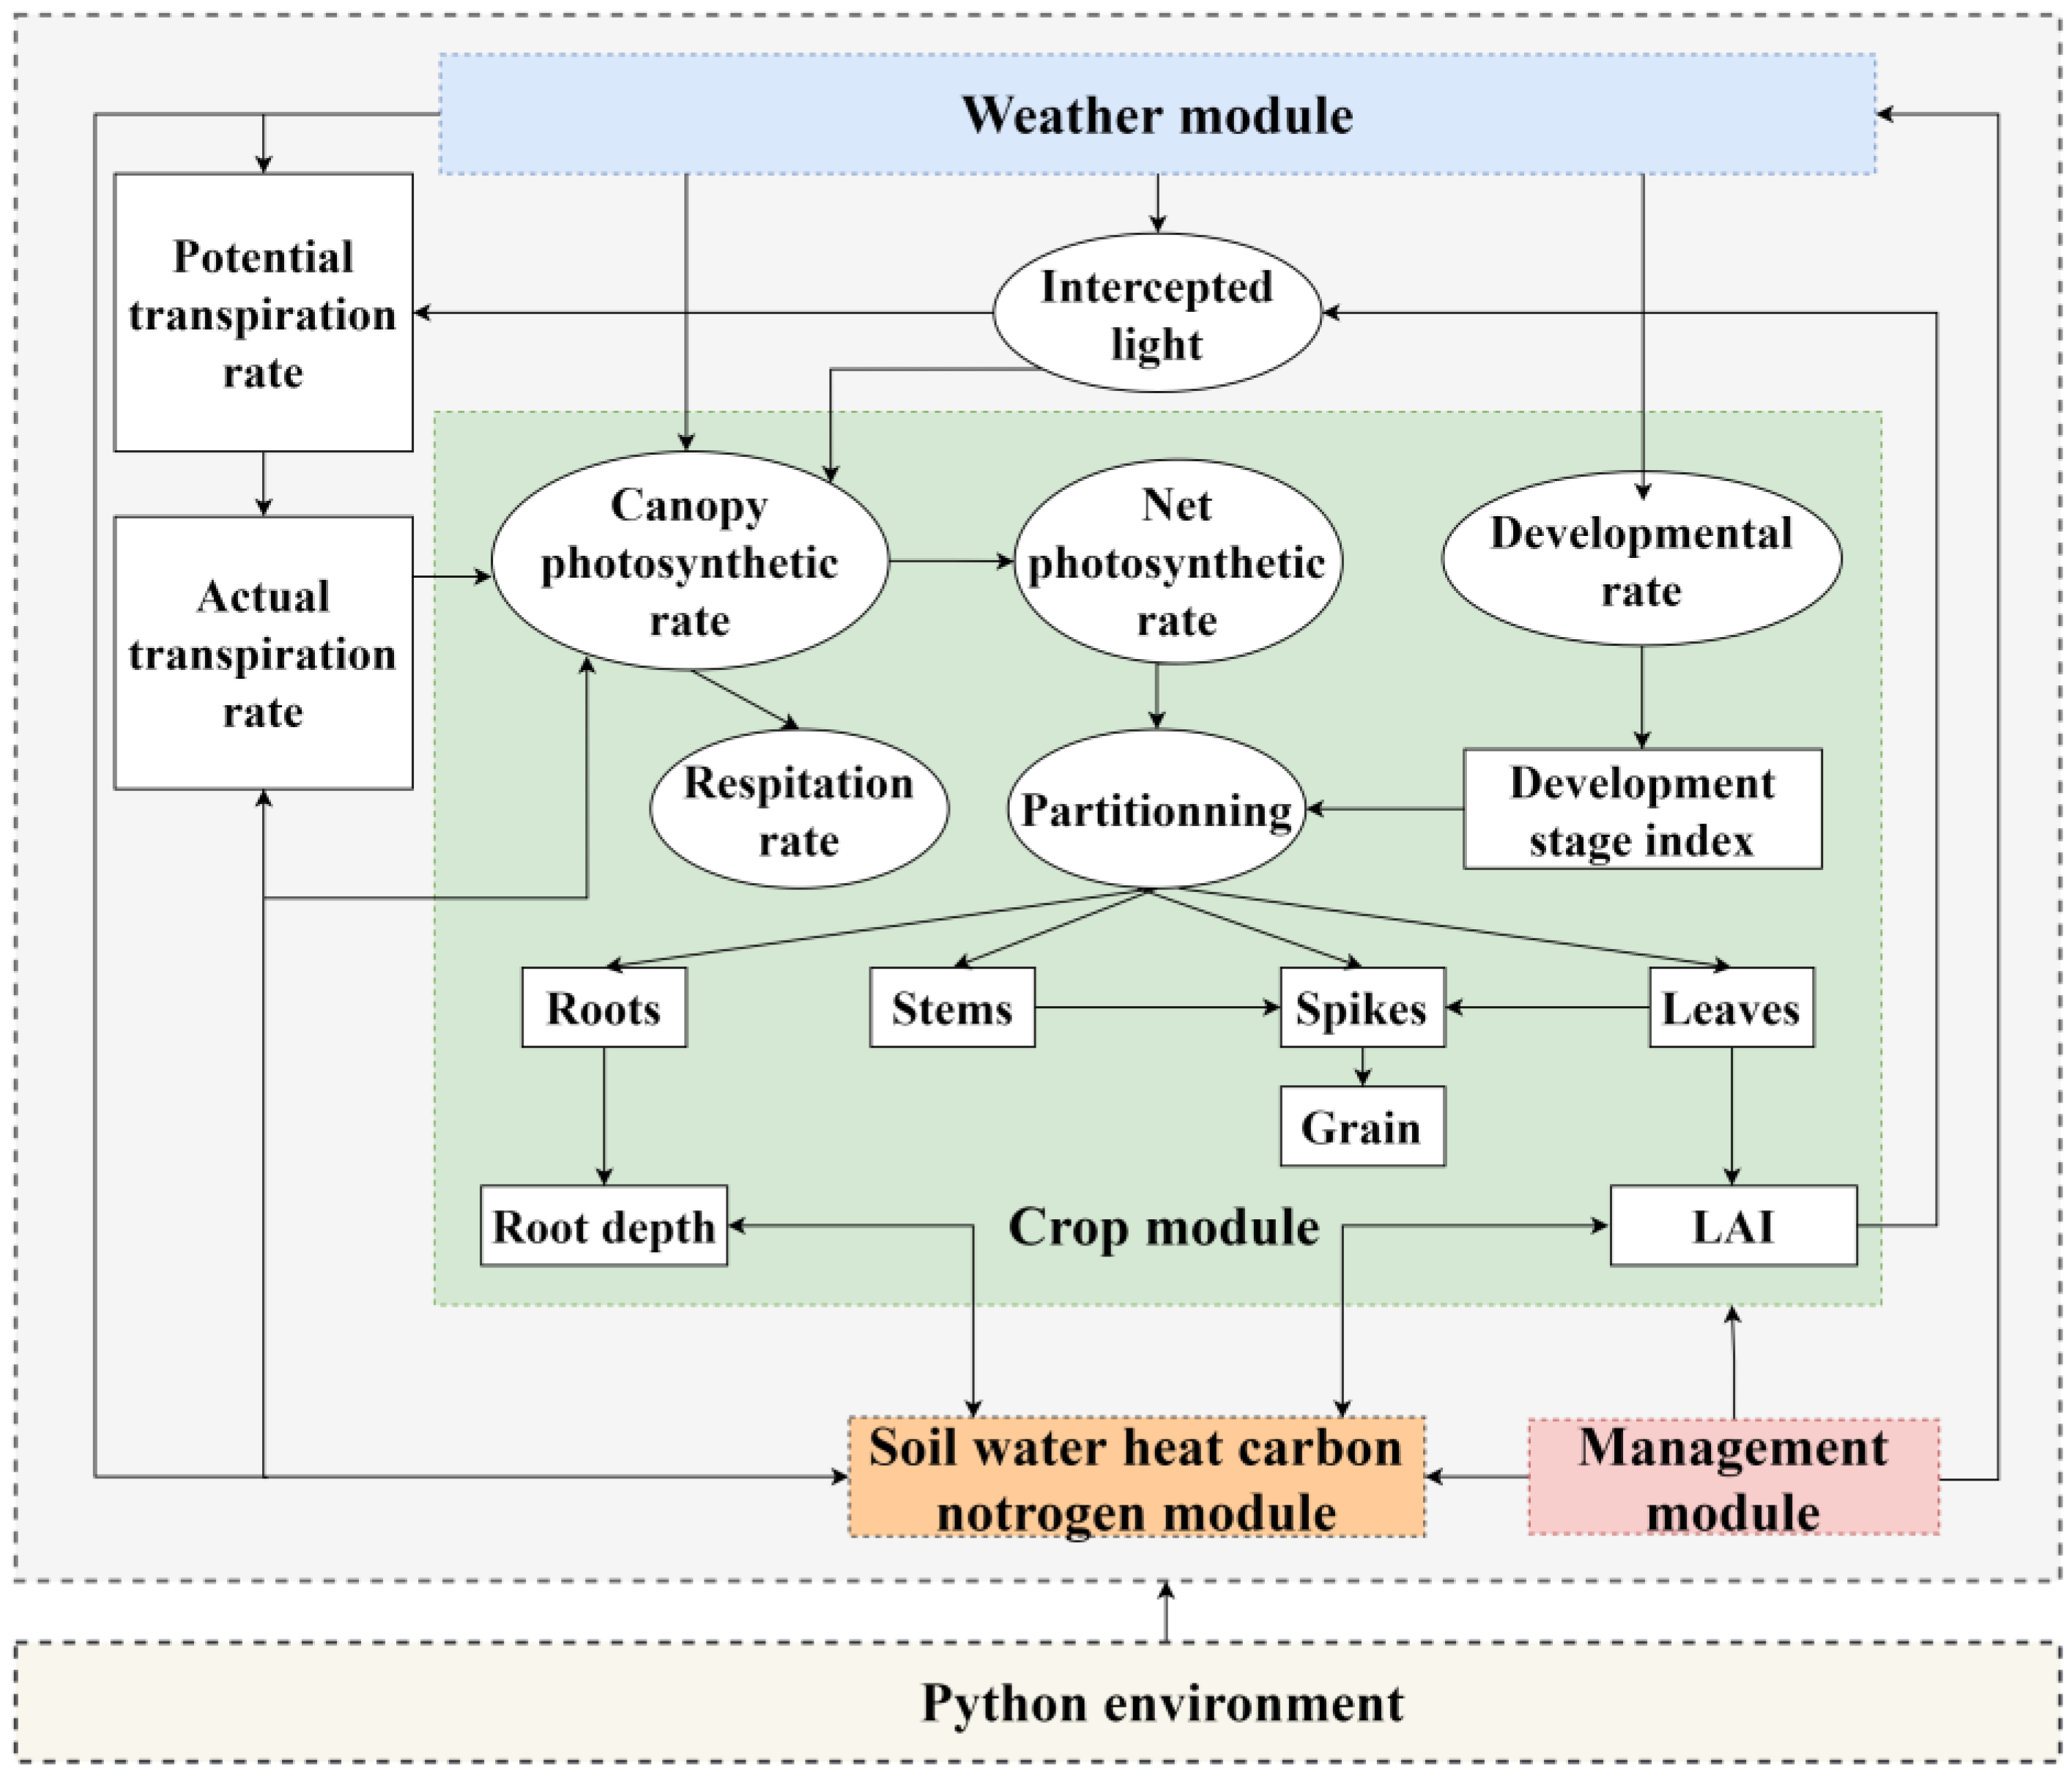
2.2. Simulation Model of Wheat Growth and Development

The WheatSM (wheat growth and development simulation model) was developed by modeling, verifying, and refining based on extensive field experiments and relevant data. This model has independent copyright and demonstrates the potential for wide-scale applications. To enhance the utilization of this model and test the effectiveness of a new algorithm, this study focused on redesigning the structure of the wheat model. Subsequently, WheatSM V5.0 was developed using the Python 3.7 version language. The interrelationships between different modules for the model are illustrated in Figure 1. WheatSM V5.0 exhibited enhanced portability and scalability compared to its predecessor, facilitating efficient simulations across diverse operating systems and spatial scales. The modular design of WheatSM V5.0 simplified its structure, making maintenance and secondary development more convenient. Moreover, the utilization of Python language improved user-friendliness and accessibility, enabling seamless integration with databases, visualization tools, and statistical software packages.

2.2.1. Phenological Development

The entire growth and development of wheat was divided into four stages based on its growth characteristics, including sowing–emergence, emergence–jointing, jointing–anthesis, and anthesis–maturity stages. The “wheat clock” model method was employed to simulate the phenological development [12,29]. The calculation formula is as follows:
d M d t = e k · t E p · P E q · f E C
where M represents the growth and development periods, and M is 1 when the development stage is completed. t and k represent the time and basic development coefficient, respectively. tE and p represent the temperature effect factor and temperature coefficient, respectively. PE and q represent the photoperiod effect factor and genetic coefficient of the photoperiod response characteristics, respectively. fEC is the controllable cultivation measurement factor, such as fertilizer and sowing depth.

2.2.2. Photosynthetic Production and Matter Accumulation

Photosynthetic production was simulated using the Mensi formula [29]. The calculation formula is as follows:
P G d = T F · P m a x · D L K e c · l n [ P m a x + P a · K e c · 1 α · I 0 · 0.47 P m a x + P a · K e c · 1 α · I 0 · 0.47 · e K e c · L A I ]
where PGd represents the total daily photosynthetic capacity, g/(m2·d). TF represents the temperature-influenced photosynthetic production factor. Pmax represents the maximum photosynthetic intensity at light saturation point, g/(m2·h). Pa represents the initial slope of the optical-response curve, g/MJ. I0 represents horizontal natural light intensity above the canopy, MJ/(m2·h). DL, Kec, and α represent day length, population extinction coefficient, and reflectivity, respectively.
W = 10 · ( P G d R p R m ) · γ · c e 1 m r
where W represents the daily dry matter growth rate, kg/(hm2·d). Rp and Rm represent the photorespiration rate and maintenance respiration rate, respectively, g/(m2·d). γ represents the conversion coefficient between CO2 and carbohydrate (CH2O) with the value of 0.682. ce represents the conversion coefficient between carbohydrates and plant dry matter. mr represents the dry mineral content of the matter with a value of 0.05.

2.2.3. Dry Matter Partitioning

The dry matter partitioning was simulated by the partitioning coefficient [29], and the calculation is as follows:
W i , d = W · f i , d
where Wi,d and fi,d represent the dry matter growth rate (kg/(hm2·d)) and the partitioning coefficient of organ i on day d, respectively.

2.2.4. Leaf Area Index

The leaf area index (LAI) was simulated using the specific leaf area method [28], and the calculation as follows:
LAI = WL,L·0.1·SLA
where WL,L and SLA represent the leaf biomass (kg/hm2) and specific leaf area (m2/g), respectively.

2.2.5. Root Growth

The deep root growth of wheat was maintained to compensate for the decrease in the root uptake area under water stress [33,34]. Therefore, this study improved the root growth equation from APSIM-Wheat [29], changing limited root depth growth into the promotion of root depth growth in water stress, with the calculation as follows:
DΔ,r = Rr·frt·(2 − fW)
where DΔ,r represents the daily increase in root depth (cm/d), Rr represents the growth rate of root depth with the value of 3.5 cm/d, and where frt and fw represent the temperature factor and water stress factor, respectively.
R A j = ( A R i = 1 j 1 R A i ) F W j F o j ( m i n R j i = j k R i ; N j i = j k N i ) P M N
R L V , j t = P M L · F R m l , j · R j t
where AR and Foj represent the photosynthetic product and nutrient influence factor, respectively. The PMN controls the effect of root and nitrogen distribution on carbon supply over the soil profile. RAj, Rj, FWj, Nj, and FRml,j represent partitioning carbon, the root weight, water influence factor, nitrogen content, and soil resistance factor in layer j, respectively. k represents the deepest soil layer of the root, ∆RLV,j represents the increased amount of root length density in layer j, cm/cm3. PML represents the conversion factor from root biomass to root length with the value of 21,000 cm/g.

2.2.6. Yield Formation

Yield formation was simulated using the biomass transfer method [29], and the calculation as follows:
Y = d = 1 d e t r 1 · W , d + d = d e + 1 d m t r 2 · W , d
where Y represents the wheat yield, kg/hm2. de and dm represent the number of days from sowing to heading and during whole growth period, respectively. tr1 and tr2 represent the transfer efficiency of photosynthetic products to grain before heading and photosynthetic products to grain after heading, respectively, kg/kg. W∆,d represents the aboveground biomass growth rate on day d, kg/(hm2·d).

2.2.7. Soil Water Dynamic Module

The soil water dynamic module mainly consists of water balance method simulations [28], where the water stress factor is calculated as follows:
f W , p o t o = θ t θ w p θ w s , p o t o θ w p θ t < θ w s , p o t o 1 θ t θ w s , p o t o
θws,poto = (1 − Ppoto)·(θfcθwp) + θwp
Ppoto = Pgiven,poto + 0.04·(5 − ETo)·lg(10 − 9·Pgiven,poto)
where fW,poto represents the influence factors of water stress on photosynthesis; θt, θwp, and θfc represent the actual soil moisture content, wilting percentage, and field capacity, respectively, with the unit of cm3/cm3. θws,poto represent the soil critical moisture content affecting photosynthetic production, with the unit cm3/cm3. Ppoto represents the proportion of soil available that easily absorbs water during photosynthesis. Pgiven,poto represents stomatal conductance thresholds, which are crop parameters calibrated to 0.6 based on the experimental data.

2.2.8. Soil Nitrogen Dynamic Module

The soil nitrogen dynamic module mainly includes processes such as organic nitrogen mineralization, nitrogen fixation, nitrification, denitrification, urea hydrolysis, and nitrogen uptake [29]. The calculation of the nitrogen stress factor is as follows:
f N , p o t o = T A N C T M N C T C N C T M N C
where f N , p o t o is the factor of nitrogen stress on photosynthesis; TANC, TMNC, and TCNC are the actual nitrogen content, minimum nitrogen content, and critical nitrogen content, respectively, %.

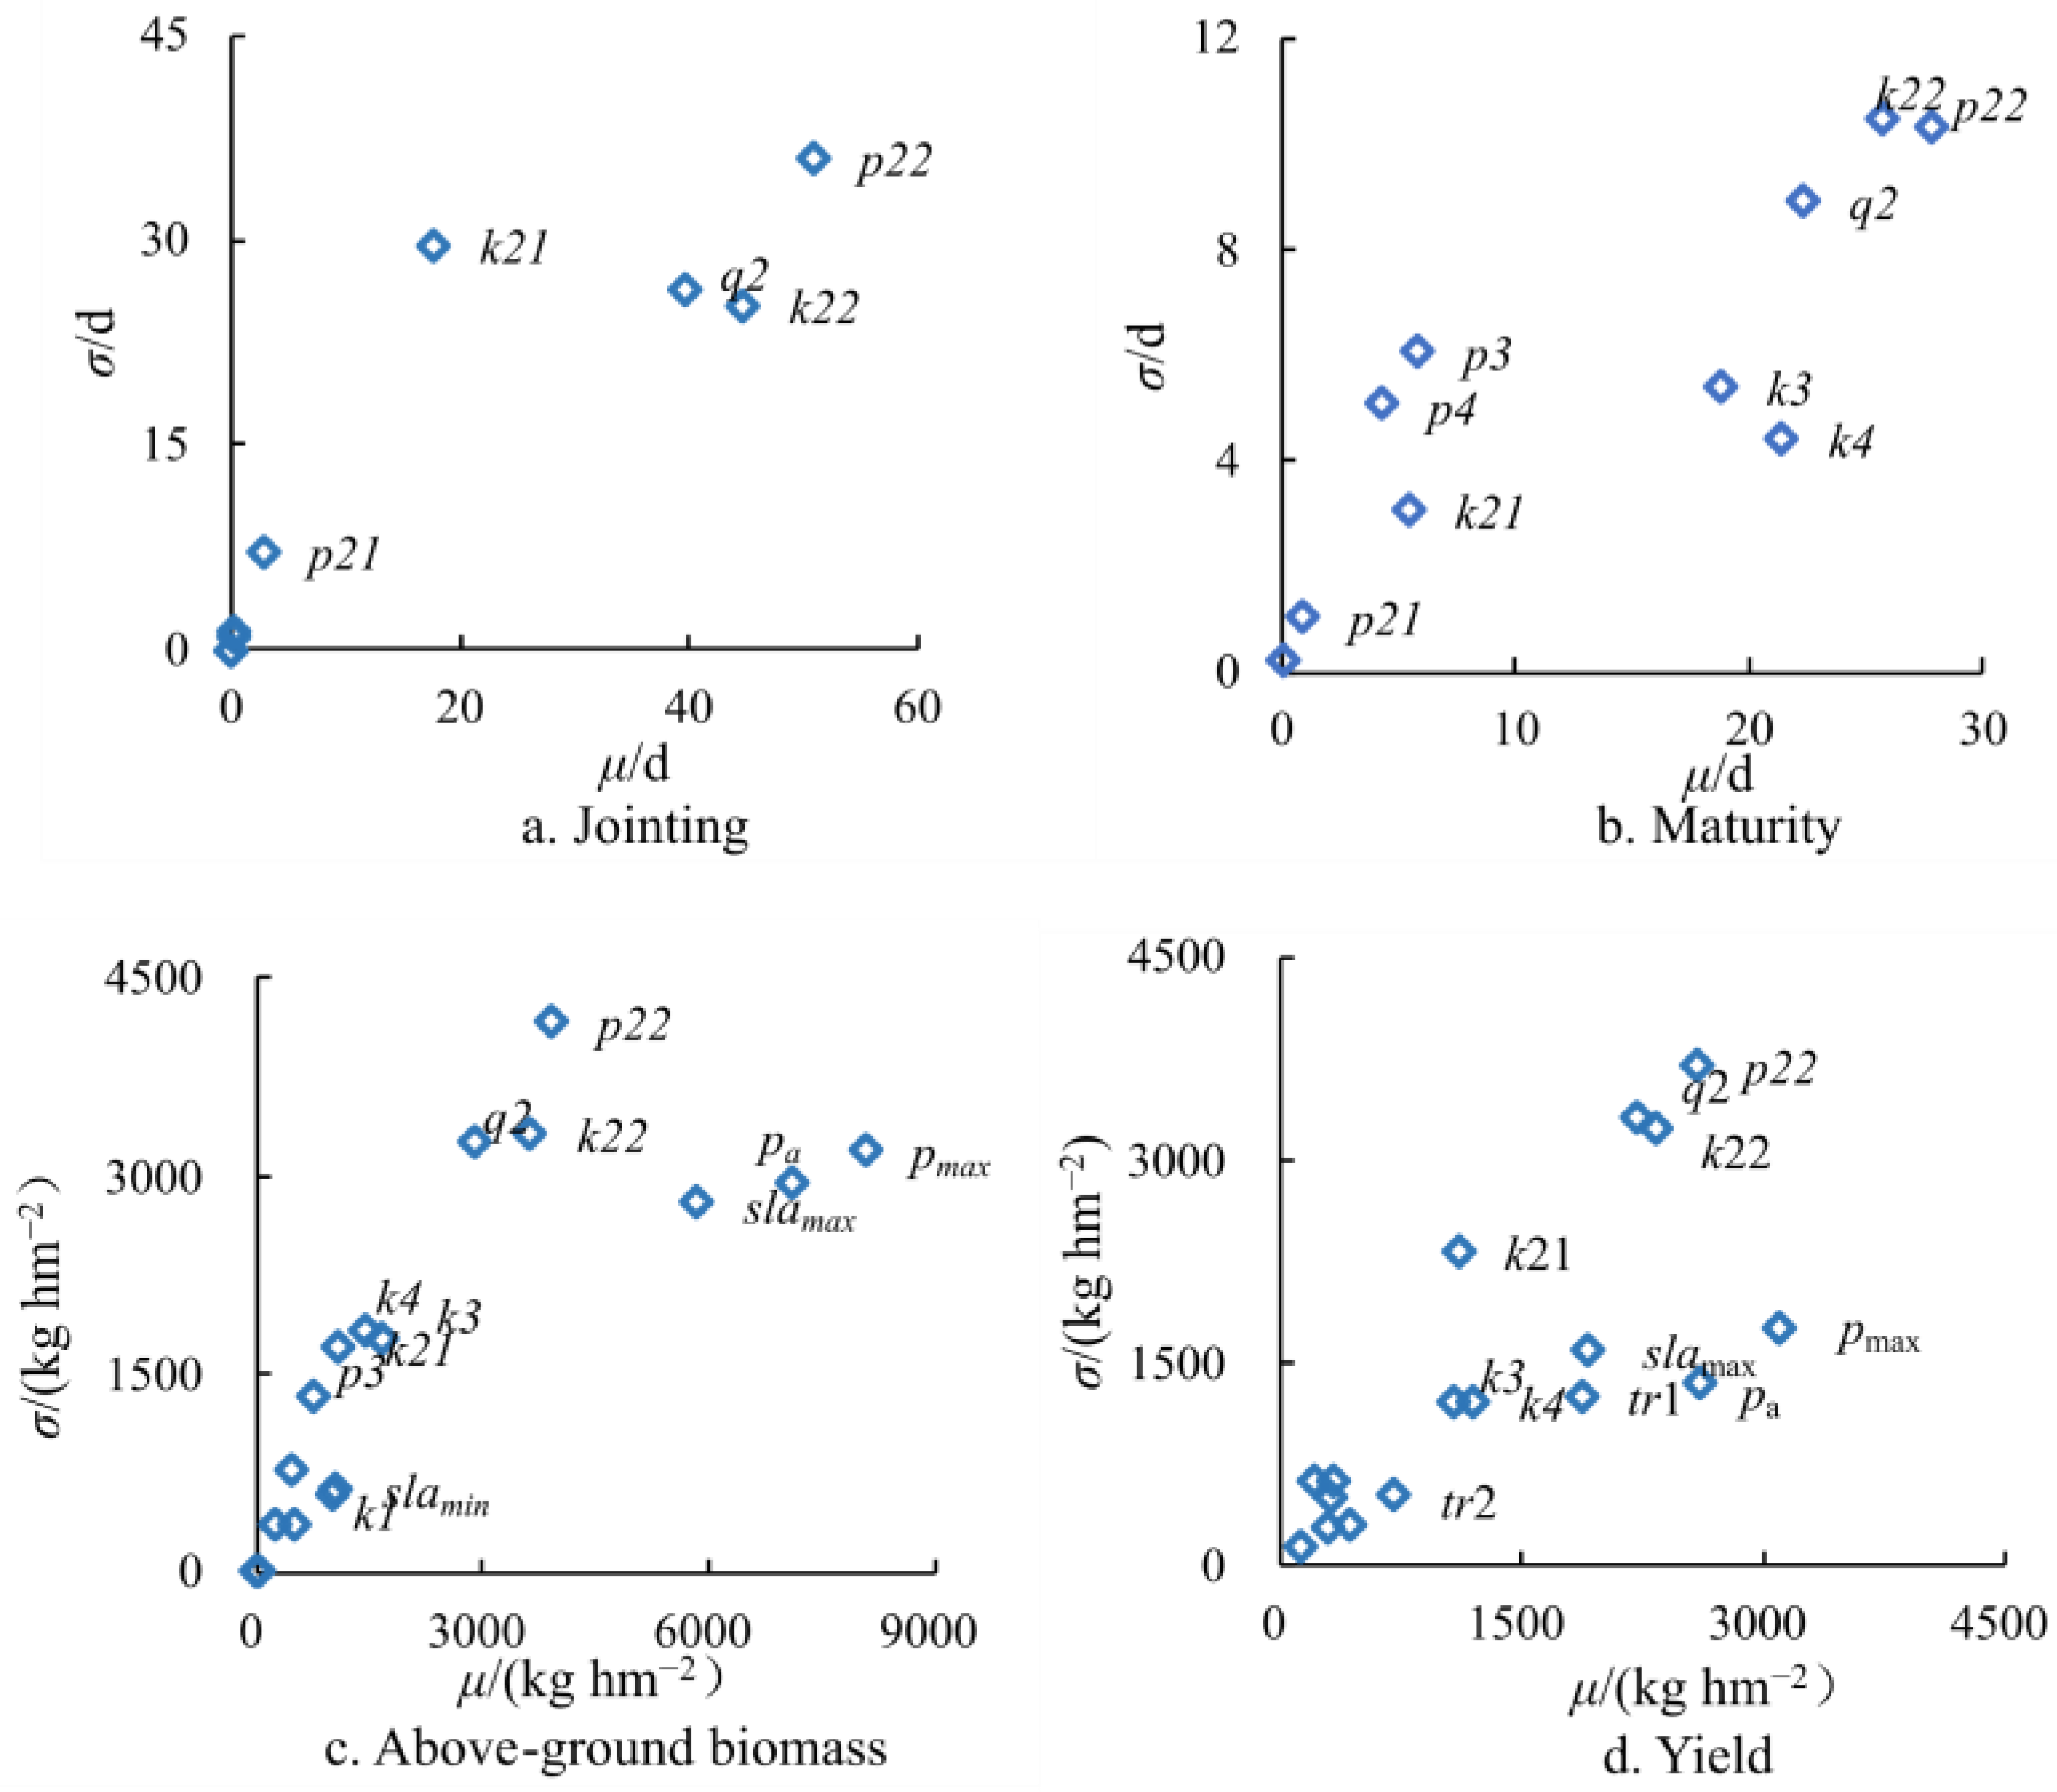
2.3. Sensitivity Analysis of Parameters

Morris is a global sensitivity analysis method based on screening analysis, which is designed to evaluate the sensitivity of model outputs via changing the input parameters [35]. This method is particularly useful for the situation of large numbers of input parameters; otherwise, the model computation is expensive. The calculation formula is as follows:
E i = y x 1 , x 2 , , x i 1 , x i + , , x n y ( x 1 , x 2 , , x n )
where E i is the influence degree of each input parameter from the output result, y(x) is the model output, ∆ is a value between 1/(p − 1) and 1 − 1/(p − 1), and p is the number of levels for the input parameter.
The mean sensitivity index μ and standard deviation σ for each parameter can be calculated based on the simulation value. A larger μ indicates the greater sensitivity of the parameter to the output, while σ represents the interaction between parameters, with a larger σ indicating a stronger interaction with other parameters. To investigate the impact of meteorological conditions on the sensitivity analysis results of model parameters under different environmental conditions, parameter sensitivity analysis was conducted for eight wheat growing seasons (2011–2019) at the Wuqiao site.

2.4. Model Parameterization

Based on field experimental data and the literature, each experiment was divided into two datasets: calibration and validation (Table 2), and the WheatSM model was calibrated and validated. The root mean squared error (RMSE) between the simulated and observed values was used as the objective function. A low RMSE represents high simulated precision. Firstly, the parameters of the developmental algorithm were calibrated using the experimental observations of growth stages, including k1, p1, k21, p21, k22, p22, q2, k3, p3, k4, and p4. Then, the biomass algorithm was adjusted based on observed dry matter, including pa, pmax, slamax, and slamin. Finally, the yield formation algorithm was calibrated based on the observed yields, including tr1 and tr2. The simple genetic algorithm in the Python package “sopt” was used for automatic cultivar parameter calibration (Table 3)
Three statistical indices were used to compare the simulated grape harvest dates under different sugar concentrations with observed values, including RMSE, the normalized root mean square error (NRMSE), and the determination coefficient (R2).
RMSE = 1 n · i = 1 n ( S i O i ) 2
NRMSE = 1 n · i = 1 n ( S i O i ) 2 O avg · 100 %
R 2 = i = 1 n ( S i S a v e ) ( O i O a v e ) i = 1 n ( S i S a v e ) 2 0.5 i = 1 n ( O i O a v e ) 2 0.5 2
where Oi and Si are the observed and simulated values, respectively. Oavg and Savg are the average value of the observed and simulated values, respectively. n is the number of observations.

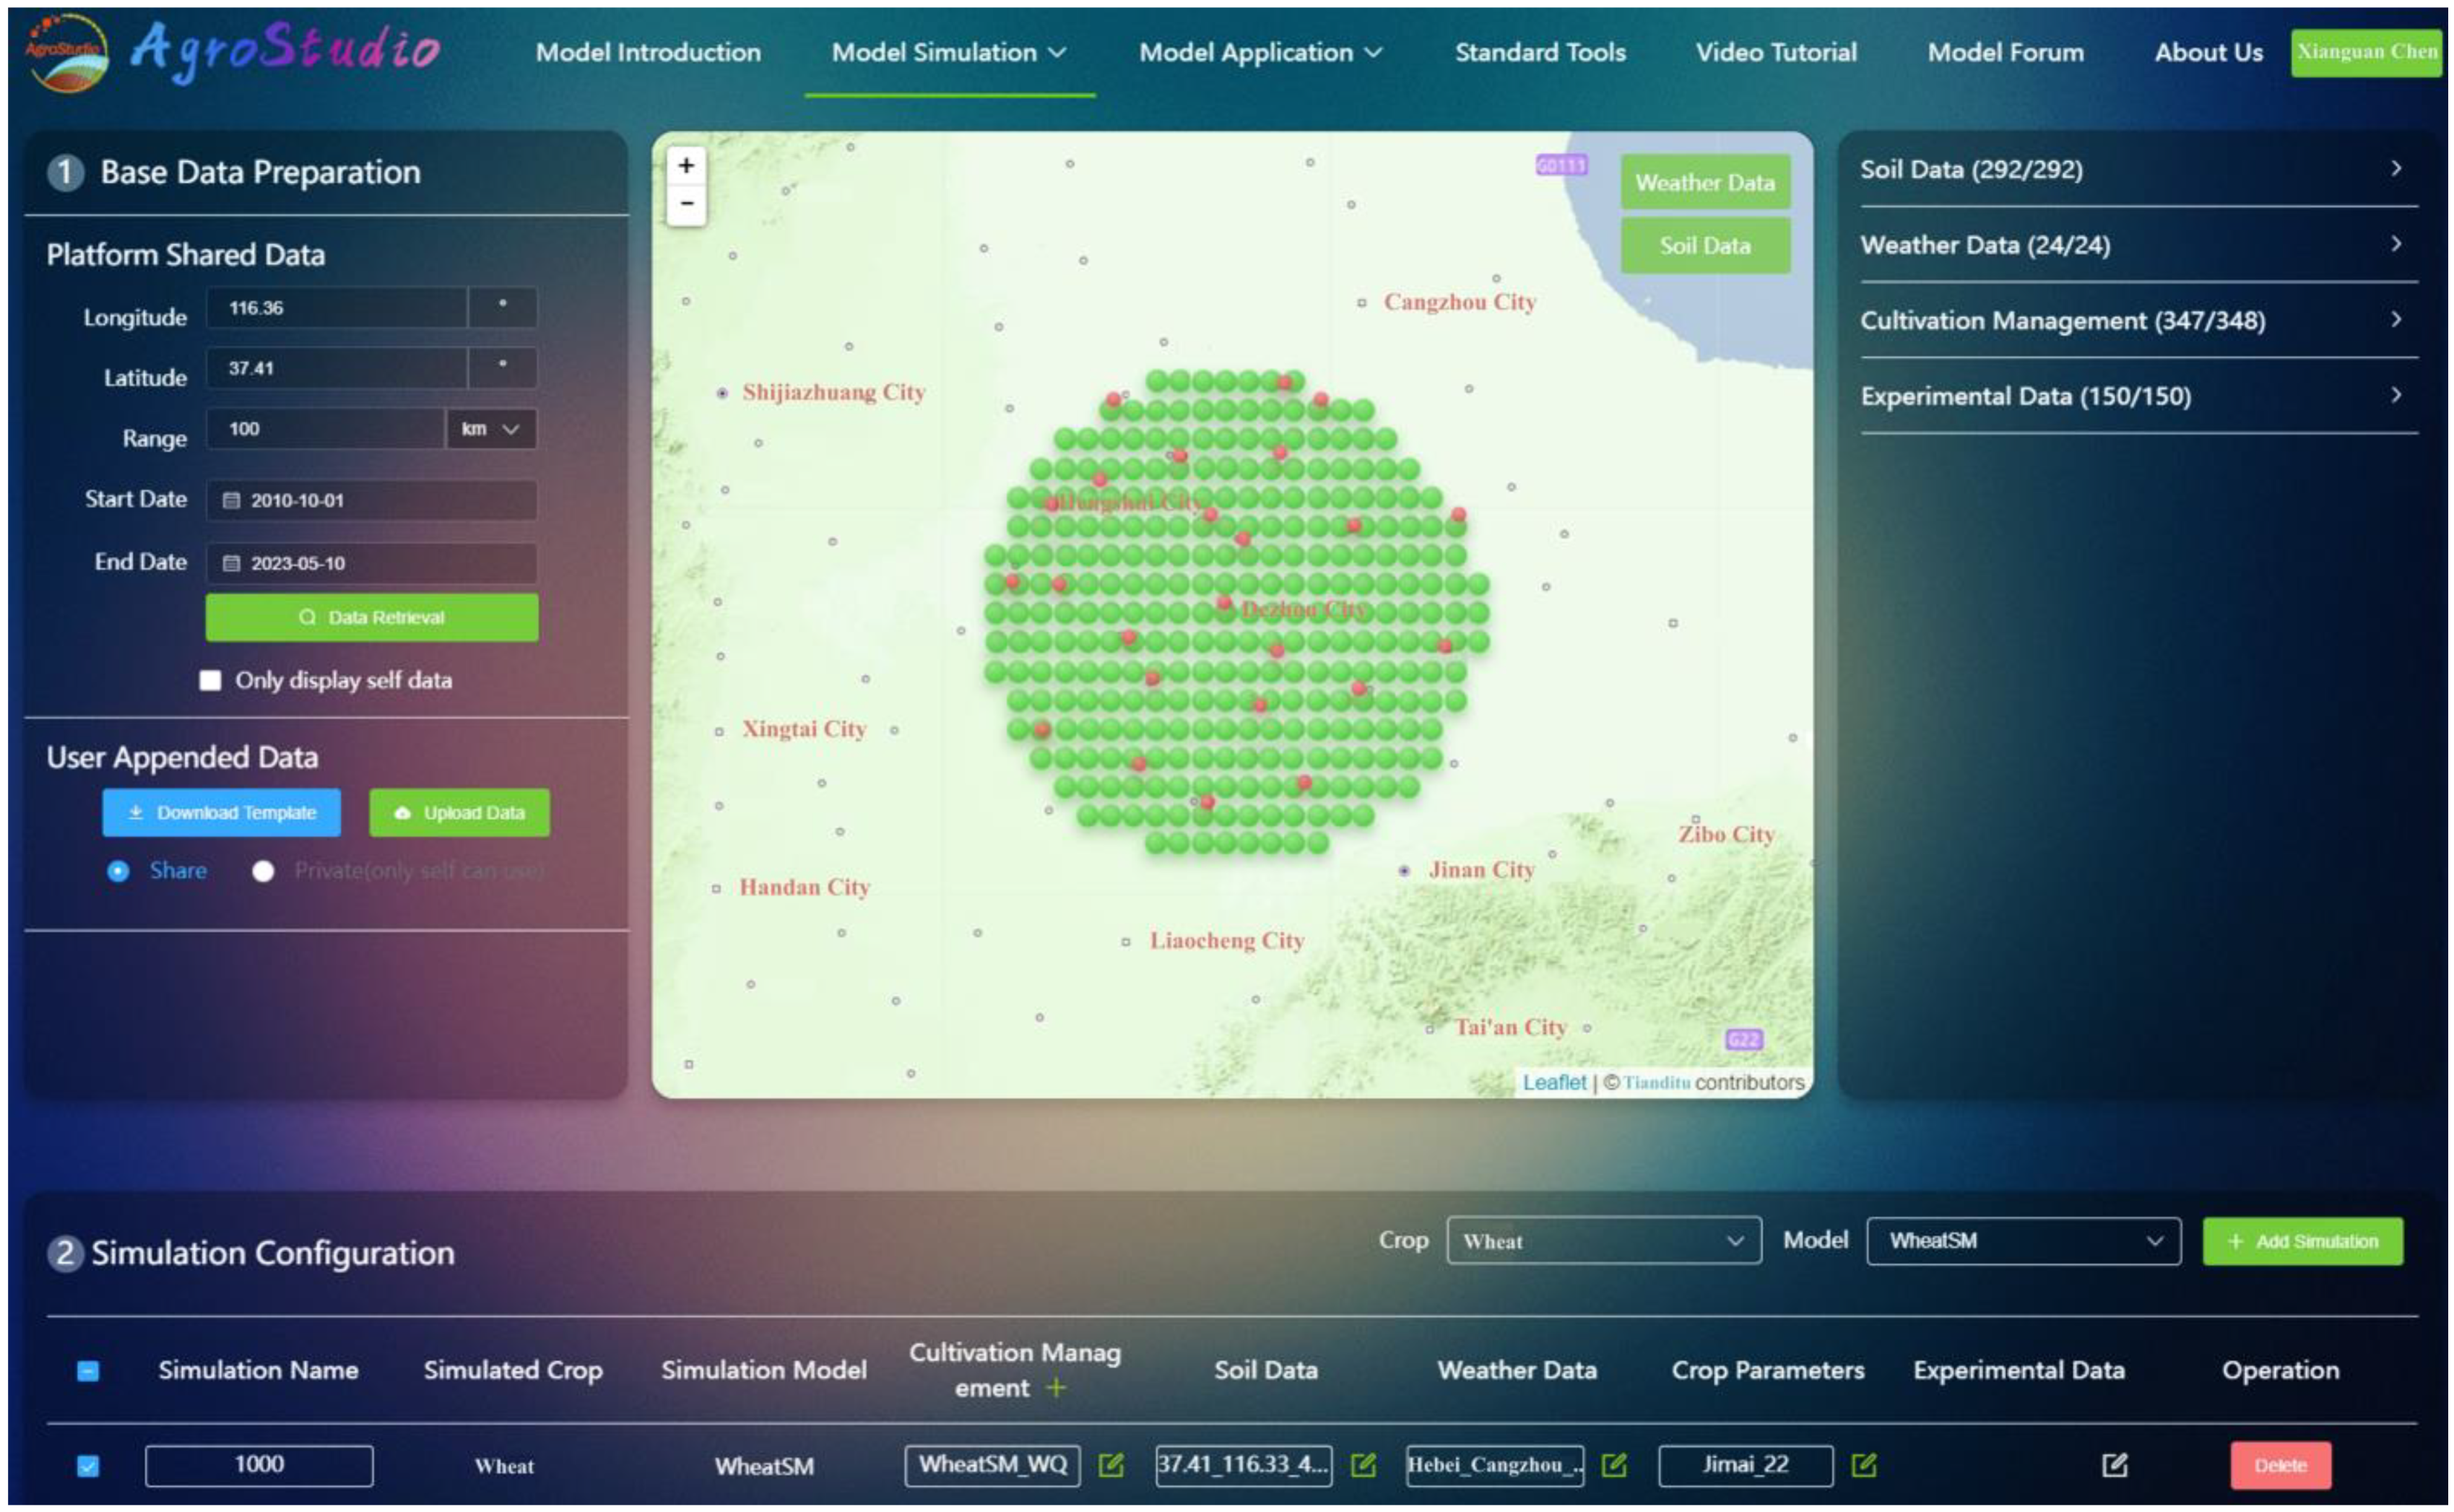
2.5. AgroStudio Plantform

The Agricultural Systems Modelling Studio, AgroStudio (https://www.agro-studio.com, accessed on 10 May 2023), is a powerful tool designed to simulate the biophysical behavior of agricultural production systems. It aims to analyze how genotypes, environmental conditions, and management practices interact to influence agriculture. AgroStudio adopted a unique approach to model reorganization, allowing for multi-model and multi-crop simulation. This approach significantly reduced the time required for data file preparation and the cost associated with simulating multiple crop models. Additionally, it improved the utilization of meteorological and soil field experiments, ultimately benefiting agricultural researchers and facilitating the learning process of agricultural modeling. By integrating WheatSM V5.0 into the AgroStudio platform, the construction of a “cloud-based crop simulation” service platform was accomplished. This platform was built on the architecture of “cloud-edge-end”. It enabled multi-end interactions through various devices such as PC terminals, web terminals, and mobile terminals via a unified API interface. This platform enhances user experience by leveraging the user’s location to quickly match and provide the weather and soil parameters required for model execution. This feature improves the efficiency of generating standardized data and expands the application channels for these models. Consequently, it propels the digital, automated, and information-driven development of crop models, further advancing the agricultural industry.

3. Results

3.1. Sensitivity Analysis of Parameters for WheatSM V5.0 Model

According to the results of the sensitivity analysis, it was found that the parameter p22, representing the temperature coefficient, had the highest sensitivity during the emergence–jointing stage with u-value of 50.8 d, followed by k22, q2, and k21 with their respective u-values of 44.7, 39.5, and 17.7 d, indicating their significant influence on the emergence–jointing stage (Figure 2a). Since the emergence–jointing stage encompassed the vernalization and photoperiod stages, the sensitivity of wheat to photoperiodic temperature and the basic developmental coefficient was primarily determined by p22 and k22, respectively. Additionally, the sensitivity of wheat to photoperiodic light length was influenced by q2. The sensitivity analysis revealed how the parameters k4, k3, p3, and p4 possessed high sensitivity during the maturity stage, with u-values of 21.4, 18.7, 5.8, and 4.3 d, respectively (Figure 2b). p3 and p4 represent the nonlinear effect of temperature on wheat development, resulting in a high variance in the sensitivity index and a significant nonlinear impact. These parameters indirectly influenced the maturity stage through the sensitivity of temperature effects. In terms of biomass, the sensitivity parameters included pmax, pa, and slamax, excluding parameters relating to the development stage. Among these parameters, the ranking of sensitivity was pmax > pa > slamax with significant variance. However, slamin showed low sensitivity (Figure 2c). The photosynthetic intensity was controlled by pmax and pa with u-values of 8071.7 and 7091.5 kg/hm2, while the leaf area was controlled by slamax. These three parameters directly affected the photosynthetic output and exhibited high interaction effects. Regarding the yield, the sensitivity analysis indicated that tr1 had the highest sensitivity, followed by tr2. This was observed after excluding the sensitivity parameters related to the development stage and biomass (Figure 2d). tr1 and tr2 had a significant impact on yield since yield was the product of biomass transfer before and after anthesis. Notably, the sensitivity of tr1 was 1869.7 kg/hm2, indicating a higher impact on the yield compared to tr2.

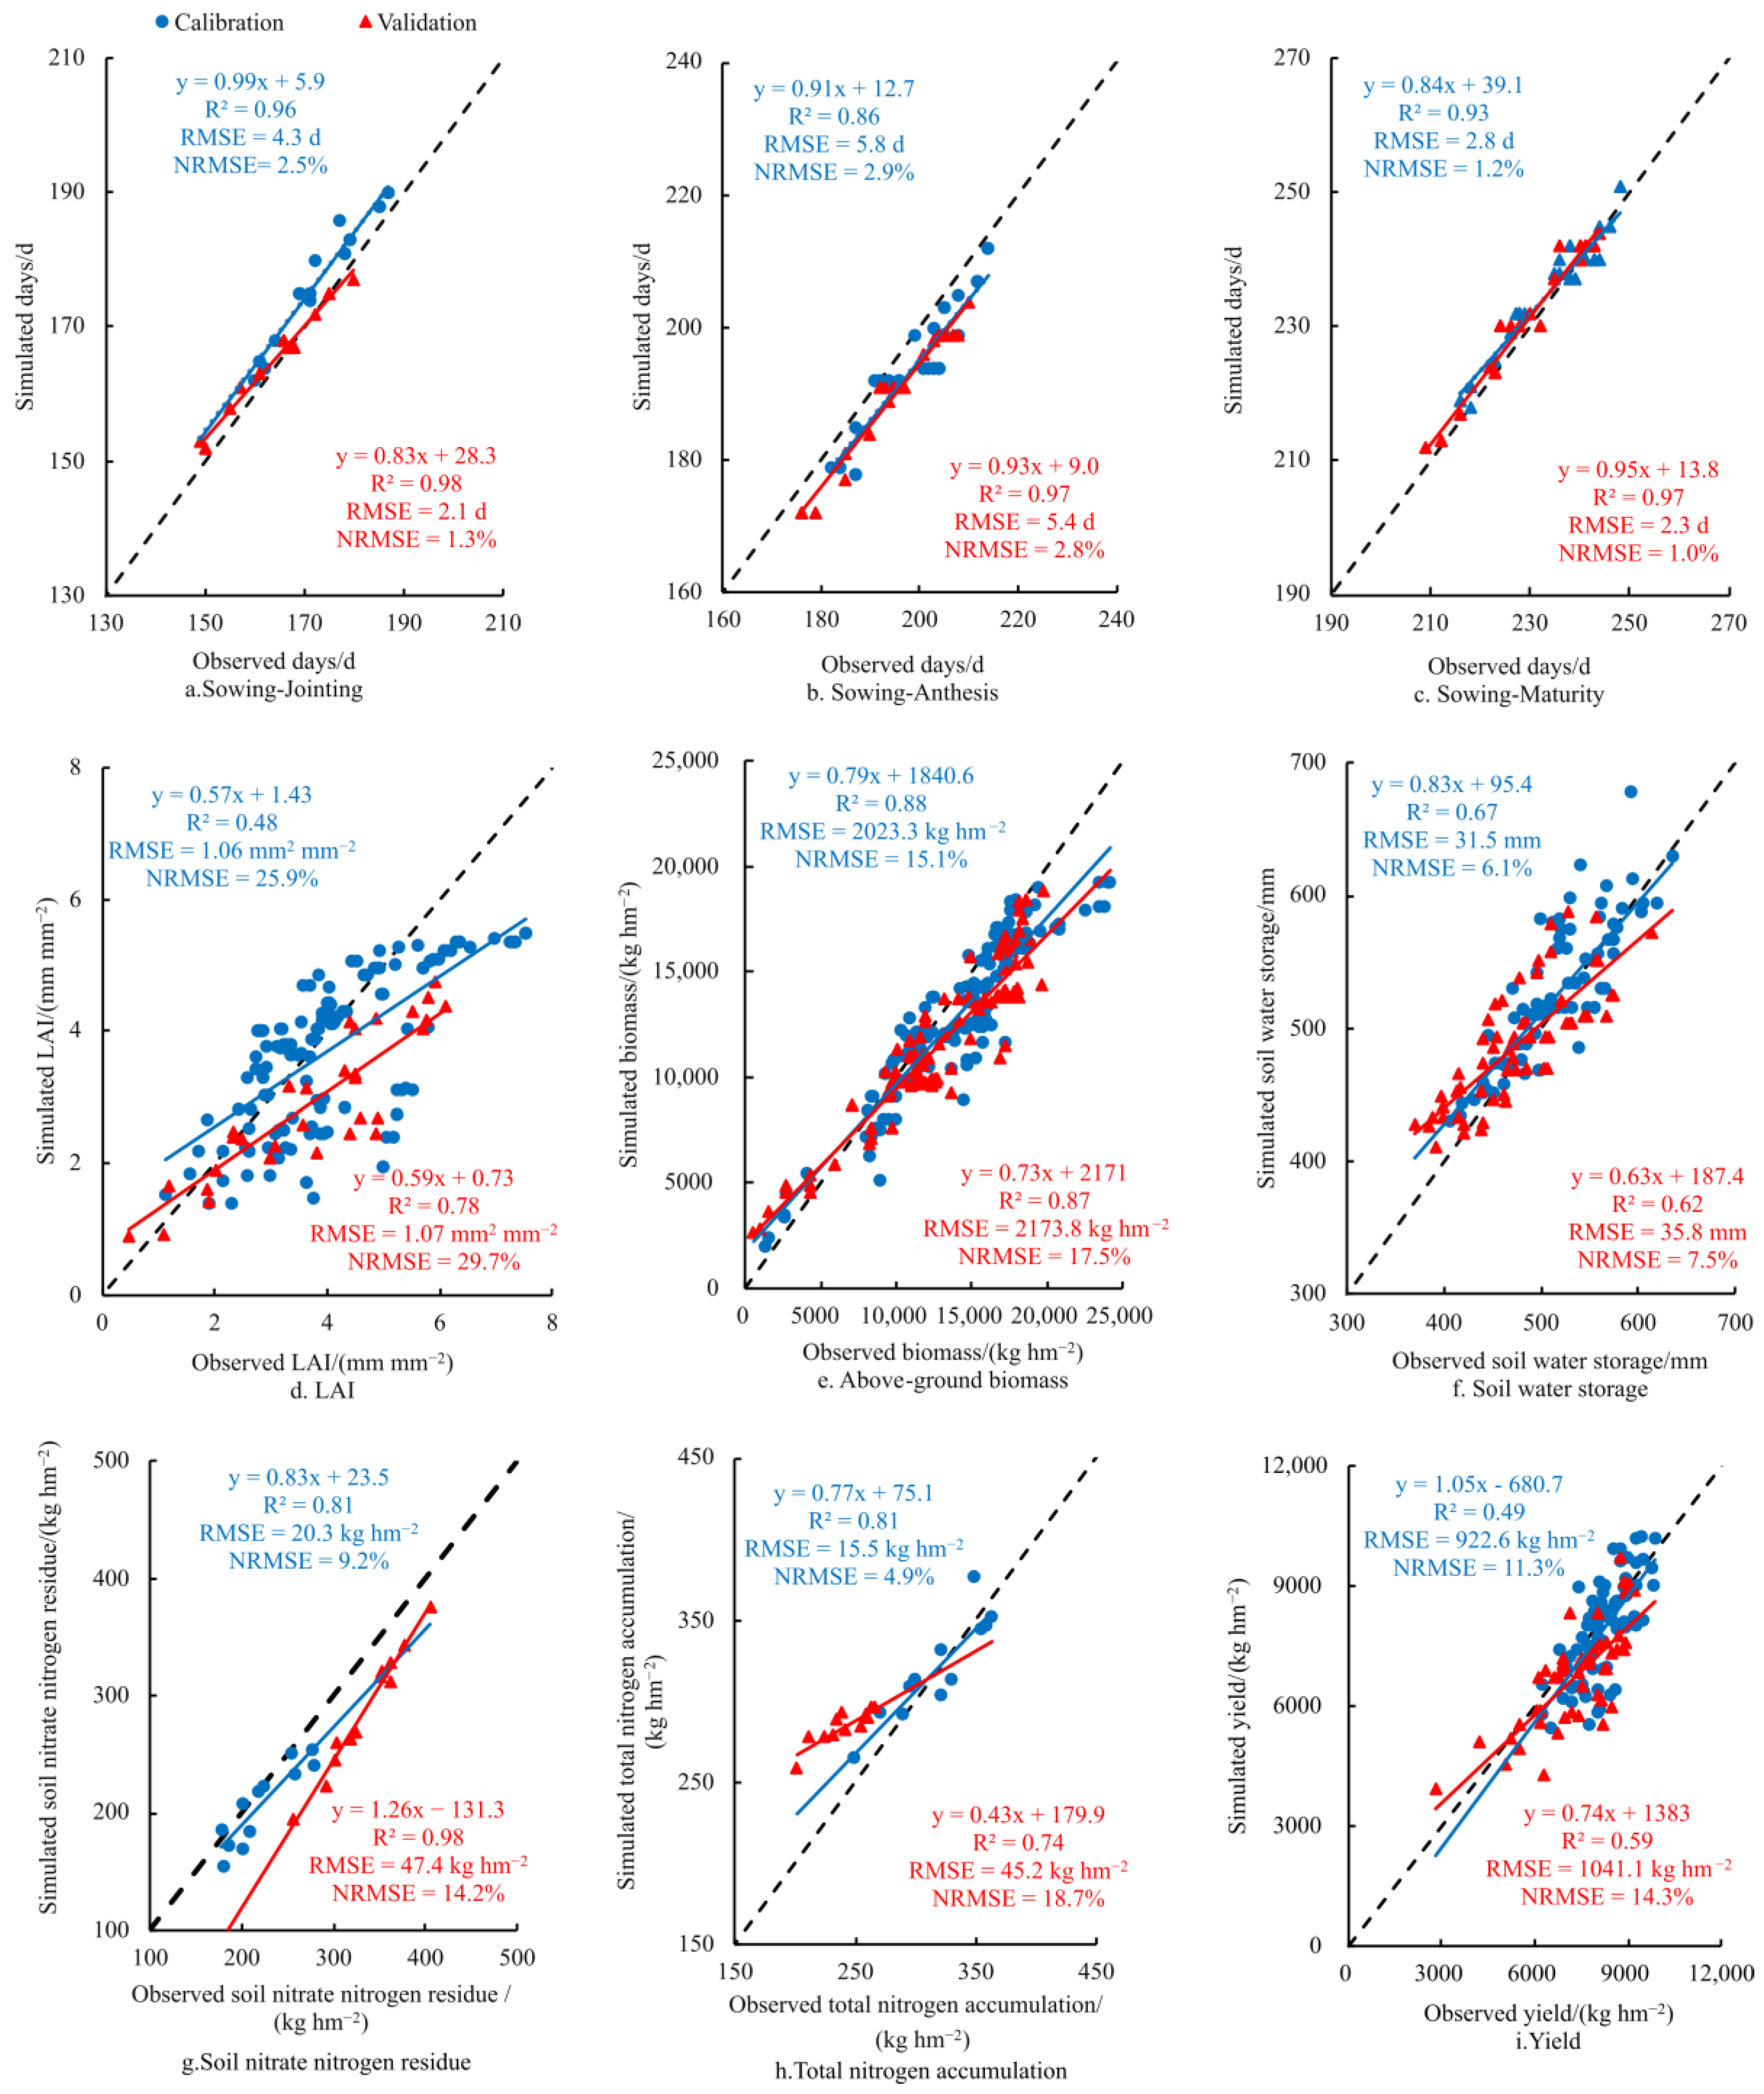
3.2. Model Validation of WheatSM V5.0

The calibration results demonstrated the excellent performance of the calibration parameters for various variables. Root mean square error (RMSE) values between simulated and measured values for the sowing–jointing stage, sowing–anthesis stage, and sowing–maturity stage were 4.3 d, 5.8 d, and 2.8 d, respectively. The RMSE for the leaf area index was 1.06 mm2/mm2, 2023.3 kg/hm2 for aboveground biomass, 2 m of soil water storage was 31.5 mm, 2 m of soil nitrate-nitrogen content was 20.3 kg/hm2, nitrogen accumulation was 15.5 kg/hm2, and yield was 922.6 kg/hm2. Normalized root mean square error (NRMSE) values, which indicated the relative magnitude of these errors, were 2.5%, 2.9%, 1.2%, 25.9%, 15.1%, 6.1%, 9.2%, 4.9%, and 11.3% for the respective variables mentioned above. These NRMSE values suggested that the calibration parameters had an excellent effect on improving the simulation accuracy of these variables. However, during the validation process, some variables showed a relatively poorer simulation performance. The RMSE values between the simulated and measured values for the sowing–jointing stage, sowing–anthesis stage, sowing–maturity stage, leaf area index, aboveground biomass, 2 m of soil water storage, 2 m of the soil nitrate nitrogen content, winter wheat nitrogen accumulation, simulated yield, and measured yield were 2.1 d, 5.4 d, 2.3 d, 1.07 mm2/mm2, 2173.8 kg/hm2, 35.8 mm, 47.4 kg/hm2, 45.2 kg/hm2, and 1041.1 kg/hm2, respectively. The NRMSE values for these variables were 1.3%, 2.8%, 1.0%, 29.7%, 17.5%, 7.5%, 14.2%, 18.7%, and 14.3%, respectively. Obviously, the simulation of the leaf area index for WheatSM V5.0 was relatively poor (Figure 3). Specifically, the simulation of the leaf area index using WheatSM V5.0 was relatively poor, as indicated by the higher NRMSE value for this variable. This suggests that further improvements or adjustments might be necessary to enhance the accuracy of simulating the leaf area index in this model.

3.3. Embedded WheatSM V5.0 into the Agrostudio Platform

AgroStudio provides a convenient platform for users to prepare and create various data files for the model, simplifying the application process. The platform is accessible online, eliminating the need to install the model software locally. This allows users to simulate and analyze wheat growth directly through a web browser. Additionally, users can submit multiple simulation tasks simultaneously, with each task processed independently. This feature facilitates the efficient processing of batch tasks. Test research indicated that WheatSM V5.0 performed exceptionally well on the AgroStudio platform. It enabled the rapid configuration and simulation of multiple locations within a given region, thereby enhancing the regional modeling capabilities of WheatSM (Figure 4). By leveraging cloud computing services, crop growth simulation and agricultural production decision making can be supported through the integration of multiple models and real-time accurate simulations. Overall, the AgroStudio platform empowers users to perform a crop growth simulation and make informed agricultural production decisions. Its integration with cloud computing services enables multi-model integration and real-time simulations, contributing to enhanced accuracy and efficiency in agricultural modeling.

4. Discussion

This study redesigned the system structure and developed a pure Python-based WheatSM V5.0 version, which was integrated into the AgroStudio platform for cloud computing. The advantages of this new model lie in its enhanced performance, improved flexibility, and seamless integration with the AgroStudio platform, enabling the efficient and convenient simulation of wheat growth. Calibrating the cultivar parameters of this model is an essential prerequisite and a critical step for application. However, due to the vast number of parameters involved in models, the calibration process can present extreme challenges without pre-existing knowledge, which hinders the widespread utilization of this model. Sensitivity analysis enables the identification of sensitive parameters among the multitude, reducing the workload and uncertainty involved in model validation and thereby enhancing the efficiency and accuracy of model calibration [36]. The cultivar parameters of the WheatSM model can be broadly categorized into three types: growth period parameters, biomass parameters, and yield parameters. The impacts of these different types on the output results of the model show noticeable differences. Morris global sensitivity analysis highlighted that the jointing and maturation stages were most sensitive to the parameters of the emergence–jointing phase, particularly the parameters k22 and p22. This is because these parameters have the greatest impact on the simulation of the wheat photoperiod, which, in turn, directly influences the jointing and maturing stages. The parameter pmax had the most substantial influence on biomass simulation as it directly controlled photosynthesis strength and further affected photosynthetic production. The parameter slamax primarily affected the leaf area index simulation and indirectly influenced biomass simulation. The yield parameter tr1 had the most significant impact on yield simulation, highlighting its role in biomass redistribution. Guo et al. employed the EFAST global sensitivity analysis method to analyze the wheat growth and development parameters of the WheatSM model and identified 10 sensitive parameters that significantly affected the model simulation performance, which is consistent with the results of this study [18]. Overall, sensitivity analysis served as the foundation for the parameter adjustment and adaptability evaluation of WheatSM V5.0. It is important to note that variations in crop species, environmental conditions, and field management practices significantly influence the sensitivity of model parameters. This study only examined parameter sensitivity under specific conditions and did not analyze the uncertainty caused by differences in soil types and water–fertilizer management, among others. Future research should comprehensively and systematically consider the sensitivity and uncertainty of parameters under diverse environmental conditions, crop varieties, and management practices.
Our study further adjusted the parameters for different stages of wheat growth (jointing stage, anthesis stage, and maturity stage), leaf area index, biomass, soil water storage, soil nitrate nitrogen content, nitrogen accumulation, and yield. WheatSM V5.0 is a model that can accurately simulate soil water and nitrogen dynamics, as well as wheat growth and development under different treatment scenarios. The use of RMSE and NRMSE as indicators is common in crop modeling. RMSE measures the average magnitude of the error, providing an absolute measure of fit, while NRMSE provides a normalized measure of these errors, allowing for their comparison across different datasets or variables. Liu et al. [37] suggested that the simulated results are very good when the NRMSE is below or equal to 15%. If NRMSE is above 15% but below or equal to 30%, the simulation performance is considered good. Our study found that the evaluation of WheatSM V5.0 in terms of performance, and measured by the range of the NRMSE, showed excellent simulation results for various indicators such as soil water storage, nitrate nitrogen content, wheat nitrogen accumulation, wheat growth stages, wheat biomass, and wheat yield, with NRMSE values ranging from 1.0% to 18.7%. However, during the validation process, some variables showed poor simulation performance, particularly the leaf area index (LAI), with a higher NRMSE value of 25.9% to 29.7%. This could be attributed to the complex process of leaf area formation, which is not fully captured by the existing models. Therefore, there is a need for model improvement in the next step. Additionally, these models may not adequately consider the spatial heterogeneity within the field, further contributing to limitations in simulating the leaf area index accurately. Compared with previous studies, WheatSM V5.0 significantly improved accuracy [14,15,16,17,18,38,39]. To address these challenges and promote the practical applications of WheatSM V4.0, integration with the AgroStudio platform was undertaken. By integrating WheatSM V5.0 into AgroStudio, the cloud services of WheatSM are made available, enabling the more accessible and convenient usage of the model. Moreover, AgroStudio also incorporates other models like WOFOST, which facilitates comparisons between WheatSM and other domestic and international models. This integration of multiple models helps to reduce the uncertainty associated with single-model simulations and enhances the overall utility of this platform.
Compared to previous versions, WheatSM V5.0 incorporates several notable improvements. First, the model adopts modular programming based on Python language, enhancing its modularity and facilitating the addition and update of modules with variable transfer between modules and integration with powerful third-party Python libraries. This allows for the easier expansion of functionalities. Second, the algorithms for developmental stages, leaf area, and root growth were improved, resulting in the enhanced simulation performance of WheatSM. These updates contribute to more accurate and reliable predictions of wheat growth and development. Furthermore, WheatSM V5.0 integrates seamlessly with the AgroStudio platform, enabling cloud services and enhancing the practical application of this model in actual agricultural production. WheatSM V5.0 exhibits characteristics that combine mechanistic and practical aspects, particularly in terms of algorithm mechanisms, simulation scales, and operating systems. This gives it an advantage over other models such as DSSAT, WOFOST, and APSIM. Wu et al. [40] conducted a comparison of WheatSM with these models for winter wheat development and found that WheatSM performed at a relatively high level, especially for late sowing conditions. Chen et al. [29] compared the algorithms of development, biomass, and yield formation among various wheat models, both domestic and international, using the WMAIP platform. The conclusion drawn was that each algorithm of WheatSM was excellent. However, despite the improvements made to WheatSM V5.0, there is still room for further enhancement. The simulation of the leaf area index remains a challenge and requires validation with more refined experimental data.
In future iterations of this research, our focus will center on refining the calibration of the LAI and enhancing the representation of soil processes, but also on establishing a wheat production management system. This is anticipated to improve the accuracy of simulating LAI, biomass, soil water content, and nitrogen levels. Furthermore, we plan to evaluate the applicability of our model under a range of environmental stressors, including high and low temperatures, drought, and waterlogging conditions. Alongside these refinements, we intend to leverage advanced machine learning techniques to further fine-tune the calibration of our model parameters. The application of machine learning algorithms could potentially uncover complex patterns and relationships within data that might not be apparent through traditional analytical methods, thereby enhancing the precision and reliability of our model [41]. Furthermore, the model could be tested and validated using independent datasets from different geographical locations and climatic conditions to ensure its robustness and reliability for wider applications. The establishment of a practical wheat production management system is a cornerstone for our future work. This system could not only enhance our current research but also aim to directly assist real-world wheat production processes, thereby contributing significantly to the overall efficiency and effectiveness of wheat farming operations.

5. Conclusions

This comprehensive study successfully developed WheatSM V5.0, which was calibrated and validated using multi-year field experiment data through sensitivity analysis. This newly constructed model was then integrated into the AgroStudio platform. Sensitivity analysis revealed that the jointing stage of wheat growth was most affected by the temperature coefficient p22 during the emergence–jointing stage. Additional sensitivity parameters, including k4, k3, p3, and p4, were found to be important during the maturity stage compared to the jointing stage. The parameters with the highest sensitivity for biomass and yield were pmax and tr1, respectively. Overall, WheatSM V5.0 demonstrated excellent performance in simulating soil water storage, soil nitrate content, nitrogen accumulation, growth stages, biomass, and yield. However, the simulation of the leaf area index showed a relatively poor performance. Nevertheless, the integration of WheatSM V5.0 into the AgroStudio platform proved successful, enabling the fast simulation of multiple regions and facilitating cross-platform communication from PC to cloud environments.
Building upon the achievements of this comprehensive study, it is evident that the development of WheatSM V5.0 marks a significant advancement in crop modeling and agricultural technology. However, as we look ahead, there are valuable insights that could guide future research and improvements. The key avenue for future work could involve refining the calibration of LAI and enhancing soil process representations in our model, alongside utilizing machine learning techniques for further precision. We aim to ensure the model’s robustness and broad applicability by validating it under diverse environmental conditions and geographical locations. Overall, this work not only lays a foundation for advanced crop modeling but also underscores the importance of ongoing innovations to address evolving agricultural challenges.

Author Contributions

Conceptualization, X.C.; methodology, X.C. and L.F.; Software, X.C., Q.X. and H.B.; Formal analysis, H.B.; Acquisition, analysis, and interpretation of data, X.C.; Writing—original draft preparation, X.C. and H.B.; Writing—review and editing, X.C., H.B., Q.X., J.Z. and C.Z.; Visualization, X.C. and H.B.; Funding acquisition, L.F. and X.C. All authors have read and agreed to the published version of the manuscript.

Funding

This research was funded by the National Key Research and Development Program of China, Grant No. 2016YFD0300201, the Key Laboratory of Huang-Huai-Hai Smart Agricultural Technology, Ministry of Agriculture and Rural Affairs, Zhengzhou, China, Grant No. 202302 and the Pinduoduo-China Agricultural University Research Fund, Grant No. PC2023B01004.

Data Availability Statement

The data presented in this study are available on request from the corresponding author. The data are not publicly available because the data need to be used in future work.

Conflicts of Interest

The authors declare no conflict of interest.

References

  1. Zhao, G.; Chang, X.; Wang, D.; Tao, Z.; Wang, Y.; Yang, Y.; Zhu, Y. General situation and development of wheat production. Crops 2018, 4, 1–7. [Google Scholar]
  2. Zhang, Y.; Wang, Z.; Zhou, S.; Wang, B.; Xue, Y.; Liu, Y.; Wang, C.; Xi, W. Current hotspots of international wheat research. Sci. Technol. Rev. 2014, 32, 64–69. [Google Scholar]
  3. Zhang, T.; van der Wiel, K.; Wei, T.; Screen, J.; Yue, Y.; Zheng, B.; Selten, F.; Bintanja, R.; Anderson, W.; Blackport, R.; et al. Increased wheat price spikes and larger economic inequality with 2 °C global warming. One Earth 2022, 5, 907–916. [Google Scholar] [CrossRef]
  4. Zhao, J.; Han, T.; Wang, C.; Jia, H.; Worqlul, A.W.; Norelli, N.; Zeng, Z.; Chu, Q. Optimizing irrigation strategies to synchronously improve the yield and water productivity of winter wheat under interannual precipitation variability in the North China Plain. Agric. Water Manag. 2020, 240, 106298. [Google Scholar] [CrossRef]
  5. Li, Y.; Xue, C.; Yang, X.; Wang, J.; Liu, Y.; Wang, E. Reduction of yield risk of winter wheat by appropriate irrigation based on APSIM model. Trans. Chin. Soc. Agric. Eng. 2009, 25, 35–44. [Google Scholar]
  6. Xiao, L.; Liu, L.; Qiu, X.; Tang, L.; Cao, W.; Zhu, Y.; Liu, B. Testing the responses of low temperature stress routine to low temperature stress at jointing and booting in wheat. Sci. Agric. Sin. 2021, 54, 504–521. [Google Scholar]
  7. Wang, N.; Wang, J.; Feng, L.; Pan, X.; Yu, W. Modeling the impact of “double-delay” technology on yield of wheat-maize cropping system in the North China Plain. Chin. J. Agrometeorol. 2015, 36, 611–618. [Google Scholar]
  8. Moeller, C.; Pala, M.; Manschadi, A.M.; Meinke, H.; Sauerborn, J. Assessing the sustainability of wheat-based cropping systems using APSIM: Model parameterisation and evaluation. Aust. J. Agric. Res. 2007, 58, 75–86. [Google Scholar] [CrossRef]
  9. Sun, S.; Yang, X.; Lin, X.; Sassenrath, G.F.; Li, K. Climate-smart management can further improve winter wheat yield in China. Agric. Syst. 2018, 162, 10–18. [Google Scholar] [CrossRef]
  10. Wang, C.; Zhao, J.; Gao, Z.; Feng, Y.; Laraib, I.; Chen, F.; Chu, Q. Exploring wheat-based management strategies to balance agricultural production and environmental sustainability in a wheat-maize cropping system using the DNDC model. J. Environ. Manag. 2022, 307, 114445. [Google Scholar] [CrossRef]
  11. Feng, L. WheatSM-a Model to Simulate Wheat Growth and Development; Nanjing Agricultural University: Nanjing, China, 1995. [Google Scholar]
  12. Feng, L.; Gao, L.; Jin, Z.; Ma, X. Studies on the simulation model for wheat phenology. Acta Agron. Sin. 1997, 23, 414–428. [Google Scholar]
  13. Yao, J. Establishment of Wheat Growth Simulation Modules in Hourly Time Step; China Agricultural University: Beijing, China, 2012. [Google Scholar]
  14. Li, N. Software Design of Wheat Growth and Development Simulation Model (WheatSM) V4.0; China Agricultural University: Beijing, China, 2015. [Google Scholar]
  15. Jin, X.; Chen, X.; Gong, Z.; Feng, L. Parameter adjustment and optimization methods for the WheatSM. J. Agric. Big Data 2021, 3, 13–22. [Google Scholar]
  16. Gao, L.; Jin, Z.; Zheng, G.; Feng, L.; Zhang, L.; Shi, C.; Ge, D. Wheat cultivation simulation optimization decision system (WCSODS). Jiangsu J. Agric. Sci. 2000, 16, 65. [Google Scholar]
  17. Li, T.; Li, Y.; Tian, H.; Guo, Q. Simulation of growth and development of winter wheat in hebi area based on optimization of wheatsm model parameters. Meteorol. Environ. Sci. 2018, 41, 103–107. [Google Scholar]
  18. Guo, Q.; Li, Y.; Tian, H. Parameter optimization and validation of the WheatSM model for growth and development of wheat. J. Triticeae Crops 2017, 37, 1571–1580. [Google Scholar]
  19. Hou, Y.; He, L.; Jin, N.; Zheng, C.; Liu, W.; Zhang, L. Establishment and application of crop growth simulating and monitoring system in China. Trans. Chin. Soc. Agric. Eng. 2018, 34, 165–175. [Google Scholar]
  20. Sun, L.; Feng, L. Assessing the climate risk to crop yield of winter wheat using crop growth models. Trans. Chin. Soc. Agric. Eng. 2005, 21, 106–110. [Google Scholar]
  21. Rosenzweig, C.; Jones, J.W.; Hatfield, J.L.; Ruane, A.C.; Boote, K.J.; Thorburn, P.; Antle, J.M.; Nelson, G.C.; Porter, C.; Janssen, S.; et al. The Agricultural Model Intercomparison and Improvement Project (AgMIP): Protocols and pilot studies. Agric. For. Meteorol. 2014, 54, 2052–2067. [Google Scholar] [CrossRef]
  22. Tedeschi, L.O.; Cavalcanti, L.F.L.; Fonseca, M.A.; Herrero, M.; Thornton, P.K. The evolution and evaluation of dairy cattle models for predicting milk production: An agricultural model intercomparison and improvement project (AgMIP) for livestock. Anim. Prod. Sci. 2012, 170, 166–182. [Google Scholar] [CrossRef]
  23. Bassu, S.; Brisson, N.; Durand, J.L.; Boote, K.; Lizaso, J.; Jones, J.W.; Rosenzweig, C.; Ruane, A.C.; Adam, M.; Baron, C.; et al. How do various maize crop models vary in their responses to climate change factors? Global Chang. Biol. 2014, 20, 2301–2320. [Google Scholar] [CrossRef]
  24. Holzworth, D.; Huth, N.I.; Fainges, J.; Brown, H.; Zurcher, E.; Cichota, R.; Verrall, S.; Herrmann, N.I.; Zheng, B.; Snow, V. APSIM Next Generation: Overcoming challenges in modernising a farming systems model. Environ. Model. Softw. 2018, 103, 43–51. [Google Scholar] [CrossRef]
  25. Midingoyi, C.A.; Pradal, C.; Enders, A.; Fumagalli, D.; Raynal, H.; Donatelli, M.; Athanasiadis, I.N.; Porter, C.; Hoogenboom, G.; Holzworth, D.; et al. Crop2ML: An open-source multi-language modeling framework for the exchange and reuse of crop model components. Environ. Model. Softw. 2021, 142, 105055. [Google Scholar] [CrossRef]
  26. de Wit, A.; Boogaard, H.; Fumagalli, D.; Janssen, S.; Knapen, R.; van Kraalingen, D.; Supit, I.; van der Wijngaart, R.; van Diepen, K. 25 years of the WOFOST cropping systems model. Agric. Syst. 2019, 168, 154–167. [Google Scholar] [CrossRef]
  27. Rodriguez, A.V.C.; Ober, E.S. AquaCropR: Crop growth model for R. Agronomy 2019, 9, 7. [Google Scholar] [CrossRef]
  28. Chen, X.; Feng, L.; Bai, H.; Yu, W. Comparison of three water stress algorithms based on the integration platform of wheat model algorithms. Trans. Chin. Soc. Agric. Eng. 2021, 37, 47–57. [Google Scholar]
  29. Chen, X.; Feng, L.; Bai, H.; Wang, C.; Wang, J.; Yu, W. Establishment of wheat model algorithms integration platform and algorithm comparison. Trans. Chin. Soc. Agric. Eng. 2022, 53, 237–249. [Google Scholar]
  30. Wang, B. Characteristics of Yield Formation and Water-Nitrogen Use in Extremely-Late Sown Winter Wheat under Limited Irrigation; China Agricultural University: Beijing, China, 2016. [Google Scholar]
  31. Xu, X. Performance and Coordination of Source and Sink System in Winter Wheat under Water-Saving and High-Yielding Irrigation Patterns; China Agricultural University: Beijing, China, 2018. [Google Scholar]
  32. Li, J. Improving Grain Yield and Resource Use Efficiency by Optimizing Water and Nitrogen Interaction with Micro-Irrigation in Winter Wheat; China Agricultural University: Beijing, China, 2019. [Google Scholar]
  33. Ma, F.; Li, D.; Cai, J.; Jiang, D.; Cao, W.; Dai, T. Responses of wheat seedlings root growth and leaf photosynthesis to drought stress. Chin. J. Appl. Ecol. 2012, 23, 724–730. [Google Scholar]
  34. Asseng, S.; Richter, C.; Wessolek, G. Modelling root growth of wheat as the linkage between crop and soil. Plant Soil 1997, 190, 267–277. [Google Scholar] [CrossRef]
  35. Morris, M.D. Factorial sampling plans for preliminary computational experiments. Technometrics 1991, 33, 161–174. [Google Scholar] [CrossRef]
  36. Shi, X.; Liang, H.; Zhou, F.; Hu, K. Sensitivity analysis and parameter estimation for soil-rice system model. Trans. Chin. Soc. Agric. Eng. 2020, 51, 252–271. [Google Scholar]
  37. Liu, J.; Chu, Q.; Wang, G.; Chen, F.; Zhang, Y. Simulating yield gap of winter wheat in response to nitrogen management in North China Plain based on DSSAT model. Trans. Chin. Soc. Agric. Eng. 2013, 29, 124–129. [Google Scholar]
  38. Chen, H.; Li, Y.; Tian, H.; Zhang, F.; Li, T.; Guo, Q. Improvement of regional-scale winter wheat growth modeling with sub-pixel information. Chin. J. Ecol. 2018, 37, 2221–2228. [Google Scholar]
  39. Li, Y.; Chen, H.; Tian, H.; Yu, W. Estimation of winter wheat yield based on coupling remote sensing information and WheatSM model. Chin. J. Ecol. 2019, 38, 2258–2264. [Google Scholar]
  40. Wu, L.; Feng, L.; Zhang, Y.; Gao, J.; Wang, J. Comparison of five wheat models simulating phenology under different sowing dates and varieties. Agron. J. 2017, 109, 1280–1293. [Google Scholar] [CrossRef]
  41. Tao, F.; Huang, Y.; Hungate, B.A.; Manzoni, S.; Frey, S.D.; Schmidt, M.W.I.; Reichstein, M.; Carvalhais, N.; Ciais, P.; Jiang, L.; et al. Microbial carbon use efficiency promotes global soil carbon storage. Nature 2023, 618, 981–985. [Google Scholar] [CrossRef] [PubMed]
Figure 1. Schematic diagram of the major processes for WheatSM V5.0.
Agronomy 13 02411 g001
Figure 2. Sensitivity of model input parameters to wheat growth and development simulation.
Agronomy 13 02411 g002
Figure 3. Calibration and validation of jointing, anthesis, maturity, LAI, above-ground biomass, soil water storage, soil nitrate nitrogen residue, wheat total nitrogen accumulation and yield.
Agronomy 13 02411 g003
Figure 4. The interface of AgroStudio-WheatSM.
Agronomy 13 02411 g004
Table 1. Data sources for winter wheat.
ExperimentYearCultivarTreatmentSource
I2011–2014Jimai_22Four sowing date × Three irrigationWang [30]
II2013–2016Jimai_22Twelve irrigationXu [31]
III2016–2018Jimai_22Four irrigation × Three nitrogenLi [32]
IV2017–2019Jimai_22Six sowing dateField experiment [29]
V2017–2019Jimai_22Seven nitrogenField experiment [28]
Table 2. Data used for WheatSM V5.0 calibration and validation in each experiment.
ExperimentCalibration Group (Year)Validation Group (Year)
I2011–20132013–2014
II2013–20152015–2016
III2016–20172017–2018
IV2017–20182018–2019
V2017–20182018–2019
Table 3. Genetic parameters for winter wheat variety Jimai_22.
ModualParameter
Name
DefinitionUnitRange of Value for ParameterValue
Growth
period
k1The basic development coefficient in sowing to emergence stage-−2.0~−1.0−1.07
p1The temperature coefficient in sowing to emergence stage-0.1~1.50.550
k21The basic development coefficient in vernalization phase-−3.5~−2.5−3.05
p21The temperature coefficient in vernalization phase-0.1~1.50.962
k22The basic development coefficient in photoperiod phase-−3.5~−2.5−2.854
p22The temperature coefficient in photoperiod phase-0.1~1.50.390
q2The genetic photoperiod coefficient in photoperiod phase-0.10~1.00.840
k3The basic development coefficient in jointing to anthesis stage-−3.5~−2.5−2.90
p3The temperature coefficient in jointing to anthesis stage-−0.1~1.51.330
k4The basic development coefficient in anthesis to maturity stage-−3.5~−2.5−3.476
p4The temperature coefficient in anthesis to maturity stage-0.1~1.51.18
BiomasspaInitial slope of the optical-response curveg MJ−111~2019.5
pmaxThe maximum photosynthetic intensity at light saturation pointg m−2 h−13.0~7.56.570
slamaxMaximum specific leaf aream2 g−10.02~0.040.021
slaminMinimum specific leaf aream2 g−10.01~0.020.017
Yieldtr1The transfer rate of photosynthate to grain before headingkg kg−10.15~0.350.210
tr2The transfer rate of photosynthate to grain after headingkg kg−10.7~1.00.950
Disclaimer/Publisher’s Note: The statements, opinions and data contained in all publications are solely those of the individual author(s) and contributor(s) and not of MDPI and/or the editor(s). MDPI and/or the editor(s) disclaim responsibility for any injury to people or property resulting from any ideas, methods, instructions or products referred to in the content.

