Article

Determination of Genetic Diversity of Some Upland and Sea Island Cotton Genotypes Using High-Resolution Capillary Electrophoresis Gel

Department of Agricultural Biotechnology, Faculty of Agriculture, Igdır University, Igdır 76000, Turkey
Agronomy 2023, 13(9), 2407; https://doi.org/10.3390/agronomy13092407
Submission received: 21 August 2023 / Revised: 11 September 2023 / Accepted: 15 September 2023 / Published: 18 September 2023
(This article belongs to the Special Issue Genetic Analysis in Crops)

Abstract

:
Cotton is a major source of natural fibre for the global textile industry and is also an important oilseed crop. Cotton fibre is the main source of textiles, the seeds are used for oil and the remaining bagasse is used as high-protein animal feed. In addition, cotton’s so-called short fibre is used in more than 50 industries. Cotton breeding is generally based on crossing the best yielding and fibre quality genotypes. However, cotton breeding programmes are negatively affected by the narrow genetic diversity of varieties. It is for this reason that the identification of genetic resources and the disclosure of genetic diversity are so important. Here, the genetic diversity of G. hirsutum and G. barbadense genotypes was determined using high-resolution capillary gel electrophoresis. Using 19 EST-SSR markers, a total of 47 genotypes were screened. The PIC values of the markers used ranged from 0.268 to 0.889. The mean PIC value was calculated to be 0.603. In terms of clustering, PCoA and population structure analyses gave similar results, and the genotypes could be divided into three main groups. Genetic admixture with G. hirsutum was found in some genotypes of the G. barbadense species. We can conclude that (i) the EST-SSR markers used in this study are effective in the determination of genetic diversity, (ii) the genetic diversity should be increased through the collection of genetic resources and (iii) the genetic EST-SSR markers in this study should be considered in breeding programmes by using them in QTL studies.

1. Introduction

There are about 52 cotton species with nine different cytogenetic genomes. Of these, eight are diploids and one is tetraploid [1]. There are six cotton species with a tetraploid genome. These species are Gossypium hirsutum, G. barbadense, G. tomentosum, G. mustelinum, G. darwinii and G. ekmanianum. The genome structure of these cotton species is the (AD)n genome, and it has 52 chromosomes [2,3]. G. hirsutum and G. barbadense have tetraploid genomes. They are the most widely cultivated species in the world [4]. Apart from these two tetraploid genomes, varieties belonging to the G. herbaceum and G. arboreum species, which have a diploid genome, are also grown, albeit in small amounts [5]. The cotton plant is used for both its fibre and its oil [6]. The cotton plant is the source of 35% of the world’s fibre [7]. Cottonseed oil can be used in the production of biodiesel [8] and edible oils [9]. For this reason, the genetic resources of such an important crop must be the subject of a comprehensive evaluation. For breeders, the role of genetic resources is very important [10]. Genetic diversity is needed even more in today’s conditions, with sudden climate changes and increasing biotic and abiotic stress factors because biotic and abiotic stress factors can cause yield loss of crops [3,11,12]. For this reason, one of the biggest challenges faced by plant breeders is yield losses due to sudden climate changes. As a solution, breeders have to develop high-yielding varieties with biotic and abiotic stress tolerance [13]. Genetic diversity should be used for the development of these cultural varieties.
Although genetic resources are important in biological research and molecular biology studies, they are also very important for the understanding of genetic variation in breeding studies [14]. For this reason, the collection, conservation and evaluation of genetic resources will greatly contribute to breeding studies for the development of new varieties [6,14,15]. It is also difficult to study genetic variation using classical methods because of the continuous collection and multiplication of germplasm. This requires a lot of labour, wastes a lot of time and can lead to mistakes. In addition, classical methods and morphological methods used to determine genetic diversity can give wrong information to researchers because they are affected by environmental conditions. This may even cause a loss of time for subsequent studies [16]. The solution is to record genetic diversity using genetic markers, which are not affected by space and time and can measure allele frequencies directly [17,18,19]. Molecular markers are used extensively in determining genetic diversity. Molecular markers are also used for a wide range of other purposes, such as understanding the genetic structure of plants, evaluating variations and identifying, verifying and developing genetic linkage groups [20]. The most-used markers are random amplified polymorphic DNAs (RAPDs), amplified fragment length polymorphisms (AFLPs), simple sequence repeats (SSRs) [21], single-nucleotide polymorphisms (SNPs) and sequence-characterized amplified regions (SCARs) [20]. One of the most preferred among these markers is SSR markers. Some of the reasons why SSR markers are preferred are that they are PCR-based, which makes them easy to use, reliable and reproducible, as well as co-dominant (distinguish parents from offspring, distinguish homozygous from heterozygous individuals) and homogeneously distributed in the genome, and they have multi-allele and multi-locus properties [22,23].
The traditional agarose gel electrophoresis method for visualising amplicons in the detection of genetic diversity using DNA markers is more widely used because it is more economical. Compared to capillary gel electrophoresis, this method was reported to be weaker in identifying genetic diversity [24]. The most important feature of the capillary gel electrophoresis method is that it reliably distinguishes between molecular markers down to 1 or 2 bp and quickly reveals the difference between amplicons [25]. As more alleles are detected, the use of capillary electrophoresis is more informative in determining genetic diversity.
In this study, the genetic diversity of a total of 47 cultivars belonging to both G. hirsutum and G. barbadense species was investigated using 19 microsatellite markers (EST-SSRs) and high-resolution capillary gel electrophoresis. The main objective of this study was the genetic diversity of the cotton plant, which has an important place in the world and in our country.

2. Materials and Methods

2.1. Plant Material

In total, 47 varieties from the Turkish gene pool were used in this study (Table 1). Two of these are genotypes of Texas Marker-1 (TM-1/Gossypium hirsutum) and Pima 3–79 (Gossypium barbadense species with double haploid characteristics), which are genetic standards. Ten of the genotypes used belong to the species G. barbadense, and the other thirty-seven genotypes belong to the species G. hirsutum. Through breeding studies, some of these genotypes have been developed in our country. Some have been introduced into our genetic resources from other countries. They are used in adaptation and breeding studies.

2.2. DNA Isolation

DNA isolation was performed by following the method of Aydin et al. for cotton seed [5]. To For DNA isolation, 5 seeds of each genotype were crushed under sterile conditions and the bulk method was used. A NanoDrop spectrophotometer was used to confirm the quality and quantity of the isolated genomic DNA (Maestrogen, Hsinchu City, Taiwan, MN-013), along with 1% agarose gel electrophoresis. For PCR studies, calculated and normalised amounts of gDNA were used.

2.3. PCR Amplification and SSR Markers

A total of 19 SSR markers were used in the PCR studies, including 12 EST-SSR primers developed by Wang et al. [26] and 7 EST-SSR markers developed by Karaca and Ince [6] (Table 2). PCR amplifications were performed in a volume of 25 µL. The PCR reaction included 85 ng of gDNA, 0.5 µM of each primer pair, 2.5 mM of MgCI2, 0.28 mM of dNTP and 1 unit of Taq DNA polymerase (Thermo Fisher Scientific, Waltham, MA, USA, Cat:EP0402), and 2.5 µL of 10× buffer was added. The PCR protocol Touch-Down PCR method was used, and the temperature was decreased by 0.5 °C at each cycle step for the first 10 cycles and continued for 30 cycles with the temperature of the 10th cycle. Pre-denaturation was performed at 94 °C for 3 min, 94 °C for 30 s, binding at 60 and 66 °C (primer binding temperature, Table 2) for 45 s, elongation at 72 °C for 1 min and final elongation at 72 °C for 10 min [27]. Amplifications were performed using a Thermo Fisher Scientific (Ref: A24812) thermal cycling device in PCR procedures.

2.4. Detection of PCR Amplicons

The PCR amplicons were detected using capillary gel electrophoresis. With this method, PCR products were performed on QIAxcel Advanced instrument (Qiagen, Hilden, Germany, Cat. No./ID:30237) using the QIAxcel DNA High Resolution Kit (Cat. No. 929002, Cartridge ID:C200714010). Amplicons were analysed using QIAxcel ScreenGel version 1.6. Capillary instrument raw data are given in PDF format in the Supplementary File S1.

2.5. Data Analysis

Different statistical tests were performed on the data obtained by analysing the amplicons. We investigated the polymorphism information content (PIC) for each marker [14], Jaccard’s coefficient with the Multi-Variate Statistical Package (MVSP, version 3.13O, Kovach Computing Services, Pentraeth, UK) for PCoA analysis, Bayesian statistics with MrBayes software v3.2.1 ×64 for phylogenetic dendogram [28] (one cold and three heated chains were run starting from a random tree for 10 million Markov chain Monte Carlo (MCMC) generations, with chains sampled every 100th cycle. Additionally, MrBayes software determined the average standard deviation of the split frequencies as 0.008794) and Structure software version 2.3.4 for population structure, and the results were extracted using the STRUCTURE HARVESTER online tool (http://taylor0.biology.ucla.edu/structureHarvester/) (accessed on 8 May 2023) to calculate the optimal K value [29,30]. PowerMarker v3.25 software was used for expected heterozygosity (He) and observed heterozygosity (Ho) analyses [31].

3. Results

3.1. Polymorphism Analysis of EST-SSR Markers

In this study, 47 cotton genotypes were screened using 19 EST-SSR markers. Accordingly, between 2 and 42 amplicons were observed with the primers used (Table 2). The lowest number of alleles was observed with primer MK086. The highest number of alleles was observed with primer GD08-420. A total of 280 alleles were analysed from 19 EST-SSR primers. An average of 14.7 amplicons were calculated per primer. Primers used in markers MK086, MK126 and MK129 had the lowest PIC values in 47 genotypes. PIC values were very high in the remaining 16 primers. The PIC values ranged from 0.268 (MK086) to 0.889 (GD02-301). While the average PIC value was 0.603, 11 EST-SSR markers (GA04-1418, GA07-410, GD01-295, GD02-301, GD03-2002, GD06-2808, GD08-420, GD09-1296, GD10-1664, MK105, MK173) were found to be above this average.
The expected average heterozygosity ratio for all primers was 0.620. The observed average heterozygosity ratio was 0.433. The lowest heterozygosity ratio was 0.293 for the MK086 marker and the highest was 0.898 for the GD02-301 marker. In addition, a total of 11 EST-SSR markers were above average. Similarly, marker GD02-301 had the highest Ho of 0.883, while marker MK126 had the lowest Ho of 0.043.

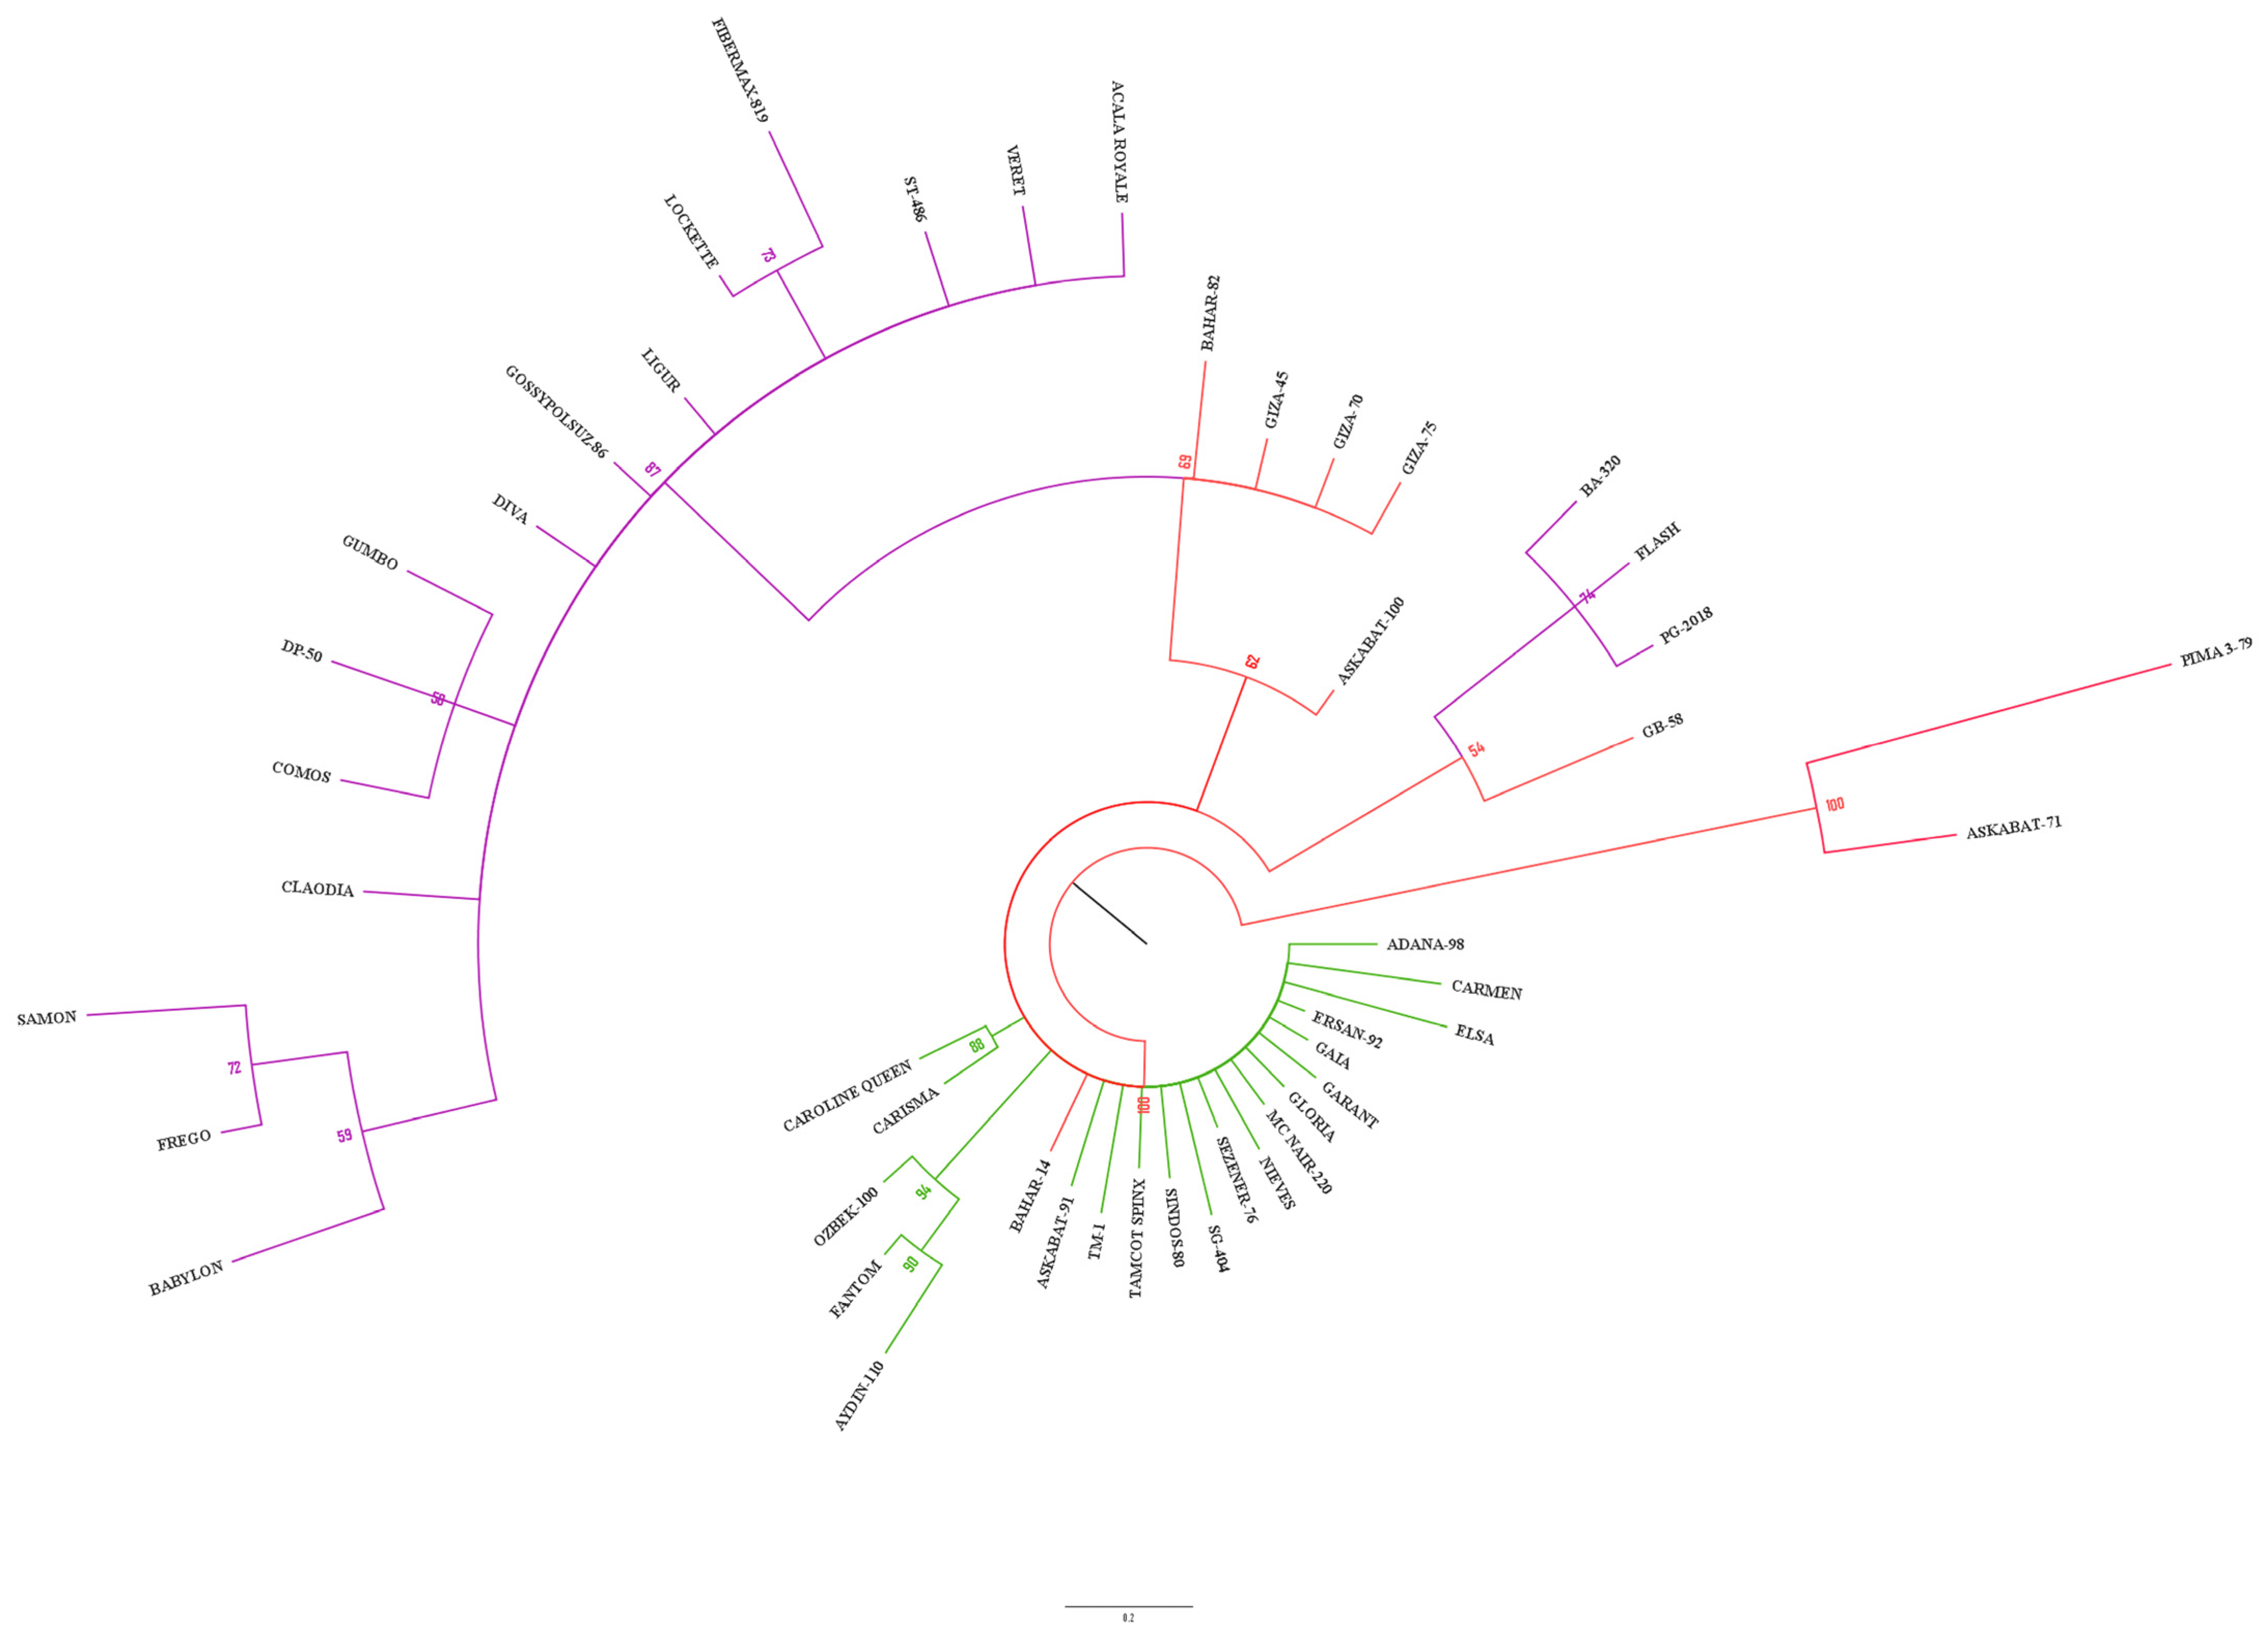
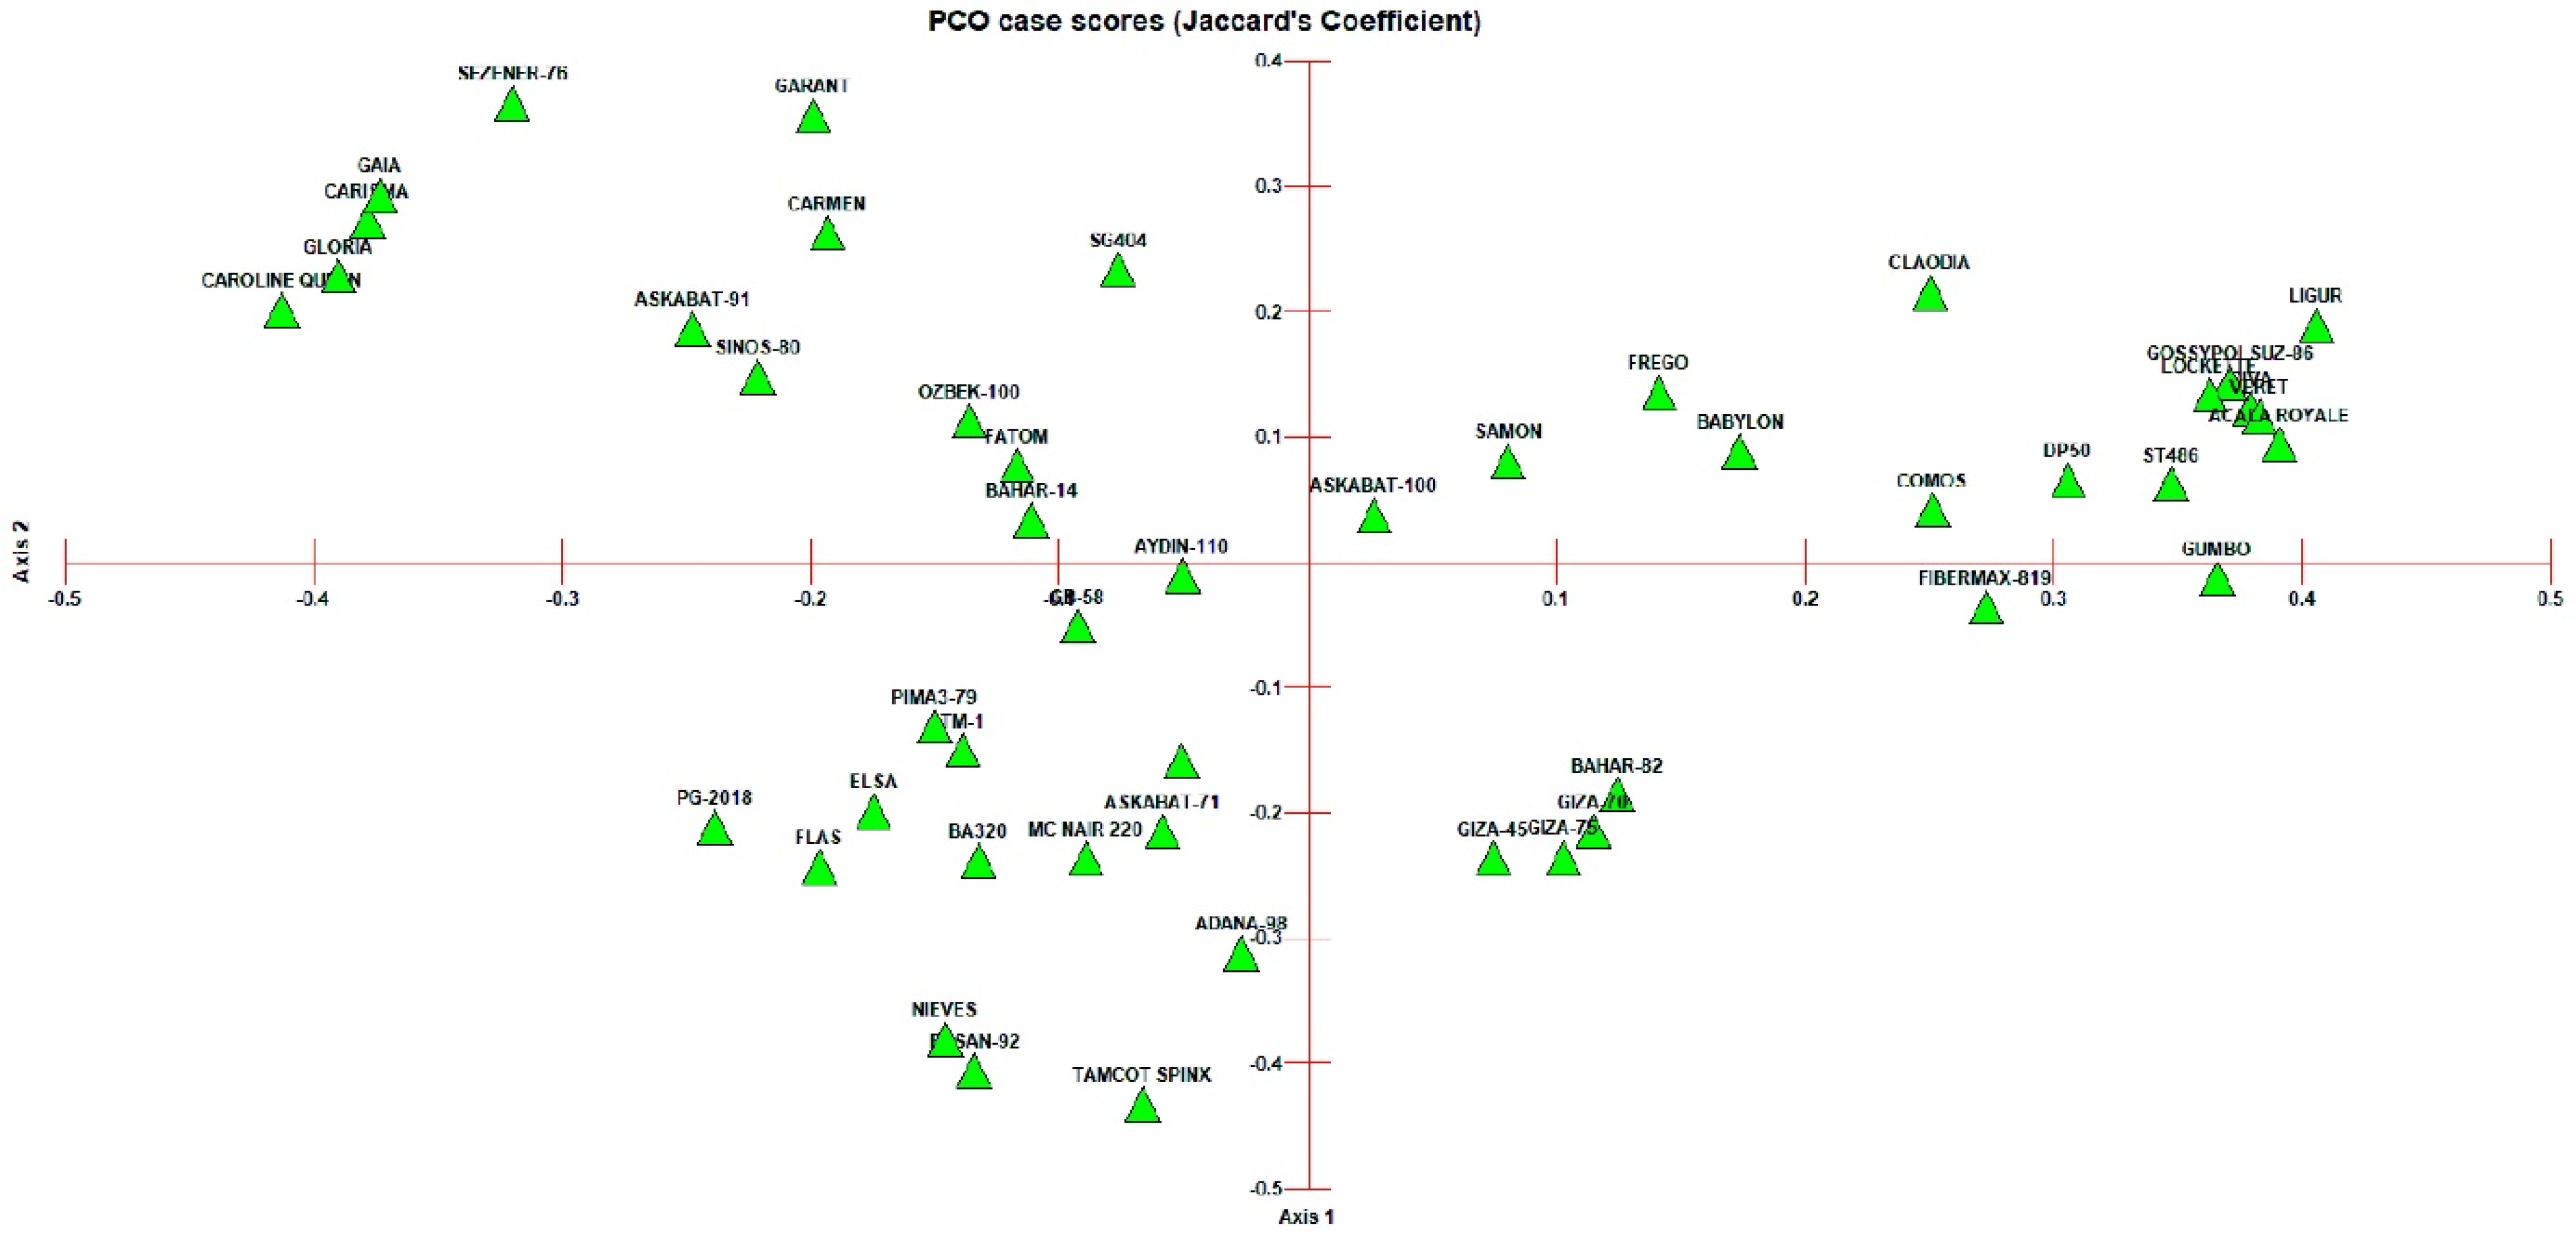
3.2. Clustering and PCoA Analysis

In accordance with the amplicons generated with the 19 EST-SSR markers, data from the 47 cotton genotypes used in the study were analysed. In this regard, Bayesian statistics using MrBayes was used to construct the phylogenetic tree (Figure 1). FigTree v1.4.4 was used to colour the tree constructed using Bayesian statistics.
In the clustering analysis, the genotypes Pima 3–79 (G. barbadense) and Askabat-71 (G. barbadense) differed from the other genotypes, with a post-probability value of 100%.
The remaining 45 genotypes were divided into different groups. They were coloured green, red and purple. The green- and purple-coloured ones are the genotypes that belong to the G. hirsutum species and the red-coloured ones are the genotypes that belong to the G. barbadense species. Of the green-coloured genotypes, G. barbadense species and cultivars are known to be Bahar-14 and Askabat-91. On the other hand, although there were genotypes belonging to the red-coloured G. barbadense species among the purple = stained genotypes, their clustering was observed as a different group. Only genotype GB-58 was grouped in a cluster with BA320, Flas and PG-2018, with a post-probability value of 54%.
Principal coordinates analysis (PCoA) was performed on the EST-SSR data using Jaccard’s similarity matrix to provide a different view of the genetic relationships between genotypes (Figure 2). When Jaccard’s similarity matrix was examined, the genetic similarity (GS) between genotypes was found to be between 0 and 0.412 (Supplementary Table S1). The most distant genotypes were Gumbo and Pima 3-79, with zero, and Gaia and Sezener-76, with 0.412. Genetic similarities with the Jaccard coefficient show that the similarities between the genotypes used are actually very low.
The genotypes are almost evenly distributed on the PCoA plot. Only in the lower right corner of the Axis 2 axis (the positive part of the X-axis and the negative part of the Y-axis) was the number of genotypes collected low, and more than half of the genotypes were cultivars belonging to the G. barbadense species. Some of the genotypes are grouped together in certain regions. Among these, the Caroline Queen, Gloria, Carisma, Gaia and Sezener-76 genotypes were grouped in the upper left shelf of Axis 2; the Ligur, Gosyypolsüz-86, Lockette, Diva, Veret and Acala Rpyale genotypes were closely grouped in the upper right shelf of Axis 1 (Figure 2).

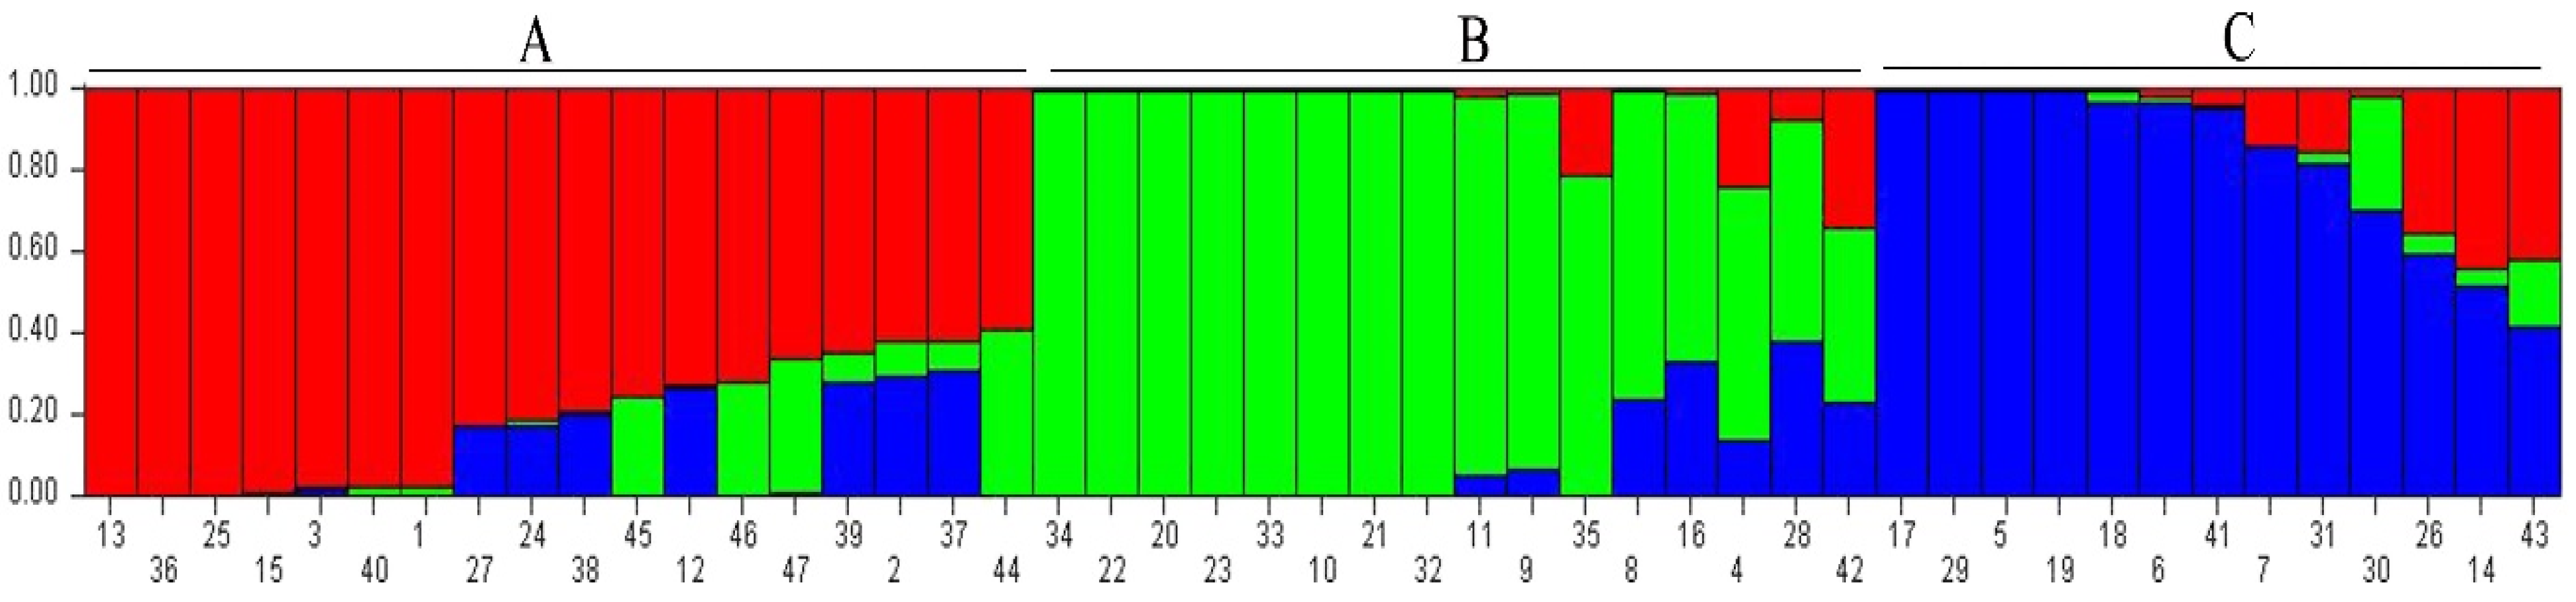
3.3. Population Structure Analysis

Population analysis was performed on 47 cotton genotypes using 280 alleles belonging to 19 markers obtained using EST-SSR markers. Bayesian clustering for population analysis was performed using SUTRUCTURE v2.3.4 software. Using the STRUCTURE software, the analysis was carried out with 10,000 burn-in periods and 100,000 replicates, and the Delta K value was 3 (Figure 3). This result showed that the 47 cotton genotypes were divided into three groups. Genotypes with a membership coefficient of 0.8 or greater were considered pure [31]. Of the 47 cotton genotypes used, only 30 were identified as pure in this case. According to the number in Table 1, genotypes 1, 3, 5, 6, 7, 9, 10, 11, 13, 15, 17, 18, 19, 20, 21, 22, 23, 24, 25, 27, 29, 30, 31, 32, 33, 34, 36, 38, 40 and 41 were considered pure.
The groupings according to the blotting technique are also shown in Figure 4. According to this figure, 18 genotypes were calculated in group A, 16 in group B and 13 in group C. The group with the lowest number of genotypes is group C, and in this group, there are two genotypes of G. barbadense (Ashgabat-91 and Bahar-14), in contrast to G. hirsutum. In group B, only 1 genotype out of 16 belongs to G. barbadense (Askabat-100). Group A is the most populated group and contains 18 genotypes, of which 7 belong to G. barbadense.
The Pima-79 and G.B-58 genotypes of the G. barbadense species in group A were confused with group C, while the genotypes Askabat-71, Giza-45, Giza-70 and Giza-75 were confused with group B. The Bahar-82 (G. barbadense) genotype in group B showed confusion with group A. However, the Askabat-100 (G. barbadense) genotype showed confusion with both groups A and C. Apart from this, the Askabat-91 (G. barbadense) genotype in group C showed some confusion with group A.

4. Discussion

4.1. Effects of Molecular Markers on Population

Many marker techniques have been developed on the basis of DNA sequences and regions of the genome that have different characteristics. The purpose of the study determines the choice of marker techniques [32]. For studies such as genetic diversity and QTL identification, SSR markers are the preferred choice [33,34,35]. These markers have been developed for a wide range of crops and for cotton since the discovery of the EST-SSRs by Cardle et al. [6,36,37,38]. Some of the reasons why EST-SSR markers are the most preferred are that they are reliable and reproducible, co-dominant, cheap, easy to use and easily transferable between species [39]. They have been extensively used for genetic diversity in cotton [14,40,41], linkage studies [42], determination of abiotic stress tolerance [43] and mapping [44,45].
In this study, a total of 19 EST-SSR markers were used, which were developed for cotton by Wang et al. [26] and Karaca and Ince [6]. As the markers used are located in the expressed regions of the genome, this tells us that these markers have a high population discriminatory power, depending on the population used. Karaca and Ince [6] found that markers MK086, MK132, MK146 and MK173 were monomorphic in G. hirsutum and G. barbadense species through agarose gel electrophoresis (AGE). They reported that only the MK129 marker was polymorphic on conversion to the CAPS marker (with Hinf I restriction enzyme). However, we have observed that these markers form direct polymorphic amplicons with the capillary gel electrophoresis (CGE) method we have used. PIC values ranged from 0.268 to 0.858, and the mean PIC value was calculated as 0.501. Since the CGE method has a higher resolution, it is more advantageous than the AGE method and its information content has been reported by various researchers [24,46,47]. The EST-SSRs that were developed by Wang et al. [26] and the EST-SSRs that were used in our study have, in general, very similar repeat sequences. However, the PIC values of the markers ranged from 0.437 to 0.889. The average value was 0.663. In addition, the markers that were developed were located on different chromosomes of the A and D genomes that were selected at random. The PIC values of the markers in the D genome were also found to be higher than in the A genome in this study. Molecular data showed that all allopolyploids in Gossypium share a common ancestry, supporting the hypothesis that polyploid formation occurs only once [48]. Furthermore, Wendel [49] reported that each allopolyploid genome contains the chloroplast of genome A, the old-world cotton. The differences in genome D may therefore be responsible for the higher PIC values in genome D.

4.2. Cluster Analysis and Population Structure

Identifying genetic diversity is very important for conserving and using genetic resources and for breeding studies [14,31]. The genetic variability that results from the genetic relatedness and genetic diversity between groups of plants is of critical importance to the success of plant breeding [50,51]. Breeding studies can be greatly improved by better parental selection to produce different varieties [52]. The use of markers is important in genetic studies to identify heterotic groups, understand population structure, and distinguish between basic lineages [17]. Both cluster analysis and population structure were used to reveal the genotypic diversity in our unit.
The genetic relationship between G. hirsutum and G. barbadense was analysed through cluster analysis using Bayesian statistics. In the analysis, except for two genotypes (Bahar-14 and Askabat-91) belonging to the G. barbadense species, the remaining genotypes were grouped differently. Furthermore, Aydın [5] reported that some seeds of the Askabat-91 genotype had the same characteristics as G. hirsutum. There is therefore a high probability that seeds of this genotype are contaminated. Except for Pima 3–79, the other nine genotypes of G. barbadense (Giza-45, Giza-70, Giza-75, GB-58, originating from Egypt; Bahar-14, Bahar-82, Askabat-71, Askabat-91 and Askabat-100, originating from Turkmenistan) are cultivated for their fibre [5]. Although these varieties show G. barbadense characteristics, most of them have been hybridised with G. hirsutum. The main reason for this is that G. hirsutum species are more productive than G. barbadense. Therefore, when high-resolution methods are used to segregate alleles (e.g., capillary, polyacrylamide gel), more allelic similarity may occur. Clustering analysis separated Pima 3–79 and Aksabat-71 from other genotypes with 100% power. It has been reported that the Pima 3–79 genotype is a doubled haploid and is considered to be the genetic standard [5,6]. Therefore, the fact that this genotype is in another cluster can be related to Bayesian statistics. Accordingly, the genotype Askabat-71 is likely to contain high levels of genetic material belonging to the G. barbadense species. Therefore, it can be interpreted that the genotypes of Pima 3–79 and Askabat-71 are purer with respect to the species of G. barbadense. The clusters were determined by colouring the phylogenetic tree. Here, genotypes coloured purple and green are genotypes belonging to G. hirsutum species, while those coloured red are genotypes belonging to G. barbadense species. Genotypes belonging to G. hirsutum species formed two distinct clusters in the clustering analysis. While the purple cluster contained 18 genotypes, the green cluster separated them with 19 genotypes. In other words, when examined as a G. hirsutum species, it is clear that there are two different populations here. The cluster marked in purple contains the Acale Royale, ST-486 and DP-50 genotypes, known as the old ones. As most of the cotton genotypes in this group have been developed by crossbreeding, it should be noted that they carry the same alleles as the old cotton genotypes. The level of variation is also negatively affected by the fact that cotton’s genetic base has a narrow genetic structure compared to other crops [41,53,54]. The development of cotton varieties is generally based on the use of existing varieties. This leads to the protection of the narrow genetic structure. However, researchers are conducting crossbreeding studies with wild species other than cultivated varieties of cotton plants to increase variation [55]. The basis of these studies is to reveal the characteristics of the cotton genome and to expand the narrow genetic structure. For example, the development of chromosome substitution lines is entirely aimed at discovering the properties of genes on the chromosome and understanding chromosome structures [56]. In terms of population structure, the 47 genotypes in use were divided into three main groups. Of these, 30 genotypes were accepted as pure and the remaining 17 genotypes were concluded to be mixed. When this analysis is examined, it can be interpreted that heterozygosity is low. The high number of pure individuals is an indication that the variation is low and new studies should be initiated to increase this variation. Although pure lines are used in crossbreeding studies, researchers running breeding programmes prefer to have a high level of variation in order to develop varieties with the desired characteristics.

5. Conclusions

In this study, the genetic diversity of G. hirsutum and G. barbadense genotypes was investigated using different statistical methods. Although the PIC values of the EST-SSR markers used were found to be high for this population, PCoA, clustering and population structure analyses gave similar results, and it was concluded that the genetic diversity of the species was low. These studies and analyses should be part of a variety of approaches to the coverage of genetic resources and the enhancement of genetic variation. The use of EST-SSR markers in QTL studies is also of great importance. As these markers are the parts of the gene that can be directly expressed, they will be useful in developing cotton varieties with the desired characteristics.

Supplementary Materials

The following supporting information can be downloaded at: https://www.mdpi.com/article/10.3390/agronomy13092407/s1, Table S1: Cluster analysis; File S1: Capillary instrument raw data.

Funding

This research received no external funding.

Data Availability Statement

Data is contained within the article and Supplementary Materials.

Conflicts of Interest

The author declares no conflict of interest.

References

  1. Wang, K.; Wendel, J.F.; Hua, J. Designations for individual genomes and chromosomes in Gossypium. J. Cotton Res. 2018, 1, 3. [Google Scholar] [CrossRef]
  2. Grover, C.E.; Zhu, X.; Grupp, K.K.; Jareczek, J.J.; Gallagher, J.P.; Szadkowski, E.; Seijo, J.G.; Wendel, J.F. Molecular confirmation of species status for the allopolyploid cotton species, Gossypium ekmanianum Wittmack. Genet. Resour. Crop Evol. 2015, 62, 103–114. [Google Scholar] [CrossRef]
  3. Anwar, K.; Joshi, R.; Dhankher, O.P.; Singla-Pareek, S.L.; Pareek, A. Elucidating the response of crop plants towards individual, combined and sequentially occurring abiotic stresses. Int. J. Mol. Sci. 2021, 22, 6119. [Google Scholar] [CrossRef] [PubMed]
  4. Witt, T.W.; Ulloa, M.; Schwartz, R.C.; Ritchie, G.L. Response to deficit irrigation of morphological, yield and fiber quality traits of upland (Gossypium hirsutum L.) and Pima (G. barbadense L.) cotton in the Texas High Plains. Field Crops Res. 2020, 249, 107759. [Google Scholar] [CrossRef]
  5. Aydın, A. A Study on the Molecular Characterization of Some Commercial Cotton Varieties Registered in Turkey. Ph.D. Dissertation, Akdeniz University, Antalya, Turkey, 2018. [Google Scholar]
  6. Karaca, M.; Ince, A.G. New non-redundant microsatellite and CAPS-microsatellite markers for cotton (Gossypium L.). Turk. J. Field Crops 2011, 16, 172–178. [Google Scholar]
  7. Kumlay, A.M.; Eren, B.; Demirel, S.; Demirel, F.; Yıldırım, B. Reveal of Genetic Variation by iPBS Analysis in Some Cotton Varieties. Eur. J. Eng. Sci. Tech. 2021, 21, 67–73. [Google Scholar] [CrossRef]
  8. Rashid, U.; Anwar, F.; Knothe, G. Evaluation of biodiesel obtained from cottonseed oil. Fuel Process. Technol. 2009, 90, 1157–1163. [Google Scholar] [CrossRef]
  9. Sekhar, S.C.; Rao, B.V.K. Cottonseed oil as health oil. Pertanika J. Trop. Agric. Sci. 2011, 34, 17–24. [Google Scholar]
  10. Guo, Q.; Liu, J.; Li, J.; Cao, S.; Zhang, Z.; Zhang, J.; Zhang, Y.; Deng, Y.; Niu, D.; Su, L.; et al. Genetic diversity and core collection extraction of Robinia pseudoacacia L. germplasm resources based on phenotype, physiology, and genotyping markers. Ind. Crops Prod. 2022, 178, 114627. [Google Scholar] [CrossRef]
  11. Piasecka, A.; Kachlicki, P.; Stobiecki, M. Analytical methods for detection of plant metabolomes changes in response to biotic and abiotic stresses. Int. J. Mol. Sci. 2019, 20, 379. [Google Scholar] [CrossRef]
  12. Waqas, M.A.; Kaya, C.; Riaz, A.; Farooq, M.; Nawaz, I.; Wilkes, A.; Li, Y. Potential mechanisms of abiotic stress tolerance in crop plants induced by thiourea. Front. Plant Sci. 2019, 10, 1336. [Google Scholar] [CrossRef] [PubMed]
  13. Swarup, S.; Cargill, E.J.; Crosby, K.; Flagel, L.; Kniskern, J.; Glenn, K.C. Genetic diversity is indispensable for plant breeding to improve crops. Crop Sci. 2021, 61, 839–852. [Google Scholar] [CrossRef]
  14. Shi, J.; Zhang, Y.; Wang, N.; Xu, Q.; Huo, F.; Liu, X.; Yan, G. Genetic diversity and population structure analysis of upland cotton (Gossypium hirsutum L.) germplasm in China based on SSR markers. Genet. Resour. Crop Evol. 2023. [Google Scholar] [CrossRef]
  15. Ghuge, S.B.; Mehetre, S.S.; Chimote, V.P.; Pawar, B.D.; Naik, R.M. Molecular characterization of cotton genotypes using SSR, ISSR and RAPD markers in relation to fiber quality traits. J. Cotton Res. 2018, 32, 1–12. [Google Scholar]
  16. Kamaluddin; Khan, M.A.; Kiran, U.; Ali, A.; Abdin, M.Z.; Zargar, M.Y.; Ahmad, S.; Sofi, P.A.; Gulzar, S. Molecular Markers and Marker-Assisted Selection in Crop Plants. In Plant Biotechnology: Principles and Applications; Abdin, M., Kiran, U., Kamaluddin, Ali, A., Eds.; Springer: Singapore, 2017. [Google Scholar] [CrossRef]
  17. Tyagi, P.; Gore, M.A.; Bowman, D.T.; Campbell, B.T.; Udall, J.A.; Kuraparthy, V. Genetic diversity and population structure in the US Upland cotton (Gossypium hirsutum L.). Theor. Appl. Genet. 2014, 127, 283–295. [Google Scholar] [CrossRef]
  18. Moiana, L.D.; Filho, P.S.V.; Gonçalves-Vidigal, M.C.; de Carvalho, L.P. Genetic diversity and population structure of upland cotton Brazilian cultivars (Gossypium hirsutum L. race latifolium H.) using SSR markers. Aust. J. Crop Sci. 2015, 9, 143–152. [Google Scholar]
  19. Morales, N.; Ogbonna, A.C.; Ellerbrock, B.J.; Bauchet, G.J.; Tantikanjana, T.; Tecle, I.Y.; Powell, A.F.; Lyon, D.; Menda, N.; Simoes, C.C.; et al. Breedbase: A digital ecosystem for modern plant breeding. G3 2022, 12, jkac078. [Google Scholar] [CrossRef]
  20. Younis, A.; Ramzan, F.; Ramzan, Y.; Zulfiqar, F.; Ahsan, M.; Lim, K.B. Molecular markers improve abiotic stress tolerance in crops: A review. Plants 2020, 9, 1374. [Google Scholar] [CrossRef]
  21. Fu, Y.B. Understanding crop genetic diversity under modern plant breeding. Theor. Appl. Genet. 2015, 128, 2131–2142. [Google Scholar] [CrossRef]
  22. Kumar, S.J.; Susmita, C.; Sripathy, K.V.; Agarwal, D.K.; Pal, G.; Singh, A.N.; Kumar, S.; Rai, A.K.; Simal-Gandara, J. Molecular characterization and genetic diversity studies of Indian soybean (Glycine max (L.) Merr.) cultivars using SSR markers. Mol. Biol. Rep. 2022, 49, 2129–2140. [Google Scholar] [CrossRef]
  23. Çelik, S. Genetic Diversity Analysis of Some Upland Cotton (Gossypium hirsutum L.) Genotypes Using SSR Markers. TJNS 2022, 11, 80–89. [Google Scholar]
  24. Zhao, X.; Zhang, Q.; Tang, X.; Xu, Y.; Du, Y.; Zhao, B.; Fan, X.; Zhang, X.; Zhang, W.; Wu, W.; et al. Multiplex detection of transgenic maize by microdroplet PCR combined with capillary gel electrophoresis. Acta Biochim. Biophys. Sin. 2019, 51, 535–538. [Google Scholar] [CrossRef] [PubMed]
  25. Cheng, B.; Xia, J.; Gong, J.; Yang, S. Application of capillary electrophoresis detection with fluorescent SSR markers in rice DNA fingerprint identification. Chin. J. Rice Sci. 2011, 25, 672–676. [Google Scholar]
  26. Wang, Q.; Fang, L.; Chen, J.; Hu, Y.; Si, Z.; Wang, S.; Chang, L.; Guo, W.; Zhang, T. Genome-wide mining, characterization and development of microsatellite markers in Gossypium species. Sci. Rep. 2015, 5, 10638. [Google Scholar] [CrossRef]
  27. Ince, A.G.; Karaca, M. Species-specific touch-down DAMD-PCR markers for Salvia species. J. Med. Plants Res. 2012, 6, 1590–1595. [Google Scholar]
  28. Ronquist, F.; Teslenko, M.; Van Der Mark, P.; Ayres, D.L.; Darling, A.; Höhna, S.; Larget, B.; Liu, L.; Suchard, M.A.; Huelsenbeck, J.P. MrBayes 3.2: Efficient Bayesian phylogenetic inference and model choice across a large model space. Syst. Biol. 2012, 61, 539–542. [Google Scholar] [CrossRef] [PubMed]
  29. Pritchard, J.K.; Stephens, M.; Donnelly, P. Inference of population structure using multilocus genotype data. Genetics 2000, 155, 945–959. [Google Scholar] [CrossRef]
  30. Eren, B.; Keskin, B.; Demirel, F.; Demirel, S.; Türkoğlu, A.; Yilmaz, A.; Haliloğlu, K. Assessment of genetic diversity and population structure in local alfalfa genotypes using iPBS molecular markers. Genet. Resour. Crop Evol. 2023, 70, 617–628. [Google Scholar] [CrossRef]
  31. Demirel, S.; Demirel, F. Molecular identification and population structure of emmer and einkorn wheat lines with different ploidy levels using SSR markers. Genet. Resour. Crop Evol. 2023. [Google Scholar] [CrossRef]
  32. Karaca, M.; Ince, A.G.; Aydin, A.; Elmasulu, S.Y.; Turgut, K. Microsatellites for genetic and taxonomic research on thyme (Thymus L.). Turk. J. Biol. 2015, 39, 147–159. [Google Scholar] [CrossRef]
  33. Nadeem, M.A.; Nawaz, M.A.; Shahid, M.Q.; Doğan, Y.; Comertpay, G.; Yıldız, M.; Hatipoğlu, R.; Ahmad, F.; Alsaleh, A.; Labhane, N.; et al. DNA molecular markers in plant breeding: Current status and recent advancements in genomic selection and genome editing. Biotechnol. Biotechnol. Equip. 2018, 32, 261–285. [Google Scholar] [CrossRef]
  34. Sabev, P.; Valkova, N.; Todorovska, E.G. Molecular markers and their application in cotton breeding: Progress and future perspectives. Bulg. J. Agric. Sci. 2020, 26, 816–828. [Google Scholar]
  35. Mishra, N.; Tripathi, M.K.; Tiwari, S.; Tripathi, N.; Gupta, N.; Sharma, A.; Solanki, R.S.; Tiwari, S. Characterization of soybean genotypes on the basis of yield attributing traits and SSR molecular markers. Innov. Sci. Technol. 2022, 3, 87–106. [Google Scholar]
  36. Cardle, L.; Ramsay, L.; Milbourne, D.; Macaulay, M.; Marshall, D.; Waugh, R. Computational and experimental characterization of physically clustered simple sequence repeats in plants. Genetics 2000, 156, 847–854. [Google Scholar] [CrossRef]
  37. Saha, S.; Karaca, M.; Jenkins, J.N.; Zipf, A.E.; Reddy, O.U.K.; Kantety, R.V. Simple sequence repeats as useful resources to study transcribed genes of cotton. Euphytica 2003, 130, 355–364. [Google Scholar] [CrossRef]
  38. Qureshi, S.N.; Saha, S.; Kantety, R.V.; Jenkins, J.N. EST-SSR: A new class of genetic markers in cotton. J. Cotton Sci. 2004, 8, 112–123. [Google Scholar]
  39. Karaca, M.; Ince, A.G.; Aydin, A.; Ay, S.T. Cross-genera transferable e-microsatellite markers for 12 genera of the Lamiaceae family. J. Sci. Food Agric. 2013, 93, 1869–1879. [Google Scholar] [CrossRef]
  40. Noormohammadi, Z.; Rahnama, A.; Sheidai, M. EST-SSR and SSR analyses of genetic diversity in diploid cotton genotypes from Iran. Nucleus 2013, 56, 171–178. [Google Scholar] [CrossRef]
  41. Saleem, M.A.; Amjid, M.W.; Ahmad, M.Q.; Riaz, H.; Arshad, S.F.; Zia, Z.U. EST-SSR based analysis revealed narrow genetic base of in-use cotton varieties of Pakistan. Pak. J. Bot. 2020, 52, 1667–1672. [Google Scholar] [CrossRef]
  42. Hinchliffe, D.J.; Turley, R.B.; Naoumkina, M.; Kim, H.J.; Tang, Y.; Yeater, K.M.; Li, P.; Fang, D.D. A combined functional and structural genomics approach identified an EST-SSR marker with complete linkage to the Ligon lintless-2 genetic locus in cotton (Gossypium hirsutum L.). BMC Genom. 2011, 12, 445. [Google Scholar] [CrossRef]
  43. Wang, B.H.; Zhu, P.; Yuan, Y.L.; Wang, C.B.; Yu, C.M.; Zhang, H.H.; Zhu, X.Y.; Wang, W.; Yao, C.B.; Zhuang, Z.M.; et al. Development of EST-SSR markers related to salt tolerance and their application in genetic diversity and evolution analysis in Gossypium. Genet. Mol. Res. 2014, 13, 3732–3746. [Google Scholar] [CrossRef]
  44. Han, Z.G.; Guo, W.Z.; Song, X.L.; Zhang, T.Z. Genetic mapping of EST-derived microsatellites from the diploid Gossypium arboreum in allotetraploid cotton. Mol. Genet. Genom. 2004, 272, 308–327. [Google Scholar] [CrossRef]
  45. Han, Z.; Wang, C.; Song, X.; Guo, W.; Gou, J.; Li, C.; Chen, X.; Zhang, T. Characteristics, development and mapping of Gossypium hirsutum derived EST-SSRs in allotetraploid cotton. Theor. Appl. Genet. 2006, 112, 430–439. [Google Scholar] [CrossRef] [PubMed]
  46. Sánchez-Pérez, R.; Ballester, J.; Dicenta, F.; Arús, P.; Martínez-Gómez, P. Comparison of SSR polymorphisms using automated capillary sequencers, and polyacrylamide and agarose gel electrophoresis: Implications for the assessment of genetic diversity and relatedness in almond. Sci. Hortic. 2006, 108, 310–316. [Google Scholar] [CrossRef]
  47. McCudden, C.R.; Mathews, S.P.; Hainsworth, S.A.; Chapman, J.F.; Hammett-Stabler, C.A.; Willis, M.S.; Grenache, D.G. Performance comparison of capillary and agarose gel electrophoresis for the identification and characterization of monoclonal immunoglobulins. Am. J. Clin. Pathol. 2008, 129, 451–458. [Google Scholar] [CrossRef] [PubMed]
  48. Wendel, J.F.; Brubaker, C.L.; Seelanan, T. The origin and evolution of Gossypium. In Physiology of Cotton; Springer: Dordrecht, The Netherlands, 2010; pp. 1–18. [Google Scholar]
  49. Wendel, J.F. New World tetraploid cottons contain Old World cytoplasm. Proc. Natl. Acad. Sci. USA 1989, 86, 4132–4136. [Google Scholar] [CrossRef]
  50. Rana, M.K.; Bhat, K.V. RAPD markers for genetic diversity study among Indian cotton cultivars. Curr. Sci. 2005, 88, 1956–1961. [Google Scholar]
  51. Abdellatif, K.F.; Soliman, Y.A. Genetic relationships of cotton (Gossypium barbadense L.) genotypes as studied by morphological and molecular markers. Afr. J. Biotechnol. 2013, 12, 4736–4746. [Google Scholar]
  52. Islam, A.A.; Era, F.M.; Khalequzzaman, M.F.; Chakrabarty, S. Estimation of heterosis in hybrids of upland cotton (Gossypium hirsutum L.) for seed cotton yield and related traits. JAPS 2021, 1, 1–12. [Google Scholar]
  53. Zhang, J.; Percy, R.G.; McCarty, J.C. Introgression genetics and breeding between Upland and Pima cotton: A review. Euphytica 2014, 198, 1–12. [Google Scholar] [CrossRef]
  54. Li, Y.; Si, Z.; Wang, G.; Shi, Z.; Chen, J.; Qi, G.; Jin, S.; Han, Z.; Gao, W.; Tian, Y.; et al. Genomic insights into the genetic basis of cotton breeding in China. Mol. Plant 2023, 16, 662–677. [Google Scholar] [CrossRef] [PubMed]
  55. Mehboob-ur-Rahman; Shaheen, T.; Tabbasam, N.; Iqbal, M.A.; Ashraf, M.; Zafar, Y.; Paterson, A.H. Cotton genetic resources. A review. Agron. Sustain. Dev. 2012, 32, 419–432. [Google Scholar]
  56. Stelly, D.M.; Saha, S.; Raska, D.A.; Jenkins, J.N. Registration of 17 upland (Gossypium hirsutum) cotton germplasm lines disomic for different G. barbadense chromosome or arm substitutions. Crop Sci. 2005, 45, 2663. [Google Scholar] [CrossRef]
Figure 1. Constructed with Bayesian Statistics Consensus Tree. (The polar tree is presented in unrooted format, values shown at the nodes post-probability values. The bar below the tree indicates the base change scale).
Agronomy 13 02407 g001
Figure 2. PCoA analysis based on Jaccard’s similarity index values (Axis 1 and Axis 2 show 6.769% and 11.914% variation, respectively).
Agronomy 13 02407 g002
Figure 3. Line graph of ΔK values changing with K value.
Agronomy 13 02407 g003
Figure 4. Q-plot of the population structure for 47 cotton genotypes. A, B, C refers to the groups/cluster of the genotypes after molecular analysis.
Agronomy 13 02407 g004
Table 1. Information about the plant material used in the study.
NoGenotypeSpecies
1Adana-98 G. hirsutum
2Aydın-110 G. hirsutum
3BA-320 G. hirsutum
4Babylon G. hirsutum
5Carisma G. hirsutum
6Carmen G. hirsutum
7Caroline Queen G. hirsutum
8Claodia G. hirsutum
9Comos G. hirsutum
10Diva G. hirsutum
11DP-50 G. hirsutum
12Elsa G. hirsutum
13Erşan-92 G. hirsutum
14Fantom G. hirsutum
15Flash G. hirsutum
16FregoG. hirsutum
17Gaia G. hirsutum
18Garant G. hirsutum
19Gloria G. hirsutum
20Gossypolsüz 86 G. hirsutum
21Gumbo G. hirsutum
22Ligur G. hirsutum
23Lockette G. hirsutum
24Mc Nair 220 G. hirsutum
25Nieves G. hirsutum
26Özbek-100 G. hirsutum
27PG -2018 G. hirsutum
28Samon G. hirsutum
29Sezener-76 G. hirsutum
30SG-404 G. hirsutum
31Sindos-80 G. hirsutum
32ST-468 G. hirsutum
33Veret G. hirsutum
34Acala RoyaleG. hirsutum
35Fibermax-819G. hirsutum
36Tamcot SpinxG. hirsutum
37TM-1G. hirsutum
38Pima 3–79G. barbadense
39G.B-58G. barbadense
40Askabat-71G. barbadense
41Askabat-91G. barbadense
42Askabat-100G. barbadense
43Bahar-14G. barbadense
44Bahar-82G. barbadense
45Giza-45G. barbadense
46Giza-70G. barbadense
47Giza-75G. barbadense
Table 2. EST-SSR primers used in 47 cotton genotypes.
Primer IDPrimer SequenceMotifAllele NumberTm (°C)HeH0PIC
GA01-2651F:AAATCCTACCTCTCCGGCCA
R: CCCAGGGCAAAACAATGTCG
(GCCGGC)36600.4850.4790.475
GA02-54F:GGGAAAGCGCGTCATTGATC
R: GCCGAGCCCAGACCTAATAG
(GCCGG)44600.4500.0960.437
GA04-1418F:GCAGGCAGAATACAAAAGATCGA
R: AAGAAAAGGGGGAGGGGAGA
(GCCGGC)333600.7370.5960.730
GA07-410F:GAAATTACCTTTCCGGCCACC
R: GACGTCGTTTTGGAGGGCTA
(GCCGGC)324600.7200.5280.708
GA08-323F:GAACCGACCTAAGGTGACTGT
R: AGAGAGAAGGGAGGGGGAAG
(CCGGCG)36600.4760.2660.473
GD01-295F:TTTACCTTTCCGACCACCGC
R: GGTGCGTTTTGGTCCCCTAT
(GCCGGC)37600.7040.4150.693
GD02-301F:AAACCCGTTGTGCAACCATG
R: GGATGAGGCTGAGAAGGAGC
(CCGGTG)315600.8980.8830.889
GD03-2002F:GGCCCGGCCCGAATATAATA
R: GACTAGACCTGTCCATGGGC
(CCGGGC)319600.7980.5390.788
GD06-2808F:GGCCCGGCCCGAATATAATAA
R: CGGCCCGAAATATGGGCTTA
(CCGGGC)314600.6250.5600.616
GD08-420F:AGAGAAGGGAGGGGGAAAGG
R: GGGCTCTAACACCAAATCGGA
(CGCCGG)342600.7410.5710.738
GD09-1296F:GGCGCACAAAACACCAAGAT
R: AGGGAGGAAGGAAAGGGGG
(GCCGGC)314600.7450.5460.737
GD10-1664F:GGGCTCTAACACCAAATCGGA
R: AGAGAAGGGAGGGGGAAAGG
(GCCGGC)329600.6790.4930.675
MK086F:CCACCAGTTTGGTAGGTATGAAC
R: TCAACAGTGCAAGGACTTCATC
(CAT)82660.2930.1210.268
MK105F:CAAAGATGCCGAAAGAGAGG
R: GTAAGATCGGCGGGTCATC
(CCG)1230660.6660.3190.659
MK126F:ACCGTACCCGTGGCTCTTAT
R: TGTTGTTGTGGGAGGCTTCT
(CAT)84660.4140.0430.378
MK129F:GCTGATGCTGATTCCTCCAT
R: TGCCCTTCATCTCGTTTCTT
(CAA)87660.3730.4790.345
MK132F:AGCAAGGCATGAGCGATACT
R: GGTGGTACCTTCCCATGTTG
(TCAGCC)68660.5410.3910.511
MK146F:ATGGAGGCTGCAAAGACTGT
R: CCACTCCGACTAAAAGATCAGC
(GTAGTGAGA)33660.5770.7870.487
MK173F:GGGGTCCACAGATACAGG
R: GTCCAAAACTTGTCCCATTAG
(TATG)9 13660.8670.1060.858
(He: expected heterozygosity, Ho: observed heterozygosity, PIC: polymorphism information content).
Disclaimer/Publisher’s Note: The statements, opinions and data contained in all publications are solely those of the individual author(s) and contributor(s) and not of MDPI and/or the editor(s). MDPI and/or the editor(s) disclaim responsibility for any injury to people or property resulting from any ideas, methods, instructions or products referred to in the content.

