Article

Agricultural Jiaosu Enhances the Stress Resistance of Pak Choi (Brassica rapa L. subsp. chinensis) by Recruiting Beneficial Rhizosphere Bacteria and Altering Metabolic Pathways

1
College of Agronomy and Biotechnology, China Agricultural University, Beijing 100193, China
2
School of Chemical Engineering, Zhengzhou University, Zhengzhou 450001, China
*
Author to whom correspondence should be addressed.
Agronomy 2023, 13(9), 2310; https://doi.org/10.3390/agronomy13092310
Submission received: 20 July 2023 / Revised: 29 August 2023 / Accepted: 29 August 2023 / Published: 1 September 2023

Abstract

:
Agricultural Jiaosu (AJ) is a method of recycling agricultural wastes for improving soil properties, promoting plant growth, and enhancing plant stress resistance. However, the underlying mechanism by which AJ improves plant stress resistance needs to be determined. Therefore, in this study, two treatments of AJ spraying and water spraying were set up to determine the enzyme activities related to the stress resistance of pak choi after 30 days of growth, and the potential mechanism of AJ’s influence on the stress resistance of pak choi was revealed by transcriptome, metabolome, and rhizome microbiome analyses. Microbial community analysis revealed that the application of AJ does not alter microbial abundance in the rhizosphere; however, it can improve microbial diversity and enrich Actinobacteriota, Proteobacteria, and Firmicutes in the pak choi rhizosphere. Metabolomic analysis revealed that these phyla were significantly positively correlated, with highly upregulated metabolites. Our findings suggest that AJ recruits beneficial microorganisms (BMs) in the rhizosphere and stimulates the expression of genes and metabolites involved in phenylpropanoid and glucosinolate biosynthesis, as well as glutathione and alpha-linolenic acid metabolism pathways. The use of AJ could considerably minimise the use of pesticides and fertilisers and improve the quality of the ecological environment.

1. Introduction

Environmental pollution and the destruction of agricultural ecosystems can seriously affect normal plant growth [1,2,3]. Drought, low temperatures, high salt, and other adverse conditions affect plant growth and development, which, in turn, affects crop yield and quality [4,5,6,7]. Hence, plants have a complete system at the molecular and physiological levels to resist adverse environments [8]. Exploring the mechanisms of plant stress resistance is critical for growing plants under adverse conditions and increasing crop yield.
To improve plant stress resistance, there are many strategies available, such as the development of stress-resistant plant varieties. Hybrid breeding is a conventional method to develop resistant varieties [9]. It is also possible to screen existing varieties for stress resistance [10,11]. Moreover, advancements in modern biotechnology have facilitated the breeding of novel stress-resistant varieties using in vitro tissue [12,13], cell culture techniques [14], and genetic engineering [15,16]. However, these methods are currently limited to laboratory research and are still far from being applied practically [17,18]. Additionally, plant stress resistance can be enhanced by improving cultivation practices. Presoaking treatment of corn and cotton seeds in a 3% NaCl solution with 100 μM sodium nitroprusside (an NO donor) improves salt tolerance [19,20]. Alternate fertilising methods, such as increasing the use of organic fertilisers, can also improve plant stress resistance [21]. Exogenous reactive oxygen species (ROS) scrubbers, such as paclobutrazol (PP333), brassinosteroids (BR-120), and complex alcohols, can effectively mitigate waterlog damage; however, these measures have some limitations in the field [22]. Several studies have been conducted in recent years to improve plant stress resistance by inoculating beneficial microorganisms (BMs), typically plant-growth-promoting rhizobacteria, in plants [23,24,25]. Additionally, the inoculation of Ochrobactrum cytisi IPA7.2 induces salinity and drought-resistance in plants and helps them recover following stress [26]. AJ is defined as a microbial ecosystem composed of acid-based substances and BMs [27]. It has a pH below 4 and a large number of live microorganisms. In practice, AJ has been shown to promote plant growth and control root rot [28]. Therefore, further exploration of the role of AJ in plant stress resistance has scientific significance for agricultural production.
Studies on plant-stress-resistance mechanisms can be classified into two categories: analysis of changes in growth habits and analysis of physiological and biochemical changes [29]. The primary focus of a majority of physiological and biochemical research has been ion balance and osmotic regulation, antioxidant enzyme activity and related proteins, signal transduction, and transcriptional regulation. Most stresses, such as salt and drought, cause water deficiency and induce osmotic stress in plant cells [30]. Plants maintain ion balance and resist adverse conditions by pumping harmful ions out of their cells [31]. Plant resistance can also result from the modulation of the poly (ADP–ribose) polymerase enzyme [32]. Additionally, osmotic regulators, such as proline, glycine betaine, sorbitol, and mannitol, can protect plants from stress-induced damage [33,34,35]. Plants produce abundant ROS in adversity [36]. However, ROS can be degraded by plant catalase (CAT) and superoxide dismutase (SOD) to improve plant stress resistance [37]. Antifreeze proteins can reduce the freezing point of the solution, modify ice crystal morphology, and inhibit recrystallisation [38]. Additionally, stress has been shown to regulate hydrated protein molecules in Arabidopsis thaliana [39]. Protein kinases are primarily responsible for signal transduction, with the mitogen-activated protein kinase signal cascade pathway being the most common [40,41,42]. The regulation of transcription factors can be classified into abscisic-acid (ABA)-dependent and ABA-independent pathways [43]. These pathways differ by the presence of an ABA-responsive element or dehydration-responsive element in the promoter region [44].
With advancements in sequencing technology and bioinformatics, a combined multiomics analysis technique was used to reveal the mechanism of plant stress resistance [45,46,47]. At the RNA level, transcriptomes can rapidly and accurately reveal specific biological processes and molecular mechanisms. Transcriptomics is currently being used to reveal the stress-resistance mechanisms in barley, sorghum, rape, and other crops [48,49,50,51]. Metabolomics, a new omics technology that emerged after transcriptomics, was used to study the amount and type of endogenous metabolites in organisms. Combined transcriptomic and metabolomic analysis can be used to reveal the underlying molecular and regulatory mechanisms responsible for changes in plants under stress conditions. For example, transcriptomic and metabolomic analyses were used to reveal the ROS-dependent adaptation mechanism of rice to low-temperature environments [52]. Moreover, transcriptomic and metabolomic analyses of oat roots revealed ion emission strategies under P deficiency and abundance [53]. As the ‘second genome’ of plants, rhizosphere microorganisms have received considerable attention from researchers. Many studies have shown that rhizosphere microorganisms can help plants resist abiotic stresses and increase crop yield [25,54,55].
The aim of this study was to investigate the effects of AJ on plant stress tolerance using transcriptome, metabolome, and rhizosphere microbiome analyses. Pak choi was selected as the study material owing to its ease of planting. AJ was sprayed as a treatment and water as a control. First, we tested the activity of antioxidant enzymes in pak choi under two different treatments. We used transcriptomics and metabolomics to reveal the changes in plants after AJ application and 16S sequencing to reveal the changes in rhizosphere microorganisms to test our hypothesis that plant–microbial interactions are responsible for plant stress resistance. Finally, through joint transcriptomic and metabolomic analysis, we revealed the mechanism by which AJ improves the stress resistance of pak choi, providing a scientific basis for the popularisation and application of AJ on plants.

2. Materials and Methods

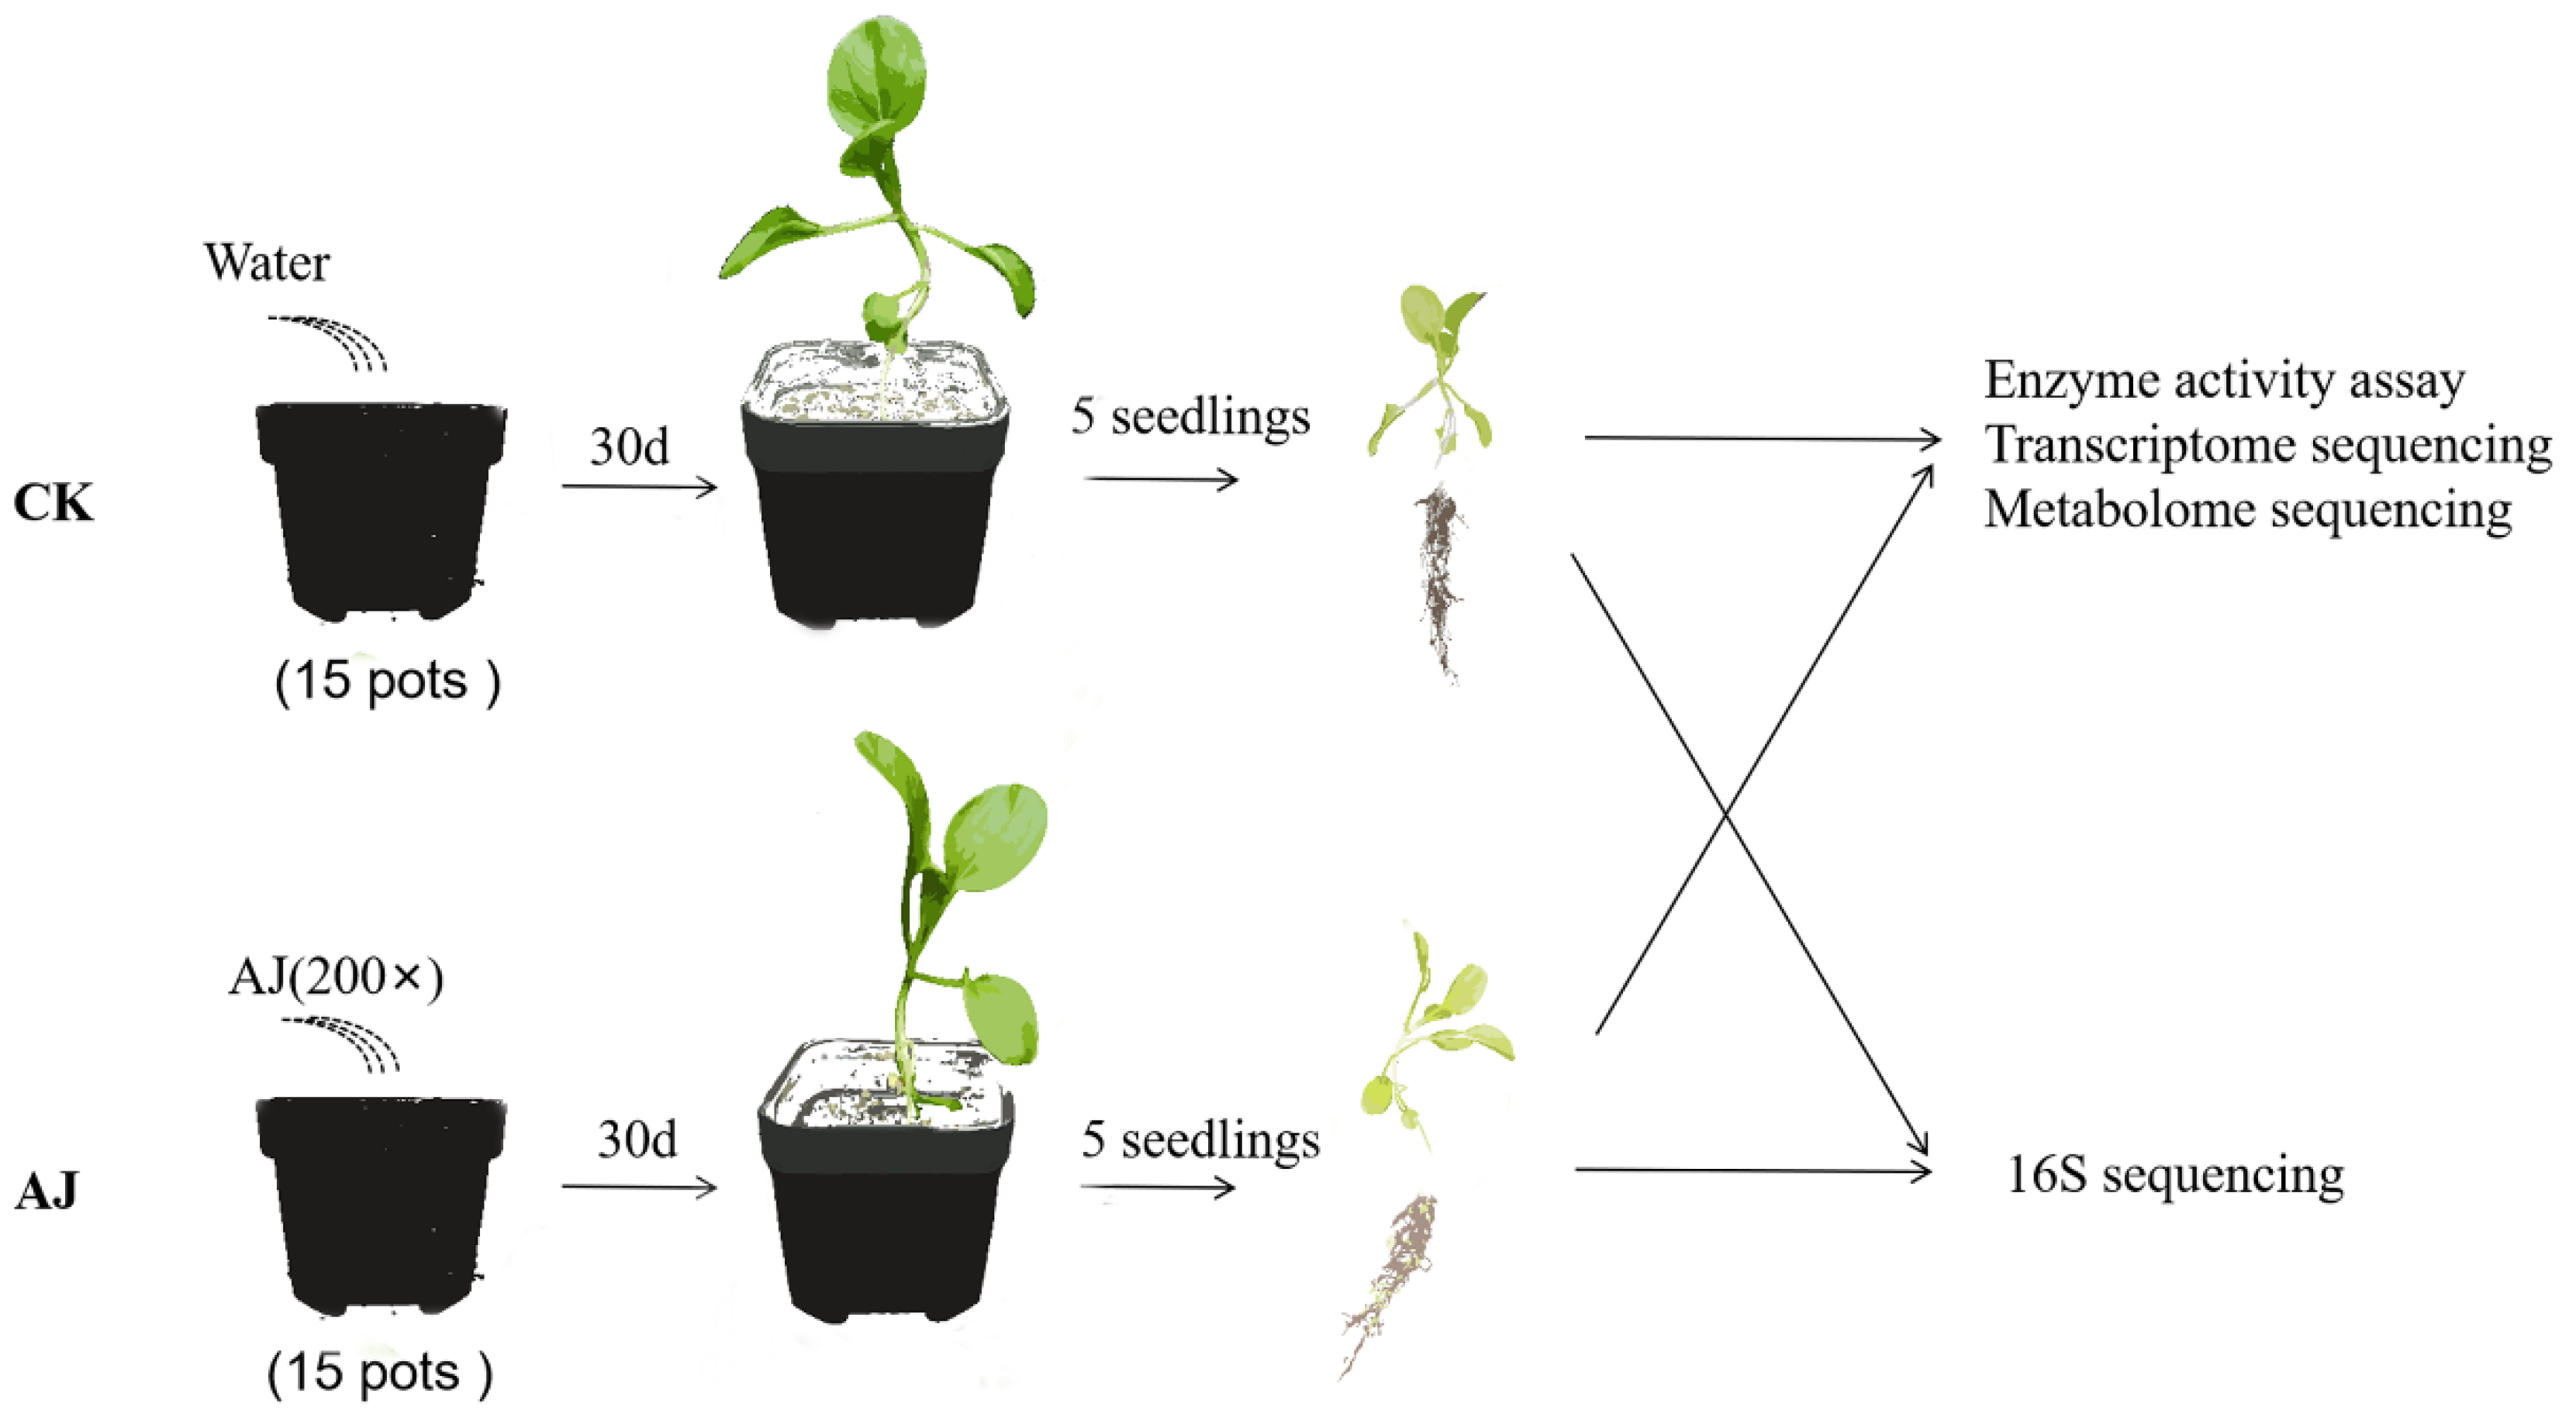
2.1. Plant Materials and Conditions of Planting

Two treatments were used in this study: water spray (CK) and AJ (diluted 200 times). AJ was made from fermented mixed fruits as previously described [27]. Pak choi (Brassica rapa L. subsp. chinensis) was planted in plastic pots with a diameter of approximately 7 cm and placed in the greenhouse of China Agricultural University. The growth medium was 1:1 mixture of nutrient soil (from Denmark) and vermiculite (purchased from Jiputeng Biological Company, Beijing, China). The temperature of the growing environment was in the range of 25–28 °C and the relative humidity was 70%. The lighting time was 16 h; alternately arranged cold and warm lamps were used to simulate the lighting. Direct sowing of the seeds, covering them with plastic wrap after sowing, removing the plastic wrap after emergence, and sporadic watering were sufficient to ensure normal growth of the plants. Following 30 d, the aboveground parts of pak choi were tested for enzyme activity, metabolome, and transcriptome. The 16S sequencing was performed on the rhizosphere soil in the same period (Figure 1).

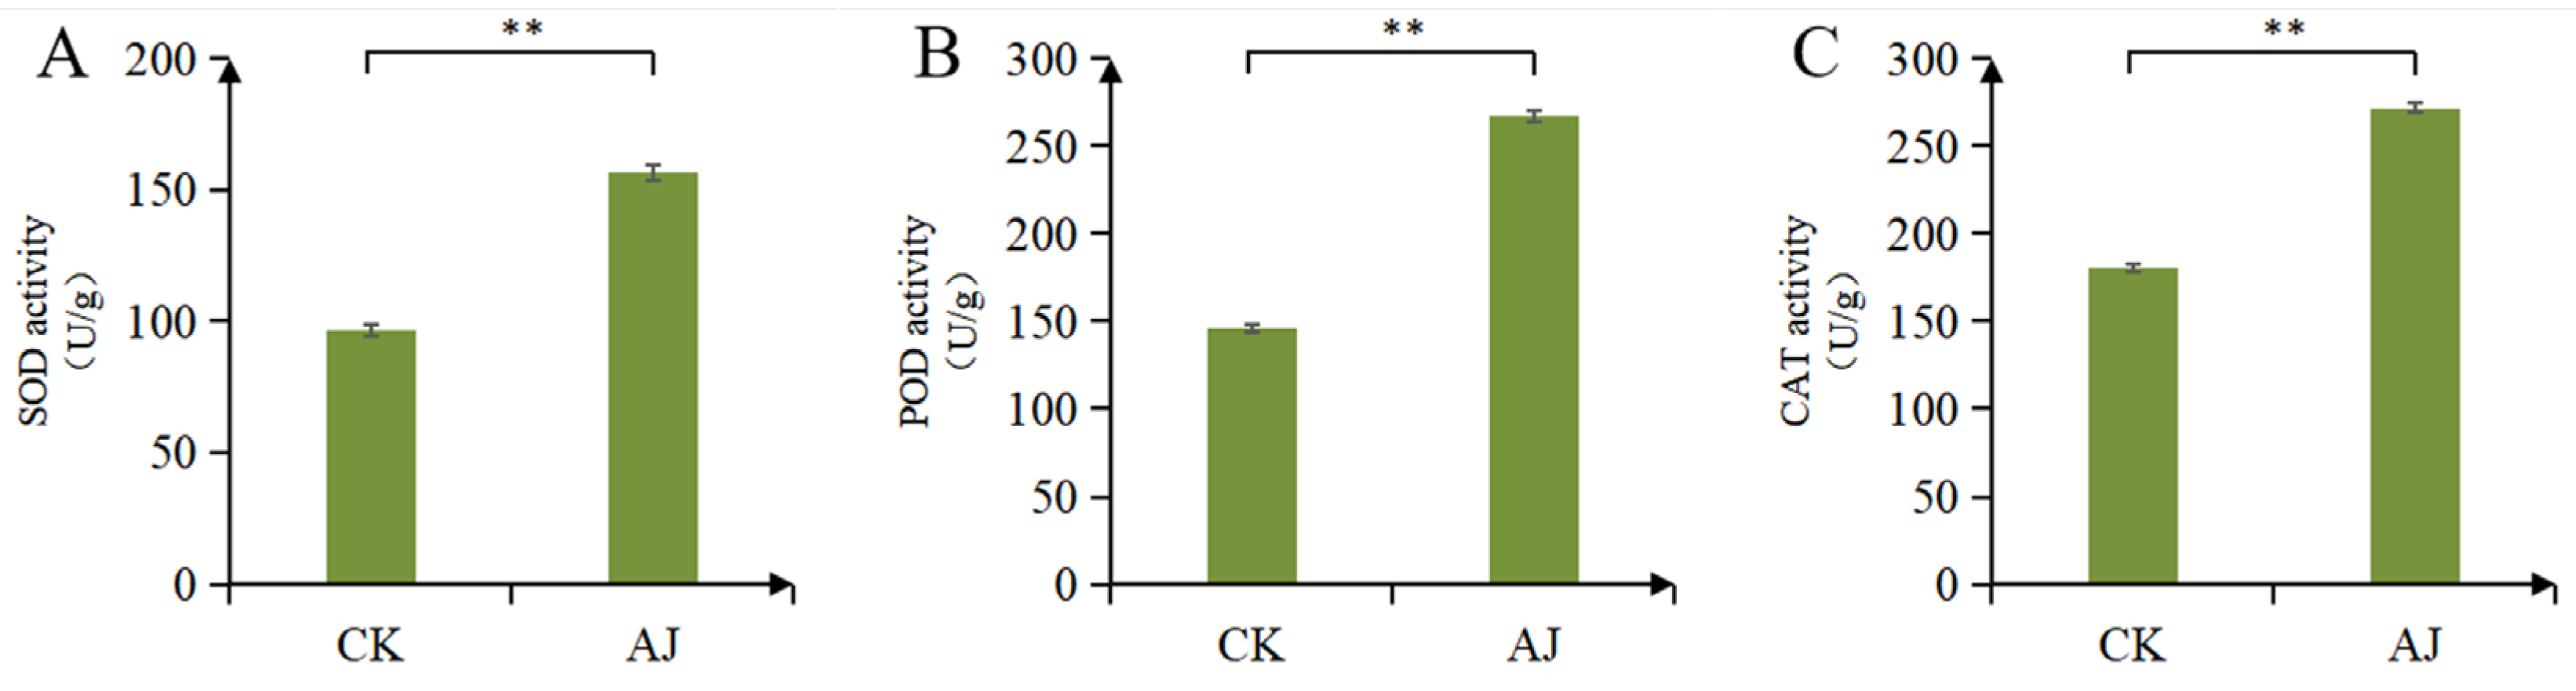
2.2. Measurement of Peroxidase, SOD, and CAT Activities

SOD activity was assessed using SOD biochemical kits (NMKD0101, Norminkoda Biotechnology Co., Ltd., Wuhan, China), CAT was assayed using CAT biochemical kits (NMKD0102, Norminkoda Biotechnology Co., Ltd., Wuhan, China), and peroxidase (POD) was assessed using POD biochemical kits (NMKD0103, Norminkoda Biotechnology Co., Ltd., Wuhan, China).

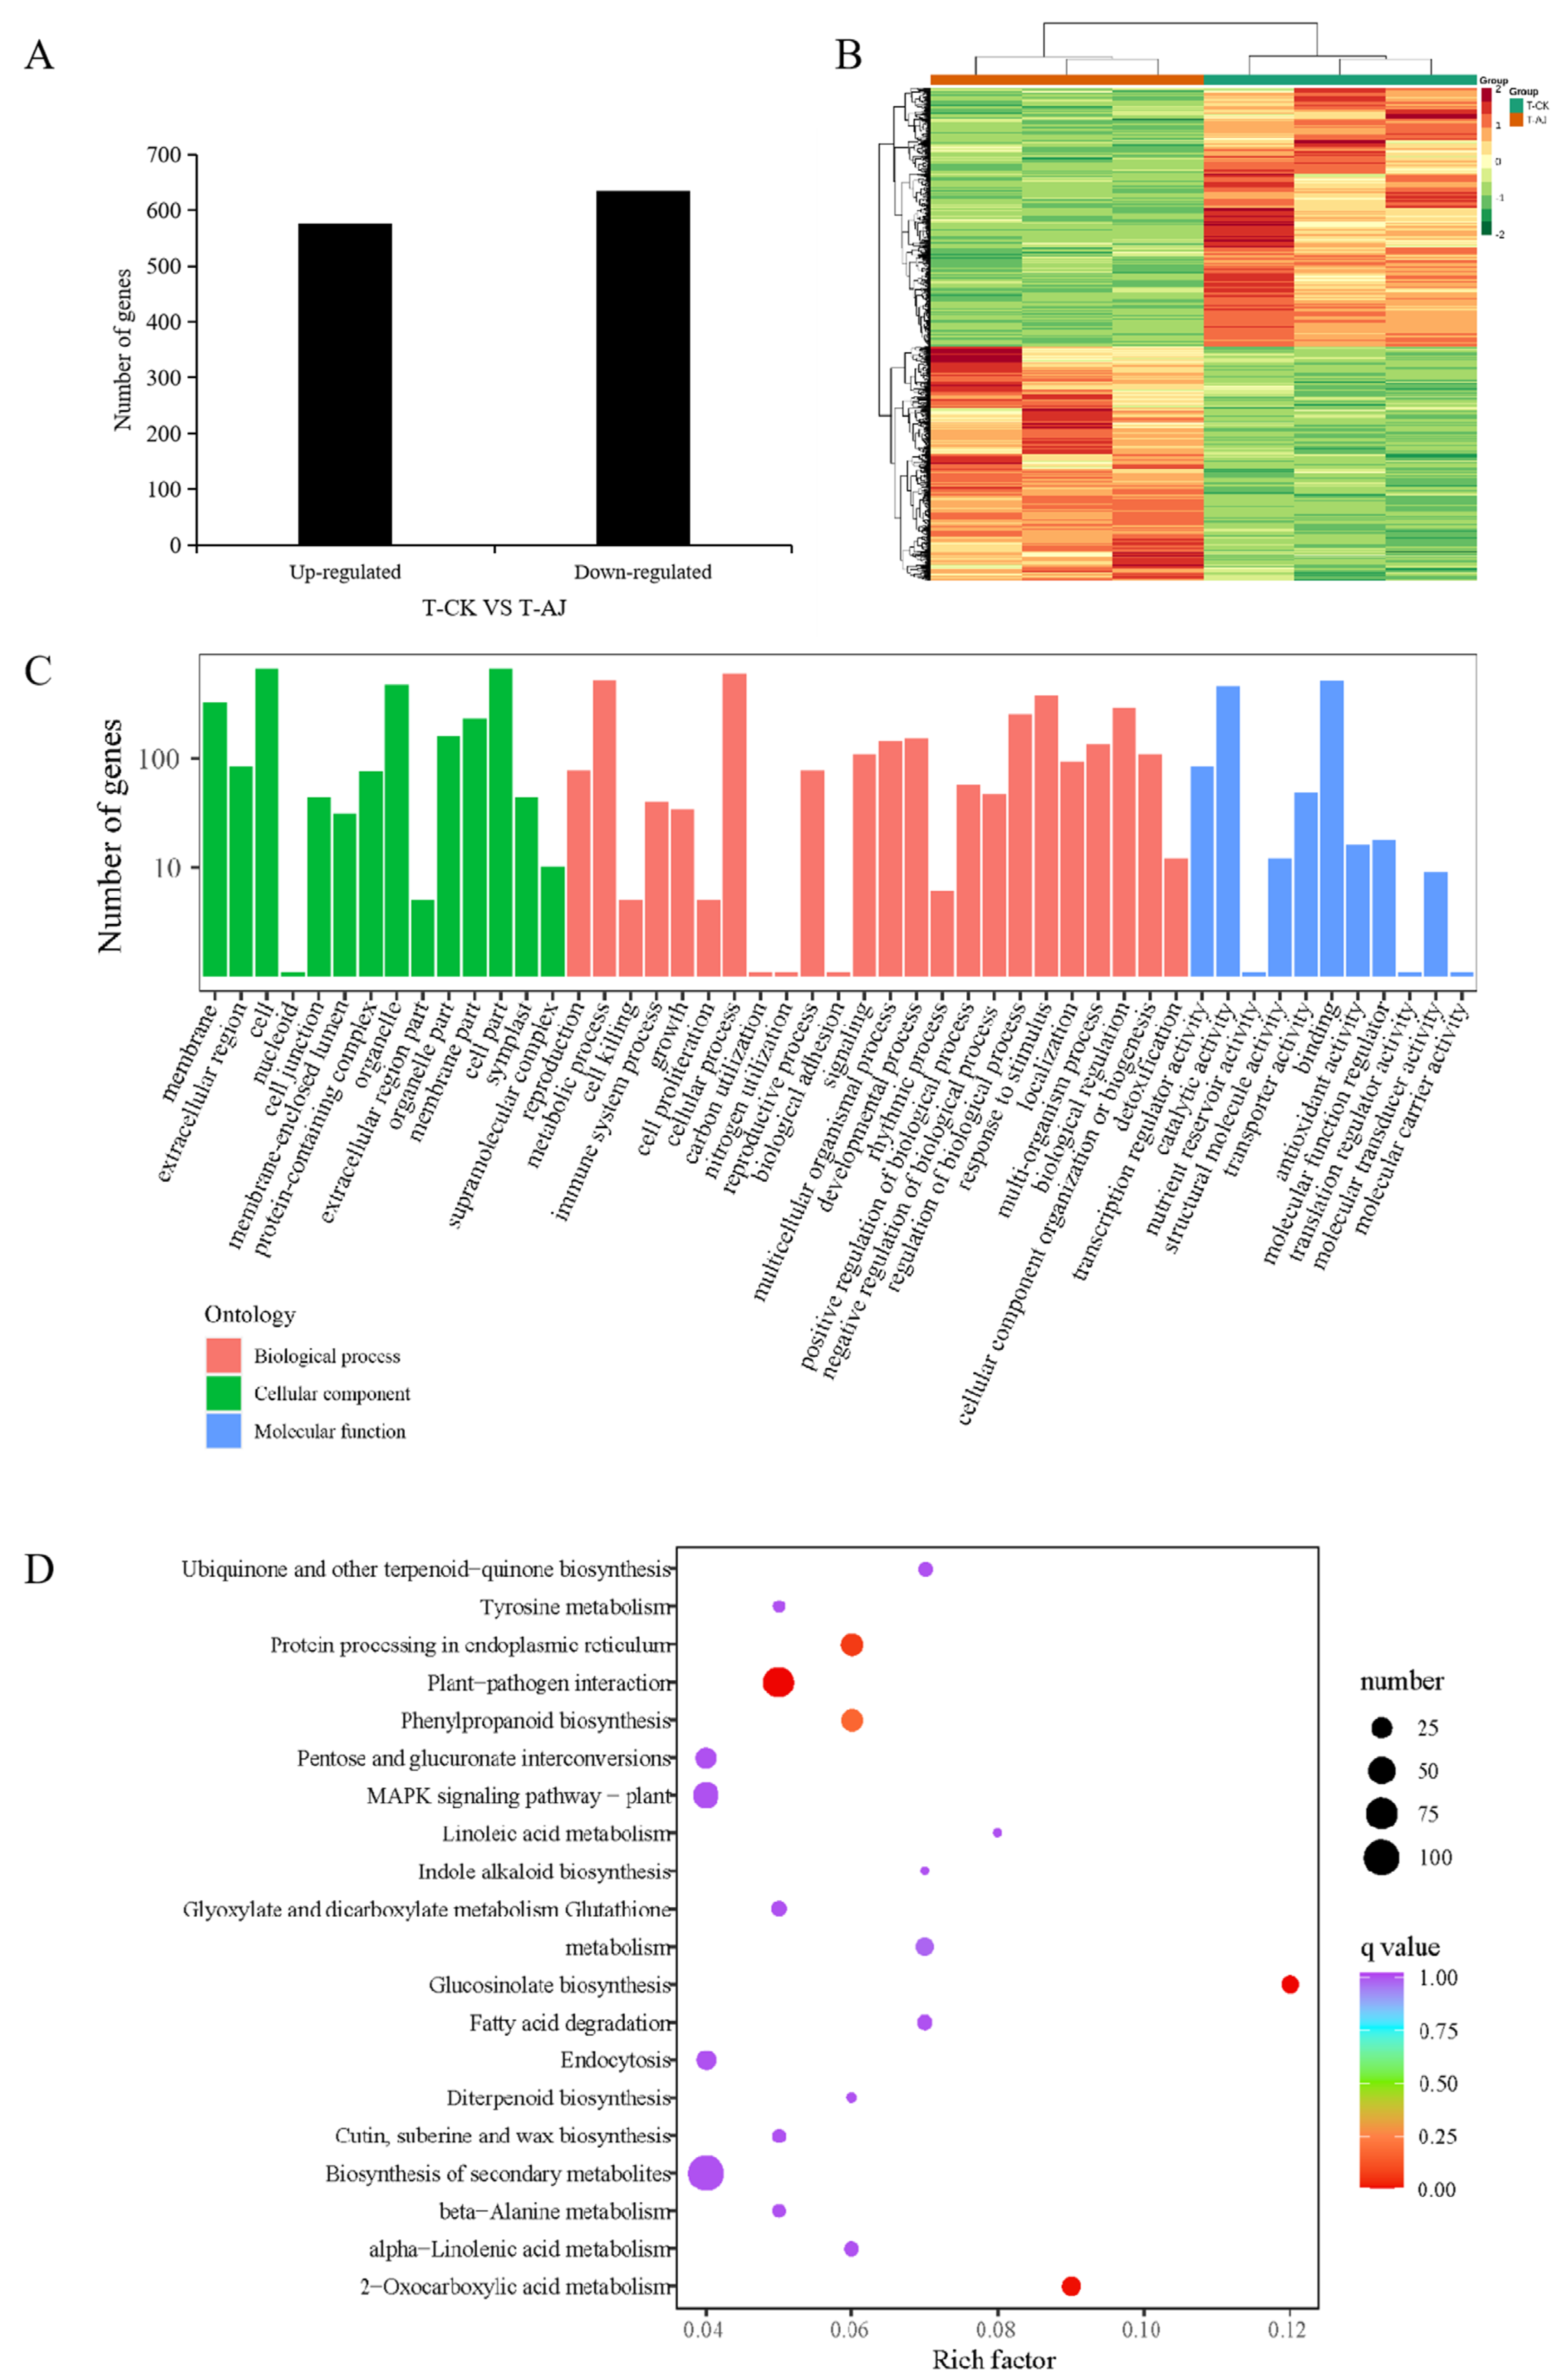
2.3. Transcriptome Analysis

Total RNA was extracted from the pak choi using a pure RNA isolation kit (Tiangen, China) following the instructions of the manufacturer. The prepared cDNA libraries were sequenced on the Illumina sequencing 2500 platform by Metware Biotechnology Co., Ltd. (Wuhan, China). In this study, six samples were subjected to transcriptome sequencing analysis. Low-quality reads containing adapters and ploy-N were removed from the raw data. Further, 42.26 GB of clean data was obtained using the Illumina platform, with the Q30 base percentage > 94%. DESeq2 v1.22.1 was used to analyse the differential expression between the two groups. The adjusted p value and |log2foldchange| were used as the significant differential expression threshold. Based on the hypergeometric test, the enrichment analysis was performed. For the Kyoto encyclopaedia of genes and genomes (KEGG), the hypergeometric distribution test was performed with the unit of the pathway, whereas for the gene ontology (GO), it was performed based on the GO term. ClusterProfiler was used for the GO enrichment analysis.

2.4. Metabolome Analysis

Three thirty-day-old pak choi from each of the two treatment groups were selected randomly for the metabolome analysis. The freeze-dried sample was ground using a mixer mill (MM 400, Retsch, Haan, Germany) with a zirconia bead for 1.5 min at 30 Hz. Lyophilised powder (100 mg) was dissolved in 1.2 mL of a 70% methanol solution, vortexed for 30 s at every 30 min for six times in total, and subsequently stored overnight in a refrigerator at 4 °C. Following centrifugation at 12,000 rpm for 10 min, the extracts were filtered (SCAA-104, 0.22 μm pore size; ANPEL, Shanghai, China, http://www.anpel.com.cn/, accessed on 10 February 2021). Thereafter, the sample extracts were analysed using an ultra-performance liquid chromatography–electrospray ionisation–tandem mass spectrometry system (UPLC, SHIMADZU Nexera X2, https://www.shimadzu.com.cn/; accessed on 15 February 2021 MS, Applied Biosystems 4500 Q TRAP, https://www.thermofisher.cn/cn/zh/home/brands/applied-biosystems.html accessed on 15 February 2021). Based on the database of Metware Bio-Tech Co. (Wuhan, China), metabolites were identified and quantified. Significantly regulated metabolites between groups were determined using VIP ≥ 1 and absolute log2FC (fold change) ≥ 1. The KEGG COMPOUND database (http://www.kegg.jp/kegg/compound/ accessed on 1 March 2021) was used to annotate the identified metabolites, and the annotated metabolites were mapped to the KEGG PATHWAY database (http://www.kegg.jp/kegg/pathway.html accessed on 1 March 2021). Pathways with considerably regulated mapped metabolites were then fed into metabolite sets for the enrichment analysis, and the p-values of the hypergeometric test were used to determine their significance.

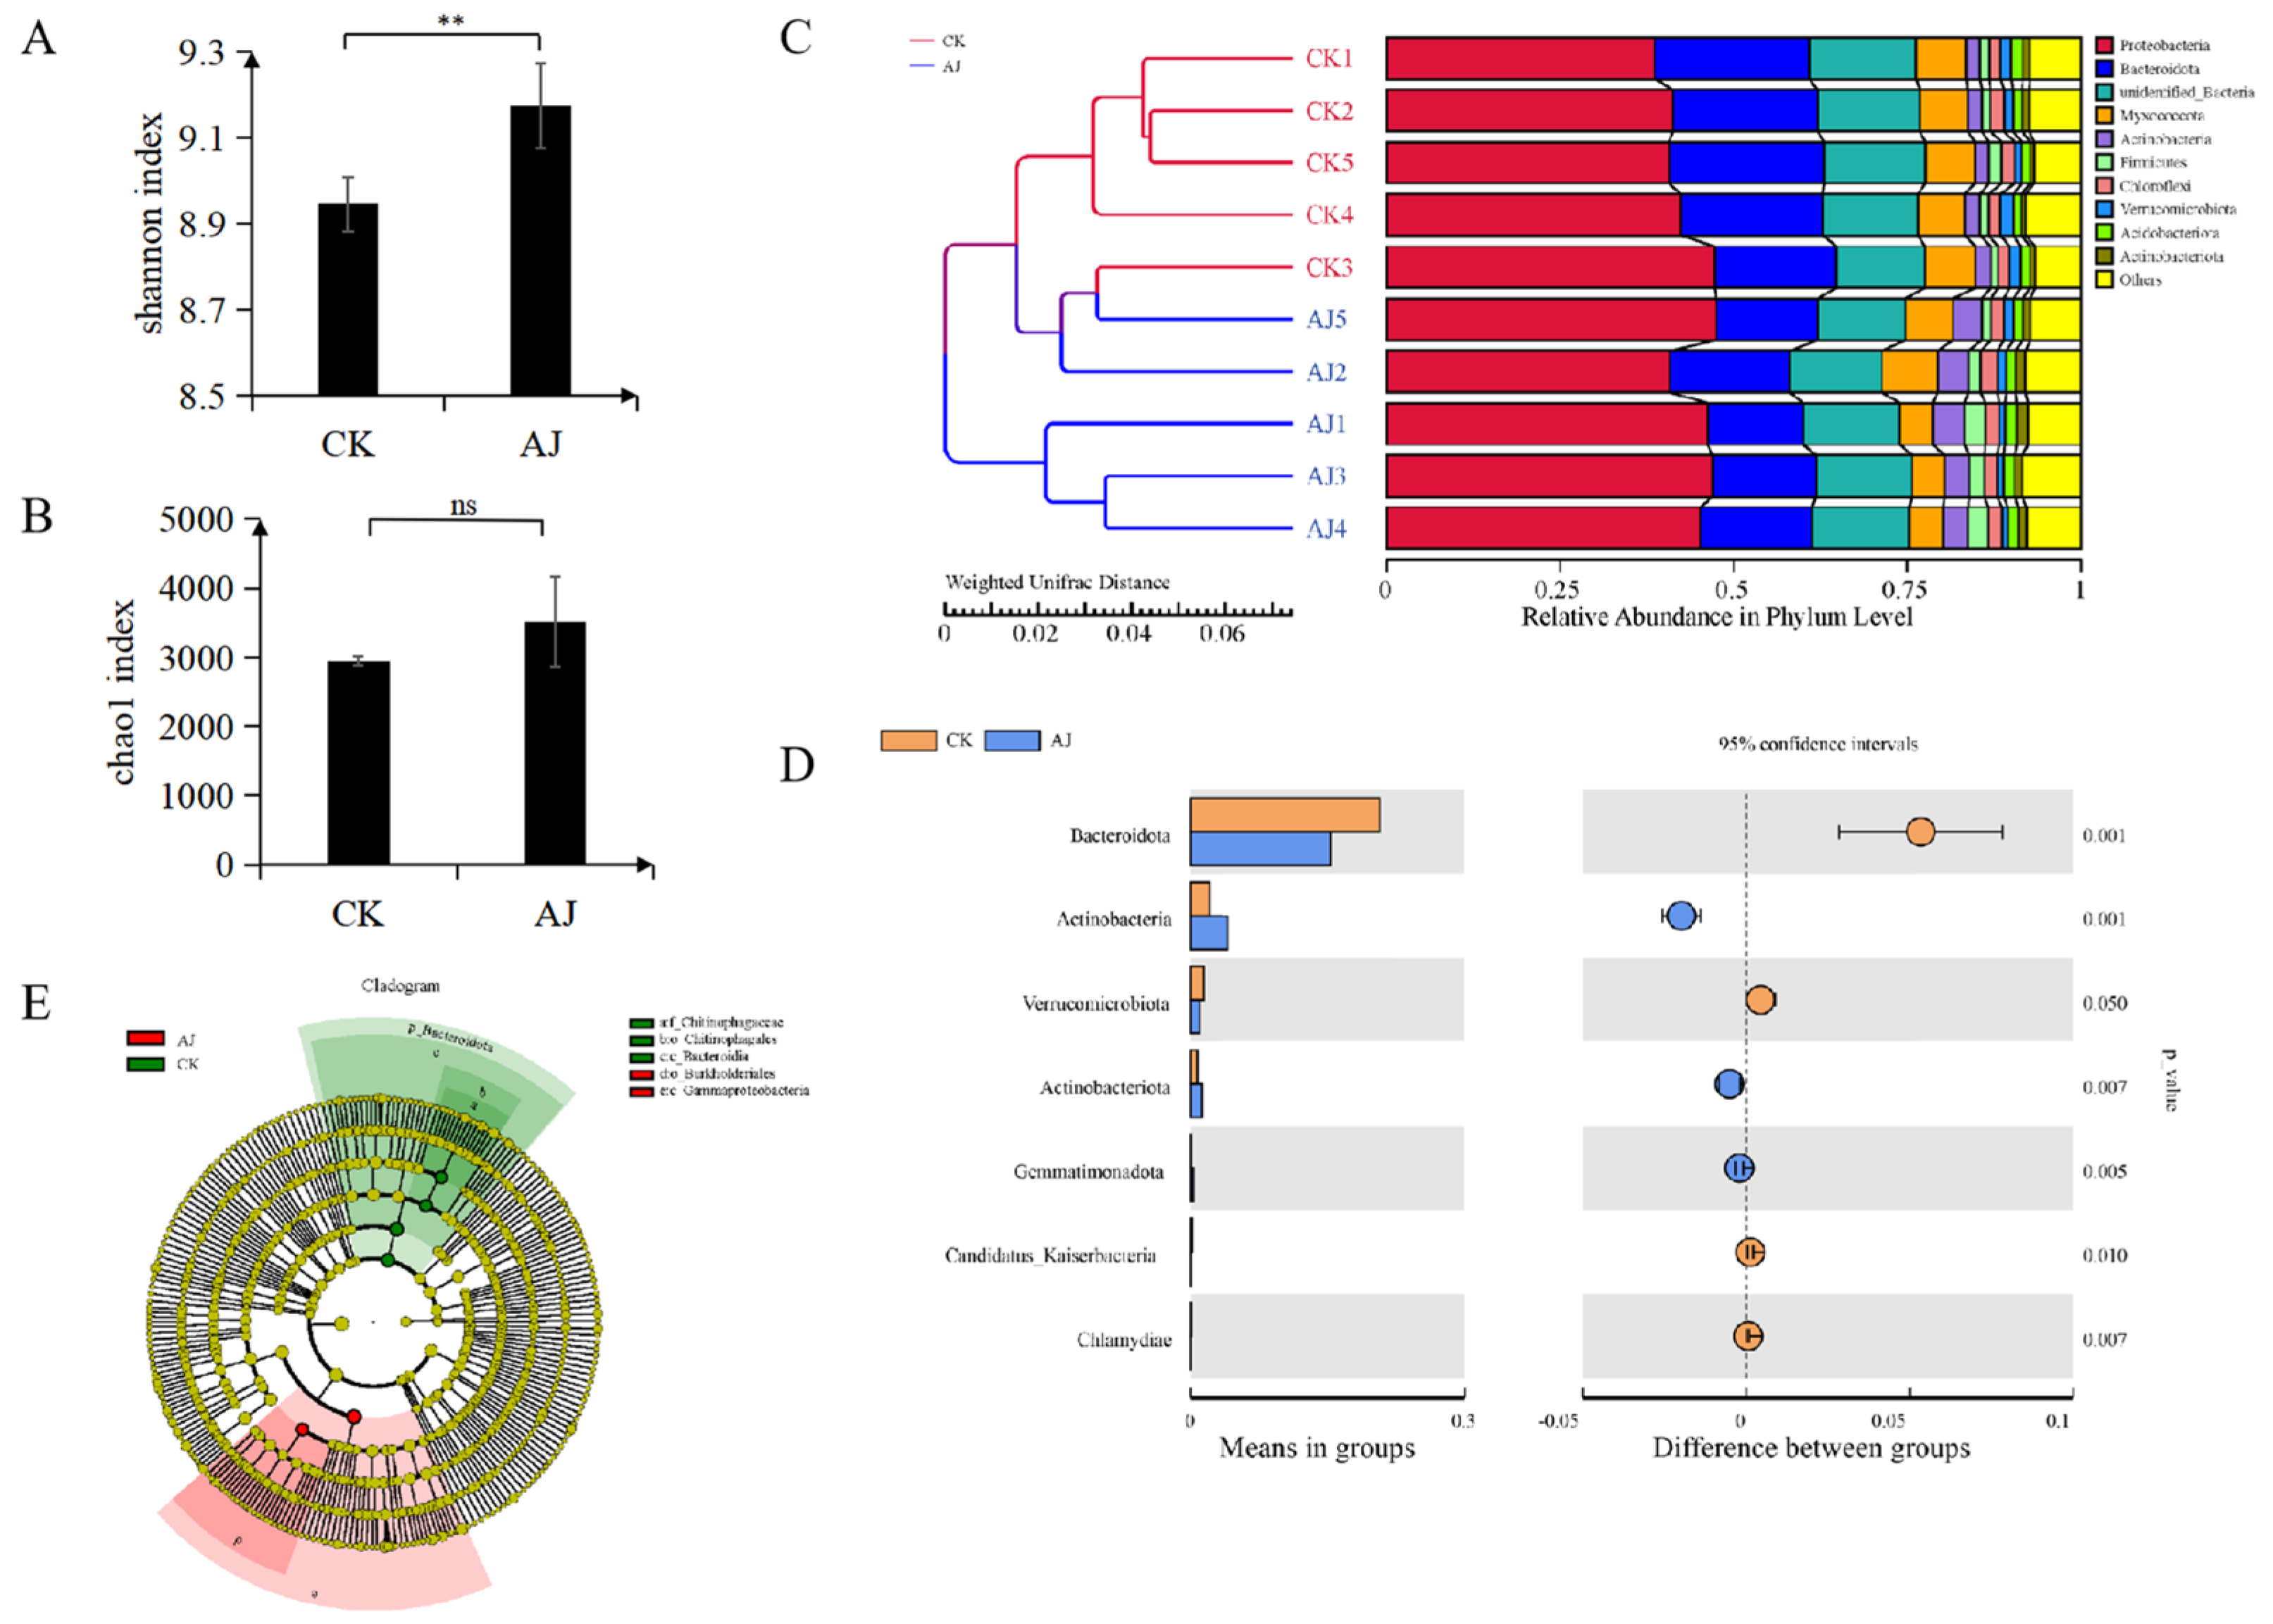
2.5. Rhizosphere Microbial Analysis

The genomic DNA of the samples was extracted using cetyltrimethylammonium bromide [56], and the purity and concentration of the DNA were detected using 2% agar–agar gel electrophoresis. The appropriate amount of sample DNA was transferred to a centrifuge tube and diluted with water to a concentration of 1 ng/μL. Using diluted genomic DNA as a template, specific primers with barcodes were used to perform polymerase chain reaction (PCR) amplification according to the selection of sequencing region, and a 2% concentration of agar–agar gel was used for electrolysis detection. The qualified PCR products were purified using magnetic beads, quantified using enzyme labelling, and mixed in equal proportions based on their concentration. Following thorough mixing, the PCR products were detected using 2% agar–agar gel electrophoresis. The library was constructed using the TruSeq® DNA PCR-Free sample preparation kit. The constructed library was quantified using quantum bit and quantitative PCR. Thereafter, NovaSeq6000 was used for on-machine sequencing.
Using the UPARSE algorithm (UPARSE v7.0.1001, http://www.drive5.com/uparse/ accessed on 20 March 2021) for all samples of all the effective clustering tags by default, sequences were clustered into operational taxonomic units (OTUs) with a 97% identity. The multiple sequence comparison by log-expectation (version 3.8.31, http://www.drive5.com/muscle/ accessed on 20 March 2021) software was used to rapidly align multiple sequences and obtain all OTUs for the sequence of the system. The Chao1 and Shannon indices were computed using QIIME software (version 1.9.1), and an unweighted pair group method with arithmetic mean (UPGMA) sample clustering tree was constructed. The intergroup difference analysis of Chao1 and Shannon indices was performed using R software (version 2.15.3). The t-test and Wilcox test were used for parametric and nonparametric testing. The linear discriminant analysis effect size (LEfSe 1.0) software was used for the LEfSe analysis. The filter value of default linear discriminant analysis score was 4.

2.6. Quantitative Real-Time PCR

The Tb Green® Premix Ex Taq™ II (Takara, Beijing, China) was used for quantitative real-time (qRT)-PCR analysis of 20 genes. β-actin was used as the internal reference gene [57]. Table S3 shows the primers for 21 genes. The relative expression of these genes was calculated using the 2−ΔΔCt method [58].

2.7. Statistical Analysis

IBM statistical package for social sciences (version 25.0, IBM Corp, Armonk, NY, USA) was used to analyse the POD, SOD, and CAT significance at a confidence level of p < 0.05 or p < 0.01. All data were shown as means of triplicates. Spearman correlation analysis was performed using ‘cor’ function of R (v. 4.0.3) software and the significance test was performed using corPvalueStudent function of R package ‘WGCNA’. Some analyses, such as canonical correlation analysis (CCA) and clustering heat map analysis, were performed on the free online platform of the Metware cloud platform (https://cloud.metware.cn accessed on 25 March 2021).

3. Results

3.1. Effects of AJ on Pak Choi Stress Resistance

The representative stress-resistance indices, including SOD, POD, and CAT, were investigated to determine the effect of the AJ treatment on stress resistance in pak choi. Pak choi treated with AJ had considerably higher SOD, POD, and CAT activities than those treated with water (Figure 2A–C). This indicates that the AJ treatment has the potential to improve the stress resistance of pak choi. Additionally, we assessed the growth and development indices of pak choi and found that AJ can increase plant height, fresh weight, root length, and soil plant analysis development; however, the improvement is not substantial (Table 1).

3.2. Rhizosphere Microbial Community Analysis

To determine the effect of AJ on the underground microbiota of pak choi and further explore the relationship between microorganisms and plants, we selected six strains of pak choi treated with water and six strains of pak choi treated with AJ, and subjected the rhizosphere microorganisms to 16S sequencing. Overall, 827,932 effective reads were obtained from 10 samples. Furthermore, effective reads of all the samples were clustered into OTUs with a 97% identity. The analysis found that the AJ and CK samples contained 4887 and 4468 OTUs, respectively (Figure S1). Based on the results of the OTU analysis of the 16S sequencing data, the α-diversity, β-diversity, and phylum-level species analyses were performed to reveal the similarities and differences in the rhizosphere microbial communities between the CK and AJ treatment groups.
Notably, the AJ treatment greatly enhanced the Shannon index of the rhizosphere microorganisms more than the CK treatment; however, there was no significant difference in the Chao1 index (Figure 3A,B). The UPGMA clustering method was used to analyse the β-diversity of the samples, revealing that the CK and AJ samples were clustered. The relative abundance of species at the phylum level was analysed, and the 10 most abundant species were Proteobacteria, Bacteroidota, unidentified bacteria, Myxococcota, Actinobacteria, Firmicutes, Chloroflexi, Verrucomicrobiota, Acidobacteriota, and Actinobacteriota. Among these, the populations of Proteobacteria, Actinobacteria, and Firmicutes increased considerably after the AJ treatment, whereas those of Bacteroidota and Myxococcota witnessed a decline (Figure 3C). We conducted an intergroup t-test to assess different species at the phylum level; the results showed that Bacteroidota, Actinobacteria, Verrucomicrobiota, Actinobacteriota, Gemmatimonadota, Candidatus Kaiserbacteria, and Chlamydiae differed significantly between the two groups. Specifically, the number of Actinobacteria, Actinobacteriota, and Gemmatimonadota was significantly higher in AJ than in CK (Figure 3D). Additionally, the LEfSe analysis tool was used to identify and interpret high-dimensional biomarkers between the two groups. The results showed that the biomarker for CK was Bacteroidota, whereas that for AJ was Gammaproteobacteria (Figure 3E).

3.3. Transcriptome Analysis of AJ-Treated Pak Choi

In order to evaluate the responsiveness of pak choi seedlings to the AJ treatment and further understand the metabolic processes generating changes in pak choi seedling metabolites at the molecular level, we conducted comparative transcriptome analyses on three CK and three AJ samples. Overall, 42.26 GB clean reads were obtained after removing reads containing adapters, ploy-N, and low-quality reads. The percentages of Q30 and guanine-cytosine content in each library were higher than 94.38% and 46.86%, respectively, indicating that the transcriptomic data were of high quality and could be used for further differentially expressed gene (DEG) analysis (Table S1, Supplementary File S2). More than 88.18% of clean reads in each library could be mapped to the pak choi reference genome (Table S2, Supplementary File S2). A principal component analysis (PCA) revealed that the CK and AJ samples were clustered (Figure S2, Supplementary File S1). It was clear that there were differences in gene expression between the AJ and CK samples. DEGs were screened based on a threshold of |log2FC| ≥ 1 and false discovery rate < 0.05. The transcriptome comparative analysis revealed 1211 identified DEGs (576 upregulated and 635 downregulated genes), indicating higher differential expression patterns in the AJ treatment group than in the CK treatment group (Figure 4A). According to heat map analysis, the DEGs in the CK and AJ treatment groups differed considerably (Figure 4B). We performed the GO and KEGG enrichment analyses of DEGs to further reveal their biological functions in pak choi under AJ treatment. The results showed that the DEGs were divided into 49 functional GO terms. In the cellular component processes, the most abundant terms were ‘cell part’, ‘cell’, and ‘organelle’. In the molecular function category, ‘binding’, ‘catalytic activity’, and ‘transcription regulator activity’ were the most highly represented terms. In the biological processes, the most abundant terms were ‘cellular process’, ‘metabolic process’, and ‘response to stimulus’ (Figure 4C). Additionally, the results of the KEGG pathway enrichment analysis revealed that all DEGs were successfully assigned to 111 KEGG pathways. For demonstration, we selected 20 pathway items with the most substantial enrichment (Figure 4D). Specifically, ‘plant–pathogen interaction’ (ko04626), ‘phenylpropanoid biosynthesis’ (ko00940), ‘protein processing in endoplasmic reticulum’ (ko04141), ‘glucosinolate biosynthesis’ (ko00966), and ‘2-oxocarboxylic acid metabolism’ (ko01210) were significantly enriched (p < 0.05). These findings indicate that the DEGs related to the aforementioned secondary metabolite biosynthesis pathways in pak choi seedlings may be regulated by the AJ treatment.

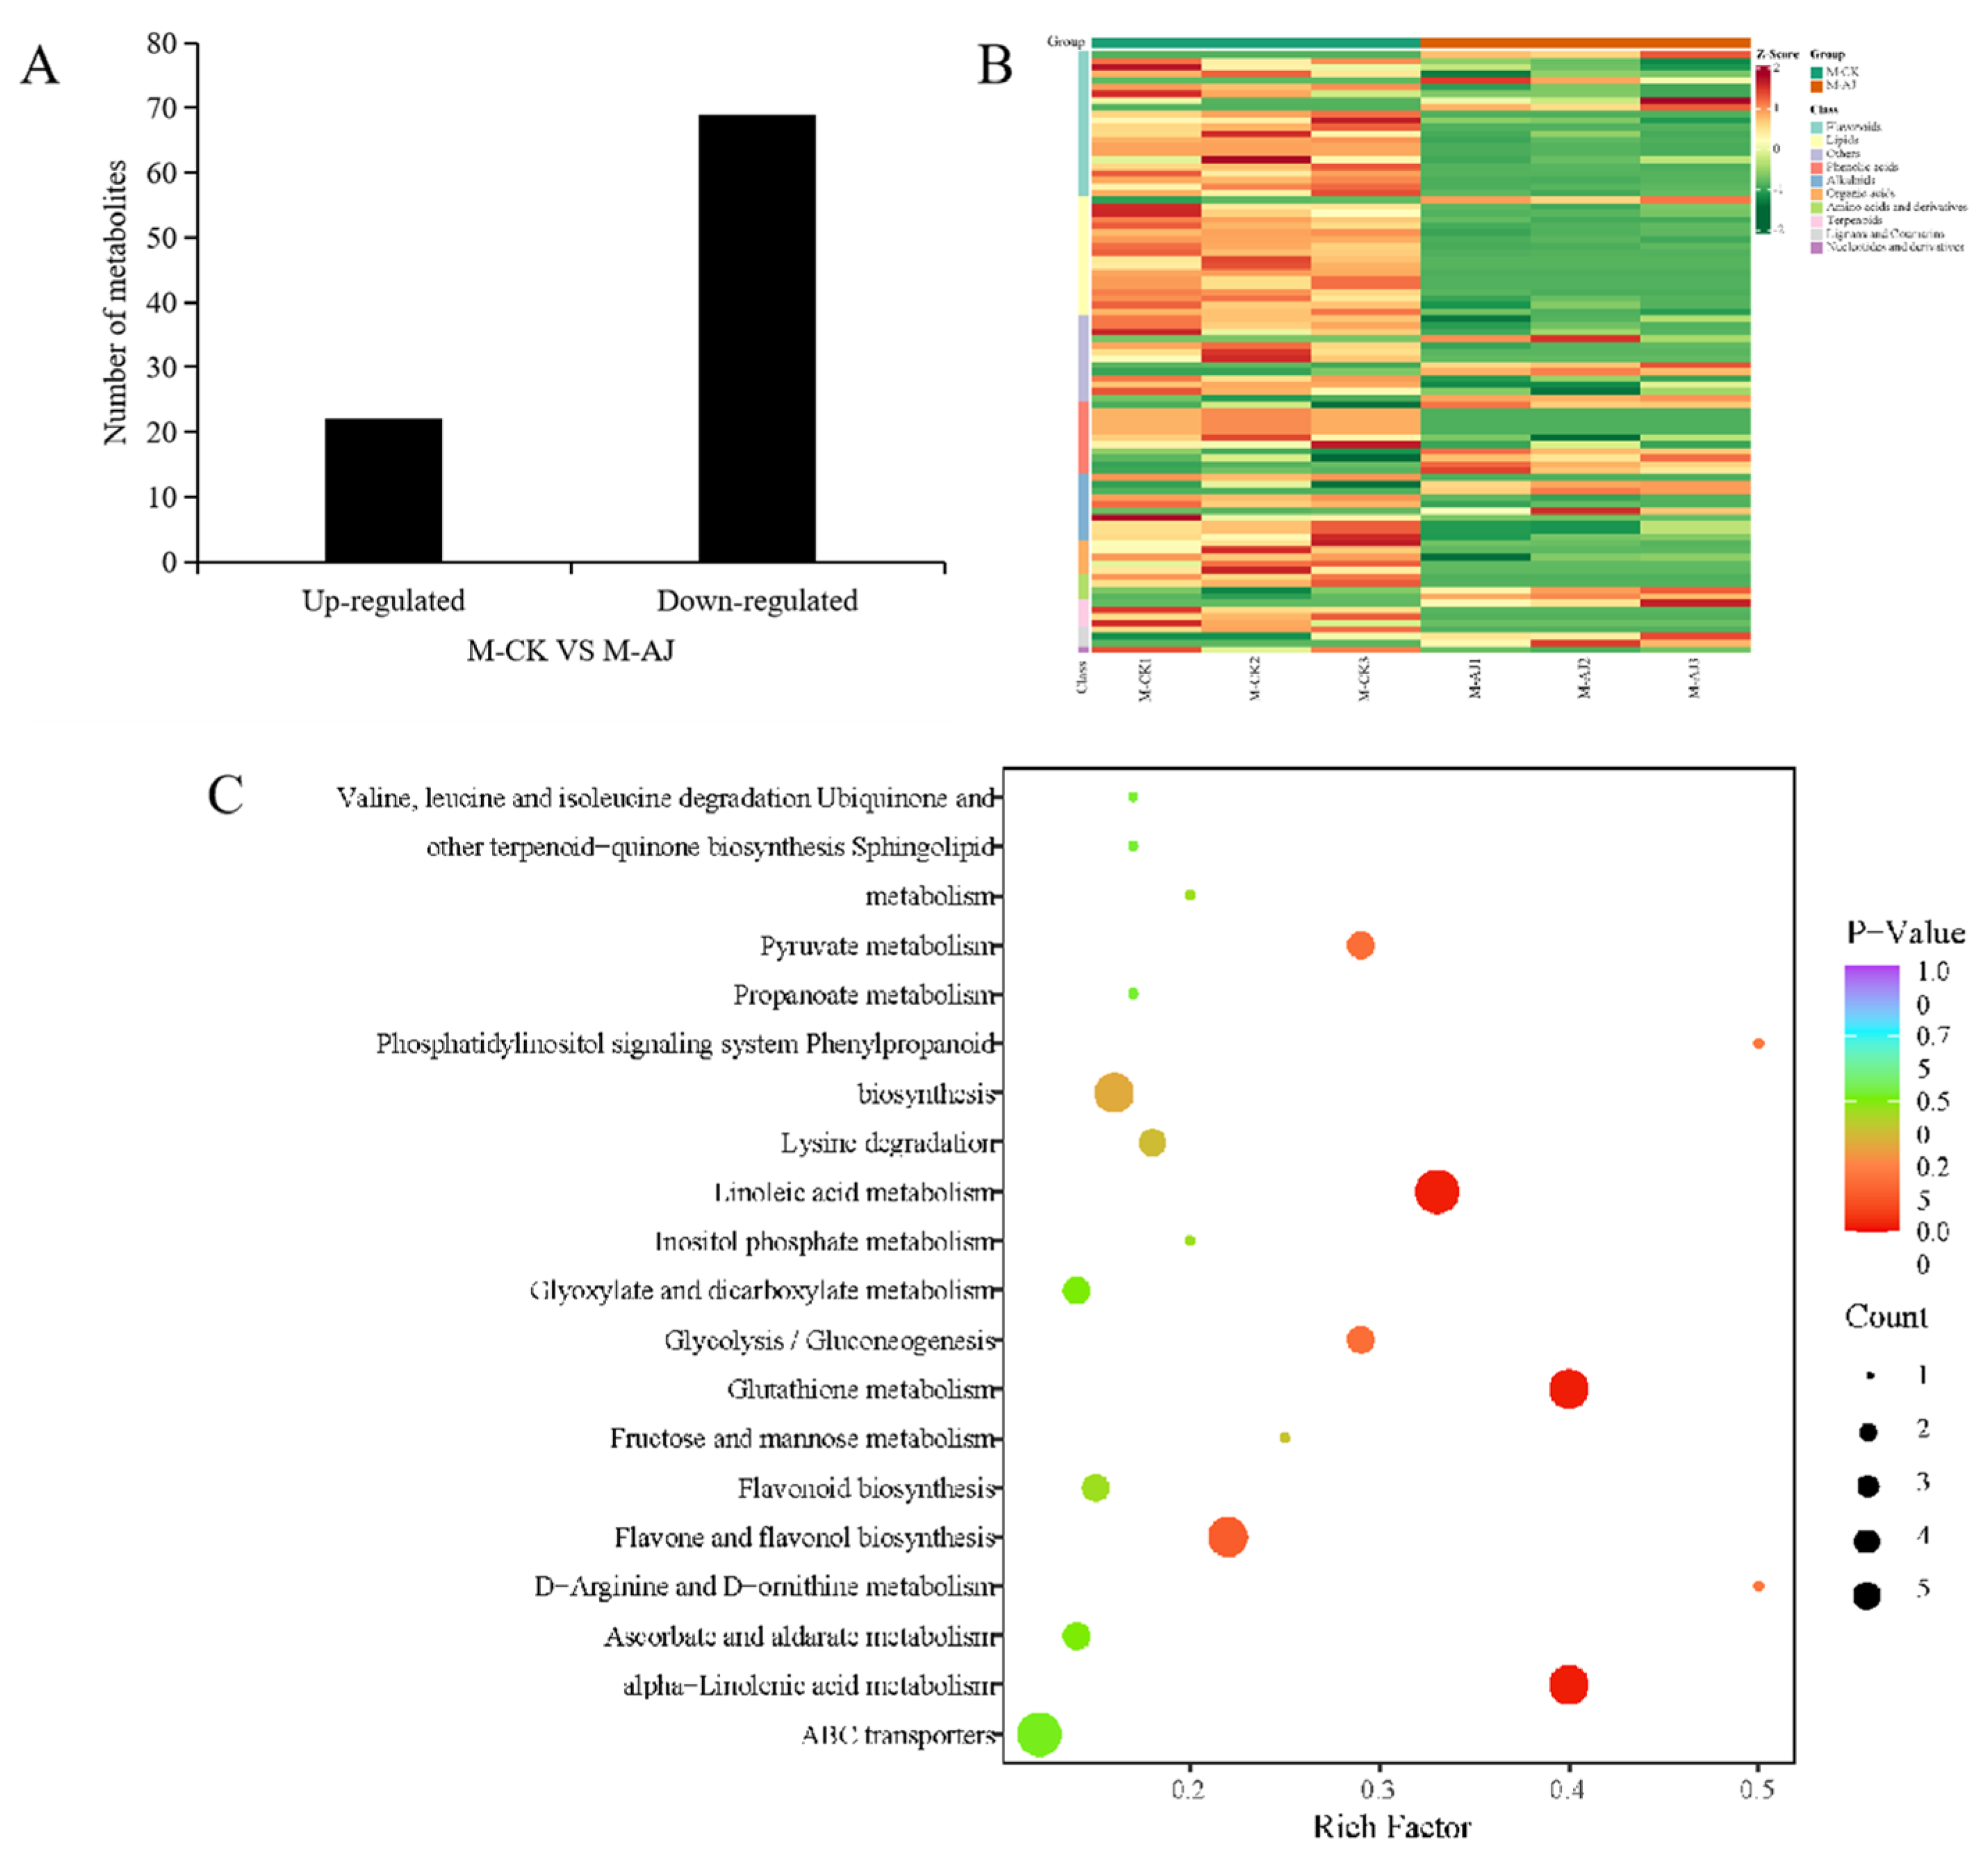
3.4. AJ Treatment Alters the Metabolic Pathway of Pak Choi

We selected three pak choi seedlings from each treatment group for nontargeted metabolomic sequencing to reveal the physiological and molecular mechanisms of the response of pak choi to AJ. The coefficient of variation (CV) values of the QC (a quality control sample prepared from the mixture of samples extracts) samples were calculated to determine the dispersion degree of the samples. The proportion of samples with CV values < 0.3 was >75%, indicating that the experimental data were very stable (Supplementary Figure S3). In the metabolomics results, the PCA analysis of metabolites across all samples revealed that the difference between the groups is clear and the repeatability within each group is good (Supplementary Figure S4A). Overall, 994 metabolites were identified in the CK and AJ treatment samples. These metabolites were categorised into 11 groups based on the total cluster plot analysis (Supplementary Figure S4B, Supplementary File S1). The differentially expressed metabolites (DEMs) were screened based on the FC ≥ 2 or ≤0.5 and VIP ≥ 1 criteria. Overall, 91 DEMs were screened, out of which 22 were upregulated and 69 were downregulated (Figure 5A). These DEMs were classified into 10 categories, mainly including flavonoids (22), lipids (18), others (13), phenolic acids (11), alkaloids (10), organic acids (5), amino acids and derivatives (4), terpenoids (4), lignans and coumarins (3), and nucleotides and derivatives (1). Figure 5B shows their classification and heat map expression analysis. Furthermore, according to KEGG pathway enrichment analysis, these DEMs were primarily considerably enriched in the alpha-linolenic acid metabolism, glutathione metabolism, linoleic acid metabolism, and flavone and flavonol biosynthesis pathways (Figure 5C).

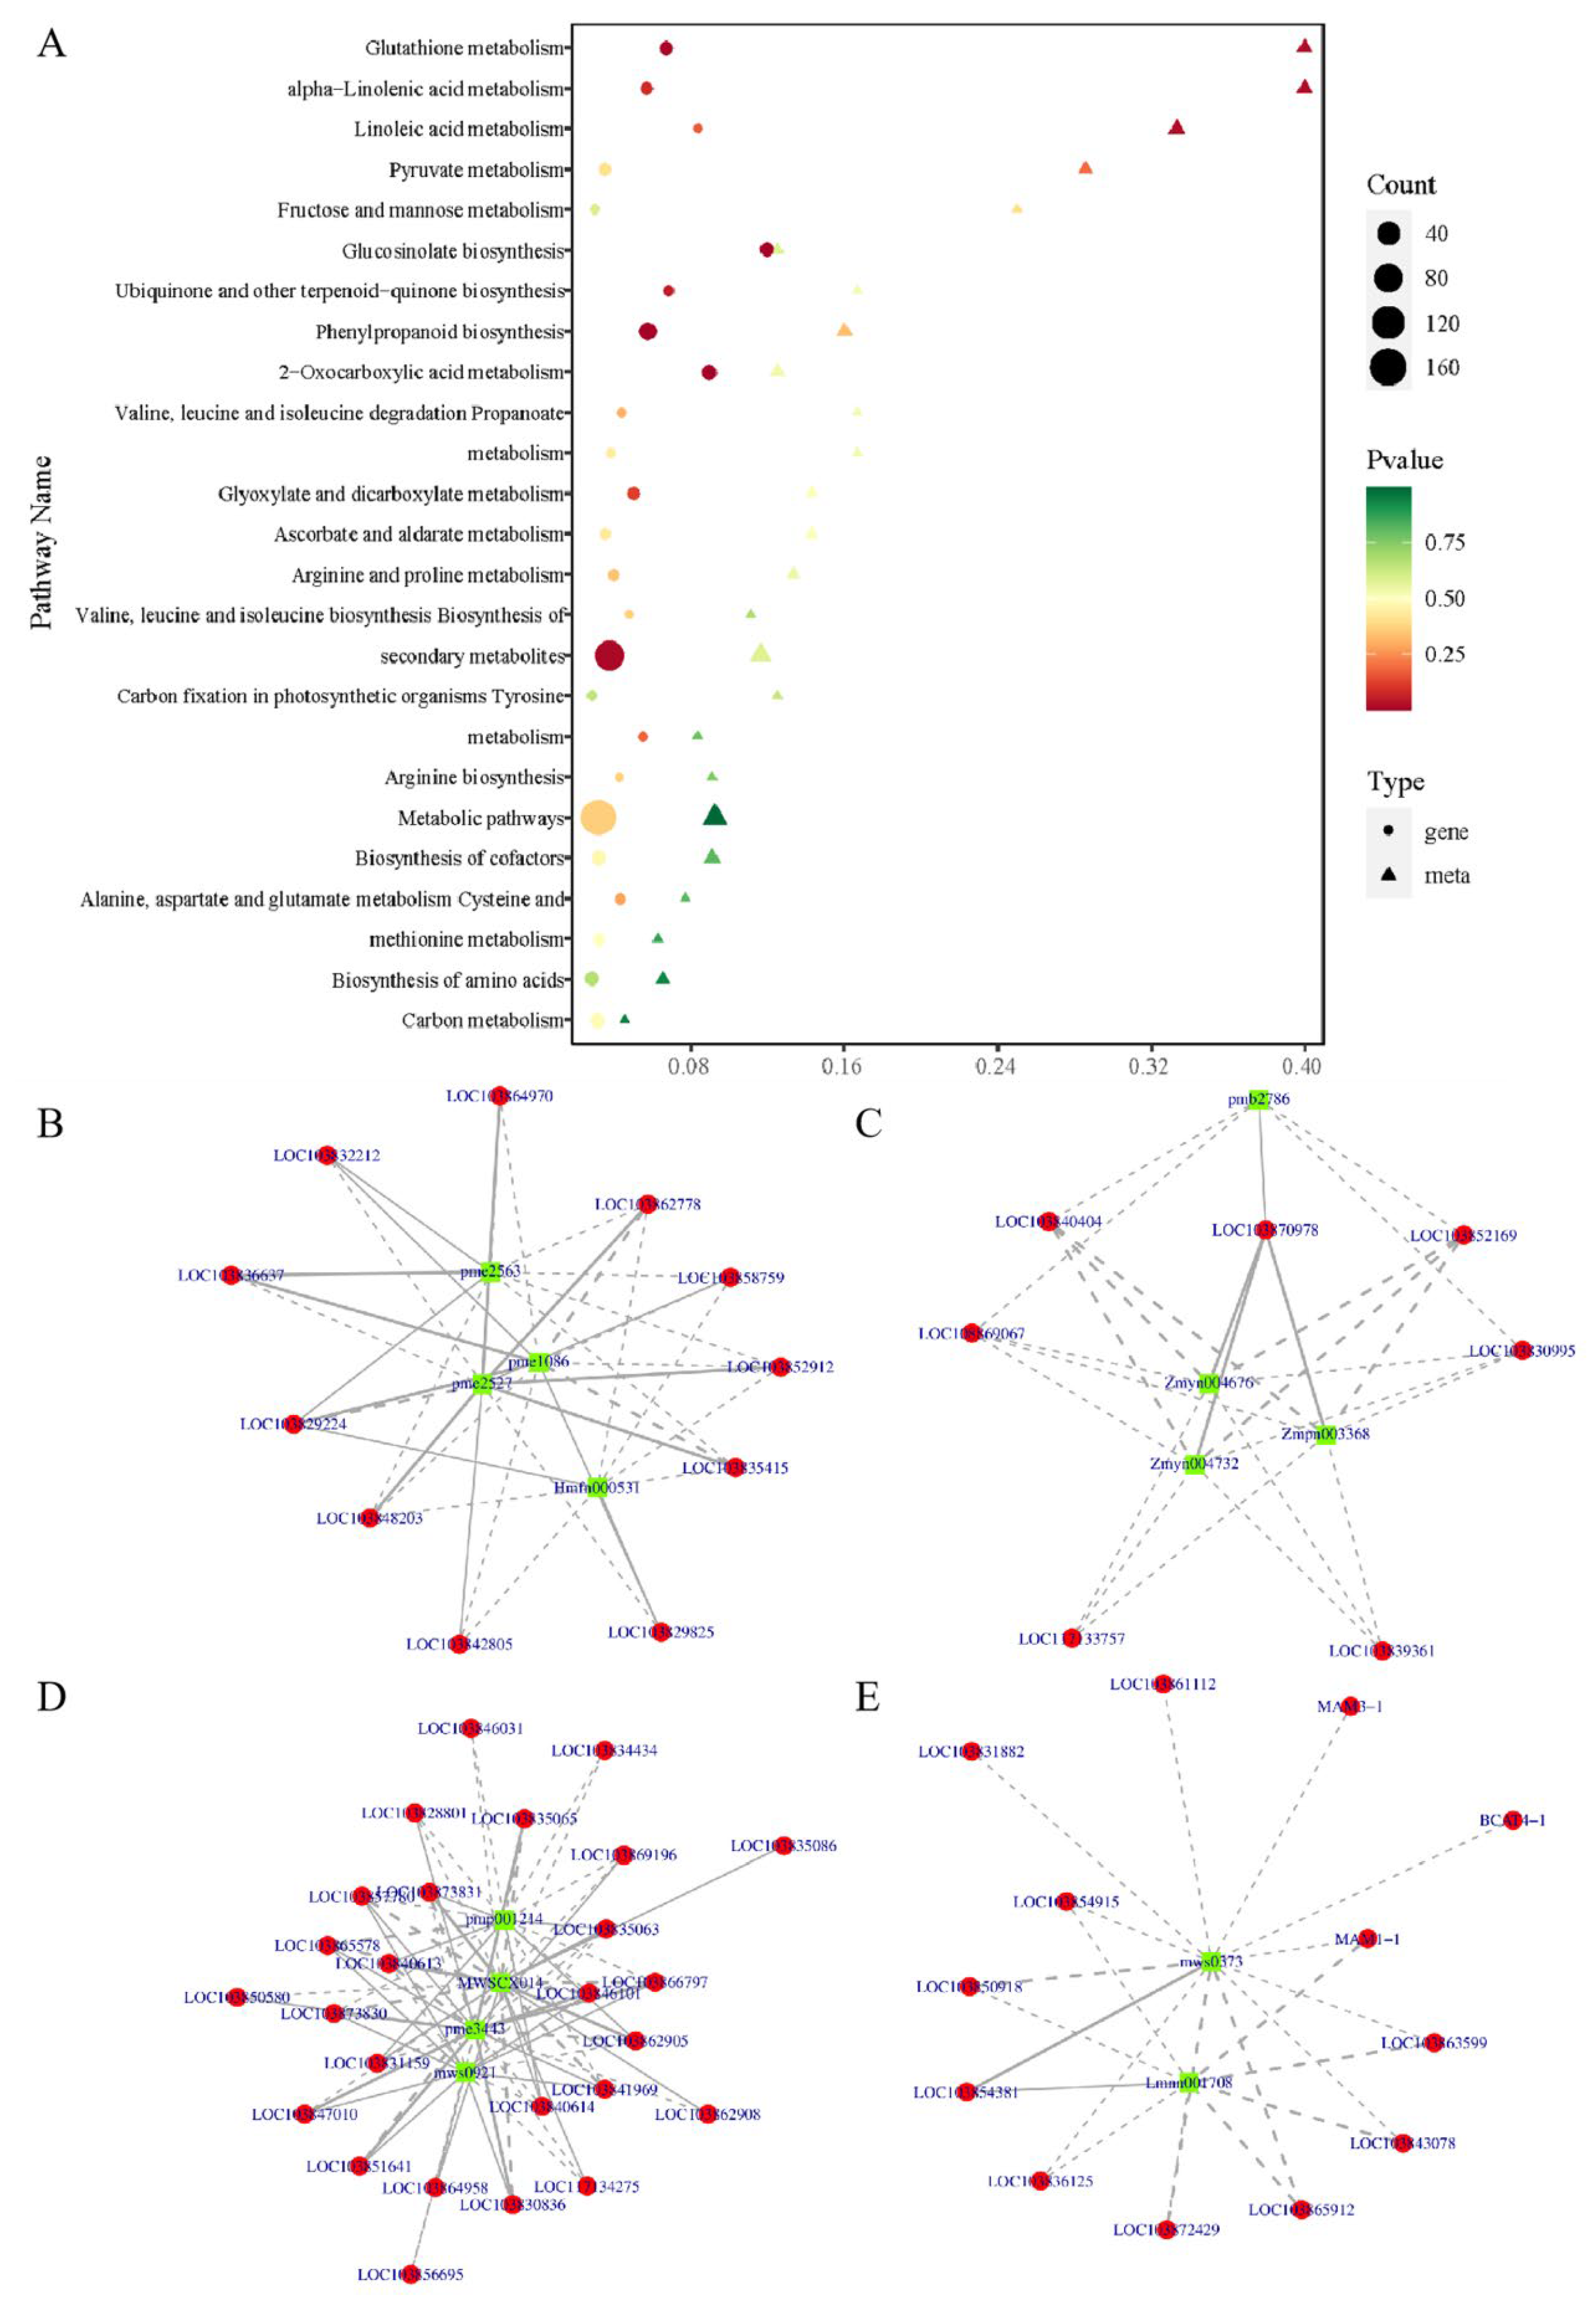
3.5. Integrated Transcriptome and Metabolome Analyses

KEGG enrichment analysis revealed that DEGs and DEMs in the phenylpropanoid biosynthesis (ko00940), glucosinolate biosynthesis (ko00966), glutathione metabolism (ko00480), and alpha-linolenic acid metabolism (ko00592) pathways were substantially enriched when combined with transcriptome and metabolome data (Figure 6A). We calculated the correlation between DEMs and DEGs and selected DEMs and DEGs with a Pearson correlation coefficient > 0.80 and p-value < 0.05, as indicated by the correlation network diagram of the above four pathways. Figure 6B–E show the results. The findings suggest that the AJ treatment may be involved in a complex network regulation relationship with phenylpropanoid biosynthesis, glucosinolate biosynthesis, glutathione metabolism, and alpha-linolenic acid metabolism, thus promoting the accumulation of these metabolites, and making pak choi resistant to environmental disturbance.

3.6. Combined Microbiome and Metabolome Analysis
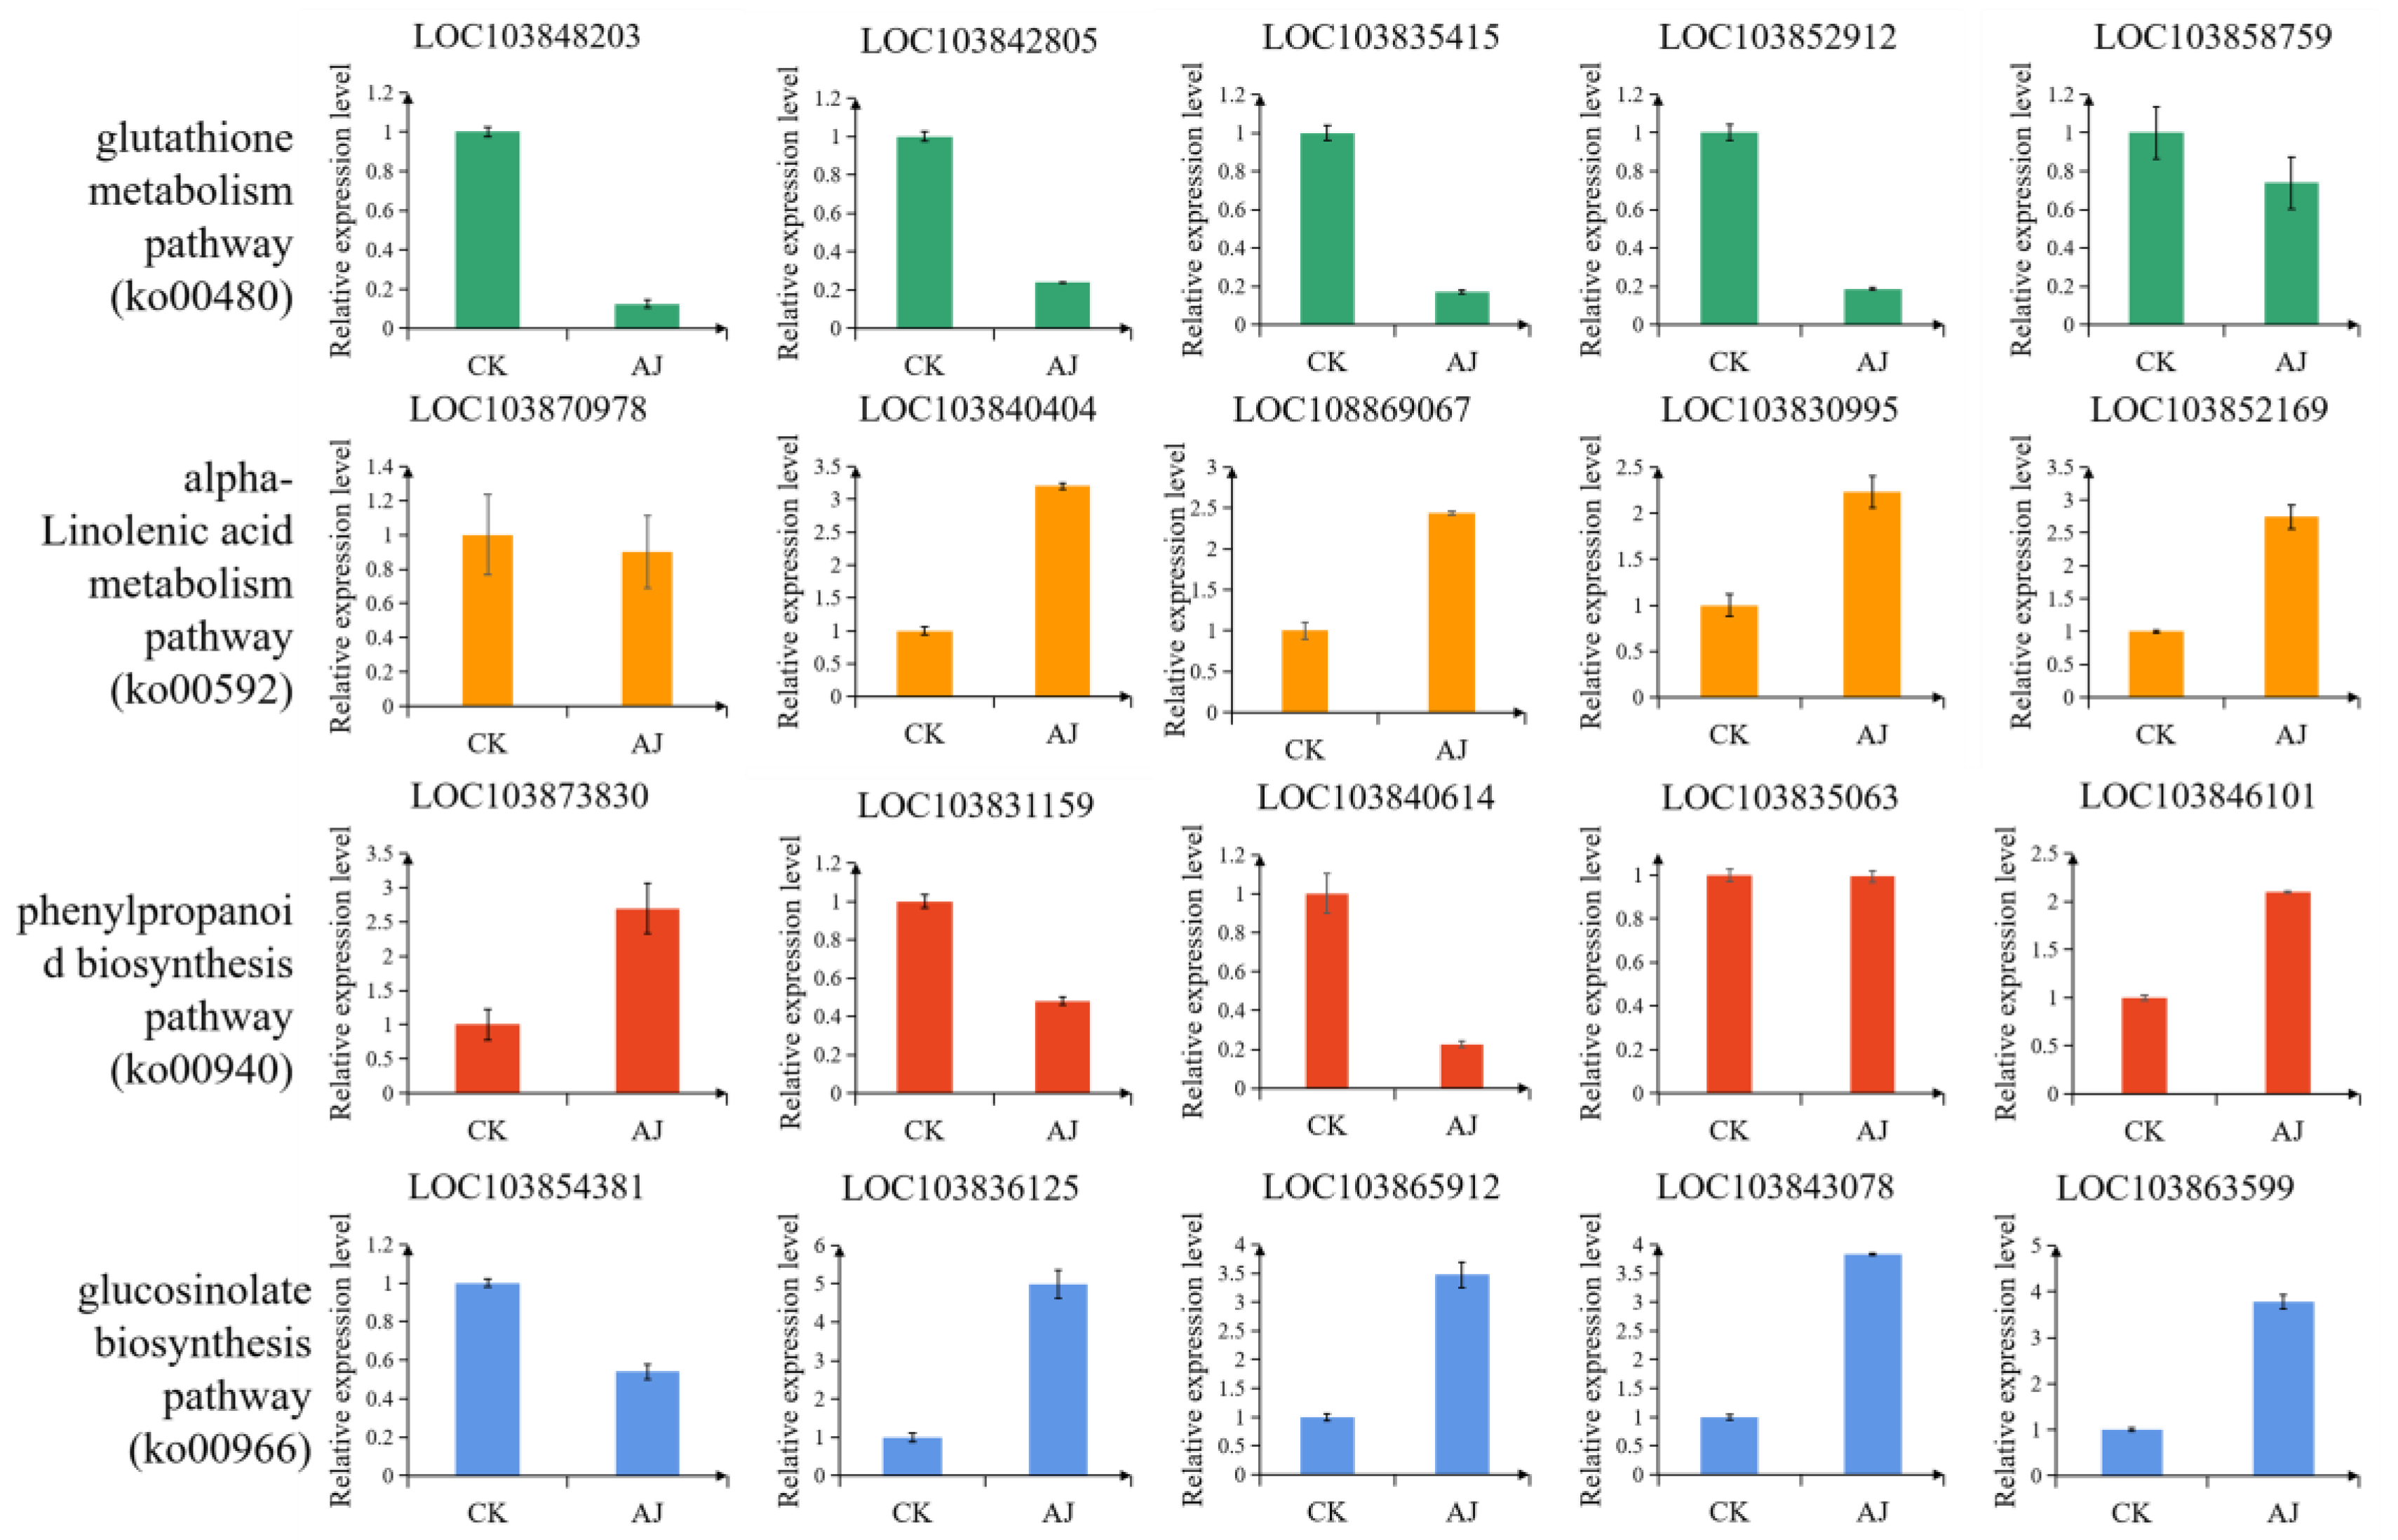
To further explore the relationship between rhizosphere microbial changes and pak choi growth, we analysed the combined results of 16S sequencing and pak choi metabolome detection. Spearman correlation hierarchical clustering analysis was performed on the differential microorganisms at the phylum level and differential metabolites to reveal the similarities and differences in the expression patterns of differential microorganisms and DEMs. Spearman correlation |r| ≥ 0.8 and p-value < 0.05 were used to screen DEMs and differential microorganisms at the phylum level. The results showed that Bacteroidota, Chlamydiae, Verrucomicrobiota, and Candidatus Kaiserbacteria exhibited comparable expression patterns and were positively correlated with the downregulated DEMs and negatively correlated with the upregulated DEMs. Actinobacteria, Firmicutes, and other microorganisms were positively correlated with the upregulated DEMs and negatively correlated with the downregulated DEMs (Figure 7A). The screened results were subsequently analysed using CCA. The same result was obtained comparable to that of Spearman correlation analysis (Figure 7B).

3.7. qRT-PCR

A total of 20 DEGs were randomly selected for the qRT-PCR verification. These genes, which were involved in phenylpropanoid biosynthesis, glucosinolate biosynthesis, glutathione metabolism, and alpha-linolenic acid metabolism pathways, yielded the same results as the transcriptome analysis (Figure 8), thereby indicating the reliability of the transcriptome results.

4. Discussion

4.1. Multiple Composition Guarantees Long-Term Effectiveness

Generally, abiotic stress reduce crop yields, leading to food crises [59]. Several plant-stress-resistant studies have focused on applying chemical regulators or BMs to improve plant stress resistance [60,61]. AJ, an integrated ecosystem of microorganisms and their metabolites, has been shown to improve soil and prevent root rot, among other things [28]. AJ has the dual functions of chemical regulatory substances and microorganisms. Furthermore, it is an efficient and environmentally friendly biological agent because it can be made from organic waste. In this study, we found that the application of AJ could improve the activity of antioxidant enzymes in pak choi (Figure 2). Hence, we hypothesize that the application of AJ might lead to changes in the transcription and metabolism of pak choi and affect rhizosphere microorganisms.
Our findings suggest that continuous application of AJ, rather than the addition of certain chemicals or microorganisms alone, can substantially boost antioxidant enzyme activity; however, it has no consequential effect on pak choi growth and development indicators. There are several biological control agents, organic amendments, and so forth; however, most do not thrive in soil and are inactive after a month [62]. In contrast, AJ can continue to function even after 30 d of pak choi growth. This may be due to the multiple components contained in AJ, such as mineral nutrients, organic acids, plant hormones, and effective live bacteria [63]. In addition, increasing the activity of antioxidant enzymes can enhance plant stress resistance [64,65] and promote plant tolerance to adversity [66,67]. In this study, the application of AJ considerably increased the activities of SOD, POD, and CAT enzymes, which is consistent with the findings from previous studies. Therefore, we believe that AJ has the potential to enhance plant stress resistance.

4.2. AJ Drives Stress Resistance by Altering Transcriptional and Metabolic Pathways

The application of AJ brought about differential expression of genes and metabolites with multiple functions, resulting in corresponding functional changes in the plants. In this study, phenylpropanoid biosynthesis, glucosinolate biosynthesis, glutathione metabolism, and alpha-linolenic acid metabolism pathways have received additional attention. In these four pathways, a large number of DEGs and DEMs underwent considerable enrichment. C2H2, MYB, AP2/ERF-ERF, and other transcription factors were found to be upregulated in transcriptome analysis. Numerous studies have shown that these genes can help induce stress resistance in plants. For example, the expressions of MYB, AP2/ERF-ERF, C2H2, and other genes in Eutrema salsugineum increased considerably under salt stress [68]. Additionally, exogenous melatonin activated AP2/ERF-ERF, MYB, NAC, and bZIP, thereby improving maize drought tolerance [69]. The expression levels of phenolic acid and flavonoid metabolites in AJ treatment group were upregulated. These two substances are the key players in plant response to stress [70]; they are both endproducts of the phenylpropanoid pathway [71,72]. Numerous studies have demonstrated that glucosinolate biosynthesis is another metabolic pathway related to plant stress resistance. For example, BrPP5.2 can regulate the heat tolerance of transgenic Brassica rapa by inducing glucosinolate biosynthesis [73]. Mild osmotic stress in Arabidopsis thaliana can promote the biosynthesis and accumulation of glucosinolates [74]. The glutathione metabolism pathway in yeast responds to the D-fructose stress [75]. Furthermore, alpha-linolenic acid responds to early chilling stress in pumpkin rootstock varieties [76]. There have been many similar studies on alpha-linolenic acid in animals [77].

4.3. AJ Drives Resistance by Altering the Rhizosphere Microbiome
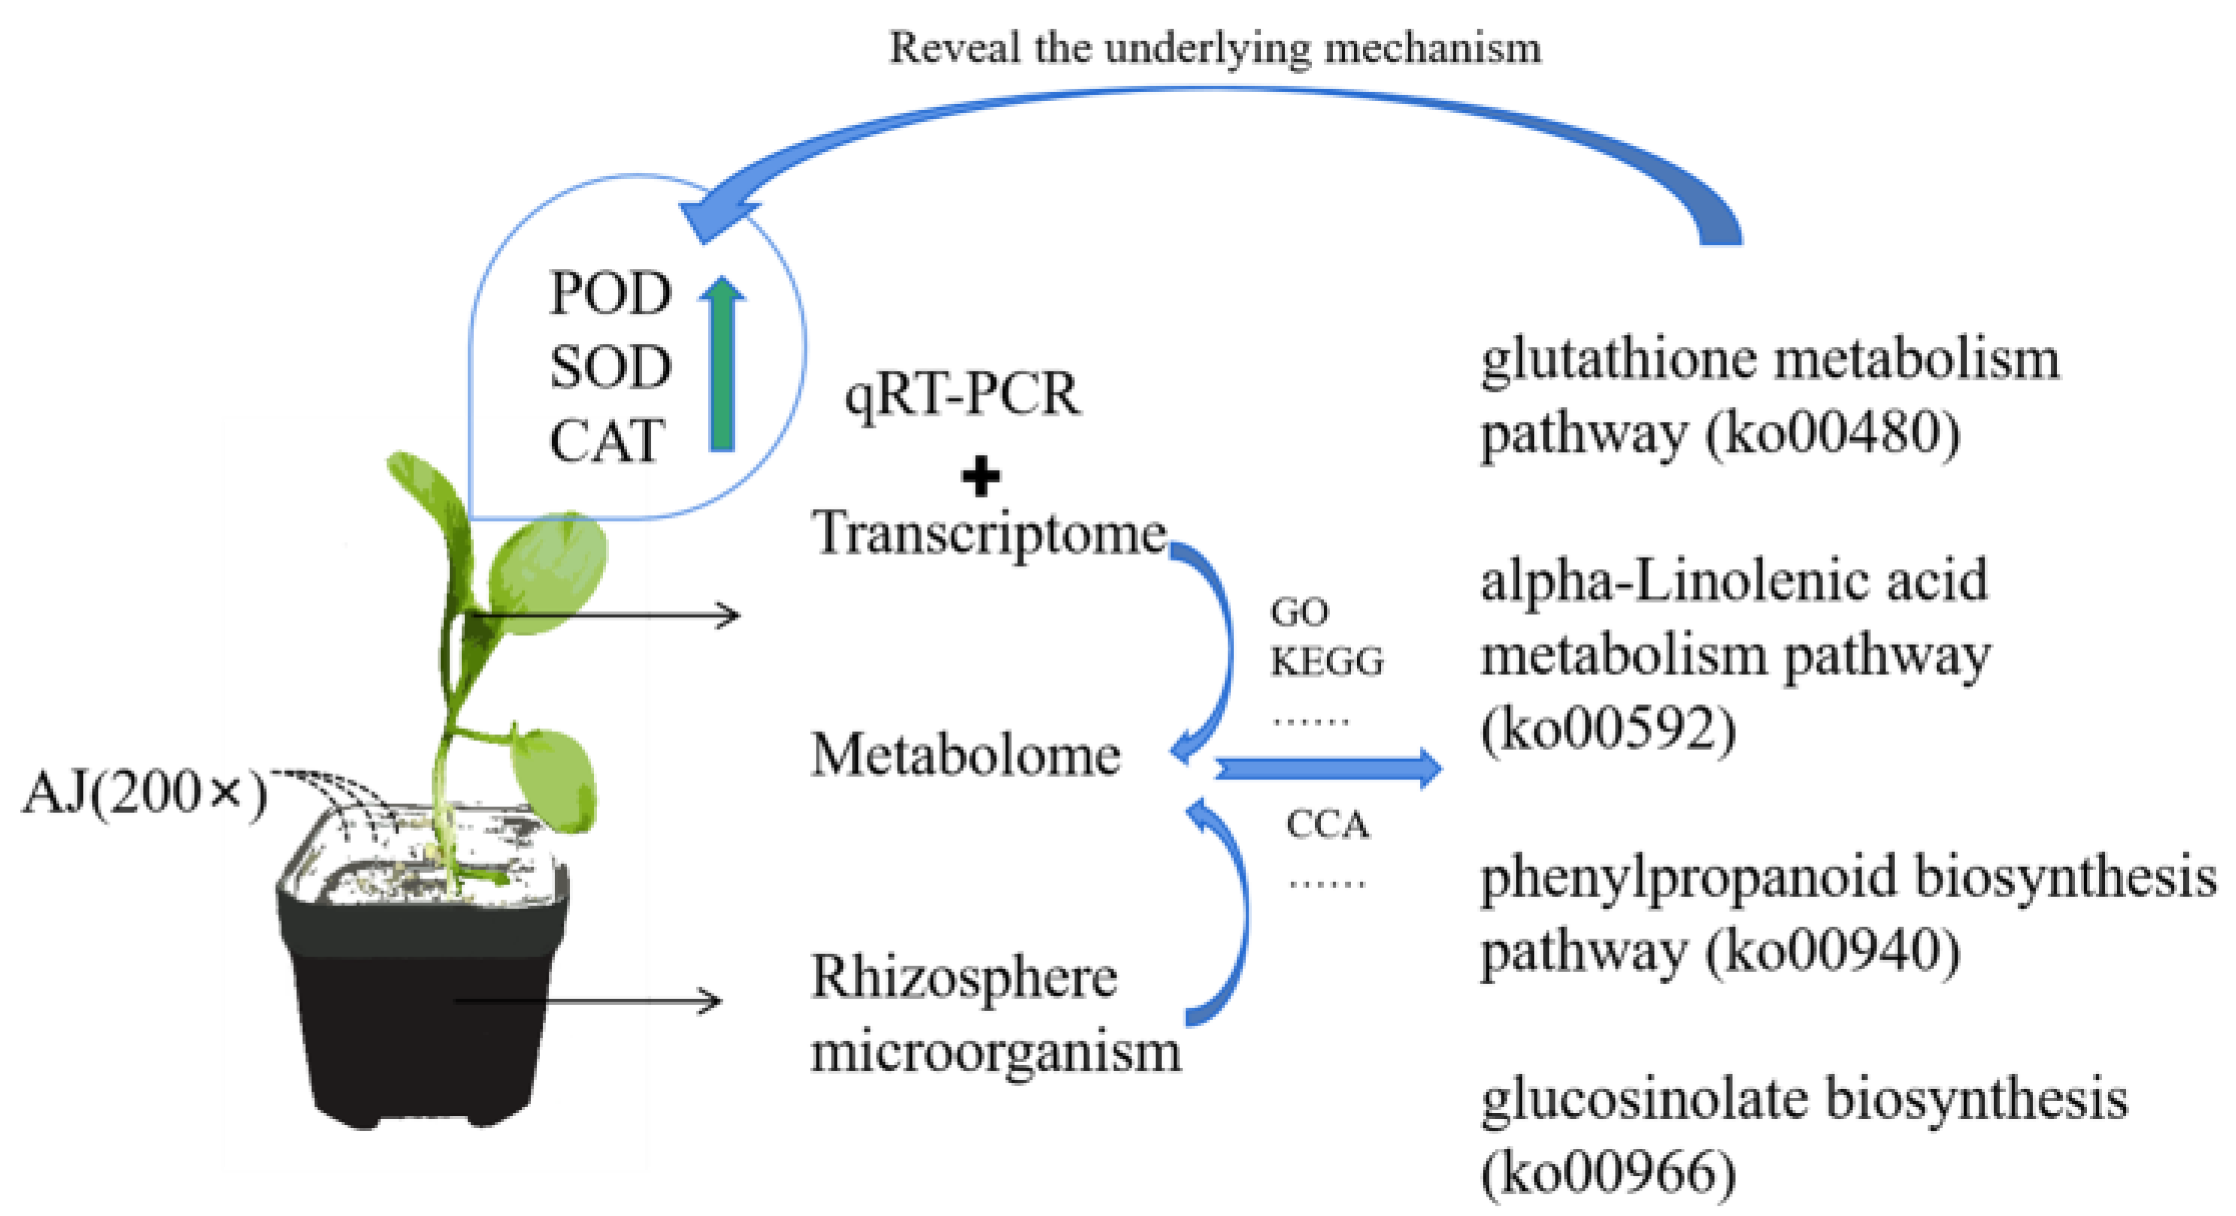
Although the rhizosphere microorganisms are invisible to the naked eye, their importance cannot be overemphasised. In this study, the application of AJ altered the community diversity of rhizosphere microorganisms but did not affect their abundance (Figure 3A,B); this may be due to the abundance of microorganisms in AJ. Bioorganic fertilisers bring about changes in rhizosphere microorganisms [78]. The application of AJ increased the abundance of Firmicutes, Actinobacteria, and Proteobacteria, which may be related to the presence of these groups of microorganisms in AJ (Figure 3C,D). Firmicutes and Actinobacteria can prevent the occurrence of bacterial wilt [79], whereas Proteobacteria can improve metabolic activity and promote growth and reproduction [80]. These bacteria have been linked to enhancing plant resistance to adversity. Combined analysis of the metabolomics and microbial data showed that these populations were significantly correlated with the upregulated DEMs (Figure 7). Therefore, these findings suggest that AJ could improve plant stress resistance by altering the rhizosphere microbial community.

5. Conclusions

Our study demonstrates that AJ could improve plant stress resistance through a combination of changes in rhizosphere microorganisms, plant genes, and metabolites. Specifically, our findings indicate that the expression levels of genes and metabolites related to glutathione and alpha-linolenic acid metabolisms as well as phenylpropanoid and glucosinolate biosynthesis pathways were upregulated. Furthermore, Firmicutes, Actinobacteria, and Proteobacteria were enriched in the rhizosphere. These results highlight the complex changes that occur in plants following AJ application and explain the mechanisms underlying stress resistance. Our findings encourage the application of AJ for improving plant stress resistance. Most importantly, this study provides a scientific basis for using AJ to improve agricultural production (Figure 9).

Supplementary Materials

The following supporting information can be downloaded at: https://www.mdpi.com/article/10.3390/agronomy13092310/s1, Figure S1: OTUs clustering analysis. Figure S2: PCA analysis of all transcriptome samples. Figure S3: CV value distribution of samples. The abscissa represents the CV value, the ordinate represents the proportion of the number of substances less than the corresponding CV value in the total number of substances, different colors represent different grouped samples, and mix is QC sample. Figure S4: The metabolites analysis in pak choi under CK and AJ treatment. A. The PCA analysis of all samples. Mix stands for the mixed sample of AJ and CK. B. Cluster analysis of overall metabolites in pak choi. Table S1: The detailed information of RNA sequencing. Table S2: The detailed information of the mapped reads from differnet samples. Table S3: qRT-PCR primer information.

Author Contributions

X.W. designed research; X.C. and Z.W. performed research; X.C. analysed data; X.C. wrote the article, and Y.G. and Y.C. participated in the revision. All authors have read and agreed to the published version of the manuscript.

Funding

This work was supported by the National Key Research and Development Program of China (project number: 2021YFD1901103) and the National Natural Science Foundation of China (project number: 52200178).

Data Availability Statement

All samples of the 16S and the original sequence of the transcriptome data submitted to NCBI sequence Read Archive database (https://www.ncbi.nlm.nih.gov/ accessed on 1 February 2023). Login numbers are PRJNA931644 and PRJNA931564, respectively.

Acknowledgments

The author thanks all members of the team for their help.

Conflicts of Interest

The authors declare no conflict of interest.

References

  1. Berger, J.P.J.; Vadez, V. Review: An integrated framework for crop adaptation to dry environments: Responses to transient and terminal drought. Plant Sci. Int. J. Exp. Plan. Biol. 2016, 253, 58–67. [Google Scholar] [CrossRef] [PubMed]
  2. Ullah, A.; Sun, H.; Yang, X.; Zhang, X. Drought coping strategies in cotton: Increased crop per drop. Plant Biotechnol. J. 2017, 15, 271–284. [Google Scholar] [CrossRef] [PubMed]
  3. Ruiz-Lozano, J.M.; Porcel, R.; Azcón, C.; Aroca, R. Regulation by arbuscular mycorrhizae of the integrated physiological response to salinity in plants: New challenges in physiological and molecular studies. J. Exp. Bot. 2012, 63, 4033–4044. [Google Scholar] [CrossRef] [PubMed]
  4. Gupta, A.; Rico-Medina, A.; Caño-Delgado, A.I. The physiology of plant responses to drought. Science 2020, 368, 266–269. [Google Scholar] [CrossRef]
  5. Zheng, S.; Su, M.; Wang, L.; Zhang, T.; Wang, J.; Xie, H.; Wu, X.; Haq, S.I.U.; Qiu, Q.S. Small signaling molecules in plant response to cold stress. J. Plant Physiol. 2021, 266, 153534. [Google Scholar] [CrossRef]
  6. Zhang, Q.; Liu, Y.; Jiang, Y.; Li, A.; Cheng, B.; Wu, J. OsASR6 Enhances Salt Stress Tolerance in Rice. Int. J. Mol. Sci. 2022, 23, 9340. [Google Scholar] [CrossRef]
  7. Ao, H.; Xie, X.; Huang, M.; Zou, Y. Decreasing hill density combined with increasing nitrogen rate led to yield decline in hybrid rice under low-light conditions. Sci. Rep. 2019, 9, 15786. [Google Scholar] [CrossRef]
  8. Li, R.; Zhang, J.; Wei, J.; Wang, H.; Ma, R. Functions and mechanisms of the CBL–CIPK signaling system in plant response to abiotic stress. Prog. Nat. Sci. 2009, 19, 667–676. [Google Scholar] [CrossRef]
  9. Cooper, M.; Gho, C.; Leafgren, R.; Tang, T.; Messina, C. Breeding drought-tolerant maize hybrids for the US corn-belt: Discovery to product. J. Exp. Bot. 2014, 65, 6191–6204. [Google Scholar] [CrossRef]
  10. Tang, L.; Ma, W.; Noor, M.A.; Li, L.; Hou, H.; Zhang, X.; Zhao, M. Density resistance evaluation of maize varieties through new “Density-Yield Model” and quantification of varietal response to gradual planting density pressure. Sci. Rep. 2018, 8, 17281. [Google Scholar] [CrossRef]
  11. Jud, W.; Winkler, J.B.; Niederbacher, B.; Niederbacher, S.; Schnitzler, J.P. Volatilomics: A non-invasive technique for screening plant phenotypic traits. Plant Methods 2018, 14, 109. [Google Scholar] [CrossRef]
  12. Zhang, G.; Zhao, F.; Chen, L.; Pan, Y.; Sun, L.; Bao, N.; Zhang, T.; Cui, C.X.; Qiu, Z.; Zhang, Y.; et al. Jasmonate-mediated wound signalling promotes plant regeneration. Nat. Plants 2019, 5, 491–497. [Google Scholar] [CrossRef] [PubMed]
  13. Zhou, W.; Lozano-Torres, J.L.; Blilou, I.; Zhang, X.; Zhai, Q.; Smant, G.; Li, C.; Scheres, B. A Jasmonate Signaling Network Activates Root Stem Cells and Promotes Regeneration. Cell 2019, 177, 942–956.e14. [Google Scholar] [CrossRef] [PubMed]
  14. Gilliard, G.; Huby, E.; Cordelier, S.; Ongena, M.; Dhondt-Cordelier, S.; Deleu, M. Protoplast: A Valuable Toolbox to Investigate Plant Stress Perception and Response. Front. Plant Sci. 2021, 12, 749581. [Google Scholar] [CrossRef]
  15. Lu, J.; Du, J.; Tian, L.; Li, M.; Zhang, X.; Zhang, S.; Wan, X.; Chen, Q. Divergent Response Strategies of CsABF Facing Abiotic Stress in Tea Plant: Perspectives from Drought-Tolerance Studies. Front. Plant Sci. 2021, 12, 763843. [Google Scholar] [CrossRef]
  16. Huo, T.; Wang, C.T.; Yu, T.F.; Wang, D.M.; Li, M.; Zhao, D.; Li, X.T.; Fu, J.D.; Xu, Z.S.; Song, X.Y. Overexpression of ZmWRKY65 transcription factor from maize confers stress resistances in transgenic Arabidopsis. Sci. Rep. 2021, 11, 4024. [Google Scholar] [CrossRef] [PubMed]
  17. Friedman, A.R.; Baker, B.J. The evolution of resistance genes in multi-protein plant resistance systems. Curr. Opin. Genet. Dev. 2007, 17, 493–499. [Google Scholar] [CrossRef]
  18. Yoshida, K. Plant biotechnology—Genetic engineering to enhance plant salt tolerance. J. Biosci. Bioeng. 2002, 94, 585–590. [Google Scholar] [CrossRef]
  19. Fan, R.; Su, X.; Guo, Y.; Sun, F.; Qu, Y.; Chen, Q. Cotton seedling drought tolerance is improved via salt preconditioning. Protoplasma 2021, 258, 263–277. [Google Scholar] [CrossRef]
  20. Zhang, Y.; Wang, L.; Liu, Y.; Zhang, Q.; Wei, Q.; Zhang, W. Nitric oxide enhances salt tolerance in maize seedlings through increasing activities of proton-pump and Na+/H+ antiport in the tonoplast. Planta 2006, 224, 545–555. [Google Scholar] [CrossRef]
  21. Doan, T.T.; Henry-des-Tureaux, T.; Rumpel, C.; Janeau, J.L.; Jouquet, P. Impact of compost, vermicompost and biochar on soil fertility, maize yield and soil erosion in Northern Vietnam: A three years mesocosm experiment. Sci. Total Environ. 2015, 514, 147–154. [Google Scholar] [CrossRef] [PubMed]
  22. Dring, M.J. Stress Resistance and Disease Resistance in Seaweeds: The Role of Reactive Oxygen Metabolism. Adv. Bot. Res. 2005, 43, 175–207. [Google Scholar]
  23. Ruzzi, M.; Aroca, R. Plant growth-promoting rhizobacteria act as biostimulants in horticulture. Sci. Hortic. 2015, 196, 124–134. [Google Scholar] [CrossRef]
  24. Vitale, L.; Vitale, E.; Francesca, S.; Lorenz, C.; Arena, C. Plant-Growth Promoting Microbes Change the Photosynthetic Response to Light Quality in Spinach. Plants 2023, 12, 1149. [Google Scholar] [CrossRef] [PubMed]
  25. Vitale, L.; Vitale, E.; Guercia, G.; Turano, M.; Arena, C. Effects of different light quality and biofertilizers on structural and physiological traits of spinach plants. Photosynthetica 2020, 58, 932–943. [Google Scholar] [CrossRef]
  26. Evseeva, N.V.; Tkachenko, O.V.; Denisova, A.Y.; Burygin, G.L.; Veselov, D.S.; Matora, L.Y.; Shchyogolev, S.Y. Functioning of plant-bacterial associations under osmotic stress in vitro. World J. Microbiol. Biotechnol. 2019, 35, 195. [Google Scholar] [CrossRef]
  27. Zhang, Y.; Gao, Y.; Zheng, Z.; Meng, X.; Cai, Y.; Liu, J.; Hu, Y.; Yan, S.; Wang, X. A microbial ecosystem: Agricultural Jiaosu achieves effective and lasting antifungal activity against Botrytis cinerea. AMB Express 2020, 10, 216. [Google Scholar] [CrossRef]
  28. Gao, Y.; Zhang, Y.; Cheng, X.; Zheng, Z.; Wu, X.; Dong, X.; Hu, Y.; Wang, X. Agricultural Jiaosu: An Eco-Friendly and Cost-Effective Control Strategy for Suppressing Fusarium Root Rot Disease in Astragalus membranaceus. Front. Microbiol. 2022, 13, 823704. [Google Scholar] [CrossRef]
  29. Shen, S.; Wu, Y.; Zheng, Y. Review on drought response in plants from phenotype to molecular. Curr. Biotechnol. 2017, 7, 169–176. [Google Scholar]
  30. Leksungnoen, N. The Relationship between Salinity and Drought Tolerance in Turfgrasses and Woody Species; Utah State University: Logan, UT, USA, 2012. [Google Scholar]
  31. Zhao, S.; Zhang, Q.; Liu, M.; Zhou, H.; Ma, C.; Wang, P. Regulation of Plant Responses to Salt Stress. Int. J. Mol. Sci. 2021, 22, 4609. [Google Scholar] [CrossRef]
  32. Vitale, L.; Vitale, E.; Bianchi, A.R.; Maio, A.D.; Arena, C. Role of Poly (ADP-Ribose) Polymerase (PARP) Enzyme in the Systemic Acquired Acclimation Induced by Light Stress in Phaseolus vulgaris L. Plants. Plants 2022, 11, 1870. [Google Scholar] [CrossRef]
  33. Gohari, G.; Panahirad, S.; Sepehri, N.; Akbari, A.; Zahedi, S.M.; Jafari, H.; Dadpour, M.R.; Fotopoulos, V. Enhanced tolerance to salinity stress in grapevine plants through application of carbon quantum dots functionalized by proline. Environ. Sci. Pollut. Res. Int. 2021, 28, 42877–42890. [Google Scholar] [CrossRef]
  34. Shao, H.B.; Chu, L.Y.; Shao, M.A.; Jaleel, C.A.; Mi, H.M. Higher plant antioxidants and redox signaling under environmental stresses. Comptes Rendus Biol. 2008, 331, 433–441. [Google Scholar] [CrossRef]
  35. Taj, Z.; Challabathula, D. Protection of Photosynthesis by Halotolerant Staphylococcus sciuri ET101 in Tomato (Lycoperiscon esculentum) and Rice (Oryza sativa) Plants During Salinity Stress: Possible Interplay between Carboxylation and Oxygenation in Stress Mitigation. Front. Microbiol. 2020, 11, 547750. [Google Scholar] [CrossRef] [PubMed]
  36. Sewelam, N.; Kazan, K.; Thomas-Hall, S.R.; Kidd, B.N.; Manners, J.M.; Schenk, P.M. Ethylene response factor 6 is a regulator of reactive oxygen species signaling in Arabidopsis. PLoS ONE 2013, 8, e70289. [Google Scholar] [CrossRef] [PubMed]
  37. Apel, K.; Hirt, H. Reactive oxygen species: Metabolism, oxidative stress, and signal transduction. Annu. Rev. Plant Biol. 2004, 55, 373–399. [Google Scholar] [CrossRef] [PubMed]
  38. Yang, D.S.; Sax, M.; Chakrabartty, A.; Hew, C.L. Crystal structure of an antifreeze polypeptide and its mechanistic implications. Nature 1988, 333, 232–237. [Google Scholar] [CrossRef]
  39. Kenward, K.D.; Altschuler, M.; Hildebrand, D.; Davies, P.L. Accumulation of type I fish antifreeze protein in transgenic tobacco is cold-specific. Plant Mol. Biol. 1993, 23, 377–385. [Google Scholar] [CrossRef]
  40. Kovtun, Y.; Chiu, W.L.; Tena, G.; Sheen, J. Functional analysis of oxidative stress-activated mitogen-activated protein kinase cascade in plants. Proc. Natl. Acad. Sci. USA 2000, 97, 2940–2945. [Google Scholar] [CrossRef]
  41. Shou, H.; Bordallo, P.; Fan, J.B.; Yeakley, J.M.; Bibikova, M.; Sheen, J.; Wang, K. Expression of an active tobacco mitogen-activated protein kinase enhances freezing tolerance in transgenic maize. Proc. Natl. Acad. Sci. USA 2004, 101, 3298–3303. [Google Scholar] [CrossRef]
  42. Saijo, Y.; Hata, S.; Kyozuka, J.; Shimamoto, K.; Izui, K. Over-expression of a single Ca2+-dependent protein kinase confers both cold and salt/drought tolerance on rice plants. Plant J. 2000, 23, 319–327. [Google Scholar] [CrossRef] [PubMed]
  43. Zhu, J.K. Salt and drought stress signal transduction in plants. Annu. Rev. Plant Biol. 2002, 53, 247–273. [Google Scholar] [CrossRef] [PubMed]
  44. Yoshida, T.; Mogami, J.; Yamaguchi-Shinozaki, K. ABA-dependent and ABA-independent signaling in response to osmotic stress in plants. Curr. Opin. Plant Biol. 2014, 21, 133–139. [Google Scholar] [CrossRef] [PubMed]
  45. Chen, M.; Fang, X.; Wang, Z.; Shangguan, L.; Liu, T.; Chen, C.; Liu, Z.; Ge, M.; Zhang, C.; Zheng, T.; et al. Multi-omics analyses on the response mechanisms of ‘Shine Muscat’ grapevine to low degree of excess copper stress (Low-ECS). Environ. Pollut. 2021, 286, 117278. [Google Scholar] [CrossRef] [PubMed]
  46. Zhao, B.; Zhang, S.; Yang, W.; Li, B.; Lan, C.; Zhang, J.; Yuan, L.; Wang, Y.; Xie, Q.; Han, J.; et al. Multi-omic dissection of the drought resistance traits of soybean landrace LX. Plant Cell Environ. 2021, 44, 1379–1398. [Google Scholar] [CrossRef]
  47. Li, Y.; Li, X.; Zhang, J.; Li, D.; Yan, L.; You, M.; Zhang, J.; Lei, X.; Chang, D.; Ji, X.; et al. Physiological and Proteomic Responses of Contrasting Alfalfa (Medicago sativa L.) Varieties to High Temperature Stress. Front. Plant Sci. 2021, 12, 753011. [Google Scholar] [CrossRef]
  48. Hübner, S.; Korol, A.B.; Schmid, K.J. RNA-Seq analysis identifies genes associated with differential reproductive success under drought-stress in accessions of wild barley Hordeum spontaneum. BMC Plant Biol. 2015, 15, 134. [Google Scholar] [CrossRef]
  49. Fracasso, A.; Trindade, L.M.; Amaducci, S. Drought stress tolerance strategies revealed by RNA-Seq in two sorghum genotypes with contrasting WUE. BMC Plant Biol. 2016, 16, 115. [Google Scholar] [CrossRef]
  50. Dong, B.; Wu, B.; Hong, W.; Li, X.; Li, Z.; Xue, L.; Huang, Y. Transcriptome analysis of the tea oil camellia (Camellia oleifera) reveals candidate drought stress genes. PLoS ONE 2017, 12, e0181835. [Google Scholar] [CrossRef]
  51. Hu, L.; Xie, Y.; Fan, S.; Wang, Z.; Wang, F.; Zhang, B.; Li, H.; Song, J.; Kong, L. Comparative analysis of root transcriptome profiles between drought-tolerant and susceptible wheat genotypes in response to water stress. Plant Sci. 2018, 272, 276–293. [Google Scholar] [CrossRef]
  52. Zhang, J.; Luo, W.; Zhao, Y.; Xu, Y.; Song, S.; Chong, K. Comparative metabolomic analysis reveals a reactive oxygen species-dominated dynamic model underlying chilling environment adaptation and tolerance in rice. New Phytol. 2016, 211, 1295–1310. [Google Scholar] [CrossRef]
  53. Wang, Y.; Lysøe, E.; Armarego-Marriott, T.; Erban, A.; Paruch, L.; van Eerde, A.; Bock, R.; Liu-Clarke, J. Transcriptome and metabolome analyses provide insights into root and root-released organic anion responses to phosphorus deficiency in oat. J. Exp. Bot. 2018, 69, 3759–3771. [Google Scholar] [CrossRef]
  54. Xu, L.; Dong, Z.; Chiniquy, D.; Pierroz, G.; Deng, S.; Gao, C.; Diamond, S.; Simmons, T.; Wipf, H.M.; Caddell, D.; et al. Genome-resolved metagenomics reveals role of iron metabolism in drought-induced rhizosphere microbiome dynamics. Nat. Commun. 2021, 12, 3209. [Google Scholar] [CrossRef] [PubMed]
  55. de Vries, F.T.; Griffiths, R.I.; Knight, C.G.; Nicolitch, O.; Williams, A. Harnessing rhizosphere microbiomes for drought-resilient crop production. Science 2020, 368, 270–274. [Google Scholar] [CrossRef] [PubMed]
  56. Porebski, S.; Bailey, L.G.; Baum, B.R. Modification of a CTAB DNA extraction protocol for plants containing high polysaccharide and polyphenol components. Plant Mol. Biol. Report. 1997, 15, 8–15. [Google Scholar] [CrossRef]
  57. Ma, L.; Qi, W.; Bai, J.; Li, H.; Fang, Y.; Xu, J.; Xu, Y.; Zeng, X.; Pu, Y.; Wang, W.; et al. Genome-Wide Identification and Analysis of the Ascorbate Peroxidase (APX) Gene Family of Winter Rapeseed (Brassica rapa L.) Under Abiotic Stress. Front. Genet. 2021, 12, 753624. [Google Scholar] [CrossRef] [PubMed]
  58. Livak, K.J.; Schmittgen, T.D. Analysis of relative gene expression data using real-time quantitative PCR and the 2(-Delta Delta C(T)) Method. Methods 2001, 25, 402–408. [Google Scholar] [CrossRef] [PubMed]
  59. Krasensky, J.; Jonak, C. Drought, salt, and temperature stress-induced metabolic rearrangements and regulatory networks. J. Exp. Bot. 2012, 63, 1593–1608. [Google Scholar] [CrossRef]
  60. Naservafaei, S.; Sohrabi, Y.; Moradi, P.; Mac Sweeney, E.; Mastinu, A. Biological Response of Lallemantia iberica to Brassinolide Treatment under Different Watering Conditions. Plants 2021, 10, 496. [Google Scholar] [CrossRef]
  61. Deng, X.; Zhang, N.; Li, Y.; Zhu, C.; Qu, B.; Liu, H.; Li, R.; Bai, Y.; Shen, Q.; Salles, J.F. Bio-organic soil amendment promotes the suppression of Ralstonia solanacearum by inducing changes in the functionality and composition of rhizosphere bacterial communities. New Phytol. 2022, 235, 1558–1574. [Google Scholar] [CrossRef]
  62. Lourenço, K.S.; Suleiman, A.K.A.; Pijl, A.; van Veen, J.A.; Cantarella, H.; Kuramae, E.E. Resilience of the resident soil microbiome to organic and inorganic amendment disturbances and to temporary bacterial invasion. Microbiome 2018, 6, 142. [Google Scholar] [CrossRef]
  63. Arun, C.; Sivashanmugam, P. Solubilization of waste activated sludge using a garbage enzyme produced from different pre-consumer organic waste. RSC Adv. 2015, 5, 51421–51427. [Google Scholar] [CrossRef]
  64. Mittler, R.; Zilinskas, B.A. Purification and characterization of pea cytosolic ascorbate peroxidase. Plant Physiol. 1991, 97, 962–968. [Google Scholar] [CrossRef]
  65. Mittler, R.; Zilinskas, B.A. Regulation of pea cytosolic ascorbate peroxidase and other antioxidant enzymes during the progression of drought stress and following recovery from drought. Plant J. 1994, 5, 397–405. [Google Scholar] [CrossRef]
  66. Foyer, C.H.; Souriau, N.; Perret, S.; Lelandais, M.; Kunert, K.J.; Pruvost, C.; Jouanin, L. Overexpression of glutathione reductase but not glutathione synthetase leads to increases in antioxidant capacity and resistance to photoinhibition in poplar trees. Plant Physiol. 1995, 109, 1047–1057. [Google Scholar] [CrossRef]
  67. Samis, K.; Bowley, S.; McKersie, B. Pyramiding Mn-superoxide dismutase transgenes to improve persistence and biomass production in alfalfa. J. Exp. Bot. 2002, 53, 1343–1350. [Google Scholar]
  68. Li, C.; Qi, Y.; Zhao, C.; Wang, X.; Zhang, Q. Transcriptome Profiling of the Salt Stress Response in the Leaves and Roots of Halophytic Eutrema salsugineum. Front. Genet. 2021, 12, 770742. [Google Scholar] [CrossRef]
  69. Zhao, C.; Yang, M.; Wu, X.; Wang, Y.; Zhang, R. Physiological and transcriptomic analyses of the effects of exogenous melatonin on drought tolerance in maize (Zea mays L.). Plant Physiol. Biochem. 2021, 168, 128–142. [Google Scholar] [CrossRef]
  70. Sharma, A.; Shahzad, B.; Rehman, A.; Bhardwaj, R.; Landi, M.; Zheng, B. Response of Phenylpropanoid Pathway and the Role of Polyphenols in Plants under Abiotic Stress. Molecules 2019, 24, 2452. [Google Scholar] [CrossRef]
  71. Yang, K.; Han, H.; Li, Y.; Ye, J.; Xu, F. Significance of miRNA in enhancement of flavonoid biosynthesis. Plant Biol. 2022, 24, 217–226. [Google Scholar] [CrossRef]
  72. Zhang, L.; Ma, C.; Chao, H.; Long, Y.; Wu, J.; Li, Z.; Ge, X.; Xia, H.; Yin, Y.; Batley, J.; et al. Integration of metabolome and transcriptome reveals flavonoid accumulation in the intergeneric hybrid between Brassica rapa and Raphanus sativus. Sci. Rep. 2019, 9, 18368. [Google Scholar] [CrossRef]
  73. Muthusamy, M.; Kim, J.H.; Kim, S.H.; Park, S.Y.; Lee, S.I. BrPP5.2 Overexpression Confers Heat Shock Tolerance in Transgenic Brassica rapa through Inherent Chaperone Activity, Induced Glucosinolate Biosynthesis, and Differential Regulation of Abiotic Stress Response Genes. Int. J. Mol. Sci. 2021, 22, 6437. [Google Scholar] [CrossRef]
  74. Zhao, L.; Wang, C.; Zhu, F.; Li, Y. Mild osmotic stress promotes 4-methoxy indolyl-3-methyl glucosinolate biosynthesis mediated by the MKK9-MPK3/MPK6 cascade in Arabidopsis. Plant Cell Rep. 2017, 36, 543–555. [Google Scholar] [CrossRef]
  75. Liu, H.; Li, X.; Deng, J.; Dai, L.; Liu, W.; Pan, B.; Wang, C.; Zhang, D.; Li, Z. Molecular mechanism of the response of Zygosaccharomyces rouxii to D-fructose stress by the glutathione metabolism pathway. FEMS Yeast Res. 2020, 20, 5. [Google Scholar] [CrossRef]
  76. Liu, W.; Zhang, R.; Xiang, C.; Zhang, R.; Wang, Q.; Wang, T.; Li, X.; Lu, X.; Gao, S.; Liu, Z.; et al. Transcriptomic and Physiological Analysis Reveal That α-Linolenic Acid Biosynthesis Responds to Early Chilling Tolerance in Pumpkin Rootstock Varieties. Front. Plant Sci. 2021, 12, 669565. [Google Scholar] [CrossRef]
  77. Alam, S.I.; Kim, M.W.; Shah, F.A.; Saeed, K.; Ullah, R.; Kim, M.O. Alpha-Linolenic Acid Impedes Cadmium-Induced Oxidative Stress, Neuroinflammation, and Neurodegeneration in Mouse Brain. Cells 2021, 10, 2274. [Google Scholar] [CrossRef]
  78. Wu, L.; Chen, J.; Wu, H.; Qin, X.; Wang, J.; Wu, Y.; Khan, M.U.; Lin, S.; Xiao, Z.; Luo, X.; et al. Insights into the Regulation of Rhizosphere Bacterial Communities by Application of Bio-organic Fertilizer in Pseudostellaria heterophylla Monoculture Regime. Front. Microbiol. 2016, 7, 1788. [Google Scholar] [CrossRef]
  79. Lee, S.M.; Kong, H.G.; Song, G.C.; Ryu, C.M. Disruption of Firmicutes and Actinobacteria abundance in tomato rhizosphere causes the incidence of bacterial wilt disease. ISME J. 2021, 15, 330–347. [Google Scholar] [CrossRef]
  80. Ling, N.; Wang, T.; Kuzyakov, Y. Rhizosphere bacteriome structure and functions. Nat. Commun. 2022, 13, 836. [Google Scholar] [CrossRef]
Figure 1. Experimental flow for this study.
Agronomy 13 02310 g001
Figure 2. Pak choi resistance index test results. (A) SOD activity; (B) POD activity; (C) CAT activity. CK stands for water treatment; ** stands for significant difference (p < 0.01). CAT, catalase; POD, peroxidase; SOD, superoxide dismutase.
Agronomy 13 02310 g002
Figure 3. Rhizosphere microbial community analysis. (A) AJ and CK Alpha-Shannon diversity indices; (B) AJ and CK Alpha-Chao1 diversity indices; (C) Beta-UPGMA diversity cluster analyses of AJ and CK and species relative abundance analysis at the phylum level; (D) T-test species difference analysis chart between the groups. The left shows the abundance of different species between groups; the right shows the difference in confidence intervals between groups; the left and right end points of the circle represent the 95% confidence intervals between the means. On the far right, p-values of the between-group significance test for the corresponding difference species; (E) LEfSe analysis of differential species; bifurcation diagram of different species evolution; the circles spreading from inside to outside represent taxonomic levels from phylum to species. ** means the difference is very significant, ns means the difference is not significant.
Agronomy 13 02310 g003
Figure 4. Transcriptome analysis of pak choi treated with CK and AJ. (A) Analysis of the identified up-and downregulated differentially expressed gene (DEG) levels; (B) Heat map results of DEGs; (C) The DEGs are beneath the GO classification histogram; (D) KEGG enrichment of DEGs.
Agronomy 13 02310 g004
Figure 5. Metabolite analysis of pak choi seedlings under CK and AJ treatments. (A) Analysis of the identified up- and downregulated differentially expressed metabolite (DEM) levels; (B) Classification and heat map results according to the first-class classification of the identified DEMs; (C) KEGG pathway analysis of the DEMs.
Agronomy 13 02310 g005
Figure 6. Combined transcriptome and metabolome analyses. (A) KEGG enrichment analysis bubble plot. The abscissa represents the enrichment factor (diff/background) of the pathway in different omics, whereas the ordinate represents the name of the KEGG pathway. The red–yellow–green gradient represents the change in the significance of enrichment from high–medium–low; the shape of the bubble represents different omics; the size of the bubble represents the number of DEMs or DEGs. The larger the number, the larger the point; (BE) Relationship between DEMs and DEGs in glutathione metabolism pathway (ko00480), alpha-linolenic acid metabolism pathway (ko00592), phenylpropanoid biosynthesis pathway (ko00940), and glucosinolate biosynthesis (ko00966). DEMs and DEGs are denoted by green and red squares, respectively. Solid and dashed lines represent positive and negative correlations, respectively.
Agronomy 13 02310 g006
Figure 7. Combined analysis of 16S sequencing and metabolomics results. (A) Spearman correlation analysis; (B) Canonical correlation analysis. * means significant difference, ** means extremely significant difference.
Agronomy 13 02310 g007
Figure 8. The qRT-PCR analysis. Relative expression level is represented by mean ± standard error.
Agronomy 13 02310 g008
Figure 9. Full text summary figure.
Agronomy 13 02310 g009
Table 1. Results of growth and development indexes of pak choi.
Group NamePlant Height (cm)Fresh Weight (g)Root Length (cm)SPAD
CK12.40a3.16a4.80a27.60b
AJ12.80a3.62a7.60a28.40a
a means that the average is the largest; b means that the average is less than a, and the difference is significant.
Disclaimer/Publisher’s Note: The statements, opinions and data contained in all publications are solely those of the individual author(s) and contributor(s) and not of MDPI and/or the editor(s). MDPI and/or the editor(s) disclaim responsibility for any injury to people or property resulting from any ideas, methods, instructions or products referred to in the content.

