Abstract
The olecranon honey peach is China’s national geographic identification product because of its crisp texture and high sweetness. In recent years, new field management practices have been developed. In this study, fruits (‘SJH’) grown through new planting methods, i.e., black bags combined with bio-organic fermentation fertilizer, were compared with those (‘SBY’) grown by conventional planting methods, i.e., using a chemical fertilizer without bagging, to determine their effects on improving fruit quality. At maturity, the ‘SJH’ was significantly higher than ‘SBY’ in terms of weight, hardness, and sugar content by 14.43%, 19.55% and 9.66%, respectively. RNA sequencing (RNA-seq) technology analysis was performed on ‘SJH’ and ‘SBY’ to identify the main regulatory pathways involved in fruit development, especially focusing on cell-wall biogenesis and sugar metabolism. We identified a total of 1660 differentially expressed genes (DEGs) in ‘SJH’ and 5673 genes in ‘SBY’ throughout the development. A clustering analysis of DEGs revealed that the expression patterns of key genes involved in cell-wall biogenesis and sugar metabolism pathways in ‘SJH’ differed from those in ‘SBY’, such as cellulose synthase-like protein D (CS-LPD), sucrose-phosphate synthase (SPS) and sucrose synthase (SUS). The new cultivation technology promoted soluble sugar accumulation and cell-wall synthesis through molecular regulation, which improved the sweetness and sensory quality of the fruit. These findings contribute towards to the development of novel ideas for the better cultivation of peaches and provide a deeper investigation into the molecular mechanism of their development.
1. Introduction
The olecranon honey peach is famous for its eagle’s beak shape and is widely cultivated in the southern part of China, particularly in Lianping, Guangdong Province. It is a very popular peach variety because of its excellent economic value and unique taste; it is crisp and sweet [1,2]. However, the peaches have encountered some challenges during cultivation in recent years, such as the overuse of chemical fertilizers and pest infestation. The overuse of chemical fertilizers hardens the soil and damages soil microbial communities; meanwhile, insect pests reduce the quality of fruits, thus cutting down yields and thereby leading to severe economic losses [3,4]. To address these problems, ‘SJH’, a high-quality peach fruit, was cultivated with black bags as a covering and the application of a bio-organic fermentation fertilizer. ‘SJH’ differs from fruits grown with chemical fertilizers without bagging (‘SBY’) in size, color, sugar content, flesh texture and nutrient composition, which are important factors for evaluating fruit quality and are the focus of studies to identify the associated regulatory transcription factors. Many studies have shown that the application of organic fertilizers and bagging can improve the quality of the fruit. The bagging of guava fruit significantly improved fruit weight and texture, and effectively controlled the occurrence of pests [5]. Wang et al. found that the application of organic fertilizer when growing apples improved soil physicochemical properties and the diversity of microbial communities, which facilitated the growth of apples and thus enhanced the commercial properties of the fruit [6]. In addition, the application of bio-organic fertilizer to pear trees was shown to enhance the expression levels of sorbitol dehydrogenase (SDH) and sugar transporter genes while decreasing the expression levels of organic acid metabolism genes, thereby promoting the accumulation of sucrose and the degradation of citric acid, improving the sugar–acid ratio, and enhancing the quality of pear fruits [7]. Organic fertilization and bagging techniques are widely used in fruit cultivation; however, their application in peach cultivation is rarely reported and thus there is a lack of clarity with regard to the regulation of peach fruit metabolism, particularly the factors involving cell-wall biogenesis and sugar metabolism. Differences in their regulatory pathways and gene expression patterns remain poorly understood.
Improvements in the way peaches are grown focus on magnifying the overall quality of the fruit, particularly in terms of sugar content and texture [8]. Changes in texture that occur in peach fruit during growth and development are believed to be closely related to cell-wall biosynthesis [9]. The ripening-related cell-wall modifications include enzymatic cell-wall degradation and cell-wall secondary lignification [10]. De-esterification and depolymerization of cell walls are triggered by a series of cell-wall modifying enzymes, such as pectin methylesterase (PME, EC 3.1.1.11), polygalacturonase (PG, EC 3.2.1.15), β-galactosidase (β-gal, EC 3.2.1.23), endo-1,4-β-d-glucanase (EGase, EC 3.2.1.4) and xyloglucan endotransglycosylase (XET, EC 2.4.1.207). Peach cell-wall polysaccharides are primarily composed of homogalacturonan (HG), rhamnogalacturonan I (RGI) rich pectin and xyloglucan among the hemicellulose [11]. Specific HG biosynthesis and pectin methyl- and/or acetyl-esterase remodeling and the genetic regulation of biosynthesis and/or remodeling of xyloglucan during peach developmentare linked with shape and texture [12]. Lignification in fruit occurs in response to different conditions and results in increased flesh firmness, toughness of texture and subsequent fruit deterioration [13]. Thus, moderate application of bio-organic fermentation fertilizer can enhance the texture and sugar content of fruits [3,6]. Bio-organic fermentation fertilizer is a rich source of calcium, which plays an important role in cell-wall pectin cross-linking and inhibits pectin degradation and cell-wall relaxation by downregulating the expression levels of PG1, PG2, CER9 and EPX6, thereby maintaining positive fruit texture [14].
Sugar is necessary for energy supply in fruit development, it also generates turgor for fruit cell enlargement and accumulates in the late stages of fruit development thus contributing to fruit taste [15]. Sucrose is the main sugar accumulated in mature peach fruits, and its metabolism and accumulation determine the sugar content in fruit [16]. Sucrose enters the cell as sucrose or as hexoses after hydrolysis by cell-wall invertase. When sucrose is transported into the vacuole, it can also be converted to fructose and glucose. As the fruit develops, glucose and fructose accumulate, which is closely related to α-Gal activity [17]. A transcriptome analysis of sugar metabolism in watermelon showed that 76 sugar transporter protein genes and 62 sugar synthases were related to sugar accumulation [18,19]. Vimolmangkang et al. investigated the mechanisms regulating sucrose accumulation in peach fruit and found that there were two sucrose-cleaving enzyme genes (SUS4 and NINV8), one sucrose resynthesis gene (SPS3) and three sugar transporter genes (SUT2, SUT4 and TMT2) involved in sucrose metabolism and transport [16]. Moreover, sugar content in peach fruit is increased by the transient overexpression of the vacuolar invertase inhibitor gene PpINH3 associated with sugar accumulation, whereas PpINHa causes the opposite trend [20]. These results indicate that differences in the expression of genes and pathways related to sugar metabolism may lead to differences in the sugar content of fruit.
RNA sequencing (RNA-Seq) is a newly developed technology that enables transcript profiling by analyzing and assembling short-read sequence data [21,22]. In transcript studies, it is possible to analyze gene expression, composition and function in particular species, thereby leading to a comprehensive understanding of the molecular mechanisms of particular physiological traits [23]. Therefore, RNA-Seq technology can provide new insights and pathways to explore gene expression patterns and gene functions in peach fruit. In this study, RNA-seq technology was applied to identify related differentially expressed genes during ‘SJH’ and ‘SBY’ development, and the results were then analyzed for functional enrichment and gene expression patterns. These results provide the basis for in-depth research on the key regulators and pathways of the physicochemical properties of olecranon honey peach under different cultivation conditions and are conducive to changes and improvements in cultivation techniques.
2. Materials and Methods
2.1. Plant Materials
Olecranon honey peach, ‘SJH’ and ‘SBY’, was obtained from orchards at Sanjiaohu Planting Base, Lianping, China (114°68′ E; 24°50′ N; 520 m above sea level). Fifty peach trees were selected for cultivation experiments for each of these two fruit types, and the fruits manually and grown under normal field conditions. ‘SJH’ was covered with black bags and applied once each half month self-developed bioorganic fermentation fertilizer made from a mixture of fish, peanut bran and soybean residue fermented by effective microorganisms. ‘SBY’ was fertilized once with chemical fertilizers (N-P2O5-K2O ≥ 45%) every half month without bagging. During the growth stages, fruits were collected and divided into three groups—15, 17 and 19 weeks after pollination (WAP), with 40 fruits collected in each group in ‘SJH’ and ‘SBY’, respectively, for subsequent analysis and determination. Groups 15, 17 and 19 WAP were collected at 15 weeks (immature stage), 17 weeks (near mature stage) and 19 weeks (full mature stage) post-pollination, respectively (Figure 1). Three biological replicates were performed for each sampling stage, with each replicate collecting pulp from six fruits, freezing immediately in liquid nitrogen, and storing at −80 °C until analysis.
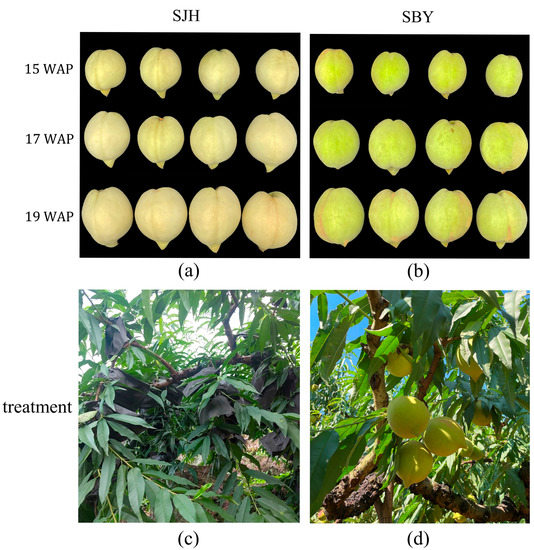
Figure 1.
Appearance and treatments of fruits: the phenotype of ‘SJH’ (a); and ‘SBY’ (b) at 15 weeks, 17 weeks and 19 weeks after pollination (WAP). 15 WAP: (immature stage), 17 WAP: (near mature stage), 19 WAP: (full mature stage). Treatment of ‘SJH’ (c); and ‘SBY’ (d).
2.2. Measurement of Physicochemical Characteristics
The fruit size at each stage was measured and weighed with vernier calipers and an electronic scale, respectively. The diameter was measured by taking the average of the value at the widest diameter of the peach suture and the value at the widest diameter of the smooth surface. Fruit hardness was measured according to the method of Qiu et al. (2022) [3] with minor modifications. Briefly, using a TA.GEL texture meter, a TA/36R probe was selected, parameters were set to 98% of deformation, the trigger force was set to 5 N, and pre-test, test and post-test speeds were set to 2 mm/s, 1 mm/s and 2 mm/s, respectively. Subsequently, three fixed points were taken on the olecranon honey peach, cubic slices with 1 cm long sides were cut, and the average value of the three points was used as the texture data of the peach. The remaining pulp was used for the subsequent determination of the brix value. After grinding and filtering 10 g of pulp, 2–3 drops of juice were aspirated and placed on the prism surface of an ATAGO PAL-1 refractometer to determine the brix value [24]. The measurement was repeated for five fruits each time.
2.3. RNA Extraction, Library Construction and Sequencing
Total RNA was collected from the 2 g of peach pulp at each period using Trizol reagent (Thermofisher, 15596018, Carlsbad, CA, USA) based on the manufacturer’s protocol. The quality and purity of the extracted RNA were assessed using the RNA 6000 Nano LabChip Kit (Agilent, CA, USA, 5067-1511) and Agilent 2100 Bioanalyzer, and RNA samples with RIN number >7.0 were selected for sequencing library construction. Dynabeads Oligo (dT), Magnesium RNA Fragmentation Module and SuperScript™ II Reverse Transcriptase were used to purify, fragment and reverse-transcribe mRNA into the first-strand cDNA, respectively. Then, the second-strand cDNA was synthesized with Escherichia coli DNA polymerase I, RNase H and dUTP solution. Eventually, 18 cDNA libraries were constructed, including three replicate experiments, which were executed 2 × 150 bp paired-end sequencing using Illumina Novaseq™ 6000 platform [25,26].
2.4. Differentially Expressed Genes (DEGs) Analysis
Differential gene expression analysis was performed on sequencing data between two different groups using DESeq2 software. The genes with absolute values of log2 fold change ≥ 1 and Q-values ≤ 0.05 were defined as DEGs.
2.5. Clustering Analysis and DEGs Annotation
We used Short Time-series Expression Miner (STEM) software for trend analysis to determine the pattern of changes in DEGs during peach development. Transcriptional patterns based on FPKM levels were performed using the STEM clustering method. DEGs in profiles with p-values < 0.05 were considered significantly expressed. These genes were enriched by KEGG pathways and GO terms for annotation.
2.6. Quantificational Real-Time Polymerase Chain Reaction (qRT-PCR) Validation Analysis
The extracted total RNA was used for cDNA synthesis with MonScript™ RTIII All-in-One Mix with dsDNase (Monad). Actin gene was used as the internal control according to You et al. (2021) [27]. The primer sequences (Table S3) for the selected genes were designed with the Primer Express 3.0 software (Applied Biosystems, Foster City, CA, USA) [2]. Then, the qPCR assay was performed using QuantiNova SYBR Green PCR Kit (QIAGEN). The PCR program was as follows: cycled at 95 °C for 120 s, 95 °C for 5 s for 40 cycles and 60 °C for 30 s for 40 cycles; a melting curve analysis was performed at 65–95 °C. Each assay was performed in triplicates. The relative expression levels of different genes were determined by the 2−ΔΔCT method [28].
3. Results
3.1. Variations in Characterization and Physical Properties during the Development of Peach
We observed and recorded the characterization of each developmental stage (Figure 1) and measured the weight, size, hardness, and total soluble solids (TSS) content (Figure 2) to compare the properties of the two types of peach fruit. The peel of ‘SJH’ was golden yellow throughout the developmental stage, meanwhile, the peel of ‘SBY’ was dark green and some areas were red in later stages of development.
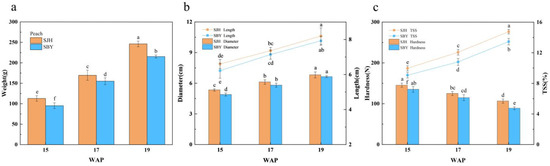
Figure 2.
Fruit measurements of physicochemical characteristics compared with ‘SJH’ and ‘SBY’ during the fruit growth stage. (a) Measurement of weight; (b) Measurement of size (length, diameter); (c) Measurement of hardness and total soluble solids (TSS). Different letters (a, b, c, d, e and f) indicate statistically significant differences at the level of p < 0.05.
During the development, the weight, size, and sugar content of both fruits gradually increased, whereas the hardness gradually decreased. Notably, fruit weight, length, diameter, hardness and TSS of ‘SJH’ were higher than those of ‘SBY’, and were 14.43%, 3.40%, 2.71%, 19.55% and 9.66% higher at maturity (19 WAP), respectively. In addition, a significant difference (p < 0.05) was observed in fruit weight, hardness and TSS between ‘SJH’ and ‘SBY’ at fruit maturity, with ‘SJH’ reaching the highest TSS value of 14.76 (Figure 2).
3.2. Analysis of RNA-Seq Results
Herein, RNA-seq analysis was performed with a reference genome of peach to determine the gene expression results. A total of 119.72 GB of clean data was analyzed on 18 cDNA libraries after filtering out those containing more than 5% unknown nucleotide counts and low-quality reads. On average, each library yielded approximately 6.65 GB of clean data (Q30 > 97.78%). Moreover, each library generated from 42,541,336 to 48,229,486 reads, of which 89.79–93.46% were uniquely mapped to the reference genome (Table S1). Ultimately, we detected a total of 22,429 expressed genes in the ‘SJH’ and ‘SBY’ samples.
We used log2 fold change ≥ 1 and Q-values ≤ 0.05 as threshold criteria for screening differential genes in peach fruit. When comparing ‘SJH’ to ‘SBY’ at the same developmental stage, 1765 (743 and 1022 upregulated and downregulated genes, respectively), 4322 (1837 and 2485 upregulated and downregulated genes, respectively), and 2134 (504 and 1630 upregulated and downregulated genes, respectively) DEGs were detected at 15, 17 and 19 WAP, (Figure 3a and Table S2). The largest number of DEGs between ‘SJH’ and ‘SBY’ was observed at 17 WAP.
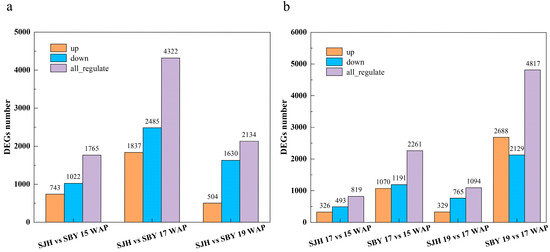
Figure 3.
Comparison of differentially expressed genes (DEGs) during peach fruit development: (a) comparison of DEGs between ‘SJH’ and ‘SBY’ at the same developmental period; and (b) the number of DEGs per developmental period is shown for both peach fruits.
In order to determine the variation between differential genes during peach fruit development, we compared samples from two different cultivation methods and found that the number of DEGs in ‘SJH’ were markedly lower than that in ‘SBY’. Fewer DEGs were identified in ‘SJH’ than ‘SBY’ (819 vs. 2261) during 15–17 WAP and (1094 vs. 4817) during 17–19 WAP (Figure 3b and Table S2).
3.3. Functional Analysis of Differentially Expressed Genes
Based on gene ontology (GO) terms and KEGG-functional annotations, DEGs identified in ‘SJH’ and ‘SBY’ were enriched. For ‘SJH’ enrichment in GO terms, the top two groups within the GO terms were “Response to auxin” (GO:0009733) and “Cell wall organization” (GO:0071555) at 15–17 WAP. In addition, during the 17–19 WAP, “Cell wall” (GO:0005618), “Cell wall organization” (GO:0071555), “Xyloglucan metabolic process” (GO:0010411) and “Cell wall biosynthesis” (GO:0042546) were significantly enriched and the top two groups within a molecular function (MF) were “Pigment binding” (GO:0031409) and “Chlorophyll binding” (GO:0016168) (Figure 4a,b), respectively. In contrast, GO terms involved cell-wall changes in ‘SBY’ were also significantly enriched, including “Cell wall” (GO:0005618) and “Cell wall organization” (GO:0071555) between 15 and 17 WAP. However, between 17 and 19 WAP, the most significantly enriched biological process (BP) categories were “Flavonoid biosynthetic process” (GO:0009813), “Flavonoid glucuronidation” (GO:0052696) and “Cell wall organization” (GO:0071555) (Figure 4c,d). Notably, we found that GO terms involving cell-wall changes such as “Cell wall” and “Cell wall biogenesis” were significantly enriched at each stage of peach development, and that the later stages of ‘SJH’ and ‘SBY’ development were closely related to chlorophyll binding and flavonoid biosynthesis, respectively (Figure 4). These results suggest that changes in biological functions during peach fruit development appear to be highly correlated with cell-wall alterations and pigment accumulation.
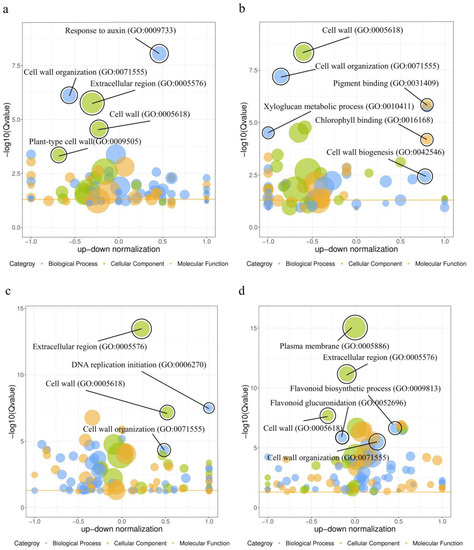
Figure 4.
Up-down bubble diagram of GO enrichment analysis of DEGs in peach fruit development: (a) ‘SJH’-15 WAP and ‘SJH’-17 WAP; (b) ‘SJH’-19 WAP and ‘SJH’-17 WAP; (c) ‘SBY’-17 WAP and ‘SBY’-15 WAP; and (d) ‘SBY’-19 WAP and ‘SBY’-17 WAP. The x-axis represents standardized values, while the y-axis indicates Q-values and significance. The color of each circle indicates the GO classification, while the size indicates the number of genes mapped to the GO terms.
Based on KEGG analysis, at the early (15–17 WAP) and late development (17–19 WAP) stages, we observed that DEGs in ‘SBY’ were annotated into 120 and 127 pathways, and the highest enrichment was “DNA replication” and “Photosynthesis—antenna proteins”, respectively (Figure 5c,d). For ‘SJH’, a total of 14 pathways including “Plant hormone signal transduction”, “Galactose metabolism” and “Amino sugar and nucleotide sugar metabolism” were significantly enriched between 15 and 17 WAP. Meanwhile, nine pathways were notably enriched during the 17 and 19 WAP, namely “Photosynthesis—antenna proteins”, “DNA replication”, “Amino sugar and nucleotide sugar metabolism”, “Plant hormone signal transduction”, “Circadian rhythm—plant”, “Plant-pathogen interaction”, “Sesquiterpenoid and triterpenoid biosynthesis”, “Cysteine and methionine metabolism” and “RNA degradation” (Figure 5a,b). Consequently, we identified that pathways related to sugar metabolism and plant hormone signal transduction are closely associated with peach development.
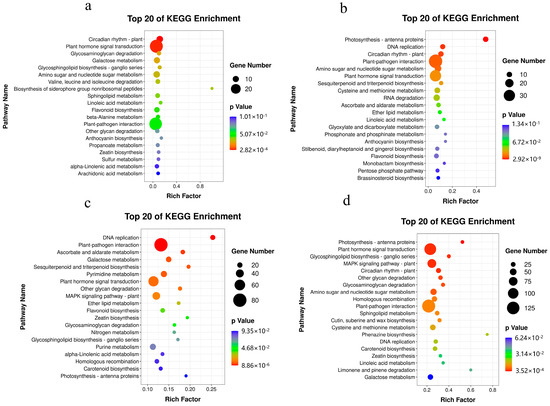
Figure 5.
Bubble diagram of KEGG enrichment analysis of DEGs in peach fruit development: (a) ‘SJH’-17 WAP and ‘SJH’-15 WAP; (b) ‘SJH’-19 WAP and ‘SJH’-17 WAP; (c) ‘SBY’-17 WAP and ‘SBY’-15 WAP; and (d) ‘SBY’-19 WAP and ‘SBY’-17 WAP. The color of each circle indicates the p-value, while the size indicates the number of genes mapped to the pathway.
3.4. Clustering Analysis of Expression Patterns of DEGs during Peach Fruit Development
The differentially expressed genes of 1660 and 5673 identified, respectively, in ‘SJH’ and ‘SBY’, were determined using the K-means clustering method throughout the fruit development period (Figure 6). Three different profiles of expression patterns based on p-values ≤ 0.05 were recognized in ‘SJH’, consisting of one upregulated profile (105 DEGs, profile 7) and two downregulated profiles (431 DEGs, profiles 0 and 3). Moreover, the ‘SBY’ were markedly clustered into the following two profiles: one upregulated profile (1444 DEGs, profile 4) and one downregulated profile (586 DEGs, profile 3).
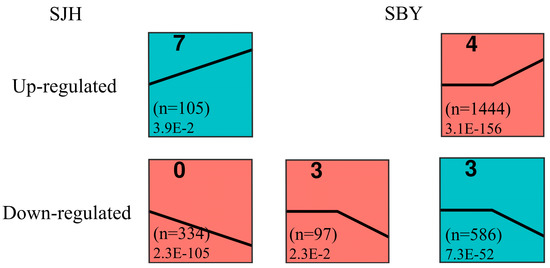
Figure 6.
Cluster analysis of DEGs during peach fruit development. Profile of ‘SJH’ and ‘SBY’ were significantly enriched in upregulated and downregulated forms. In each profile, the top left corner represents the graph number, and the number of DEGs is shown in parentheses. The bottom left corner is the corresponding p-value.
For a deeper understanding of the functions of the candidate genes during fruit development, we performed GO terms and KEGG pathways analyses on DEGs enriched in up- and downregulated profiles. Regarding the upregulated DEGs, the GO analysis showed that a strong classification of the ‘SJH’ DEGs in profile 7 can be made in two biological functions, and the “response to auxin” (GO:0009733) was highly enriched (Figure S1a). By contrast, biological process (BP) accounts for half of the enrichment term in the ‘SBY’ DEGs in profile 4, and the most significant GO term was “endonuclease activity” (GO:0004519) (Figure S1b). As for the downregulated DEGs, “mitotic spindle assembly checkpoint signaling” (GO:0007094), “plasma membrane” (GO:0005886) and “ubiquitin-protein transferase activator activity” (GO:0097027) were the most significantly enriched functions in the biological process (BP), cellular component (CC) and molecular function (MF) classifications in ‘SBY’ profile 3, respectively (Figure S1b). For ‘SJH’ DEGs, the three most significant enrichment functions in the downregulation profiles, including profiles 0 and 3, were “cell-wall organization” (GO: 0071555), “plant-type cell-wall” (GO: 0009505) and “anchored component of plasma membrane” (GO: 0046658) (Figure S1a).
Based on KEGG analysis, we detected that the three most significant pathways including “Plant hormone signal transduction”, “Valine, leucine, and isoleucine degradation” and “Propanoate metabolism” were enriched with ‘SJH’ profile 7 (Figure S2a), whereas the ‘SBY’ DEGs in profile 4 were enriched for “Photosynthesis—antenna proteins”, “Carotenoid biosynthesis” and “Phenazine biosynthesis” (Figure S2b). The ‘SBY’ DEGs in downregulated profile 3 were significantly enriched in pathways such as “Amino sugar and nucleotide sugar metabolism” and “Fructose and mannose metabolism”. In addition, we observed that ‘SJH’ DEGs in profile 0 were enriched in the pathways of “Amino sugar and nucleotide sugar metabolism”, “Starch and sucrose metabolism” and “DNA replication”, in contrast, the pathway most enriched by profile 3 was “Nicotinate and nicotinamide metabolism” (Figure S2).
3.5. Analysis of Cell Wall Biogenesis during Peach Fruit Development
We identified seven GO terms including “Cell wall biogenesis”, “Plant-type cell-wall biogenesis”, “Plant-type primary cell-wall biogenesis”, “Plant-type secondary cell-wall biogenesis”, “Plant-type cell-wall organization or biogenesis”, “Cell wall organization or biogenesis” and “Regulation of secondary cell-wall biogenesis” to investigate the expression patterns of DEGs about cell-wall biogenesis during peach fruit development. ‘SJH’ contains 14 DEGs associated with cell-wall biogenesis, clustered in profiles 0 (n = 12) and 7 (n = 2). In contrast, there were 20 DEGs clustered in profiles 3 (n = 12) and 4 (n = 8) of ‘SBY’, and “Cell wall organization or biogenesis” and “Regulation of secondary cell-wall biogenesis” were ‘SBY’-specific terms. Figure 7a shows five common DEGs in the cell-wall biogenesis-related profiles of ‘SJH’ and ‘SBY’, and some of these had different expression patterns during peach fruit development. For example, gradual reductions in MAP70-5 expression levels were observed during fruit development in ‘SJH’ (Figure 7b). In contrast, the MAP70-5 expressed at a constant level before the fully mature stage (19 WAP) in ‘SBY’ and decreased obviously at the mature stage (Figure 7c). Similarly, the highest level of At1g68400 and α-GPS2 expression in ‘SJH’ were observed at an immature stage (15 WAP) and were found in the near mature stage (17 WAP) of ‘SBY’ (Table 1 and Figure 7). Moreover, significant expression of some genes was detected such as XTHB, CS-LPD, CESAS2 and so on involved in cell-wall biogenesis during development in ‘SJH’, whereas the changes in expression in ‘SBY’ were not significant. Conversely, genes GGTIRX7, XTHP23 and PTBR were significantly expressed in ‘SBY’, but not in ‘SJH’ (Figure 7b,c). These findings suggest that even the same gene in cell-wall biogenesis during fruit development can differ in expression patterns in peaches grown under different cultivation conditions, and the types of genes that show significant expression in these peaches may also be different.
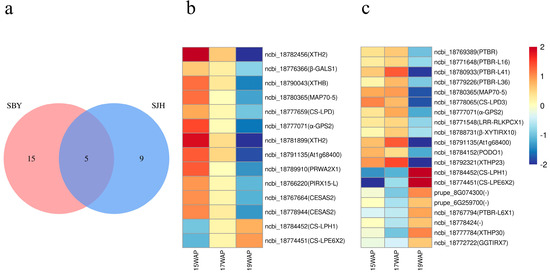
Figure 7.
Expression patterns of significantly expressed key genes related to cell-wall biogenesis in ‘SJH’ and ‘SBY’: (a) common DEGs in cell-wall biogenesis pathway of two peaches; (b) expression of ‘SJH’ DEGs; and (c) expression of ‘SBY’ DEGs.

Table 1.
Expression level of genes associated with cell-wall biogenesis and sugar metabolism.
3.6. Analysis of Sugar Metabolism during Peach Fruit Ripening
Sugar metabolism includes the following four pathways: “Amino sugar and nucleotide sugar metabolism”, “Starch and sucrose metabolism”, “Galactose metabolism” and “Fructose and mannose metabolism”. We found that 28 DEGs in ‘SJH’ associated with sugar metabolism pathways were clustered into profiles 0, 3 and 7. Similarly, there were 61 DEGs clustered into profiles 3 and 4 of ‘SBY’, and 9 common DEGs were present in both peaches (Figure 8a). In ‘SJH’, “Amino sugar and nucleotide sugar metabolism” and “Fructose and mannose metabolism” pathways were enriched only in the downregulated profiles—including profiles 0 and 3. Type-specific DEGs involved in sugar metabolism were detected to exhibit different expression patterns during fruit development.
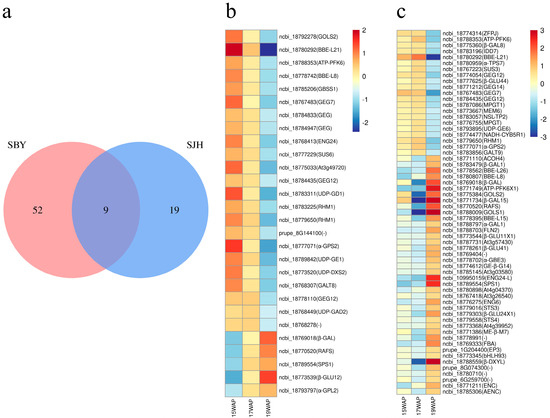
Figure 8.
Expression patterns of significantly expressed key genes related to sugar metabolism in ‘SJH’ and ‘SBY’: (a) common DEGs in sugar metabolism pathways of two peaches; (b) expression of ‘SJH’ DEGs; and (c) expression of ‘SBY’ DEGs.
Comparing the two types of peaches, we found that the highest expression genes related to four main sugar metabolism pathways were enriched at the immature stage (15 WAP) in ‘SJH’; meanwhile, the expression genes in ‘SBY’ peaches were enriched at the late mature stage (19 WAP) (Table 2). In ‘SJH’, DEGs were more highly expressed in “Starch and sucrose metabolism” (11 DEGs) and “Amino sugar and nucleotide sugar metabolism” (8 DEGs). Similarly, most of the DEGs were accumulated in “Galactose metabolism” (12 DEGs), “Starch and sucrose metabolism” (21 DEGs) and “Amino sugar and nucleotide sugar metabolism” (9 DEGs).
Table 2.
DEGs statistic involved in the KEGG pathway of sugar metabolism.
3.7. qRT-PCR Verification of RNA-Seq
The results of the RNA-seq analysis were verified using the quantificational RT-PCR technique for 12 differential genes in ‘SJH’ and ‘SBY’ developmental stages (Figure 9). The results showed that the quantificational RT-PCR assays were consistent with the gene expression trends of RNA-seq, whereas the fold change ploidy was not completely consistent. This indicates that the data from the RNA-seq are reliable.
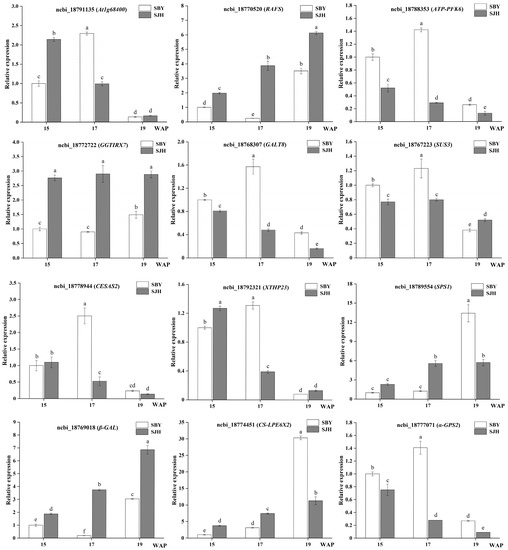
Figure 9.
Validation of DEGs by qRT-PCR analysis. Determination of the relative expression levels of DEGs in the three developmental stages of ‘SJH’ and ‘SBY’ by using the 2−ΔΔCT method. Different letters (a, b, c, d, e and f) indicate statistically significant differences at the level of p < 0.05.
4. Discussion
The different cultivation methods led to differences in the physicochemical characteristics of ‘SJH’ and ‘SBY’, which were related to size, weight, hardness, and sugar content. The hardness and TSS of ‘SJH’ were significantly higher than those of ‘SBY’ during fruit development. This may be due to the application of a bioorganic fermentation fertilizer to ‘SJH’, which enhanced the accumulation of sugar content and fiber-bundle diameter while inhibiting pectin degradation and cell-wall relaxation [3,14]. Notably, a significant difference was also observed in color, reflected by the golden yellow of ‘SJH’ and dark green and red of ‘SBY’ at a late stage of development. This was caused by continuous black bagging at the planting stage of ‘SJH’ because the black bagging influenced the accumulation of anthocyanin, chlorophyll, and carotenoid contents in the fruit [29,30]. Nevertheless, fruit development and ripening of the olecranon honey peach is a complex genetic process, and the deep molecular mechanisms are not fully understood. Thus, we used ‘SJH’ and ‘SBY’ as experimental materials in our study to identify the main biological function pathways involved in the development of the two peaches and to better understand the regulatory patterns of the associated genes.
RNA-seq technique was used to analyze the transcriptomic differences between ‘SJH’ and ‘SBY’ during development, and a total of 22,429 expressed genes were identified. In these genes, the number of DEGs in ‘SJH’ was always lower than that of ‘SBY’ and they showed an earlier increase and later decrease trend (Figure 3 and Table S2).
Pigments in peaches are regulated by cultivation methods, for example bagging, especially at the late peach fruit development stage. Bagging inhibited the sunlight absorption of fruits, thereby blocking the synthesis of chlorophyll [29]. This is consistent with RNA-seq results that DEGs were mostly accumulated in “pigment binding” and “chlorophyll binding” pathways. On the contrary, red-colored anthocyanins in the pericarp accumulated in localized red areas of ‘SBY’ peaches, and a positive correlation with chlorophyll breakdown [30]. These are the intrinsic reasons for the different color appearances of the fruits under the two cultivation methods.
Moreover, the biological functional changes during ‘SJH’ and ‘SBY’ development seem to be associated with cell-wall alterations. Cell-wall changes affect the structure and composition of the cell wall, thereby leading to a change in flesh texture, which is a crucial quality characteristic of mature fruits [31,32]. Excellent fruit texture can positively influence fruit quality, disease resistance, and storage characteristics [25]. We found differences in the types of DEGs and the expression patterns of the same DEGs associated with cell-wall biogenesis in two peaches, including xyloglucan endotransglucosylase/hydrolase protein B (XTHB), cellulose synthase-like protein D (CS-LPD), leucine-rich repeat receptor-like protein kinase (At1g68400) et al., which may be inherent causes of peach fruit texture differences (Figure 7). Xyloglucan is the most abundant hemicellulose in the primary cell wall of plants, thereby forming the β-1,4-linked glucan backbone and providing the substrate for cell-wall synthesis [33,34,35]. Xyloglucan endotransglucosylase/hydrolase protein B (XTHB) can act on the pulp cell wall to cut and rejoin xyloglucan in adjacent neighboring cellulose microfibrils, thereby causing swelling and loosening of the plant cell wall [36]. Thus, studies suggest that XTHB accelerates the softening rate of tomato fruit during postharvest storage [37]. Cellulose synthase-like protein D (CS-LPD) is implicated in cell-wall remodeling. It provides a substrate for cell-wall growth by synthesizing β-1,4-glucan polymers and assembling them into cellulose [35,38]. Herein, the activity of CS-LPD showed a decreasing trend as the fruit ripened and softened (Figure 7). Leucine-rich repeat receptor-like protein kinase (At1g68400) is the largest group of receptor-like kinases in plants and plays a key role in plant developmental stages [39]. In addition, At1g68400 is a tight link between cell-wall integrity sensing and growth and environmental cues, promoting the complete development of the cell wall [40]. In general, we found that DEGs associated with cell-wall biogenesis in the ‘SJH’ peach were upregulated at the early stage of fruit development but downregulated at the late mature stage. This corresponds to a higher hardness and larger fruit size, as the relatively loose cell walls facilitate early cell expansion and fruit development, and conversely, the compact cell walls maintain the firmness and texture characteristics.
Through KEGG analysis, we observed that sugar metabolism and plant hormone signal transduction are closely associated with peach development (Figure 5). Sweetness is one of the most critical qualities of peach fruit, and the metabolism and accumulation of sucrose are key determinants of sweetness [16,41]. In ripe peaches, sucrose is the major sugar, followed by fructose and glucose [42]. Meanwhile, sugars can act as signaling molecules that crosstalk with plant hormone signals to mediate fruit growth and development [43]. We identified DEGs in ‘SJH’ and ‘SBY’ during development and found differences in the expression patterns of key genes involved in fruit sugar metabolism, such as sucrose synthase (SUS), raffinose synthase (RAFS), sucrose-phosphate synthase (SPS) et al., in ‘SJH’ and ‘SBY’.
Sucrose synthase (SUS) is the main enzyme in sucrose metabolism and plays a role in breaking down and synthesizing sucrose that can reversibly convert sucrose to UDP glucose and fructose [44,45]. SUS3 is involved in the breakdown of sucrose and provides the prerequisite for starch synthesis [46], meanwhile, SUS6 regulates the synthesis and accumulation of sucrose [47]. In addition, SUS provides substrates for cell-wall biosynthesis, thereby increasing cell-wall strength [48]. Herein, we found that SUS6 was the dominant gene related to sucrose synthase in ‘SJH’ development, whereas SUS3 was dominant in ‘SBY’ (Figure 8). Raffinose synthase (RAFS) catalyzes the synthesis of Raffinose family oligosaccharides, which is hydrolyzed by α-galactosidase to galactose and sucrose in fruit tissues, followed by the metabolic process of sucrose [49]. We observed a gradual increase in RAFS expression levels during development in ‘SJH’. However, its expression level in ‘SBY’ showed a first declining and then rising trend (Figure 8), thereby indicating a late accumulation of sugars in ‘SBY’. Moreover, the expression level of RAFS in ‘SJH’ was consistently higher than that in ‘SBY’ during fruit development (Table 1 and Figure 9), which is consistent with the sensory quality that ‘SJH’ is sweeter. Moreover, sucrose-phosphate synthase (SPS) is a crucial gene in sucrose accumulation, which can transfer glycosyl group to D-fructose 6-phosphate, and in turn forms D-sucrose-6′-phosphate and UDP to provide substrates for sucrose synthesis [44,50]. In our study, the SPS1 increased slowly from 15 WAP to 19 WAP in ‘SJH’, whereas the expression level of SPS1 remained stable and sharply increased at maturity in ‘SBY’ (Table 1 and Figure 8), which led to a difference in sucrose accumulation between the two types of peach fruits. Thus, improving crop cultivation methods results in larger increases in fruit sweetness; for instance, covering the trees of tangerine with plastic film promotes the accumulation of soluble sugars in citrus fruit [51], and applying organic fertilizers on tomatoes will increase the concentration of total soluble solids [52]. Consistent with previous studies, we found that improvements in the cultivation methods resulted in an increase in the sweetness of peaches and in fruit quality by altering the genetic regulation related to sugar metabolism in the two peach fruits, which may be related to intrinsic factors with regard to the differences in fruit sugar content.
5. Conclusions
Two olecranon honey peaches, ‘SJH’ and ‘SBY’ were evaluated for various factors to compare the differences between the new and traditional cultivation methods in the fruit. Herein, we used RNA-seq technology to clarify the genes and associated pathways regulating fruit physicochemical characteristics. In addition, we obtained candidate genes related to cell-wall biogenesis and sugar metabolism by performing GO annotation and KEGG enrichment of differential genes and clustering analysis of expression patterns of DEGs. When comparing DEGs of ‘SJH’ and ‘SBY’ at three fruit development stages, we found that contributions to cell expansion occurred at the early development stage in ‘SJH’, thereby resulting in a larger fruit size. Moreover, cell-wall biogenesis was more active in maintaining the firmness of the ‘SJH’. The pattern of sugar accumulation was also significantly different. Sugars tended to gradually increase during the whole development stage in ‘SJH’ through the high expression levels of sucrose synthesis, which were SUS3, RAFS and SPS. The results showed that the new planting methods, i.e., black bags combined with a bio-organic fermentation fertilizer, were effective in improving the overall quality of the peach fruit compared to conventional planting methods. These results provide the basis for in-depth research on the regulation mechanism of physicochemical properties and are conducive to changes and improvements in cultivation techniques.
Supplementary Materials
The following supporting information can be downloaded at: https://www.mdpi.com/article/10.3390/agronomy13071833/s1, Figure S1: GO enrichment circle plot based on the clustering analysis results in Figure 6; Figure S2: KEGG enrichment bubble diagram based on the clustering analysis results in Figure 6; Table S1: Number of reads after filtering rRNA and low quality; Table S2: Comparing the number of DEGs of ‘SJH’ and ‘SBY’; Table S3: Pairs of primers used to amplify the targeting genes by qPCR.
Author Contributions
Conceptualization, Y.Q. and Z.Z.; data curation, Y.Q., Z.Z., D.L., J.L. and Q.W.; formal analysis Y.Q., Z.Z. and D.L.; methodology, Y.Q., Z.Z., L.Z. and J.L.; investigation, Y.Q., Z.Z. and H.X.; writing—original draft, Y.Q. and Z.Z.; writing—review and editing, all authors; visualization, Y.Q., Z.Z. and D.L.; supervision, all authors; project administration, Y.Q., Z.Z. and D.L.; funding acquisition, Y.Q., D.L. and L.Z.; validation, J.L., Q.W., Q.Y., L.Z. and H.X. All authors have read and agreed to the published version of the manuscript.
Funding
This research was supported by the Special Fund of General College Key Field of Guangdong (Grant 2021ZDZX4007), Characteristic Innovation Research Foundation of Education Bureau of Guangdong Province, China (Grant 2022KTSCX053), Guangdong Provincial Key Laboratory of Lingnan Specialty Food Science and Technology (Grant 2021B1212040013), Integration of Key Technologies in Green Production of Olecranon Peach (Grant HEKE2021006).
Data Availability Statement
Transcriptome raw data in this study have been uploaded to the National Center for Biotechnology Information Sequence Read Archive (SRA) database (https://www.ncbi.nlm.nih.gov/sra; accession no. PRJNA932190, accessed on 1 March 2024).
Conflicts of Interest
The authors declare no conflict of interest.
References
- Liang, Z.; Liu, H.; Xu, Z.; Zhang, L. First Report of Pectobacterium aroidearum Causing Soft Rot in Olecranon Honey Peach (Prunus persica) in China. Plant Dis. 2022, 1066, 1746. [Google Scholar] [CrossRef] [PubMed]
- Liu, J.; Bao, Y.; Zhong, Y.; Wang, Q.; Liu, H. Genome-wide association study and transcriptome of olecranon-type traits in peach (Prunus persica L.) germplasm. BMC Genom. 2021, 221, 702. [Google Scholar] [CrossRef] [PubMed]
- Qiu, Y.; Zhu, K.; Liu, J.; Yuan, H.; Li, C.; Zhang, Z. Correlation analysis of texture and chemical properties of olecranon honey peach cultivars from different provinces in China. Emir. J. Food Agr. 2022, 347, 563–574. [Google Scholar] [CrossRef]
- Wang, J.; Li, R.; Zhang, H.; Wei, G.; Li, Z. Beneficial bacteria activate nutrients and promote wheat growth under conditions of reduced fertilizer application. BMC Microbiol. 2020, 201, 38. [Google Scholar] [CrossRef]
- Sharma, R.R.; Nagaraja, A.; Goswami, A.K.; Thakre, M.; Kumar, R.; Varghese, E. Influence of on-the-tree fruit bagging on biotic stresses and postharvest quality of rainy-season crop of ‘Allahabad Safeda’ guava (Psidium guajava L.). Crop Prot. 2020, 135, 105216. [Google Scholar] [CrossRef]
- Wang, X.; Bao, Q.; Sun, G.; Li, J. Application of Homemade Organic Fertilizer for Improving Quality of Apple Fruit, Soil Physicochemical Characteristics, and Microbial Diversity. Agronomy 2022, 129, 2055. [Google Scholar] [CrossRef]
- Wang, Z.; Yang, H.; Ma, Y.; Jiang, G.; Mei, X.; Li, X.; Yang, Q.; Kan, J.; Xu, Y.; Yang, T.; et al. WGCNA analysis revealing molecular mechanism that bio-organic fertilizer improves pear fruit quality by increasing sucrose accumulation and reducing citric acid metabolism. Front. Plant Sci. 2022, 132022, 2022. [Google Scholar] [CrossRef]
- Kai, T.; Adhikari, D. Effect of Organic and Chemical Fertilizer Application on Apple Nutrient Content and Orchard Soil Condition. Agriculture 2021, 114, 340. [Google Scholar] [CrossRef]
- Brummell, D.A.; Dal Cin, V.; Crisosto, C.H.; Labavitch, J.M. Cell wall metabolism during maturation, ripening and senescence of peach fruit. J. Exp. Bot. 2004, 55405, 2029–2039. [Google Scholar] [CrossRef]
- Li, X.; Xu, C.; Korban, S.S.; Chen, K. Regulatory Mechanisms of Textural Changes in Ripening Fruits. Crit. Rev. Plant Sci. 2010, 294, 222–243. [Google Scholar] [CrossRef]
- Muramatsu, N.; Tanaka, K.; Asakura, T.; Haji, T. Changes in Cell Wall Polysaccharides and Physical Properties of Peach (Prunus persica Batsch) Fruit during Ripening. J. Jpn. Soc. Hortic. Sci. 2004, 73, 534–540. [Google Scholar] [CrossRef]
- Lahaye, M.; Falourd, X.; Quemener, B.; Ralet, M.C.; Howad, W.; Dirlewanger, E.; Arús, P. Cell Wall Polysaccharide Chemistry of Peach Genotypes with Contrasted Textures and Other Fruit Traits. J. Agr. Food Chem. 2012, 6026, 6594–6605. [Google Scholar] [CrossRef] [PubMed]
- Wang, Y.; Zhang, X.; Yang, S.; Yuan, Y. Metabolite and Transcriptome analyses indicate the involvement of lignin in programmed changes in peach fruit texture. J. Agr. Food Chem. 2018, 6648, 12627–12640. [Google Scholar] [CrossRef]
- Vma, B.; Ag, A.; Ata, C.; Pcd, E.; Lmdf, G.; Mmrc, C.; Hgab, H. Vineyard calcium sprays induce changes in grape berry skin, firmness, cell wall composition and expression of cell wall-related genes. Plant Physiol. Bioch. 2020, 150, 49–55. [Google Scholar] [CrossRef]
- Ohkawa, W.; Kanayama, Y.; Daibo, N.; Sato, T.; Nishiyama, M.; Kanahama, K. Metabolic process of the 14C-sugars on the translocation pathways of cucumber plants. Sci. Hortic. 2010, 1241, 46–50. [Google Scholar] [CrossRef]
- Vimolmangkang, S.; Zheng, H.; Peng, Q.; Jiang, Q.; Wang, H.; Fang, T.; Liao, L.; Wang, L.; He, H.; Han, Y. Assessment of Sugar Components and Genes Involved in the Regulation of Sucrose Accumulation in Peach Fruit. J. Agr. Food Chem. 2016, 6435, 6723–6729. [Google Scholar] [CrossRef] [PubMed]
- Ozlem, A.; Nilay, O.; Yasemin, G. Effect of Grafting on Watermelon Plant Growth, Yield and Quality. J. Agron. 2007, 62, 362–365. [Google Scholar] [CrossRef]
- Liu, J.; Guo, S.; He, H.; Zhang, H.; Gong, G.; Ren, Y.; Xu, Y. Dynamic characteristics of sugar accumulation and related enzyme activities in sweet and non-sweet watermelon fruits. Acta Physiol. Plant. 2013, 3511, 3213–3222. [Google Scholar] [CrossRef]
- Guo, S.; Sun, H.; Zhang, H.; Liu, J.; Ren, Y.; Gong, G.; Jiao, C.; Zheng, Y.; Yang, W.; Fei, Z. Comparative Transcriptome Analysis of Cultivated and Wild Watermelon during Fruit Development. PLoS ONE 2015, 106, e0130267. [Google Scholar] [CrossRef]
- Mollah, M.D.A.; Zhang, X.; Zhao, L.; Jiang, X.; Ogutu, C.O.; Peng, Q.; Belal, M.A.A.; Yang, Q.; Cai, Y.; Nishawy, E.; et al. Two vacuolar invertase inhibitors PpINHa and PpINH3 display opposite effects on fruit sugar accumulation in peach. Front. Plant Sci. 2022, 132022, 2022. [Google Scholar] [CrossRef]
- Kaczor-Urbanowicz, K.E.; Kim, Y.; Li, F.; Galeev, T.; Kitchen, R.R.; Gerstein, M.; Koyano, K.; Jeong, S.H.; Wang, X.; Elashoff, D.; et al. Novel approaches for bioinformatic analysis of salivary RNA sequencing data for development. Bioinformatics 2018, 341, 1–8. [Google Scholar] [CrossRef] [PubMed]
- Li, D.; Deng, Z.; Qin, B.; Liu, X.; Men, Z. De novo assembly and characterization of bark transcriptome using Illumina sequencing and development of EST-SSR markers in rubber tree (Hevea brasiliensis Muell. Arg.). BMC Genomics 2012, 13, 192. [Google Scholar] [CrossRef]
- Ashburner, M.; Ball, C.A.; Blake, J.A.; Botstein, D.; Butler, H.; Cherry, J.M.; Davis, A.P.; Dolinski, K.; Dwight, S.S.; Eppig, J.T.; et al. Gene Ontology: Tool for the unification of biology. Nat. Genet. 2000, 251, 25–29. [Google Scholar] [CrossRef] [PubMed]
- Wang, Q.; Zhang, H.; Liu, H.; Liu, J. Effect of different preservation treatments on olecranon honey peach. J. Food Process. Preserv. 2019, 437, e13960. [Google Scholar] [CrossRef]
- Liang, R.; Su, Y.; Qin, X.; Gao, Z.; Fu, Z.; Qiu, H.; Lin, X.; Zhu, J. Comparative transcriptomic analysis of two Cucumis melo var. saccharinus germplasms differing in fruit physical and chemical characteristics. BMC Plant Biol. 2022, 221, 193. [Google Scholar] [CrossRef]
- Pang, X.A.; Suo, J.; Liu, S.; Xu, J.; Yang, T.G.; Xiang, N.; Wu, Y.; Lu, B.; Qin, R.; Liu, H.; et al. Combined transcriptomic and metabolomic analysis reveals the potential mechanism of seed germination and young seedling growth in Tamarix hispida. BMC Genomics 2022, 231, 109. [Google Scholar] [CrossRef]
- You, S.; Cao, K.; Chen, C.; Li, Y.; Wang, L. Selection and validation reference genes for qRT-PCR normalization in different cultivars during fruit ripening and softening of peach (Prunus persica). Sci. Rep. 2021, 111, 7302. [Google Scholar] [CrossRef]
- Livak, K.J.; Schmittgen, T.D. Analysis of Relative Gene Expression Data Using Real-Time Quantitative PCR and the 2−ΔΔCT Method. Methods 2001, 254, 402–408. [Google Scholar] [CrossRef]
- Liao, G.; He, Y.; Li, X.; Zhong, M.; Huang, C.; Yi, S.; Liu, Q.; Xu, X. Effects of bagging on fruit flavor quality and related gene expression of AsA synthesis in Actinidia eriantha. Sci. Hortic. 2019, 256, 108511. [Google Scholar] [CrossRef]
- Li, Y.; Qi, X.; Cui, W.; Lin, M.; Qiao, C.; Zhong, Y.; Fang, J.; Hu, C. Restraint of Bagging on Fruit Skin Coloration in on-Tree Kiwifruit (Actinidia arguta). J. Plant Growth Regul. 2021, 402, 603–616. [Google Scholar] [CrossRef]
- Gao, Y.; Guo, Y.; Su, Z.; Yu, Y.; Zhu, Z.; Gao, P.; Wang, X. Transcriptome analysis of genes related to fruit texture in watermelon. Sci. Hortic. 2020, 262, 109075. [Google Scholar] [CrossRef]
- Yang, L.; Cong, P.; He, J.; Bu, H.; Qin, S.; Lyu, D. Differential pulp cell wall structures lead to diverse fruit textures in apple (Malus domestica). Protoplasma 2022, 2595, 1205–1217. [Google Scholar] [CrossRef] [PubMed]
- Pauly, M.; Keegstra, K. Biosynthesis of the Plant Cell Wall Matrix Polysaccharide Xyloglucan. Annu. Rev. Plant Biol. 2016, 671, 235–259. [Google Scholar] [CrossRef] [PubMed]
- Zhong, R.; Phillips, D.R.; Ye, Z. A Single Xyloglucan Xylosyltransferase Is Sufficient for Generation of the XXXG Xylosylation Pattern of Xyloglucan. Plant Cell Physiol. 2021, 6210, 1589–1602. [Google Scholar] [CrossRef]
- Yang, J.; Bak, G.; Burgin, T.; Barnes, W.J.; Mayes, H.B.; Peña, M.J.; Urbanowicz, B.R.; Nielsen, E. Biochemical and Genetic Analysis Identify CSLD3 as a beta-1,4-Glucan Synthase That Functions during Plant Cell Wall Synthesis. The Plant Cell 2020, 325, 1749–1767. [Google Scholar] [CrossRef] [PubMed]
- Van Sandt, V.S.T.; Suslov, D.; Verbelen, J.-P.; Vissenberg, K. Xyloglucan Endotransglucosylase Activity Loosens a Plant Cell Wall. Ann. Bot-London 2007, 1007, 1467–1473. [Google Scholar] [CrossRef]
- Han, Y.; Ban, Q.; Li, H.; Hou, Y.; Jin, M.; Han, S.; Rao, J. DkXTH8, a novel xyloglucan endotransglucosylase/hydrolase in persimmon, alters cell wall structure and promotes leaf senescence and fruit postharvest softening. Sci. Rep. 2016, 61, 39155. [Google Scholar] [CrossRef]
- Wu, S.; Chaves, A.M.; Li, R.; Bezanilla, M.; Roberts, A.W. Cellulose synthase-like D (CSLD) proteins move in the plasma membrane and their targeting to cell tips, but not cell plates, depends on the actin cytoskeleton. bioRxiv, 2021. [Google Scholar] [CrossRef]
- Liu, P.; Du, L.; Huang, Y.; Gao, S.; Yu, M. Origin and diversification of leucine-rich repeat receptor-like protein kinase (LRR-RLK) genes in plants. BMC Evol. Biol. 2017, 171, 47. [Google Scholar] [CrossRef]
- Does, D.V.D.; Boutrot, F.; Engelsdorf, T.; Rhodes, J.; Zipfel, C. The Arabidopsis leucine-rich repeat receptor kinase MIK2/LRR-KISS connects cell wall integrity sensing, root growth and response to abiotic and biotic stresses. Plos Genet. 2017, 136, 6. [Google Scholar] [CrossRef]
- Li, X.; Liu, P.; Zhou, J.; Su, M.; Ma, Y.; Jia, H.; Du, J.; Gao, Z.; Ye, Z. Effects of Exogenous Application of GA4+7 and NAA on Sugar Accumulation and Related Gene Expression in Peach Fruits During Developing and Ripening Stages. J. Plant Growth Regul. 2021, 403, 962–973. [Google Scholar] [CrossRef]
- Desnoues, E.; Gibon, Y.; Baldazzi, V.; Signoret, V.; Génard, M.; Quilot-Turion, B. Profiling sugar metabolism during fruit development in a peach progeny with different fructose-to-glucose ratios. BMC Plant Biol. 2014, 141, 336. [Google Scholar] [CrossRef]
- Sami, F.; Siddiqui, H.; Hayat, S. Interaction of glucose and phytohormone signaling in plants. Plant Physiol. Bioch. 2019, 135, 119–126. [Google Scholar] [CrossRef] [PubMed]
- Schemberger, M.O.; Stroka, M.A.; Reis, L.; De Souza Los, K.K.; De Araujo, G.A.T.; Sfeir, M.Z.T.; Galvão, C.W.; Etto, R.M.; Baptistão, A.R.G.; Ayub, R.A. Transcriptome profiling of non-climacteric ‘yellow’ melon during ripening: Insights on sugar metabolism. BMC Genomics 2020, 211, 262. [Google Scholar] [CrossRef] [PubMed]
- Koch, K. Sucrose metabolism: Regulatory mechanisms and pivotal roles in sugar sensing and plant development. Curr. Opin. Plant Biol. 2004, 73, 235–246. [Google Scholar] [CrossRef] [PubMed]
- Hirose, T.; Scofield, G.N.; Terao, T. An expression analysis profile for the entire sucrose synthase gene family in rice. Plant Sci. 2008, 1745, 534–543. [Google Scholar] [CrossRef]
- Liao, G.; Li, Y.; Wang, H.; Liu, Q.; Zhong, M.; Jia, D.; Huang, C.; Xu, X. Genome-wide identification and expression profiling analysis of sucrose synthase (SUS) and sucrose phosphate synthase (SPS) genes family in Actinidia chinensis and A. eriantha. BMC Plant Biol. 2022, 221, 1–15. [Google Scholar] [CrossRef]
- Fugate, K.K.; Eide, J.D.; Martins, D.N.; Grusak, M.A.; Deckard, E.L.; Finger, F.L. Colocalization of sucrose synthase expression and sucrose storage in the sugarbeet taproot indicates a potential role for sucrose catabolism in sucrose accumulation. J. Plant Physiol. 2019, 240, 153016. [Google Scholar] [CrossRef]
- Wang, X.; Li, S.; Zhang, X.; Gao, L.; Ruan, Y.; Tian, Y.; Ma, S. From Raffinose Family Oligosaccharides to Sucrose and Hexoses: Gene Expression Profiles Underlying Host-to-Nematode Carbon Delivery in Cucumis sativus Roots. Front. Plant Sci. 2022, 132022, 2022. [Google Scholar] [CrossRef]
- Chua, T.K.; Bujnicki, J.M.; Tan, T.-C.; Huynh, F.; Patel, B.K.; Sivaraman, J. The Structure of Sucrose Phosphate Synthase from Halothermothrix orenii Reveals Its Mechanism of Action and Binding Mode. The Plant Cell 2008, 204, 1059–1072. [Google Scholar] [CrossRef]
- Jin, L.; Guo, D.; Ning, D.; Hussain, S.B.; Liu, Y. Covering the trees of Kinokuni tangerine with plastic film during fruit ripening improves sweetness and alters the metabolism of cell wall components. Acta Physiol. Plant. 2018, 4010, 182. [Google Scholar] [CrossRef]
- García-Santiago, J.C.; Lozano Cavazos, C.J.; González-Fuentes, J.A.; Zermeño-González, A.; Rascón Alvarado, E.; Rojas Duarte, A.; Preciado-Rangel, P.; Troyo-Diéguez, E.; Peña Ramos, F.M.; Valdez-Aguilar, L.A.; et al. Effects of fish-derived protein hydrolysate, animal-based organic fertilisers and irrigation method on the growth and quality of grape tomatoes. Biol. Agric. Hortic. 2021, 372, 107–124. [Google Scholar] [CrossRef]
Disclaimer/Publisher’s Note: The statements, opinions and data contained in all publications are solely those of the individual author(s) and contributor(s) and not of MDPI and/or the editor(s). MDPI and/or the editor(s) disclaim responsibility for any injury to people or property resulting from any ideas, methods, instructions or products referred to in the content. |
© 2023 by the authors. Licensee MDPI, Basel, Switzerland. This article is an open access article distributed under the terms and conditions of the Creative Commons Attribution (CC BY) license (https://creativecommons.org/licenses/by/4.0/).