Abstract
The productivity of fodder legumes, based on internal sources of N, may be limited due to an insufficient supply of nutrients responsible for the efficient use of N accumulated by the crop during the growing season. Production risk occurs on soils that are naturally poor or depleted in nutrients that are decisive for the fixation and utilization of N2 by alfalfa. This hypothesis was validated on the basis of a field experiment with an alfalfa–grass mixture carried out over three main seasons (2012−2014) on soil low in available potassium (K), calcium (Ca), and sulfur (S). The experiment involved two factors that contained two levels of applied gypsum (GYP: 0, 500 kg ha−1) fertilized with P and K (POT: absolute control—AC, P60K0, P60K30, P60K60, and P60K120). In each main season of the alfalfa–grass mixture, the sward was mowed three times (three cuts). The total sward yield (TY) reached its maximum in the second main season (15.6 t DW ha−1), then it significantly decreased. The sward yield of the third cut was the main driver of the TY. The content of P in the first cut, and especially P and S in the third cut of the sward, affected the N:P and P:S ratios, which, in turn, determined the productivity of the alfalfa–grass mixture. The total amount of accumulated N (TN) in the sward significantly responded to gypsum and PK fertilizers. In the first and third main seasons, the highest TN was found on the plot fertilized with both gypsum and 120 kg K2O ha−1. In the second main season, the TY was determined by PK dose, being variable in successive years. The highest total N accumulation (TN) was recorded in the second main season. It reached 504 kg N ha−1 on the plots with GYP−0 and 436 kg N ha−1 for GYP−500. However, the corresponding TY was 16.7 and 17.3 t DW ha−1. This apparent discrepancy was due to the much higher productivity of N, which was 33.2 and 39.6 kg fodder DW ha−1 TN, respectively. These two characteristics clearly indicate that the productivity of the accumulated N by the alfalfa–grass sward was significantly restricted by the shortage of P and S. The studies clearly emphasized that the sward of the alfalfa–grass mixture grown on soil depleted in available K, Ca, and S responds significantly to the combined application of gypsum and potassium, but provides effective control of the P supply, even on soil rich in available P.
1. Introduction
Legume plants benefit from atmospheric N through symbiosis with papillary bacteria. They play a significant role in the soil N balance and the N cycle in nature. Depending on weather conditions, the amount of atmospheric N fixed by legumes ranges from 50 to 250 kg N ha−1 [1]. The quantity of N in roots accounts for 25% of the nitrogen taken up by legumes [2]. Legume plants and their mixtures with grasses form a link between crop and livestock production on a farm [3]. Grass, as a component of legume–grass mixtures, may benefit from N2 fixed by legume bacteria [4]. The uptake of atmospheric N2 by legumes and the secondary transfer of N to other plants present in the canopy is important in reducing the consumption of mineral N fertilizers [5].
The study of alfalfa in Europe has clearly documented its potential to sustain the production of staple crops by substantially reducing the use of mineral N fertilizers [6]. The inclusion of alfalfa in mixtures with grasses affects the use of available water from deeper soil layers and increases the number of plant leaf blades in relation to the soil surface area (LAI), thus making better use of solar radiation [7]. Successful forage production based on mixtures of legumes and grasses depends on the selection of grass species and varieties that ensure the rapid growth and fast regrowth of plants after mowing competition with legumes for resources, mainly light and water. It is also very important to maintain an adequate dynamic growth rate for grass without using N fertilizers [8]. The most useful species for multispecies mixtures are grasses which are the most productive and show low competitiveness with legumes [9]. This condition is met by grass species such as Festuca pratensis (L.) Huds., Phleum pratense L., Lolium perenne L., Dacylis glomerata L., Arrhenatherum elatius (L.) P. Beauv ex J. Presl and C. Presl, and Festuca arundinacea Schreb [10,11].
The effective use of alfalfa’s yielding potential depends on the resources of nutrients in the soil and their effective uptake by roots, which grow to a depth of several meters [12,13]. The deep root system provides alfalfa with greater resistance to soil water deficits and tolerance to cultivation on sandy and mineral-poor soils [13]. Moreover, the long root system of alfalfa influences the movement of nutrients from the subsoil to the upper soil layers [14,15]. Therefore, a farmer beginning the cultivation of this crop should be aware of the current state of soil fertility both in the topsoil and in the subsoil [16]. This crop requires an appropriate level of soil reaction (neutral to alkaline), which is the key factor in obtaining and maintaining the necessary plant density [17,18]. Even when the soil reaches an adequate pH, Ca supply may be limited in some soils. The main reason is the low soil resources of this nutrient [19].
Calcium is an important nutrient for legumes, including alfalfa, for at least four purposes: (i) activation of root and shoot bud development; (ii) formation of root hair nodulation, resulting in the formation of bacteroids (nodules); (iii) tissue and organ formation and stability; and (iv) stress signaling, in which Ca acts as a secondary messenger [20,21]. The second group of critical nutrients includes those which are critical for the processes of N2 fixation and includes sulfur (S), iron (Fe), and molybdenum (Mo). In legumes, an adequate supply of S is crucial for the formation of Fe-S clusters, which are key physiological structures determining the activity of nitrogenase. In the next step in the assimilation of N2 by the legume plant, S is required for the synthesis of storage proteins, sulfur, and amino acids (cysteine, cysteine, and methionine) [22,23]. The plant regulates the absorption of S-SO4 from the soil solution through systemic signals, which result from the nutritional status of its aboveground shoot. Under conditions of S deficiency, SO42− carriers in the youngest part of the root and in root hairs are activated [24,25]. A good source of both Ca and S is gypsum (CaSO4 × 2H2O), which is currently used on arable land mainly as FGD gypsum (flue gas desulfurization). This carrier of both S and Ca, despite its naturally low solubility in water, is a reliable source of available S (S-SO4) [26,27]. The third group of nutrients necessary for alfalfa are those that are responsible for energy and transport processes in the plant, including N2 fixation and the transport of storage proteins in the plant from the root to the shoot. These functions depend on the supply of phosphorus (P), magnesium (Mg), and potassium (K) [28,29].
Alfalfa has a very high production potential. Under good natural growing conditions (climate and soil) and irrigation, the yield of the sward can even reach 20 t ha−1 [30]. Such high yields are rarely achievable in natural, i.e., rain-fed, conditions, even when rainfall is sufficient [31]. The foremost rationale for low sward yields is the insufficient fertility of the soil. The low content of available nutrients in such soils reduces the effectiveness of atmospheric N fixation [32]. This situation is typical for many European soils formed from post-glacial rocks. These soils are characterized by a small cation exchange complex, as well as low-key nutrient contents, such as Ca, K, and Mg. In addition, these soils are also prone to acidification [33]. In the last 30 years, many countries have significantly reduced SO2 emissions into the atmosphere. This process caused a decrease in the supply of S to the soil and, in consequence, a decrease in the content of the available soil sulfur [34]. Phosphorus resources in the arable soils of countries with intensive crop production are large, so the effectiveness of the so-called freshly applied phosphorus is low [35]. For these reasons, the response of alfalfa to P fertilization is difficult to predict [36]. The amount of available K in the soil is determined in the first step by the resources of minerals rich in this element. The consumption of K fertilizers in the world is low, leading to the depletion of the content of its available forms [33,37]. For this reason, the results of field studies indicate the need to use extremely high rates of potassium fertilizer. However, an increase in K doses leads to an imbalance (disturbance in stoichiometry) with other cations, such as Ca and Mg, known as the tetany ratio [38]. Despite its known physiological function of Ca and S, the response of alfalfa to these nutrients is poorly recognized [39,40].
Nitrogen accumulated in the shoots of the fodder legume plant originates to a great extent from atmospheric N2 fixation. This is the necessary condition for fully exploiting the yielding potential of the crop, such as alfalfa. Other nutrients taken up by alfalfa are required for the efficient utilization of the N accumulated in the shoots. Among the macronutrients, an important production role is played by P, K, Ca, Mg, and S. For this reason, these nutrients fulfill the sufficient condition for alfalfa sward growth and yield. Therefore, the question should be asked: to what extent does the shortage of key nutrients in the soil limit both the accumulation and productivity of N accumulated by alfalfa grown in a mixture of grasses? The main goals of the study were to determine the (1) yields of the alfalfa–grass sward in response to experimental factors over subsequent years of its use and (2) sward yield prediction based on (a) the content of the nutrients; (b) the ratios between the nutrients; and (c) the accumulation of the nutrients. These goals were verified in field experiments with alfalfa–grass sward fertilized with gypsum and phosphorus/potassium fertilizers.
2. Materials and Methods
2.1. Research Site
A field experiment with a mixture of alfalfa and grass was conducted from 2011−2015 at the Brody Experimental Station, Poznan University of Life Sciences, Poland (52°44′ N, 16°28′ E) on soil formed from loamy sand, classified as Albic Luvisols (Neocambic) [41]. The presented study covers three main seasons of the alfalfa–grass mixture usage: the first one in 2012 (first season), the second in 2013 (second), and the third in 2014 (third). The content of the main nutrients was determined in three soil layers (every 30 cm) to a depth of 90 cm in 2011, just after the harvesting of winter oilseed rape (fore-crop). Soil reaction (pH) was in the neutral range and increased systematically with soil depth (Table 1). The content of humus was at a moderate level and slightly decreased with soil depth. The content of both total S and S-SO4 showed the same tendency as for pH. The content of available S was in a very low class. Its content was particularly low in the topsoil. The content of available macronutrients was very high for magnesium (Mg), high for phosphorus (P), low for K, and very low for Ca.

Table 1.
The content of available nutrients in the soil profile at the time of setting up the experiment.
2.2. Weather Conditions
Basic data on the course of the weather in the growing seasons of 2012, 2013, and 2014 are shown in Figure 1. Optimum environmental conditions for the growth of alfalfa, as the dominant plant in the alfalfa–grass mixture, were met in each season of sward use. Temperatures oscillated during the growing season in the optimal range of 10–20 °C [45]. The total sum of precipitation during the growing season was from 375 mm in the second season to about 560 mm in the first season. The optimum range of precipitation is 300–600 mm [45]. It should be emphasized that very high precipitation occurred in each year of sward use. Huge monthly rainfall was recorded in June and July 2012, reaching 360 mm, which exceeded the lower optimum range required for the satisfactory growth of alfalfa. In the second season, high rainfall was recorded in June, whereas in the third season, this occurred in August.
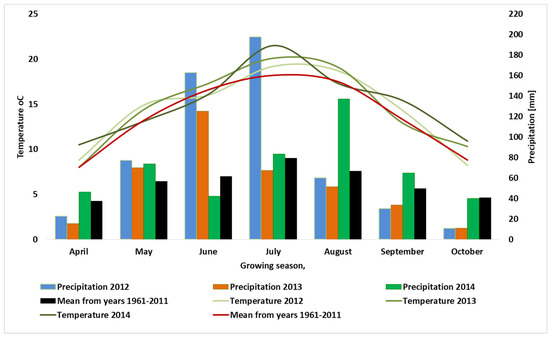
Figure 1.
Meteorological conditions during the study. Source: Meteorological Station Brody.
2.3. Experimental Design
The field experiment, arranged in a two-factorial design and replicated four times, began in the summer of 2011. The fore crop of the alfalfa–grass mixture was winter oilseed rape. A seed mixture composed of alfalfa (Medicago sativa L.)—80%, meadow fescue (Festuca pratensis Huds.)—15%, and timothy (Phleum pratense L.)—5% was sown on plots of 27.0 m2 (5.4 × 5.0 m) at an amount of 25 kg of seeds 1 ha−1.
The experiment was composed of two factors:
- FGD gypsum (flue gas desulfurization) or synthetic gypsum—two levels (0 and 500 kg CaSO4 × 2H2O ha−1), referred to as GYP−0 and GYP−500;
- Phosphorus and potassium treatments—five levels, referred to as AC, P60K0, P60K30, P60K60, and P60K120.
FGD gypsum contains calcium sulfate (CaSO4 × 2H2O) with 21.3% calcium (Ca) and 17% sulfur (S) (own data). This product was applied in the summer of 2011 in a dose of 500 kg ha−1 and repeated each spring before the beginning of the consecutive growing season. Each year, two weeks after the application of calcium sulfate, uniform phosphorus fertilization at a dose of 60 kg P2O5 ha−1 (triple superphosphate 46% P2O5) was applied. Potassium, as KCl (60% K2O), was applied together with phosphorus in the doses resulting from the experimental design.
2.4. Plant Sampling and Measurements
The sward of alfalfa–grass was mowed three times during the growing seasons (cuts) at the full budding phase of alfalfa development. The harvested area was 12.5 m2 (5 × 2.5 m). The sward was weighed and the yield of dry weight per hectare was calculated. The total yield from the three harvests was summed up.
A chlorophyll meter, SPAD-502Plus, was used to measure the absorbance of the top mature leaves just before the sward mowing. This index expresses the relative amount of chlorophyll in a plant leaf [46]. N content was determined in the plant parts by using the standard macro-Kjeldahl procedure [47] and is expressed in dry weight. The content of total sulfur was determined using the CS auto-analyzer (ELEMENTRACT CS-i). The plant material for phosphorus determination was mineralized at 600 °C. The obtained ash was then dissolved in 33% HNO3. Phosphorus concentration was measured by the vanadium–molybdenum method by using a Specord 2XX/40 at a wavelength of 436 nm.
2.5. Calculated Parameters: Nutrient Unit Productivity—NUP
Calculation of nutrient productivity requires two sets of data, the yield and the amount of accumulation of the nutrient in the crop. The calculation method for NUP is as follow:
Here,
n—C, N, P, and S nutrients;
TY—total yield of the alfalfa–grass sward, kg ha−1;
TA—the amount of a nutrient accumulated in the sward, kg ha−1.
2.6. Statistical Analysis
The effect of experimental factors (years, FGD gypsum doses, and potassium dose) and their mutual interactions on the successive yields of the sward, total yield, the content of nutrients, the nutrient ratios, and nutrient accumulation in the alfalfa–grass sward were assessed by analysis of variance. Means were separated by honest significant difference (HSD) using the Tukey method when the F-test showed significant factor effects at p < 0.05. The relationships between the examined characteristics were analyzed using Pearson correlation and linear regression. Stepwise regression analysis was used to determine the optimal set of variables for a given plant trait. The best regression model was selected based on the highest F-value for the entire model. STATISTICA 12 software was used for all statistical analyses (StatSoft Inc., Tulsa, OK, USA, 2013).
3. Results
3.1. In-Season Variability in the Sward Yield
The total yield (TY) of the alfalfa–grass mixture was significantly affected by the season of sward use. Within a given season, it was significantly impacted by successive cuts. The TY of the alfalfa–grass mixture was clearly determined by the yield of the third cut of the sward (Y3; Table S1):
The obtained linear regression model unambiguously indicates that the variability in TY of the alfalfa–grass mixture depended on the variability of the sward yield of cut No. 3. The strength of the discussed relationship (R2 value) in each growing season (treated separately) was higher than the average shown above (Figure S1).
The yield of the first cut (Y1), averaged for years and experimental treatments, was the lowest in the studied years and accounted for only 29.1% of the TY (Table 2). It was significantly defined on the GYP × POT interaction (Figure 2). The effect of gypsum (GYP) on the TY for this particular cut was significant for all treatments, but a particularly high response was observed for the K fertilizer applied. In the absolute control (AC), a small but significant increase of 0.2 t ha−1 DW was recorded. The use of P but without K (K control, K0) caused a slight yield increase. The application of K, regardless of the dose, increased the yield. The increase in the TY on the GYP−0 when referred to the K control was 0.6 t ha−1, while for GYP−500, it reached 1.1 t ha−1. The sward yield of the second cut (Y2) showed significant variability in response to the Y × POT interaction (Figure 3). The greatest increase in the TY in response to the applied PK fertilizers was found in the first main season. The use of P increased the sward yield by 0.8 t ha−1 in comparison to the AC (+19%). The TY increased gradually with doses of K. The maximum yield was obtained on the plot with 120 kg K2O ha−1. It was 45.2% higher when compared to the AC. The same trend was observed in subsequent seasons. However, the sward yields were both lower and showed a much lower response to PK doses. The TY of the third cut (Y3) was driven, like the first, by the GYP × POT interaction (Figure 4). The effect of gypsum was small, but it significantly affected the sward yield up to the K rate of 60 kg K2O ha−1. The maximum yield obtained for the GYP−0 main plot fertilized with 120 kg K2O ha−1 was higher in comparison to the AC by 35.9%. The difference between the respective treatments for GYP−500, due to a higher yield on the AC plot, was much lower.
Table 2.
Effect of gypsum and phosphorus/potassium fertilizers on the yield of the alfalfa–grass sward and indicators of the nitrogen status of the plants.
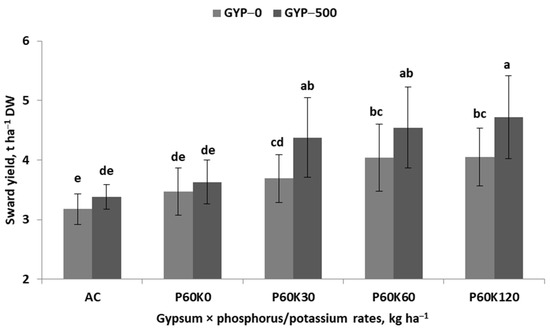
Figure 2.
Effect of gypsum and phosphorus/potassium rates on the yield of the first cut (Y1) of the alfalfa–grass sward. Labeling with the same letters indicates a lack of significant differences between experimental treatments using Tukey’s test. The vertical bar in the column is the standard error of the mean.
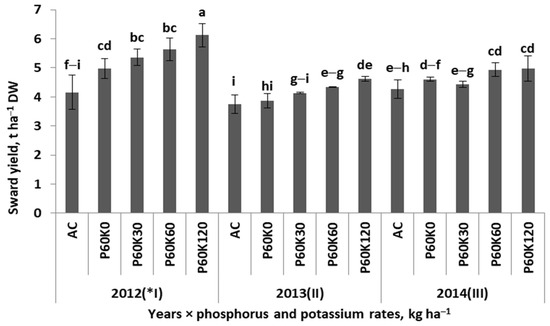
Figure 3.
Effect of phosphorus/potassium rates in successive years on the yield of the second cut (Y2) of the alfalfa−grass sward. Labeling with the same letters indicates a lack of significant differences between experimental treatments using Tukey’s test. The vertical bar in the column is the standard error of the mean; (*I) main seasons of sward use.
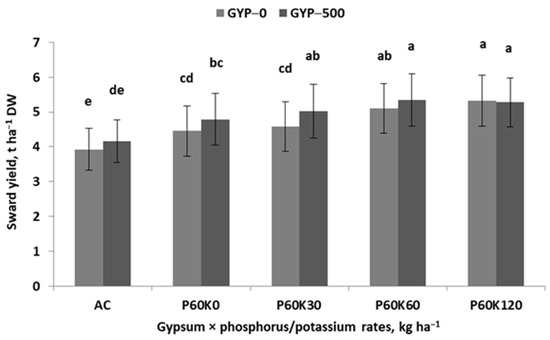
Figure 4.
Effect of gypsum and phosphorus/potassium rates on the yield of the third cut (Y3) of the alfalfa–grass sward. Labeling with the same letters indicates a lack of significant differences between experimental treatments using Tukey’s test. The vertical bar in the column is the standard error of the mean.
The analysis of the botanical composition of the sward shows (Table 2) that as the “sward aged” over the three years of research, the proportion of alfalfa increased from 75.3% in the first season to 83.6% in third. The proportion of grass decreased from 19.8% in the first season to 6.9% in the third (average for GYP−0 and GYP−500). The maximum share of herbs and weeds in the sward was less than 10%. A clear decrease in the share of grass and herbs, including weeds, was observed in treatments fertilized with high doses of PK fertilizers.
3.2. Nutrient Content in the Sward of Successive Cuts
The N content in the sward was not significantly associated with Y1 of the sward (Table S1). Moreover, it was negatively associated with the yields of the subsequent cuts. A strong negative relationship between these two traits of the alfalfa–grass mixture was noted for Y3. Despite these relationships, the TY was limited by N deficiency in Y1 as well as in Y2 but not in Y3. The N content in each cut of the sward was considerably driven by the Y × GYP × POT interaction (Table 2). When averaged over the examined factors, it was 26.9 ± 6.5 g kg−1 DM (CV = 24.3%). Its highest values averaged over the years—and, at the same time, the greatest variability in N content—was noted for Y3. The negative relationship between the content of N3 and Y3 indicates an excess of N content in relation to the sward yield (Table 2 and Table S1). The main cause for the obtained relationship was the N content in the third season (Figure S2). It was much higher in comparison with the values recorded in other years and cuts, and the yields were the lowest. The lowest N content was found in the second season when the yields were the greatest. From a diagnostic point of view, the N content in the sward of the first cut (N1) was found to be an appropriate predictor of TY. The reason for the choice of this N trait was the strong positive relationship between N1 and both the TY and the SPAD index (r = 0.65 *** and r = 0.81 ***, respectively). Such relationships were not observed for the other sward cuts.
The highest N content in Y1 was recorded in the second main season (Figure S3). In this particular season, the effect of GYP on the content of N was strong yet variable, depending on the dose of PK. Gypsum increased the N content but only up to 30 kg K2O ha−1. The higher dose of K decreased the N content. In the first season, the use of gypsum caused the largest increase in N content, mainly due to the positive interaction with PK. In the third season, a large irregularity in the impact of both experimental factors on N content was observed. The SPAD index did not show (Y1 and Y3), or was poorly correlated with, the corresponding yields of the alfalfa–grass sward (Y2). However, as discussed above, SPAD1 showed a significant relationship with both the TY and N1 (Table S1). As with N1, SPAD1 peaked in the second main season (Figure S4). The interaction of GYP and PK fertilizers was positive in each year of the study, being, at the same time, the most consistent in the AC and K control plots. The maximum SPAD index was found for the P60K60 plot.
The content of the studied nutrients, in general, showed a weak relationship with the yields of the corresponding cuts (Table S2). The carbon content in the sward of the first cut (C1) and N in the third cut (N3) was significantly but negatively correlated with the yield of respective cuts (Y1, Y3). A positive correlation with the sward yield was noted only for the content of S in the first and the third cut (S1 and S3, respectively). However, stepwise regression analysis indicated C1 as a key predictor of Y1. The obtained regression model is stated as follows:
This regression model clearly shows that each increase in the content of C in the alfalfa–grass sward of the first cut caused a decrease in the yield. In addition, the content of C1 was not significantly correlated with the content of other examined nutrients. This characteristic of the alfalfa–grass sward was significantly driven by the Y × GYP × POT interaction (Figure S5). Three facts can be considered in assessing the variability of C1. First, a gradual decrease in C content with the age of alfalfa plants. The second highlights its highest values on the AC plot. Third, the use of gypsum and PK fertilizers caused a decrease in the C1 content. The strongest impact was observed in the second season.
The P content in the sward of the alfalfa–grass mixture expressed little variability during the study (Table 3). Its average level was 9.1 ± 0.6 g kg−1 DM (CV = 9.1%). The P content in consecutive sward cuts was not (P1 and P3) or was poor (P2) related to the corresponding sward yields (Table S2). However, that sward trait was the key nutritional factor, significantly limiting the TY throughout the entire growing season, i.e., in the consecutive cuts. The P content in the first cut (P1) in the sward, as derived from the stepwise regression analysis, can be used as a key predictor of TY:
Table 3.
Effect of gypsum and phosphorus/potassium fertilizers on the content of nutrients in the sward of alfalfa–grass mixture in successive cuts.
This equation clearly indicates that the P content in the first cut of the alfalfa–grass sward explained 67% of the TY variability. It was determined by the Y × GYP × POT interaction (Figure A1). The P1 highest values, similar to N1, were found in the second season. The increase in P content as a result of gypsum application was the highest on the P60K0 plot and increased by 14.5% when compared to the analogous GYP−0 plot. The strongest effect of gypsum was observed in the third season. The greatest increase was found on the AC plot (+25.4%), decreasing with applied K dose. A slightly smaller increase on the same plot was noted in the first season (+19.9%).
The content of S in the sward of the alfalfa–grass mixture showed exceptionally high variability (Table 3). Its content was the highest in the second season but, at the same time, it was very diverse between successive cuts. In this particular season, the S content was low in the sward of Y1 and almost three times higher in the subsequent cuts. The opposite trend was noted in the third year of sward use. In addition, the contents of N and S in Y3 showed a significant but completely inverse association with yield. The developed regression model is as follows:
The developed regression model shows that each decrease in the N content and the simultaneous increase in the S content in the sward explains 79% of the Y3 variability.
3.3. Ratios between Pairs of Nutrients in the Alfalfa–Grass Sward
Three pairs of nutrient ratios were tested over the consecutive cuts of the alfalfa–grass sward. Direct, significant relationships between the indices and the corresponding sward yields were found for NP2 × Y2, NP3 × Y3, NS1 × Y1, NS3 × Y3, and PS3 × Y3. All these correlations had a negative sign, indirectly indicating that the extension in the ratio within a given pair of nutrients caused in a decrease in the yield of the analogous cut. The presented set of pairs indicates that N has a key role in TY prediction. Moreover, the highest values of correlations were also found for Y3, which was the key TY predictor (Equation (1), Tables S1 and S3). Stepwise regression analysis, however, indicated a slightly different set of TY predictors:
The obtained model provides two important pieces of information. First, all the basic nutrients, i.e., N, P, and S (but for two different sward cuts), significantly affected the TY. Secondly, each extension of the N:P ratio in the first as well as P:S in the third cut, caused a decrease in the TY.
The first ratio analyzed was significantly driven by the GYP × POT interaction (Table 4, Figure A2). The use of gypsum was the most effective on the AC plot, reducing the N:P ratio by 17.3%. On the remaining plots, the impact of gypsum was positive but small. The main reason was the use of P/K fertilizers, which significantly reduced this index compared to its value on AC. The analysis of the P:S ratio in the third cut clearly indicates its strong year-to-year variability (Figure 5). The highest sward yields, both for Y3 and the TY, were obtained for the lowest P:S index value. In the first season, this index was the widest and was three times higher than in the second main season, which yielded the highest. The use of gypsum caused a small but considerable decrease in the index value. The effect of PK fertilizers was variable over the subsequent years, being the most stable in the second season.
Table 4.
Nutrient ratios of basic nutrients in subsequent cuts of the alfalfa–grass sward in response to gypsum and phosphorus/potassium fertilizers.
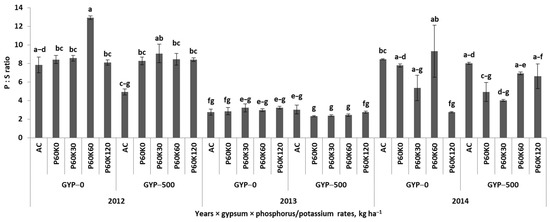
Figure 5.
Effect of gypsum and phosphorus/potassium rates over subsequent years for sward use on the P:S ratio in the third cut (Y3) of the alfalfa mixture. Labeling with the same letters indicates a lack of significant differences between experimental treatments using Tukey’s test. The vertical bar in the column is the standard error of the mean.
The yield predictive role of S content in a sward can also be partly understood by analyzing the N:S ratio in the third cut. This index showed the highest negative correlation for both Y3 and the TY (Table S3). These relationships are best described by the following equations:
These two equations clearly show that the highest yields were harvested when the N:S index was narrowest. Such values were found in the second season (Figure S6). The lowest of 3.75 t ha−1 in Y3 was obtained when the N:S ratio was 42.5:1. The lowest TY, amounting to 11.8 t ha−1, was obtained when this ratio was about 50:1. Such high ratios were noted both in the first and third seasons on the P60K60 and AC plots, respectively. The effect of gypsum on the N:S index was clear, reducing its value by approximately 22% in the first and the second and by 14% in the third season.
3.4. Nutrient Accumulation in the Alfalfa–Grass Sward
The amount of the nutrient, regardless of the element, accumulated in the sward of each successive cut of the alfalfa–grass sward significantly determined its yield (Table S4). The strongest relationship between both characteristics of the examined sward was found for Y3 (r ≥ 0.9 ***). In the case of Y1, this relationship was weaker only for S (r = 0.72 ***). The greatest variability was observed for Y2. The strongest dependency (r ≥ 0.9 ***) was noted for C and P. The relationship between the accumulated N (N2a) and Y2 was significant but much weaker (r = 0.69 ***). For S2a, the relationship with Y2 was insignificant. The effect of the total amount of a given nutrient in the sward and the TY was positive in 8 out of the 12 examined cases. The highest correlations (r ≈ 0.9) were found for the pair N3a × P3a. The performed stepwise regression analysis, assuming that C was on or off, confirmed the importance of P3a as the key component of the developed regression model:
Each of the components of Equation (8) (considered as a single variable) was significantly and positively correlated with TY (Table S4).
The P3a is based on the Y × POT interaction (Table 5, Figure 6). It was characterized by high variability in the subsequent seasons of sward use and responded significantly to the applied PK fertilizers. In the second season, P3a averaged over other treatments was twice as high when compared to the other two. The differences between the successive seasons for the AC plot were almost the same as for the respective PK treatments. However, the increase in P3a in response to PK fertilizers showed a gradual increase in all seasons, reaching 44.4% in the first, 36.8% in the second, and 73.3% in the third season. The intersessional variability in P3a, considered as a single, independent value, determined 83% of TY variability:
Table 5.
Nutrient accumulation by the alfalfa–grass sward in subsequent cuts of the alfalfa–grass sward in response to gypsum and phosphorus/potassium fertilizers.
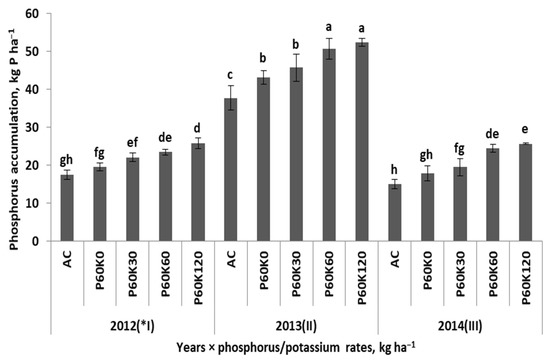
Figure 6.
Effect of phosphorus/potassium rates in successive years on phosphorus accumulation in the third cut (Y3) of the alfalfa−grass sward. Labeling with the same letters indicates a lack of significant differences between experimental treatments using Tukey’s test. The vertical bar in the column is to the standard error of the mean; (*I) main seasons of sward use.
This equation clearly shows that each increase in the amount of P in Y3 for the sward caused in its total yield increase.
The second component of Equation (8), i.e., the mass of P in Y1 (P1a), was determined by the GYP × POT interaction (Table 5). The effect of gypsum increased P1a both on the AC plot and the plots fertilized with increasing doses of PK (Figure 7). P1a increased significantly in response to the gradual PK doses, but it was much stronger when gypsum was applied. The impact of gypsum was the greatest on the plot fertilized with 120 kg K2O ha−1, increasing P1a by 7 kg P ha−1 (+28%) when compared to the same variant but without gypsum. P1a in the sward on plot 120 kg K2O ha−1 almost doubled (+88%) when compared to its amount on the AC.
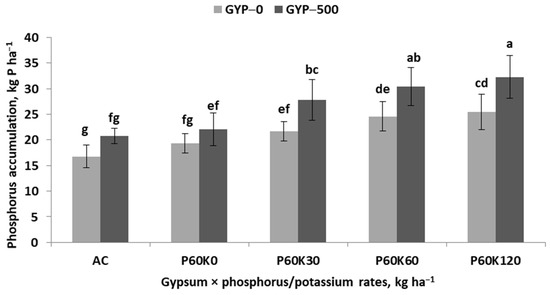
Figure 7.
Effect of gypsum and phosphorus/potassium rates on phosphorus accumulation in the first cut (Y1) of the alfalfa–grass sward. Labeling with the same letters indicates a lack of significant differences between experimental treatments using Tukey’s test. The vertical bar in the column is the standard error of the mean.
The third component of Equation (8) is the amount of sulfur in Y3 (S3a). Its variability was defined by the Y × GYP × POT interaction (Figure S7). Nevertheless, the key driver of S3a variability was the season. In the first season, the amount of accumulated S was extremely low, below 3.0 kg S ha−1. In the second, it increased several times. The effect of the PK fertilizers was significant, and, at the same time, it was enhanced by the use of gypsum. Its effect was noted in all plots, including the AC. The largest increase in S3a caused by the GYP × POT interaction was found for the P60K60 plot. In this particular plot, the application of gypsum increased S accumulation by 37.5% when compared to the analogous plot but without gypsum. The absolute increase in the amount of S in the sward, related to AC, was 69.2%. In the third season, S3a was significantly lower than in the second season. At the same time, it was very variable between treatments.
3.5. Utilization Efficiency of Nutrients Accumulated in the Alfalfa–Grass Sward
The TY of the sward of the alfalfa–grass mixture was significant related to the total amount of accumulated nutrients, with the exception of C (TC), and the relevant indices of their unit productivity (Table S5). Positive correlations were found for the total accumulation of N (TN), P (TP), and S (TS). The unit productivity indices, except C, were negatively correlated with the TY. Based on the stepwise analysis, a regression model was obtained, which indicated TN and nitrogen unit productivity (NUP) as the key predictors of the TY of the examined sward:
The developed equation clearly explains that each of the two sward characteristics significantly affected the TY. Thus, the negative correlation between NUP and TY indicates that in the discussed experiment, the total sward yield was mainly limited by N unit productivity. Moreover, the latter index was negatively correlated with TN, TP, and TS but positively with SUP.
The total amount of N accumulated in the sward of the alfalfa–grass mixture was affected by the Y × GYP × POT interaction (Table 6, Figure 8). The highest TN was found in the second season. Much lower values were found in the first and third seasons, constituting 72.5% and 80.8% of the second, respectively. The key factor affecting TN was the season of sward use. In the AC plot, TN reached 242, 353, and 260 kg N ha−1, in successive seasons of alfalfa use. The application of gypsum on this plot caused a significant increase in the amount of accumulated N by 32, 26, and 20 kg N ha−1, respectively. In each season, the GYP × POT interaction caused in a significant increase in TN. In the first season, the highest TN was found on the P60K120 plot, increasing to 316 and 382 kg N ha−1 on plots GYP−0 and GYP−500, respectively. In the second one, a maximum TN of N of 504 kg ha−1 was found on the GYP−0 plot fertilized with P60K120. For GYP−500, the highest TN of 458 kg N ha−1 was achieved on the P60K60 plot. It should be emphasized that the TN value on P60K120 was lower by 68 kg N ha−1 when compared to the analogous plot on GYP−0. In the third season, the same trends were observed as in the first season.
Table 6.
Total accumulation and unit productivity of nutrients in response to gypsum and phosphorus/potassium fertilizers.
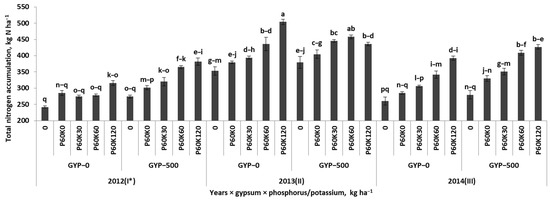
Figure 8.
Effect of gypsum and phosphorus/potassium rates over consecutive seasons for sward use on the total nitrogen accumulation in the alfalfa–grass mixture. Labeling with the same letters indicates a lack of significant differences between experimental treatments using Tukey’s test. The vertical bar in the column is the standard error of the mean; (*I) main seasons of sward use.
The second component of Equation (10), i.e., NUP, responded significantly to the Y × GYP × POT interaction (Table 6, Figure A3). The variability of the index when compared to TN was low (CV < 10%). Despite this, its values in subsequent seasons showed a specific course in reaction to the experimental factors. The index reached its highest value in the first season. The use of gypsum caused its decrease, especially on plots fertilized with K. In the second season, the response of the index to the experimental factors was quite specific. For GYP−0, a strong decrease for the P60K120 plot was observed against the AC plot. A completely contrary trend was noted for the GYP−500 plot. In the third season, the application of K fertilizer caused an index decrease, regardless of the use of gypsum.
Total P accumulation (TP) was significantly and strongly associated with both TN and, in consequence, with the TY (Table S5). The response of TP to the studied factors was significant but not with regard to the interaction between them (Table 6). The highest TP was found in the second season. The effect of the applied gypsum was positive, resulting in a higher accumulation of P by 17.1% P. A much stronger effect for PK fertilizer was observed. The net increase in TP in relation to the AC plot was high, amounting to almost 50% (+32.2 kg P ha−1). The total accumulation of S (TS) was significant but much less associated with TN and TY than was reported for TP (Table S5). It was defined by the GYP × POT interaction (Figure S8). The effect of this interaction was most evident for GYP−500. On this plot, the TS increased from 21 kg S ha−1 on the AC plot to 36 kg S ha−1 on the plot with 60P120K. The relative increase over the analogous plot on GYP−0 was 44% (+15 kg S ha−1).
4. Discussion
4.1. Nutrient Content in the Alfalfa–Grass Sward and Yield
The share of grass in the sward was low, decreasing during the study from about 20% in the first season to less than 7% in the third one. The obtained observations of the botanical analysis of the sward of alfalfa–grass mixture fully confirm the study by Gaweł [48], who observed that the proportion of alfalfa in the mixture with grass increased from 64.3% in the first season to 79.2% in the second main season of sward use. In contrast, the share of grass (Dactylis glomerata L.) in the sward decreased from 18.8% to 12.3% in the second season. Almost the same results are reported by Zoghlami [49], who studied the mixture of alfalfa and tall fescue (Festuca arundinacea Schreb.). This study showed that in the second season, the tall fescue was limited by alfalfa, for which the share increased from 46.0% to 84.0%. For this reason, in the ongoing discussion, the results obtained will mainly focus on alfalfa.
The sward yield of the alfalfa–grass mixture averaged over years and experimental factors, i.e., gypsum and phosphorus/potassium fertilizers, was 13.5 t DW. The maximum yield harvested in the second season was 15.6 t ha−1 DW. This yield is very high under natural growth conditions in the temperate regions of the world (temperature, precipitation) [31,50]. In very good environmental conditions, as in northern Italy, where the growing season and thus the number of successive alfalfa cuts is greater, the yields can even reach 20 t ha−1 [30]. The dominant characteristic of the examined sward was the yield decrease following the second main season of its use. This downward trend has also been noted in other experiments [50,51]. This phenomenon, called “stand aging”, can at least partly be explained by changes in the state of C content in alfalfa. Its decreases with the age of alfalfa plants was observed in subsequent seasons of sward use. Moreover, the use of gypsum and PK fertilizers caused a considerable decrease in the C content. The negative impact of gypsum was significant, being the most visible in the second main season. The obtained results indicate that the potential of alfalfa plants to fix CO2 is the highest in the youngest plants, being the most effective in the young sward and at the beginning of the spring regrowth in each subsequent year of sward use.
The impact of the experimental factors on the sward yield was variable in the consecutive cuts. The yields of the first and third cuts, i.e., Y1 and Y3, were driven by the GYP × POT interaction. The greatest yields were found on plots fertilized with gypsum and a moderate rate of PK. The yield of the second cut (Y2) responded significantly only to the applied PK doses; however, it showed high variability in subsequent seasons of sward growth. Our research showed that Y3 was to be the best predictor of the TY of the sward. The significant effect of P, applied at a constant rate under the conditions of a good soil P fertility status, should be clearly emphasized. Under such conditions, an increase in the alfalfa yield should not be expected [30]. In many experiments, extremely high rates of P and K are tested, exceeding the maximum applied in the examined experiment by several times. For example, Patel and Kotecha [52] identified a dose of 75 kg P2O5 and 300 kg K2O ha−1 as being optimal in the intensive production of alfalfa in India. Such high doses of K fertilizer usually result in a high sward yield but very often lead to the deterioration of the nutritive value of the fodder obtained [38].
The observed response of the alfalfa–grass sward to the application of gypsum and PK fertilizers clearly indicated the shortage of three nutrients, i.e., K, P, and S. The question is as follows: to what extent does the content of available soil nutrients limit the productivity of N taken up/fixed by alfalfa? The N content in the sward of the alfalfa is considered the basic indicator of the dynamics of the growth and yield of this plant [53]. The main primary source of N for alfalfa is atmospheric N. At the beginning of flowering, N2 fixation accounts for 84–92% of the total N in the sward [54,55]. The obtained results showed that the content of N and the SPAD index, determined during the full-budding stage of alfalfa growth, had no or only a poor relationship with the yield of the analogous cuts of the sward. Moreover, the N content in the sward of the third cut (N3) was in excess in relation to the yield obtained. At the same time, it was noted that the TY was limited by N deficiency in the first and second cuts. The discrepancies between well-N-nourished plants in successive cuts of the sward and its shortage (taking into account the TY) suggest a reduction in the supply of other nutrients, with the plant balancing N use.
The most important nutrient determining the productivity of N was P. Its content over the subsequent cuts of the alfalfa–grass sward was not at all or only weakly related to the analogous yield. Moreover, it was the only nutrient that significantly reduced the TY throughout the entire growing season. It can be concluded that there was a shortage in the P content, regardless of the analogous cut of the sward. This conclusion is unexpected because the content of available P in the soil was good (high). In addition, 60 kg P2O5 ha−1 was applied each year at the onset of the growing season. The highest predictive value was related to the content of P in the first cut. The obtained model may partly explain the limitation in N productivity and thus the TY. The key importance of the P supply status for alfalfa growth and yield was highlighted by its ratio to both N and S. P deficiency in the first cut of the sward (but especially in the third one) led to the extension of the N:P ratio, which, as a consequence, reduced the TY. The obtained dependence is in line with the general rule indicating that each extension of the N:P ratio in terrestrial plants beyond the optimal range leads to a decrease in its biomass [56]. In the studied case, the critical N:P value for the maximum yield of the sward was 3.5:1. This negative impact of P on the TY was further strengthened by the P:S ratio in the third cut of the sward, which also caused a decrease in the TY. The deficiency of S in this particular cut caused the N:S ratio widening, which caused a TY decrease. However, Y3 (Equations (1), (6), and (7)) was even more strongly affected. It should be clearly emphasized that both Y3 and the TY were at maximum when the P:S and N:S ratios in the third cut were the narrowest. This condition was met in the second main season of alfalfa–grass sward use on the main plot fertilized with gypsum.
4.2. Nutrient Accumulation in the Sward and productivity
The mass of nutrients in the alfalfa–grass mixture significantly affected the sward yields of the successive cuts. The highest correlations with yield were obtained for C and P, clearly emphasizing a balance between the supply of both nutrients and the biomass produced by plants within a given vegetation period. This strong balance was also maintained for N and S, but only for the third cut. The close relationship between the amount of a given nutrient in the biomass of the examined sward and its yield indicates a well-established balance between the supply of a given nutrient and sward production.
It this study, the significant dependence of the TY of alfalfa–grass sward on the total amount of accumulated N (TN) was assumed. A strong relationship has been documented between the TN in shoots and the amount of N2 fixed by a legume crop during growing season [53,57]. In light of the conducted study, at least four aspects of TN and TY variability are important. The first is the strong year-to-year variability in TN, reaching its greatest values in the second main season of sward use. The second is the amount of N accumulated in the alfalfa–grass sward on the AC plot. This experimental trait has been treated as the main driving force for both N accumulation and the sward yield. In the second season, the TN on the AC plot increased by 46% (353 vs. 242 kg N ha−1) when related to the first season. According to Anglade et al. [53], N2 fixed by legumes accounts for 75–80% of its total amount in aboveground biomass. Thus, in the second season, the amount of the fixed N2 ranged from 265 to 282 kg N ha−1. The lower values in the third season also directly indicate a significant decrease in N2 fixation, which, in turn, caused a TY reduction. The phenomenon of alfalfa stand aging, as discussed earlier, can also be regarded through the seasonality of the alfalfa’s potential to fix N2 from the atmosphere. The third aspect of the discussion on N management in the alfalfa–grass mixture concerns the effect of the studied factors on TN. The annually repeated application of gypsum caused a significant increase in TN over successive seasons of sward use. However, it indicated a downward trend from the first season, when it was the highest compared to the gypsum control. The fourth discussed aspect is related to P. First, its accumulation in the examined sward was significantly associated with TN and was even slightly better associated with the TY (r = 0.92 vs. r = 0.97, respectively), indirectly highlighting its shortage. The recovery of P from the applied fertilizer was only 23% on the plot without K fertilizer, while it increased to 94% on the plot with 120 kg K2O ha−1. These four points explain and, at the same time, emphasize the impact of P on both the amount of fixed N2 and its subsequent utilization by alfalfa, which took place throughout the whole period of sward use.
The above considerations do not mean that the accumulation of nutrients in the individual cuts of the alfalfa–grass sward had a direct impact on the TY. The key TY predictors were found in two traits of the alfalfa−grass sward: the amount of P and S in the third cut (Equation (8)). Moreover, both characteristics were responsible for excess N and, as a consequence, limited both the sward yield of the third cut and the TY. However, at the same time, the unit productivity of S accelerated the productivity of N. The main reason for these dependencies was the shortage of S supply to the plants, which limited the effect of P and thus the efficiency of N utilization by alfalfa. The total amount of S accumulated in the sward (TS) significantly based on the interaction of the applied gypsum and PK. The effect of both factors caused an almost two-fold increase in the amount of accumulated S in the alfalfa–grass sward, as compared to the AC plot. The applied gypsum, as a carrier of S, at the rate of 2.0 t ha−1 throughout the entire period of sward use, was probably too low to meet the requirements of this intensively managed sward. As a result of the deficiency of both P and S, the amount of N in the sward was not transformed into yield. The obtained results clearly confirm the sensitivity of alfalfa to the supply of P, which results from the basic P functions in legume plants [58]. Therefore, the correct pro-productive dose of P fertilizer applied at the beginning of each growing season should be much higher than in the discussed experiment. In China, for example, the optimal P dose applied yearly to alfalfa is in the range from 120 to 150 kg P ha−1 [57]. The obtained results indicate alfalfa as an important element in the sustainable management of N on a farm [3,58].
5. Conclusions
The total yield of the alfalfa–grass mixture is based on the studied factors and not on the interaction between them. At the same time, the yields of the successive cuts of the swards were influenced by experimental factors. The interaction of gypsum and PK fertilizers had a significant impact on the yields of the first and third cut of the sward. The effect of gypsum progressed with increasing PK dose. The yields of the second cut were determined by the PK dose, reaching the highest value in the second main year of sward use. The total yield based on the amount of N accumulated in the sward, being, however, limited by N unit productivity. The main reason for the inefficient utilization of N by the plants grown in the alfalfa–grass mixture was a deficiency in P and S in the sward. The content of P in successive cuts of the alfalfa–grass mixture turned out to be the basic nutritional factor limiting the total yield of the sward. Its highest predictive value was related to its content in the first cut of the sward. A deficiency in P, leading to an extension of the N:P ratio, in turn, caused a decrease in the productivity of N utilization by the alfalfa–grass mixture. A secondary factor that, in fact, reinforced the inefficiency of N due to P deficiency was S. Its deficiency in the sward had a negative impact on P and was most visible in the third cut, leading to a widening of the P:S ratio. The general conclusion of the study is clear. The cultivation of alfalfa with grass as a primary N source on soils naturally poor or depleted in available cations requires their balanced supplementation. Moreover, this study clearly emphasized the fact that the effective use of N2 fixed by alfalfa in the legume–grass mixture requires the optimal level of fertilization using this nutrient, despite the optimal content of soil available P. In soil that is poor in available S, the farmer cannot neglect its supply through fertilizer.
Supplementary Materials
The following supporting information can be downloaded at https://www.mdpi.com/article/10.3390/agronomy13071765/s1: Figure S1: Effect of gypsum and phosphorus/potassium rates in consecutive seasons of the sward use on the content of nitrogen in the third cut of the alfalfa–grass mixture; Figure S2: Effect of gypsum and phosphorus/potassium rates in consecutive seasons of the sward use on the content of nitrogen in the first cut of the alfalfa–grass mixture; Figure S3: Effect of gypsum and phosphorus/potassium rates in consecutive seasons of the sward use on SPAD indices in the first cut of the alfalfa–grass mixture; Figure S4: Effect of gypsum and phosphorus/potassium rates in consecutive seasons of the sward use on the content of carbon in the first cut of the alfalfa mixture; Figure S5: Effect of gypsum and phosphorus/potassium rates in consecutive seasons of the sward use on the N:S ratio in the third cut of the alfalfa–grass mixture; Figure S6: Effect of gypsum and phosphorus/potassium rates in consecutive seasons of the sward use on the sulfur accumulation in the third cut of the alfalfa–grass mixture; Figure S7: Effect of gypsum and phosphorus/potassium rates on the total sulfur accumulation by the alfalfa–grass sward; Figure S8: Effect of gypsum and phosphorus/potassium rates on the total sulfur accumulation by the alfalfa–grass sward. a Similar letters indicate a lack of significant differences using Tukey’s’ test. The vertical bar in the column refers to the standard error of the mean; Table S1: Correlation matrix of yields of the sward of the of alfalfa–grass mixture and nitrogen indices; Table S2: Nutrients content in the consecutive cuts of the sward of the mixture of alfalfa–grass and yields; Table S3: Correlation matrix of ratios between analogous pairs of nutrients and yields in successive cuts of the alfalfa–grass sward; Table S4: Correlation matrix between the amount of nutrients in the sward of the mixture of alfalfa–grass and yields; Table S5: Correlation matrix between the total amount of and nutrients in the sward of the mixture of alfalfa–grass and indices of nutrient unit productivity and yields.
Author Contributions
Conceptualization, W.Z. and W.G.; methodology, W.Z. and W.G.; software, K.P.-C.; validation, W.Z. and P.G.; formal analysis, W.Z.; investigation, W.Z., K.P.-C. and P.G.; resources, W.Z.; data curation, K.P.-C.; writing—original draft preparation, W.Z.; writing—review and editing, W.G.; visualization, K.P.-C.; supervision, P.G.; project administration, K.P.-C. All authors have read and agreed to the published version of the manuscript.
Funding
Publication was co-financed within the framework of the Polish Ministry of Science and Higher Education’s program: “Regional Excellence Initiative” in the years 2019–2023 (No. 005/RID/2018/19), financing amount 12 000 000,00 PLN.
Institutional Review Board Statement
Not applicable.
Informed Consent Statement
Not applicable.
Data Availability Statement
Not applicable.
Conflicts of Interest
The authors declare no conflict of interest.
Appendix A

Figure A1.
Effect of gypsum and phosphorus/potassium rates on the content of phosphorus in the first cut of the alfalfa mixture. Labeling with the same letters indicates a lack of significant differences between experimental treatments using Tukey’s test. The vertical bar in the column is the standard error of the mean; (*I) main seasons of sward use.

Figure A2.
Effect of gypsum and phosphorus/potassium rates on the N:P ratio in the first cut (Y1) of the alfalfa–grass sward. Labeling with the same letters indicates a lack of significant differences between experimental treatments using Tukey’s test. The vertical bar in the column is the standard error of the mean.

Figure A3.
Effect of gypsum and phosphorus/potassium rates in the subsequent years of sward use on nitrogen unit productivity. Labeling with the same letters indicates a lack of significant differences between experimental treatments using Tukey’s test. The vertical bar in the column is the standard error of the mean; (*I) main seasons of sward use.
References
- McDonald, I.; Baral, R.; Min, D. Effects of alfalfa and alfalfa-grass mixtures with nitrogen fertilization on dry matter yield and forage nutritive value. J. Anim. Sci. Technol. 2021, 63, 305–318. [Google Scholar] [CrossRef] [PubMed]
- Peoples, M.B. Legumes root nitrogen in cropping system nitrogen cycling. Grain Legume 2001, 33, 8–9. [Google Scholar]
- Grzebisz, W.; Niewiadomska, A.; Przygocka-Cyna, K. Nitrogen hotspots on the farm—A practice-oriented approach. Agronomy 2022, 12, 1305. [Google Scholar] [CrossRef]
- Bork, E.W.; Gabruck, D.T.; McLeod, E.M.; Hall, L.M. Five-Year Forage Dynamics Arising from Four Legume–Grass Seed Mixes. Agron. J. 2017, 109, 2789–2799. [Google Scholar] [CrossRef]
- Fustec, J.; Lesuffleur, F.; Mahieu, S.; Cliquet, J.B. Nitrogen rhizodeposition of legumes. A review. Agron. Sustain. Dev. 2010, 30, 57–66. [Google Scholar] [CrossRef]
- Julier, B.; Gastal, F.; Louran, G.; Badenhausser, I.; Annichiarico, P.; Crocq, G.; Le Chaterlier, D.; Guillemot, E.; Emile, J.-C. Lucerne (alfalfa) in European Cropping Systems. In Legumes in Cropping Systems; Murphy-Bokern, D., Stoddard, F.L., Watson, C.A., Eds.; CPI Group (UK) Ltd.: Croydon, UK, 2017; pp. 168–192. [Google Scholar]
- Ojeda, J.J.; Caviglia, O.P.; Agnusdei, M.G.; Errecart, P.M. Forage yield, water-and solar radiation-productivities of perennial pastures and annual crops sequences in the south-eastern Pampas of Argentina. Field Crops Res. 2018, 221, 19–31. [Google Scholar] [CrossRef]
- Gierus, M.; Kleen, J.; Loges, R.; Taube, F. Forage legume species determine the nutritional quality of binary mixtures with perennial ryegrass in the first production year. Anim. Feed Sci. Technol. 2012, 172, 150–161. [Google Scholar] [CrossRef]
- Aponte, A.; Samarappuli, D.; Berti, M.T. Alfalfa–Grass Mixtures in Comparison to Grass and Alfalfa Monocultures. Agron. J. 2019, 111, 628–638. [Google Scholar] [CrossRef]
- Peeters, A.; Parente, G.; Le Gall, A. Temperate Legumes: Key-Species for Sustainable Temperate Mixtures. In Sustainable Grassland Productivity; Grassland Science in Europe; Artes Gráficas Marcipa: Badajoz, Spain, 2006. [Google Scholar]
- Harasim, J. Wpływ ilości wysiewu i doboru gatunków traw na produkcyjność mieszanek pastwiskowych z koniczyną białą na gruntach ornych. Pam. Puł. 2001, 126, 53–80. [Google Scholar]
- Gaweł, E. Ocena przydatności mieszanek lucerny z trawami do użytkowania pastwiskowego. Cz. I. Plonowanie i skład botaniczny. Pam. Puł. 2000, 121, 67–82. [Google Scholar]
- Hakl, J.; Fuksa, P.; Šantrůček, J.; Mášková, K. The development of lucerne root morphology traits under high initial stand density within a seven year period. Plant. Soil Environ. 2011, 57, 81–87. [Google Scholar] [CrossRef]
- Finn, J.A.; Kirwan, L.; Connolly, J.; Sebastià, M.T.; Helgadottir, A.; Baadshaug, O.H.; Bélanger, G.; Black, A.; Brophy, C.; Collins, R.P. Ecosystem function enhanced by combining four functional types of plant species in intensively managed grassland mixtures: A 3-year continental-scale field experiment. J. Appl. Ecol. 2013, 50, 365–375. [Google Scholar] [CrossRef]
- Bałuch, A.; Benedycki, S. Wpływ mieszanek motylkowato-trawiastych i nawożenia mineralnego na żyzność gleby. Ann. UMCS Sec. E 2004, 59, 441–448. [Google Scholar]
- Grzebisz, W.; Łukowiak, R. Nitrogen gap amelioration is a core for sustainable intensification of agriculture—A concept. Agronomy 2021, 11, 419. [Google Scholar] [CrossRef]
- Rice, W.A.; Penney, D.C.; Nyborg, M. Effect of soil acidity on rhizobia numbers, nodulation and nitrogen fixation by alfalfa and red clover. Can. J. Soil Sci. 1977, 57, 197–203. [Google Scholar] [CrossRef]
- Graham, P.H. Stress tolerance in Rhizobium and Bradyrhizobium, and nodulation under adverse soil conditions. Can. J. Microbiol. 1992, 38, 475–484. [Google Scholar] [CrossRef]
- Hájek, M.; Jiménez-Alfaro, B.; Hájek, O.; Brancaleoni, L.; Cantonati, M.; Carbognani, M.; Dedić, A.; Dítě, D.; Gerdol, R.; Hájková, P.; et al. A European map of groundwater pH and calcium. Earth Syst. Sci. Data 2021, 13, 1089–1105. [Google Scholar] [CrossRef]
- Granqvist, E.; Sun, J.; Op den camp, R.; Pujic, P.; Hill, L.; Normand, P.; Morris, R.J.; Downie, J.A.; Geurts, R.; Oldroyd, G.E.D. Bacterial-induced calcium oscillations are common to nitrogen-fixing associations of nodulating legumes and nonlegumes. New Phytol. 2015, 207, 551–558. [Google Scholar] [CrossRef] [PubMed]
- Thor, K. Calcium–Nutrient and messenger. Front. Plant Sci. 2019, 10, 440. [Google Scholar] [CrossRef]
- Lu, Y. Assembly and transfer of iron-sulfur clusters in the plastid. Front. Plant Sci. 2018, 9, 336. [Google Scholar] [CrossRef]
- Jamal, A.; Moon, Y.-S.; Abdin, M.Z. Sulphur—A general overview and interaction with nitrogen. Aust. J. Crop Sci. 2010, 4, 523–529. [Google Scholar]
- Maruyama-Nakashita, A.; Nakamura, Y.; Yamaya, T.; Takahashi, H. Regulation of high-affinity sulphate transporters in plants: Towards systematic analysis of Sulphur signalling and regulation. J. Exp. Bot. 2004, 55, 1843–1849. [Google Scholar] [CrossRef]
- Takahashi, H. Sulfate transport systems in plant: Functional diversity and molecular mechanisms underlying regulatory coordination. J. Exp. Bot. 2019, 70, 4075–4087. [Google Scholar] [CrossRef] [PubMed]
- Chen, L.; Dick, W.A. Gypsum as an agricultural amendment: General use guidelines. Bull. Ohio State Univ. 2011, 945, 36. [Google Scholar]
- Grzebisz, W.; Zielewicz, W.; Przygocka-Cyna, K. Deficiencies of secondary nutrients in crop plants—A real challenge to improve nitrogen management. Agronomy 2023, 13, 66. [Google Scholar] [CrossRef]
- Berg, W.K.; Cunningham, S.M.; Brouder, S.M.; Joern, B.C.; Johnson, K.D.; Santini, J.; Volenec, J.J. The long-term impact of phosphorus and potassium fertilization on alfalfa yield and yield components. Crop Sci. 2007, 47, 2198–2209. [Google Scholar] [CrossRef]
- Islam, M.A.; Baidoo, M.M. Effect of Potassium in Growth and Physiology of Alfalfa. In Handbook of Plant and Crop Physiology; Pessarakli, M., Ed.; CRC Press: London, UK, 2021; pp. 29–39. [Google Scholar]
- Macolino, S.; Lauriault, L.M.; Rimi, F.; Ziliotto, U. Phosphorus and potassium fertilizer effect on alfalfa and soil in non-limited soil. Agron. J. 2013, 105, 1613–1618. [Google Scholar] [CrossRef]
- Druille, M.; Deregibus, V.; Garbulsky, M.F. Environmental controls of Lucerne (Medicago sativa L.) growth across a climatic and edaphic gradient. Agriscientia 2017, 34, 2–13. [Google Scholar] [CrossRef]
- Wu, L.; Baddeley, J.; Watson, C. Models of biological fixation of legumes. A review. Agron. Sustain. Dev. 2011, 31, 155–172. [Google Scholar] [CrossRef]
- Ballabio, C.; Lugato, E.; Fernández-Ugalde, O.; Orgiazzi, A.; Jones, A.; Borelli, P.; Montanarella, L.; Panagos, P. Mapping LUCAS topsoil chemical properties at European scale using Gaussian process regression. Geoderma 2019, 355, 113912. [Google Scholar] [CrossRef]
- Zbíral, J.; Smatanová, M.; Němec, P. Sulphur status in agricultural soil determined using the Mehlich 3 method. Plant Soil Environ. 2018, 64, 255–259. [Google Scholar] [CrossRef]
- Panagos, P.; Köninger, J.; Ballabio, C.; Liakos, L.; Muntwyler, A.; Borelli, P.; Lugato, E. Improving the phosphorus budget of European agricultural soils. Sci. Total Environ. 2022, 853, 158706. [Google Scholar] [CrossRef] [PubMed]
- Pang, J.; Ryan, M.H.; Lambers, H.; Siddique, K.H.M. Phosphorus acquisition and utilization in crop legumes under global change. Curr. Opin. Plant Biol. 2018, 45, 248–254. [Google Scholar] [CrossRef]
- Zörb, C.; Senbayram, M.; Peiter, E. Potassium in agriculture—Status and perspectives. J. Plant Physiol. 2014, 171, 656–669. [Google Scholar] [CrossRef]
- Jungers, J.M.; Kaiser, D.E.; Lamb, J.F.S.; Lamb, J.A.; Noland, R.L.; Samac, D.A.; Wells, M.S.; Sheaffer, C.C. Potassium fertilization affects alfalfa forage yield, nutritive value, root traits, and persistence. Agron. J. 2019, 111, 2843–2852. [Google Scholar] [CrossRef]
- Zielewicz, W.; Swędrzyńska, D.; Swędrzyński, A.; Grzebisz, W.; Goliński, P. The Influence of Calcium Sulfate and Different Doses of Potassium on the Soil Enzyme Activity and the Yield of the Sward with a Mixture of Alfalfa and Grasses. Agriculture 2022, 12, 475. [Google Scholar] [CrossRef]
- Tirado-Corbalá, R.; Slater, B.K.; Dick, W.A.; Barker, D. Alfalfa responses to gypsum application measured using undisturbed soil columns. Plants 2017, 6, 29. [Google Scholar] [CrossRef] [PubMed]
- Kabała, C.; Charzyński, P.; Chodorowski, J.; Drewnik, M.; Glina, B.; Greinert, A.; Hulisz, P.; Jaknkowski, M.; Jonczak, J.; Łabaz, B.; et al. Polish Soil Classification: Principles, classification scheme and correlation. Soil Sci. Annu. 2019, 70, 71–97. [Google Scholar] [CrossRef]
- Mehlich, A. Mehlich 3 soil test extractant: A modification of Mehlich 2 extractant. Com. Soil Sci. Plant Anal. 1984, 15, 1409–1416. [Google Scholar] [CrossRef]
- Kęsik, K. Application of the Mehlich 3 method in the fertilizer advisory system. Stud. I Rap. IUNG-PIB 2016, 48, 95–104. (In Polish) [Google Scholar]
- Trávník, K.; Zbíral, J.; Němec, P. Agrochemical Soil Testing—Mehlich III; Central Institute for Supervising and Testing in Agriculture: Brno, Czech Republic, 1999; 101p. (In Czech) [Google Scholar]
- Porqueddu, C.; Meliss, R.A.M. Lucerne Crop in Drought-Prone Environment; CNR-SSPAAM: Portici, Italy, 2017; 17p. [Google Scholar]
- Bavec, F.; Bavec, M. Chlorophyll meter readings of winter wheat cultivars and grain yield prediction. Commun. Soil Sci. Plant Anal. 2022, 32, 2709–2719. [Google Scholar] [CrossRef]
- PN-EN ISO 20483:2014-02; Cereal Grains and Pulses—Determination of Nitrogen Content and Conversion to Crude Proteins—Kjeldahl Method. Polski Komitet Normalizacyjny: Warsaw, Poland, 2015; 24p.
- Gaweł, E.; Madej, A. Yield and economic assessment of the legume-grass mixtures depending on the system and frequency of their utilization and botanical composition. Acta Sci. Pol. Agric. 2008, 7, 53–63. [Google Scholar]
- Zoghlami, A. Preliminary results on the effect of seeding methods on production and botanical composition of perennial mixtures of alfalfa-grasses. In Legumes for Mediterranean Forage Crops, Pastures and Alternative Uses; Sulas, L., Ed.; Cahiers Options Méditerranéennes: Sassari, Italy, 2000; pp. 203–206. [Google Scholar]
- Vasileva, V.; Kostov, O. Effect of alfalfa grown for forage on soil fertility related to mineral and organic fertilization. Emir. J. Food Agric. 2015, 27, 678–686. [Google Scholar] [CrossRef]
- Coruh, I.; Tan, M. Lucerne persistence, yield and quality as influenced by stand aging. N. Z. J. Agric. Res. 2008, 51, 39–43. [Google Scholar] [CrossRef]
- Patel, P.C.; Kotecha, A.V. Effect of phosphorus and potassium on growth characters, forage yield, nutrient uptake and quality of lucerne (Medicago sativa L.). Indian J. Agron. 2006, 51, 242–244. [Google Scholar]
- Anglade, J.; Billen, G.; Garnier, J. Relationships for estimating N2 fixation in legumes: Incidence for N balance of legume-based cropping systems in Europe. Ecosphere 2015, 6, 1–24. [Google Scholar] [CrossRef]
- Wysokiński, A.; Kalmebasa, S.; Łozak, I. Dynamics of nitrogen accumulation from various sources of by Lucerne (Medicago sativa L.). Acta Sci. Oil. Agric. 2015, 14, 97–105. [Google Scholar]
- Issach, G.; Schoenau, J.J.; Lardner, H.A.; Knight, J.D. Nitrogen fixation and resource partitioning in alfalfa (Medicago sativa L.), cicer milkvetch (Astragalus cicer L.) and sainfoin (Onobrychis viciifolia Scop.) using 15N enrichment under controlled environment conditions. Agronomy 2020, 10, 1438. [Google Scholar] [CrossRef]
- Güsewell, S. N: P ratios in terrestrial plants: Variation and functional significance. New Phytol. 2004, 164, 243–266. [Google Scholar] [CrossRef]
- Wan, W.; Li, Y.; Li, H. Yield and quality of alfalfa (Medicago sativa L.) in response to fertilizer application in China: A meta-analysis. Front. Plant Sci 2022, 13, 1051725. [Google Scholar] [CrossRef]
- Barłóg, P.; Grzebisz, W.; Łukowiak, R. Fertilizers and fertilization strategies mitigating soil factors constraining efficiency of nitrogen in plant production. Plants 2022, 11, 1855. [Google Scholar] [CrossRef] [PubMed]
Disclaimer/Publisher’s Note: The statements, opinions and data contained in all publications are solely those of the individual author(s) and contributor(s) and not of MDPI and/or the editor(s). MDPI and/or the editor(s) disclaim responsibility for any injury to people or property resulting from any ideas, methods, instructions or products referred to in the content. |
© 2023 by the authors. Licensee MDPI, Basel, Switzerland. This article is an open access article distributed under the terms and conditions of the Creative Commons Attribution (CC BY) license (https://creativecommons.org/licenses/by/4.0/).