Abstract
Potato canopy nitrogen content (CNC) is an imperative metric for assessing potato growth status and guiding field management. While the spectral index can be utilized to estimate CNC, its efficacy is influenced by the environment and crop type. To address this issue, we utilized hyperspectral indices (HIs) optimization for CNC estimation. Using the inverse and first-order differential (FD) transformations of the original data (OD), HIs comprising two-band combinations in 400–1000 nm, such as RSI, DSI, NDSI, SASI, and PSI, were constructed to analyze the correlation between CNC and HIs. Based on this analysis, prediction models for potato CNC were created using the most optimal HIs. The results showed that FD transformation significantly improved the correlations between CNC and HIs, among which FD−PSI(R654, R565) had the highest correlation with CNC. We further employed the optimal HIs as variables to establish univariate and multivariate regression models to estimate the potato CNC. Among the univariate models, the accuracy of the OD−DSI model was the highest, with an R2 of 0.79 and RMSE of 0.22. Meanwhile, the FD−MLR model demonstrated the highest accuracy compared to the other multivariate models, with an R2 of 0.84, an RMSE of 0.20 during validation, and a greater prediction accuracy than the OD−DSI model. FD−MLR can be used to map the CNC distribution map of monitored potato planting plots to guide precision fertilization.
1. Introduction
The potato ranks as the world’s fourth-largest food crop [1]. China leads the world in potato cultivation and production and is an essential player in the global potato industry [2]. Potato production plays a crucial role in ensuring China’s food security. Nitrogen represents the most critical limiting factor for achieving optimum potato growth. A deficiency of nitrogen during growth negatively affects yield and quality. Overuse of nitrogen fertilizer raises expenses and leads to environmental pollution of the air and water [3,4]. Therefore, accessing the nitrogen status of potatoes non-destructively, rapidly, and accurately in the field and optimizing nitrogen fertilizer management on farms are crucial in achieving sustained high potato yields and environmental protection in China.
Recently, hyperspectral remote sensing technology has experienced rapid development and found extensive applications in agriculture. Hyperspectral remote sensing technology is a cost-effective method of collecting crop information [5]. Satellite remote sensing, aerial remote sensing, unmanned aerial vehicles (UAV), and ground close-range remote sensing represent the primary ways of obtaining hyperspectral remote sensing data [6]. Although satellite remote sensing provides large-scale spatial data, the resolution of satellite imagery is typically limited which results in low-quality images. Furthermore, weather conditions can influence satellite remote sensing [7]. Cloud cover can affect image quality and availability, which limits its application in fine-scale agriculture [8,9]. Although ground-close range remote sensing can obtain remote-sensing images with high resolution, it can only carry out ‘point’ scale research and cannot carry out large-scale monitoring of crops [10]. In contrast, remote-sensing images with high spatial and temporal resolution can be obtained using UAV, which can achieve ‘surface’ scale inversion research. In recent years, it has been widely used in precision agriculture. Providing detailed agricultural information for optimizing field practices helps reduce both costs and environmental impacts [11,12].
Vegetation indices based on spectral reflectance from crop canopies have been proposed and are widely used for nitrogen content monitoring in crops [13,14,15]. With the development of hyperspectral techniques, its hundreds or thousands of narrow bands provide conditions for exploring more suitable vegetation indices [16,17]. Liang [18] analyzed wheat’s 350–2500 nm canopy reflectance. The results showed that the first derivative normalized difference spectral indices and the first derivative ratio spectral index were the best spectral indices for estimating the nitrogen content of wheat leaves. Chen [19] established a model for leaf nitrogen estimation based on sensitive spectral bands and spectral indices for leaf nitrogen content by studying the spectral information of cotton leaf nitrogen content. Their results showed that the accuracy of the leaf nitrogen estimation model using spectral indices was reduced compared with that established by sensitive bands, but the stability of the model was greatly improved. Raj [20] obtained pure pixel spectral data of maize canopy using an SVC GER1500 handheld spectrometer to build a spectral index for predicting maize nitrogen content. The prediction model was then applied to data acquired via UAV hyperspectral imaging, revealing that the spectral index of the red edge region was more sensitive to maize canopy nitrogen content. Qi [21] established a method for estimating the chlorophyll content of peanut plants under different planting densities based on normalized difference spectral index (NDSI), ratio spectral index (RSI), differential spectral index (DSI), and soil-adjusted spectral index (SASI). These studies demonstrate that the vegetation index (VI) method is useful for predicting canopy nitrogen content (CNC) in winter wheat, cotton, and maize. However, the canopy spectral reflectance of crops is determined via both the optical properties of the leaves and the surrounding environment [22,23]. There are significant differences in the morphological structure of potato plants compared to the crops mentioned above, as well as variations in the selection and preparation of cultivation environments [24]. Potato planting should choose a deep soil layer, loose and fertile soil, good drainage and irrigation, and a neutral or acidic sandy texture. Before planting, it is necessary to plow the land, rake the land, ridge, and finally suppress it to reach the sowing state. As a result, CNC monitoring results from other crops cannot be directly applied to potato crops.
In recent years, hyperspectral remote-sensing technology has been the focus of many scholars in their study of potato biomass, CNC, chlorophyll content, and leaf area index, which has yielded specific outcomes [25,26]. In Li’s [5] study, a UAV hyperspectral camera was utilized to capture potato canopy spectral images, and partial least squares regression and random forest regression methods were employed to create an aboveground biomass estimation model for potato crops. The results indicate that the partial least squares regression model built from full-band spectral information demonstrates strong performance. Zhou [27] evaluated the effectiveness of hyperspectral and multispectral images in estimating potato CNC and found that the use of hyperspectral images yielded superior results to multispectral images, with the visible (400–700 nm) band demonstrating the highest correlation with potato CNC. Li [28] developed a model for estimating potato chlorophyll content by utilizing hyperspectral images of the potato canopy. Normalized difference vegetation index (NDVI), ratio vegetation index (RVI), and difference vegetation index (DVI) were combined in the model to effectively invert the chlorophyll content estimation for the potato. Meanwhile, Luo [29] employed the NDVI, RVI, DVI, green normalized difference vegetation index (GNDVI), enhanced vegetation index (EVI), and spectral parameters procured via the continuum removal method to estimate the potato leaf area index. The two inversion methods were compared, and the accuracy rate of each method was evaluated. The results showed that the spectral parameters obtained using the continuum removal method could accurately invert the potato leaf area index. Overall, these findings provide valuable reference and application value for potato CNC estimation. However, most of the studies are based on specific potato plots, and some of the hyperspectral image acquisition was conducted under laboratory conditions, with little research conducted on field-grown potatoes.
Over-reliance on chemical fertilizers and irrational use of fertilizers is very common in China’s potato production. In 2015, the fertilizer utilization rate for China’s grain crops was 35.2%, while the United States had a nitrogen fertilizer utilization rate of about 50% and major European countries had a utilization rate of roughly 65% for grain crops [30], both of which are significantly higher than China. Efficient fertilizer use in Chinese potato farming faces challenges that necessitate the implementation of scientific and technological innovations of tools that could enhance fertilizer efficiency and decrease fertilizer usage to support sustainable development in the industry. Gansu Province, a major producer of high-quality commercial potatoes, detoxified seed potatoes, and processed potatoes, serves as a crucial production base in China’s potato industry. The province has a perennial planting area of 667,000 hectares, generating an annual yield of over 15 million tons of fresh potatoes. Therefore, we conducted our research on field-grown potato crops in Wuwei City, Gansu Province, China. The image data collected via a UAV equipped with hyperspectral imaging technology was used to construct two-band hyperspectral indices (HIs) with the band combination optimization method adopting all possible combinations of different spectral types, including the original spectrum, reciprocal, and first-order differential. In order to estimate potato CNC, we adopted univariate linear regression (ULR) and multivariate regression to develop the prediction models. The latter includes partial least squares regression (PLSR) and multiple linear regression (MLR). We compared the prediction accuracy of different models and obtained the best prediction model. The utilization of UAV and hyperspectral imaging technology enables us to obtain the distribution information of potato CNC in the field quickly and accurately, leading to precise fertilization and reducing the amount of applied chemical fertilizer.
2. Materials and Methods
2.1. Overview of the Study Area
The study area is located at (37°81′49′′ N, 102°92′38′′ E), within Wuwei City, Gansu Province (Figure 1. Geographical location and sampling area delineation of the study. (a) Location of study area; (b) Area 1 is for modeling data, and Area 2 is for validation samples.). The average annual temperature, precipitation, and length of the frost-free period were 8 °C, 164.4 mm, and 150 days, respectively. The region is classified as an irrigated agricultural area within the desert oasis. The variety of potatoes studied was ‘Qingshu9’, a medium to late-maturing variety with a growth period spanning approximately 115 days from emergence to maturity. Experimental potatoes were planted in May of 2021 and harvested in mid-October of the same year. The planting method entailed the use of whole film mulching ridge planting with a 400 mm row spacing and a 290 mm plant spacing. The crop was drip irrigated under film, and the experiment followed local management practices. The study area was divided into two sections: Area 1 samples served as the modeling data, while Area 2 samples were used for validation. Area 1 has a total land area of approximately 2.067 hectares, whereas Area 2 covers about 1.933 hectares.
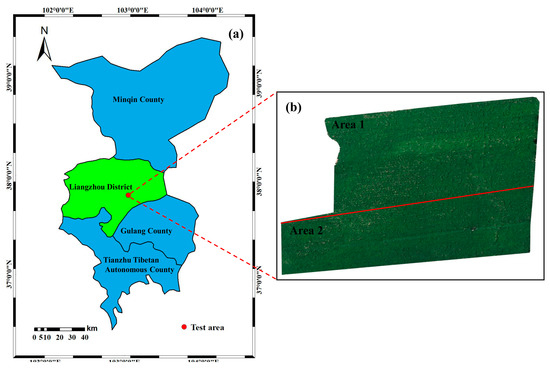
Figure 1.
Geographical location and sampling area delineation of the study. (a) Location of study area; (b) Area 1 is for modeling data, and Area 2 is for validation samples.
2.2. Data Acquisition and Preprocessing
2.2.1. Hyperspectral Image Acquisition and Preprocessing
During the potato tuber formation stage, specifically on 28 July 2021, and the tuber growth period on 19 August 2021, we collected hyperspectral images of potatoes in the test area between 11:00 and 13:00 a.m., utilizing an M600 Pro six-rotor UAV equipped with a Gaia Sky-mini 2 hyperspectral imaging spectrometer (Figure 2. Equipment for the acquisition of hyperspectral images. (a) M600 Pro six-rotor UAV; (b) Gaia Sky-mini 2 hyperspectral imaging spectrometer.). The spectral range of the Gaia Sky-mini 2 imaging spectrometer is 400–1000 nm, the spectral resolution is 3.5 nm, and the total amplitude pixels are 1392 × 1040. The flights were conducted on a day with stable sunlight intensity, clear weather, and no clouds. The UAV flight route was planned prior to capturing hyperspectral data (Figure 3. The flight path of the hyperspectral image UAV was collected.), and the two flight paths were consistent. The flight height was 100 m with a scanning field angle of 22 degrees, and a high-altitude resolution of 0.039 m. The horizontal overlap rate between each image data was 80%, and the vertical overlap rate was 60%. The SpecViewTM Version2.9.3.8 software was used for lens calibration, black-and-white frame calibration, atmospheric reflectance calibration, and spectral smoothing using the 9-point smoothing method. We then stitched the calibrated images together to obtain a complete image of the study field using HiSpectralStitcherTM 1.0.1. The ENVI 5.3 software was utilized to calculate the average spectral data of the four adjacent pixels surrounding the sample point, based on the sample point’s latitude and longitude information, which was then used as the sample point’s spectral reflectance data.
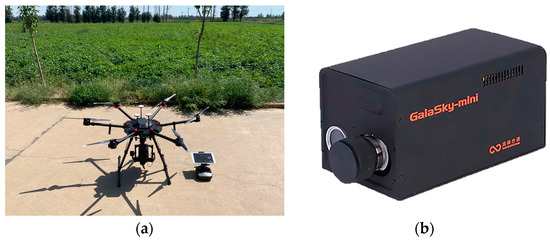
Figure 2.
Equipment for the acquisition of hyperspectral images. (a) M600 Pro six-rotor UAV; (b) Gaia Sky-mini 2 hyperspectral imaging spectrometer.
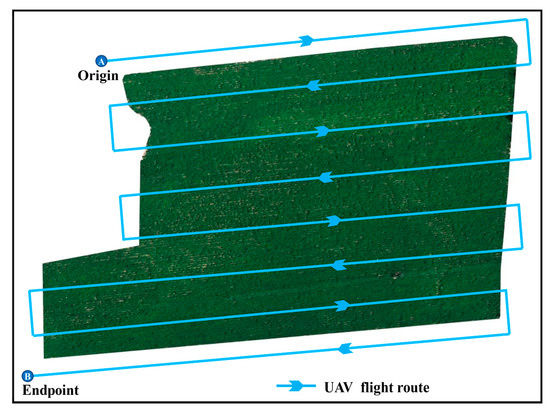
Figure 3.
The flight path of the hyperspectral image UAV was collected.
2.2.2. Measurement of CNC
The collection of potato sample leaves on the ground synchronized with the UAV operation. For each sampling point, GPS (LT500T, CHC Navigation Technology Co., Ltd. Shanghai, China) was used to record the location of the sampling point, approximately 20 fully unfolded and healthy potato leaves, free of damage, disease, and insect pests, were collected within a 0.2 m radius from the spectral measurement point. The leaves were promptly placed into zip-lock bags, labeled with the sample number, and transported back to the laboratory. In total, 74 samples were collected from Area 1, while 36 samples were collected from Area 2. The sampling position is shown in Figure 4. The leaves were weighed while fresh and then placed into kraft paper bags before being inserted into a drying oven. The leaves were deactivated at 105 °C for 30 min and further dried at 80 °C until they reached a constant weight. Potato CNC was determined using the Kjeldahl method [31].
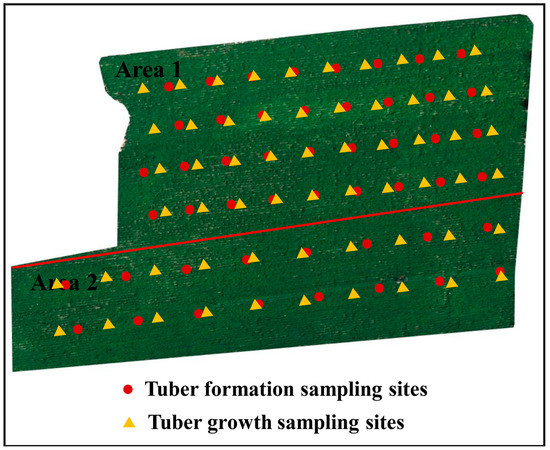
Figure 4.
The precise location of every sampling point.
2.3. Spectrum Data Processing and Index Construction
Previous studies have demonstrated that modified forms of the original spectrum, such as reciprocal transformation (RT) and first derivative (FD) processing, can effectively reduce background noise in hyperspectral data and aid in improving prediction accuracy [13,32]. In this study, we utilize OD, RT, and FD to construct HIs for estimating the CNC of potato canopy.
HIs are a combination of hyperspectral reflectance at any band according to the formula format of VI, which is used to enhance vegetation information and weaken non-vegetation information [33]. In order to study the critical vital relationship between hyperspectral image data and CNC of potatoes, this study constructed five HIs of ratio spectral index (RSI), difference spectral index (DSI), normalized difference spectral index (NDSI), soil-adjusted spectral index (SASI) and perpendicular spectral index (PSI) in the range of 400–1000 nm to estimate CNC [32,34]. We provide their respective mathematical expressions below.
where Ri and Rj represent the hyperspectral reflectance of any two bands, and i and j represent any band position in the range of 400–1000 nm.
We investigated the correlation between above indices derived from OD, RT, FD, and potato CNC, and for each index, we tried to figure out which combination of two bands correlates the most with CNC.
2.4. CNC Estimation Model and Evaluation Criteria
Following the identification of the most correlated values of each index with CNC, we utilized them to predict potato CNC by establishing prediction models using the two following methods: (1) the ULR, where each optimal HIs was taken as the dependent variable and the potato CNC as the response variable; (2) the PLSR and MLR, where we established multivariate estimation models with five optimal HIs under different transformations as independent variables and potato CNC as the response variable. PLSR incorporates principal component analysis, multiple linear regression, and canonical correlation analysis, which reduces spectral analysis dimensionality and resolves issues related to multiple correlations between sample points or variables [35]. MLR determines the regression model parameters via a linear fitting of the relationship between multiple independent variables and response variables and determines the optimal model using verification samples [36].
In this study, we utilized the coefficient of determination (R²) and Root Mean Square Error (RMSE) to evaluate the accuracy of the models and identify the optimal prediction model [37].
3. Results and Analysis
3.1. Statistical Analysis of CNC Data
We collected a total of 110 samples for this study, with 74 samples used for modeling and 36 samples for validation. The statistical distribution of the complete set, modeling set, and verification set is depicted in Figure 5. The CNC mean of the whole set is 3.961% with a standard deviation of 0.532%. Meanwhile, the modeling set has a mean of 3.957% and ranges from 2.58% to 4.85%, while the verification set has a mean of 3.900% and ranges from 2.85% to 4.71%. Both the modeling and verification sets have similar standard deviations and means compared to the complete set, indicating that the data sets have similar statistical distributions.
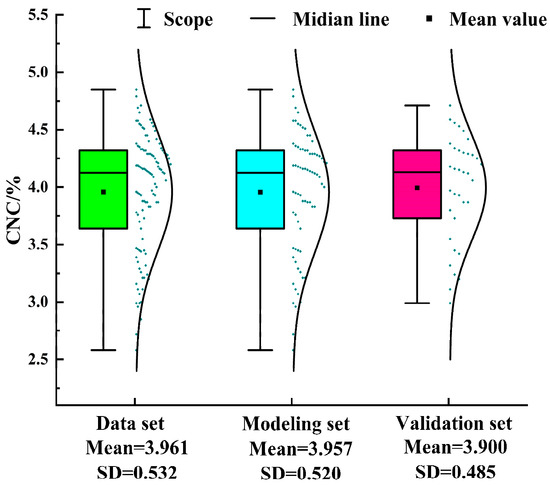
Figure 5.
Descriptive statistics of CNC samples.
3.2. Analysis of Canopy Spectral Characteristics under Different Transformations
Spectral curves obtained after OD, RT, and FD processing exhibited marked differences, as shown in Figure 6. OD reflectance spectra revealed low values in the visible range, with a significant peak in reflection at the 550 nm green band. Reflectance rose notably from 670 nm to 750 nm and remained stable between 750 nm and 900 nm in the near-infrared range, followed by a decline. RT transformations led to stark differences in spectral reflectance from 400 nm to 700 nm. Absorption valleys became more prominent near the 430 nm and 550 nm bands, while two reflection peaks appeared at 470 nm and 670 nm. Reflectivity experienced a sharp decline between 670 nm and 750 nm and then stabilized in the near-infrared range. The FD technique produced reflectance that rose sharply close to the red edge position at 650 nm and rapidly declined after reaching the maximum value near 730 nm. This criterion is also typical of the vegetation spectrum.
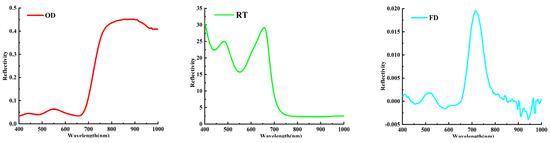
Figure 6.
Canopy spectral curves obtained under different transformations.
3.3. Correlation between CNC and HTs w.r.t Bands
Based on the potato canopy OD, RT, and FD reflectance data, according to the mathematical expression (1)–(5), the correlation coefficient (R) between CNC and the HIs of the two-band combination is calculated, and the results are shown in Figure 7. The correlations between CNC and the HIs calculated by certain combinations of two-band were significantly higher than others for all five indices. For each index computed from OD, RT, and FD, we explored the two-band combinations that had the highest correlation coefficient between 400 nm and 1000 nm wavelength. These combinations and their correlation coefficients with CNC are listed in Table 1, where all indices satisfy the significance test at the 0.01 level. One can observe that the correlations between the five vegetation indices of FD and CNC are highest overall, with OD second and RT lowest. The wavelength range of the similar species of HIs that showed the highest correlation with CNC is relatively tight, distributed in the visible range of 568–689 nm, and the correlation coefficient R is mostly distributed in the range of 0.88–0.89.
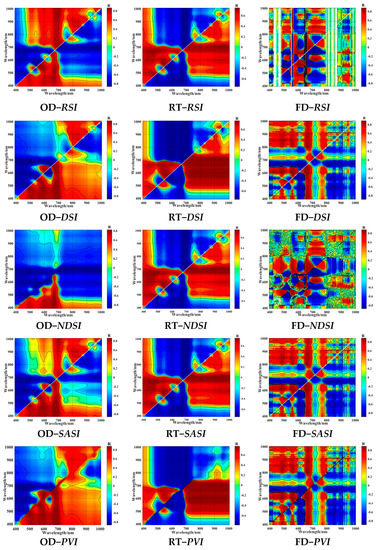
Figure 7.
Correlation between CNC and HIs w.r.t bands.

Table 1.
Correlation coefficients between CNC and HIs under different transformations.
3.4. CNC Estimation of Potatoes Based on HIs
3.4.1. Estimation of Potato CNC Using ULR Model
We developed the ULR models using where only a single optimized spectral index was used as the explanatory variable, and potato CNC was the response variable. The modeling and verification of models are shown in Table 2. In the OD spectral index models, the coefficient of determination R2 of the modeling set ranged between 0.72 and 0.77, and the RMSE was from 0.25 to 0.28. Among them, the model of OD−PSI had a maximum R2 of 0.77 and a minimum RMSE of 0.25 but with a slight accuracy reduction over the validation set. Regarding the regression models of RT spectral indices, the R2 distribution of the modeling set was between 0.55 and 0.59 and the RMSE from 0.33 to 0.35. Among these models, the RT−PSI regression model had the largest R2 of 0.59 and the smallest RMSE of 0.33. It had the highest accuracy over the verification set. As for the models of FD spectral indices, the R2 of the modeling set ranged from 0.77 to 0.79, and the RMSE from 0.24 to 0.25. The FD−PSI regression model showed the highest R2 of 0.79 and a minimum RMSE of 0.24. After comparing all 15 regression models detailed in Table 2, we found that the OD−DSI model has the smallest RMSE and highest accuracy over the validation set, and the scatter distribution was closer to the 1:1 line with a scatter slope of 0.868. Consequently, we consider the OD−DSI model as the most accurate model for potato CNC estimation among all 15 presented regression models in Table 2. Figure 8 represents scatter plots of actual versus the estimated values for both models.
Table 2.
Modeling and validation results of estimating potato CNC using ULR model.
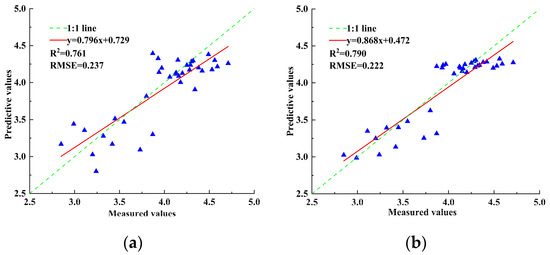
Figure 8.
Scatter plot of the actual CNC based on FD−PSI and OD−DSI model. (a) FD−PSI model; (b) OD−DSI model.
3.4.2. Estimating Potato CNC Using MLR and PLSR Models
To enhance the accuracy of potato CNC prediction using more spectral information, we further employed MLR and PLSR for modeling. For each of the models, the response variable is CNC, and the independent variables are RSI, DSI, NDSI, SASI, and PSI, which were calculated based on OD, RT, and FD. The assumption of multiple regression is that the variables must be independent of each other to maintain the regression equation’s significance while improving the goodness of fit. Multicollinearity can occur when the independent variables are linearly related, causing a significant reduction in the regression equation and a distinct difference from reality. Variance Inflation Factor (VIF) is an index used to check the same, and if a VIF greater than 10 is encountered, then collinearity exists between variables. Multicollinearity was diagnosed using the statistical software SPSS, and the analysis results are documented in Table 3. The VIF for each of the five variables was less than 10, indicating that there was no multicollinearity between the variables.
Table 3.
VIF of spectral indices.
Table 4 displays the modeling and validation results for the PLSR and MLR models. Analyzing all six models, we noticed that the FD−MLR model outperforms the other models, followed by the OD−PLSR model. Compared to the OD−PLSR model, the optimal model validation set R2 has improved by 0.04, and the RMSE has decreased by 0.04 using the FD−MLR model. Scatter plots of the measured and estimated values of the FD−MLR and OD−PLSR models are demonstrated in Figure 9. The FD−MLR model has a closer scatter to the 1:1 line, with a scatter slope of 0.916. Hence, we consider the FD−MLR model the most accurate one to predict CNC among all six models in Table 4. Comparing Figure 6 and Figure 7, we found that both the FD−MLR model and OD−PLSR models improved the validation set R2 by 0.05 and 0.01, respectively, significantly outperforming the OD−DSI model. As a result, the multivariate model successfully improved the accuracy of potato CNC estimation.
Table 4.
Modeling and validation results of estimating potato CNC using MLR and PLSR models.
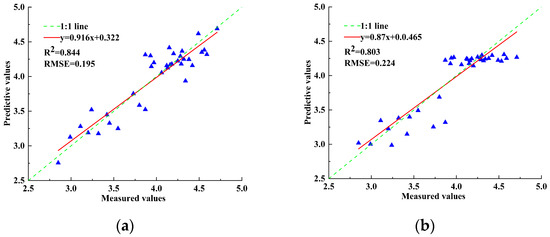
Figure 9.
Scatter plot of the actual CNC based on FD−MLR and OD−PLSR model. (a) FD−MLR model; (b) OD−PLSR model.
4. Discussion
Despite being the world’s leading potato producer, China faces several challenges in potato cultivation. Over 80% of primary production areas are located in mountainous regions, which are characterized by complex terrain, fragmented land, and relatively small cultivation areas due to the “farmer + cooperative” model. Nitrogen estimation via satellite hyperspectral data cannot guide Chinese farmers in potato fertilization management due to low resolution and excessively long revisit periods [38]. While ground-based hyperspectral analysis is highly reliable, it is difficult to achieve field-scale nitrogen monitoring. The use of UAV-based hyperspectral remote-sensing technology effectively overcomes the limitations of traditional remote sensing, providing a useful method for the precise estimation of potato CNC at a small scale. The technology offers the convenient operation, flexible monitoring times, and high observation accuracy [39,40], making it well-suited for helping Chinese farmers carry out scientific and precise fertilization, which is a crucial step in chemical fertilizer reduction in China.
The potato CNC correlation with RSI, DSI, NDSI, SASI, and PSI constructed from OD, RT, and FD was analyzed, and it was found that the HIs with a high correlation to CNC contained bands ranging from 568 nm to 689 nm, consistent with Hasituya’s findings [41]. We found that the correlation between HIs generated from RT and CNC was lower than those of OD, likely caused by the reciprocal transformation process that made the spectrum between 750 and 1000 nm stable, resulting in a loss of sensitivity in the spectral bands initially sensitive to CNC levels. Conversely, the correlation between CNC and the five HIs constructed from FD was higher than that from the OD, consistent with the research of Sishodia [11] and Zhang [14]. Thus, using FD for crop parameter estimation is viable.
After careful analysis, we can conclude that the MLR model is more accurate than the PLSR model. One of the reasons for this is that the PLSR model’s standard practice is to propose the first component in the set of independent variables and establish the regression equation between the dependent variable and the first component. If the accuracy is satisfactory, the algorithm terminates [42]. However, the PLSR model only uses five independent variables, and after performing the 0.05 level test, some information may be lost, resulting in a reduced number of selected principal components, ultimately reducing the model’s accuracy. Additionally, PLSR takes into account the multicollinearity issue among independent variables when making the model. However, the multicollinearity among RSI, DSI, NDSI, SASI, and PSI is minimal, and by using PLSR to handle it, the model’s accuracy may decrease. Multiple regression models outperform the ULR model because the ULR model incorporates minimal and incomplete information about CNC values. In contrast, the multiple regression model includes more spectral information that improves accuracy, resulting in higher accuracy than the ULR model.
We applied the FD−MLR model to estimate the distribution of CNC in the study area during the potato tuber formation and growth periods, as illustrated in Figure 10. The figure shows considerable variation in CNC distribution across the study area during a single growth period, with certain regions exhibiting lower CNC values compared to others. This information can guide us to perform precise fertilizer locally rather than on a large scale over the entire area. Furthermore, the CNC levels change over time as the potato crop undergoes growing periods, which indirectly reflects the differences in potato growth. Specifically, the CNC of potatoes during the tuber growth period is lower than that in the tuber formation period due to the rapid growth of stems, leaves, and tubers. In this period, nutrients produced by the aerial parts are transported to the tubers, leading to a decrease in CNC.
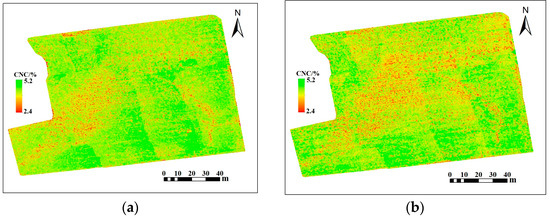
Figure 10.
CNC remote sensing mapping of potato canopy in the study area based on FD-MLR model. (a) Tuber formation period; (b) tuber growth period.
5. Conclusions
We used hyperspectral data from the UAV to calculate various vegetation indices derived from different two-band combinations. Based on this information, we constructed a model to estimate the CNC in the potato canopy and subsequently selected the optimal model to invert CNC in the study area. The primary findings are summarized as follows:
(1) Correlations exist between the CNC and 15 HIs. The five HIs constructed based on the FD transform significantly improved the correlations with CNC. Among these five HIs, FD−PSI(R592, R565) showed the highest correlation with CNC, with R = 0.89.
(2) Among the 15 HIs-based potato canopy models constructed using ULR, the OD−DSI model achieved the highest accuracy, with R2 and RMSE values of 0.79 and 0.22, respectively.
(3) The MLR model constructed based on the five HIs using FD transformation is the best model for estimating the CNC of potatoes. Its R2 and RMSE values over the verification set are 0.84 and 0.20, respectively. We used this model to invert the CNC of potatoes, and it helped monitor the CNC distribution over the entire test field.
In this study, the test potato variety was “Qingshu9”, and the test site was in Wuwei City, Gansu Province. Further research is necessary to determine whether the CNC estimation model developed in this study is appropriate for other potato varieties or can be applied in different geographic regions. Therefore, we plan to test the model using more potato varieties and geographic areas to improve its accuracy and establish a reliable basis for the precision fertilization of potatoes.
Author Contributions
Conceptualization, F.G. and S.Y.; methodology, F.G.; software, F.G.; validation, F.G. and W.Y.; formal analysis, Q.F.; investigation, F.G., S.Y. and W.Y.; resources, Q.F.; data curation, F.G.; writing—original draft preparation, F.G.; writing—review and editing, S.Y. and W.Y.; visualization, F.G. and S.Y.; supervision, Q.F.; project administration, S.Y. and Q.F. All authors have read and agreed to the published version of the manuscript.
Funding
This research was funded by the National Natural Science Foundation of China (32160421), Higher Education Industry Support Program of Gansu Province (2021CYZC-57), Outstanding Graduate Student “Innovation Star” of Gansu Province (2022CXZXS-012), and the Youth Doctoral Fund of Gansu Province (2021QB-033).
Institutional Review Board Statement
Not applicable.
Informed Consent Statement
Not applicable.
Data Availability Statement
Not applicable.
Conflicts of Interest
The authors declare no conflict of interest.
References
- Wang, N.; Reidsma, P.; Pronk, A.A.; de Wit, A.J.W.; van Ittersum, M.K. Can potato add to China’s food self-sufficiency? The scope for increasing potato production in China. Eur. J. Agron. 2018, 101, 20–29. [Google Scholar] [CrossRef]
- Li, Y.; Tang, J.Z.; Wang, J.; Zhao, G.; Yu, Q.; Wang, Y.X.; Hu, Q.; Zhang, J.; Pan, Z.H.; Pan, X.B.; et al. Diverging water-saving potential across China’s potato planting regions. Eur. J. Agron. 2022, 134, 126450. [Google Scholar] [CrossRef]
- Morier, T.; Cambouris, A.N.; Chokmani, K. In-Season Nitrogen Status Assessment and Yield Estimation Using Hyperspectral Vegetation Indices in a Potato Crop. Agron. J. 2015, 107, 1295–1309. [Google Scholar] [CrossRef]
- Wang, N.; Reidsma, P.; van Ittersum, M.K. Scope and strategies for sustainable intensification of potato production in Northern China. Agron. J. 2020, 112, 3591–3604. [Google Scholar] [CrossRef]
- Li, B.; Xu, X.M.; Zhang, L.; Han, J.W.; Bian, C.S.; Li, G.C.; Liu, J.G.; Jin, L.P. Above-ground biomass estimation and yield prediction in potato by using UAV-based RGB and hyperspectral imaging. ISPRS-J. Photogramm. Remote Sens. 2020, 162, 161–172. [Google Scholar] [CrossRef]
- Tong, Q.X.; Xue, Y.Q.; Zhang, L.F. Progress in Hyperspectral Remote Sensing Science and Technology in China Over the Past Three Decades. IEEE J. Sel. Top. Appl. Earth Observ. Remote Sens. 2014, 7, 70–91. [Google Scholar] [CrossRef]
- Monforte, P.; Ragusa, M.A. Temperature Trend Analysis and Investigation on a Case of Variability Climate. Mathematics 2022, 10, 2202. [Google Scholar] [CrossRef]
- Liu, J.; Xiang, J.J.; Jin, Y.J.; Liu, R.H.; Yan, J.N.; Wang, L.Z. Boost Precision Agriculture with Unmanned Aerial Vehicle Remote Sensing and Edge Intelligence: A Survey. Remote Sens. 2021, 13, 4387. [Google Scholar] [CrossRef]
- Nigon, T.J.; Mulla, D.J.; Rosen, C.J.; Cohen, Y.; Alchanatis, V.; Knight, J.; Rud, R. Hyperspectral aerial imagery for detecting nitrogen stress in two potato cultivars. Comput. Electron. Agric. 2015, 112, 36–46. [Google Scholar] [CrossRef]
- Weiss, M.; Jacob, F.; Duveiller, G. Remote sensing for agricultural applications: A meta-review. Remote Sens. Environ. 2020, 236, 111402. [Google Scholar] [CrossRef]
- Sishodia, R.P.; Ray, R.L.; Singh, S.K. Applications of Remote Sensing in Precision Agriculture: A Review. Remote Sens. 2020, 12, 3136. [Google Scholar] [CrossRef]
- Peng, J.X.; Manevski, K.; Korup, K.; Larsen, R.; Andersen, M.N. Random forest regression results in accurate assessment of potato nitrogen status based on multispectral data from different platforms and the critical concentration approach. Field Crop. Res. 2021, 268, 108158. [Google Scholar] [CrossRef]
- Peng, Y.; Fan, M.; Wang, Q.H.; Lan, W.J.; Long, Y.T. Best hyperspectral indices for assessing leaf chlorophyll content in a degraded temperate vegetation. Ecol. Evol. 2018, 8, 7068–7078. [Google Scholar] [CrossRef] [PubMed]
- Zhang, H.Y.; Ren, X.X.; Zhou, Y.; Wu, Y.P.; He, L.; Heng, Y.R.; Feng, W.; Wang, C.Y. Remotely assessing photosynthetic nitrogen use efficiency with in situ hyperspectral remote sensing in winter wheat. Eur. J. Agron. 2018, 101, 90–100. [Google Scholar] [CrossRef]
- Abulaiti, Y.; Sawut, M.; Maimaitiaili, B.; Ma, C.Y. A possible fractional order derivative and optimized spectral indices for assessing total nitrogen content in cotton. Comput. Electron. Agric. 2020, 171, 105275. [Google Scholar] [CrossRef]
- Yang, H.B.; Li, F.; Hu, Y.C.; Yu, K. Hyperspectral indices optimization algorithms for estimating canopy nitrogen concentration in potato (Solanum tuberosum L.). Int. J. Appl. Earth Obs. Geoinf. 2021, 102, 102416. [Google Scholar] [CrossRef]
- Lu, B.; Dao, P.D.; Liu, J.G.; He, Y.H.; Shang, J.L. Recent Advances of Hyperspectral Imaging Technology and Applications in Agriculture. Remote Sens. 2020, 12, 2659. [Google Scholar] [CrossRef]
- Liang, L.; Di, L.P.; Huang, T.; Wang, J.H.; Lin, L.; Wang, L.J.; Yang, M.H. Estimation of Leaf Nitrogen Content in Wheat Using New Hyperspectral Indices and a Random Forest Regression Algorithm. Remote Sens. 2018, 10, 1940. [Google Scholar] [CrossRef]
- Chen, X.Y.; Lv, X.; Ma, L.L.; Chen, A.Q.; Zhang, Q.; Zhang, Z. Optimization and Validation of Hyperspectral Estimation Capability of Cotton Leaf Nitrogen Based on SPA and RF. Remote Sens. 2022, 14, 5201. [Google Scholar] [CrossRef]
- Raj, R.; Walker, J.P.; Pingale, R.; Banoth, B.N.; Jagarlapudi, A. Leaf nitrogen content estimation using top-of-canopy airborne hyperspectral data. Int. J. Appl. Earth Obs. Geoinf. 2021, 104, 102584. [Google Scholar] [CrossRef]
- Qi, H.X.; Zhu, B.Y.; Kong, L.X.; Yang, W.G.; Zou, J.; Lan, Y.B.; Zhang, L. Hyperspectral Inversion Model of Chlorophyll Content in Peanut Leaves. Appl. Sci. 2020, 10, 2259. [Google Scholar] [CrossRef]
- Liu, J.G.; Pattey, E.; Jego, G. Assessment of vegetation indices for regional crop green LAI estimation from Landsat images over multiple growing seasons. Remote Sens. Environ. 2012, 123, 347–358. [Google Scholar] [CrossRef]
- Fu, Y.Y.; Yang, G.J.; Li, Z.H.; Li, H.L.; Li, Z.H.; Xu, X.G.; Song, X.Y.; Zhang, Y.H.; Duan, D.D.; Zhao, C.J.; et al. Progress of hyperspectral data processing and modelling for cereal crop nitrogen monitoring. Comput. Electron. Agric. 2020, 172, 105321. [Google Scholar] [CrossRef]
- Zinta, R.; Tiwari, J.K.; Buckseth, T.; Thakur, K.; Goutam, U.; Kumar, D.; Challam, C.; Bhatia, N.; Poonia, A.K.; Naik, S.; et al. Root system architecture for abiotic stress tolerance in potato: Lessons from plants. Front. Plant Sci. 2022, 13, 926214. [Google Scholar] [CrossRef]
- Duarte-Carvajalino, J.M.; Silva-Arero, E.A.; Goez-Vinasco, G.A.; Torres-Delgado, L.M.; Ocampo-Paez, O.D.; Castano-Marin, A.M. Estimation of Water Stress in Potato Plants Using Hyperspectral Imagery and Machine Learning Algorithms. Horticulturae 2021, 7, 176. [Google Scholar] [CrossRef]
- Alkhaled, A.; Townsend, P.A.; Wang, Y. Remote Sensing for Monitoring Potato Nitrogen Status. Am. J. Potato Res. 2023, 100, 1–14. [Google Scholar] [CrossRef]
- Zhou, J.; Wang, B.W.; Fan, J.H.; Ma, Y.C.; Wang, Y.; Zhang, Z. A Systematic Study of Estimating Potato N Concentrations Using UAV-Based Hyper- and Multi-Spectral Imagery. Agronomy 2022, 12, 2533. [Google Scholar] [CrossRef]
- Li, C.C.; Chen, P.; Ma, C.Y.; Feng, H.K.; Wei, F.Y.; Wang, Y.L.; Shi, J.J.; Cui, Y.Q. Estimation of potato chlorophyll content using composite hyperspectral index parameters collected by an unmanned aerial vehicle. Int. J. Remote Sens. 2020, 41, 8176–8197. [Google Scholar] [CrossRef]
- Luo, S.J.; He, Y.B.; Wang, Z.Z.; Duan, D.D.; Zhang, J.K.; Zhang, Y.T.; Zhu, Y.Q.; Yu, J.K.; Zhang, S.L.; Xu, F.; et al. Comparison of the retrieving precision of potato leaf area index derived from several vegetation indices and spectral parameters of the continuum removal method. Eur. J. Remote Sens. 2019, 52, 155–168. [Google Scholar] [CrossRef]
- Xiong, Y.; Wu, J. Zero growth of fertilizer: Review and revelation. Environ. Prot. 2017, 45, 57–60. [Google Scholar] [CrossRef]
- Ates, F.; Kaya, O. The Relationship Between Iron and Nitrogen Concentrations Based on Kjeldahl Method and SPAD-502 Readings in Grapevine (Vitis vinifera L. cv. ‘Sultana Seedless’). Erwerbs-Obstbau 2021, 63, 53–59. [Google Scholar] [CrossRef]
- Zhang, X.; Sun, H.; Qiao, X.X.; Yan, X.B.; Feng, M.C.; Xiao, L.J.; Song, X.Y.; Zhang, M.J.; Shafiq, F.; Yang, W.D.; et al. Hyperspectral estimation of canopy chlorophyll of winter wheat by using the optimized vegetation indices. Comput. Electron. Agric. 2022, 193, 106654. [Google Scholar] [CrossRef]
- Yang, H.B.; Li, F.; Wang, W.; Yu, K. Estimating Above-Ground Biomass of Potato Using Random Forest and Optimized Hyperspectral Indices. Remote Sens. 2021, 13, 2339. [Google Scholar] [CrossRef]
- Zhen, Z.; Lou, Y.S.; Moses, O.A.; Rui, L.; Li, M.; Jun, L. Hyperspectral vegetation indexes to monitor wheat plant height under different sowing conditions. Spectr. Lett. 2020, 53, 194–206. [Google Scholar] [CrossRef]
- Cui, C.H.; Fearn, T. Comparison of partial least squares regression, least squares support vector machines, and Gaussian process regression for a near infrared calibration. J. Near Infrared Spectrosc. 2017, 25, 5–14. [Google Scholar] [CrossRef]
- Wang, C.; Feng, M.C.; Yang, W.D.; Ding, G.W.; Wang, H.Q.; Li, Z.H.; Sun, H.; Shi, C.C. Use of Spectral Character to Evaluate Soil Organic Matter. Soil Sci. Soc. Am. J. 2016, 80, 1078–1088. [Google Scholar] [CrossRef]
- Kwon, Y.S.; Pyo, J.; Kwon, Y.H.; Duan, H.T.; Cho, K.H.; Park, Y. Drone-based hyperspectral remote sensing of cyanobacteria using vertical cumulative pigment concentration in a deep reservoir. Remote Sens. Environ. 2020, 236, 111517. [Google Scholar] [CrossRef]
- Zhang, H.D.; Wang, L.Q.; Tian, T.; Yin, J.H. A Review of Unmanned Aerial Vehicle Low-Altitude Remote Sensing (UAV-LARS) Use in Agricultural Monitoring in China. Remote Sens. 2021, 13, 1221. [Google Scholar] [CrossRef]
- Deng, L.; Mao, Z.H.; Li, X.J.; Hu, Z.W.; Duan, F.Z.; Yan, Y.N. UAV-based multispectral remote sensing for precision agriculture: A comparison between different cameras. ISPRS-J. Photogramm. Remote Sens. 2018, 146, 124–136. [Google Scholar] [CrossRef]
- Yang, G.J.; Liu, J.G.; Zhao, C.J.; Li, Z.H.; Huang, Y.B.; Yu, H.Y.; Xu, B.; Yang, X.D.; Zhu, D.M.; Zhang, X.Y.; et al. Unmanned Aerial Vehicle Remote Sensing for Field-Based Crop Phenotyping: Current Status and Perspectives. Front. Plant Sci. 2017, 8, 1111. [Google Scholar] [CrossRef] [PubMed]
- Hasituya; Li, F.; Elsayed, S.; Hu, Y.C.; Schmidhalter, U. Passive reflectance sensing using optimized two- and three-band spectral indices for quantifying the total nitrogen yield of maize. Comput. Electron. Agric. 2020, 173, 105403. [Google Scholar] [CrossRef]
- Yoon, J.; Krivobokova, T. Treatments of non-metric variables in partial least squares and principal component analysis. J. Appl. Stat. 2017, 45, 971–987. [Google Scholar] [CrossRef]


Disclaimer/Publisher’s Note: The statements, opinions and data contained in all publications are solely those of the individual author(s) and contributor(s) and not of MDPI and/or the editor(s). MDPI and/or the editor(s) disclaim responsibility for any injury to people or property resulting from any ideas, methods, instructions or products referred to in the content. |
© 2023 by the authors. Licensee MDPI, Basel, Switzerland. This article is an open access article distributed under the terms and conditions of the Creative Commons Attribution (CC BY) license (https://creativecommons.org/licenses/by/4.0/).