Article

Life Cycle Assessment for Soybean Supply Chain: A Case Study of State of Pará, Brazil

by
Thyago Brito
1,2,*,
Rui Fragoso
2,
Leovigildo Santos
3,
José António Martins
1,
Anabela Afonso Fernandes Silva
4 and
José Aranha
1,4
1
CETRAD—Centre for Transdisciplinary Studies, University of Trás-os-Montes and Alto Douro, Quinta dos Prados, 5000-801 Vila Real, Portugal
2
CEFAGE—Centre for Advanced Studies in Management and Economics, University of Évora, 7000-809 Évora, Portugal
3
RENAC—Natural Research of Cerrado, Goiás State University, Anápolis 75132-903, GO, Brazil
4
CITAB—Centre for Research and Technology of Agro-Environment and Biological Sciences, University of Trás-os-Montes and Alto Douro, Quinta dos Prados, 5000-801 Vila Real, Portugal
*
Author to whom correspondence should be addressed.
Agronomy 2023, 13(6), 1648; https://doi.org/10.3390/agronomy13061648
Submission received: 27 March 2023 / Revised: 11 June 2023 / Accepted: 12 June 2023 / Published: 19 June 2023

Abstract

:
Brazil has emerged as the world’s largest soybean producer and exporter in recent years. In the Brazilian Amazon Biome, the state of Pará has become a new agricultural frontier over the last two decades due to a significant increase in soybean cultivation throughout its territory. However, it is essential to understand the associated effects on the environment at every point in the supply chain. This research aims to measure the effects on the environment of the soybean supply chain of two production poles utilising openLCA software and the life cycle assessment (LCA) methodology in the northeast (Paragominas) and south (Redenção) of the state of Pará in Brazil. In addition, we determine which is the most efficient route between the shipment port and the ultimate destination. The Recipe Midpoint (H) and Intergovernmental Panel on Climate Change (IPCC) methods of environmental impact categories were used in accordance with the cradle-to-grave scope. The BRLUC regionalised model (v1.3) was used to quantify land use change (LUC). According to the observed results, LUC was primarily responsible (between 3.8 and 32.69 tCO2 Eq·ha−1·year−1) for the global warming potential (GWP) of the soybean supply chain when rainforest-occupied land was converted into cropland. The soybean harvest in the Redenção pole is better loaded through the port of Itaqui (TEGRAM), which is in São Luis (state of Maranhão), due to the use of multiple modes of transport (lorry + train), allowing for better logistical performance and less impact on the environment, despite the longest distance (road + railway = 1306 km). Due to the short road distance (approximately 350 km) and consequently lower environmental impact, soybean harvested in the Paragominas pole is better loaded through the ports around Barcarena in the state of Pará.

1. Introduction

Over recent decades, soya bean production has grown substantially as a result of it being a main source of oil and protein [1]. Demand has been stimulated due to its increasing use as food, feed and other by-products consumed globally [2]. During the crop season 2019/2020, the USDA estimated a harvested area of 122.63 million hectares for soybeans around the world, giving a production of 339 million tonnes [3].
Together, Brazil, the USA and Argentina produce about 80.8% of all global soybeans. Of these, Brazil is the largest soybean producer in the world, leading with the largest cultivated area (36.9 million hectares) and the largest production (128.5 million tonnes). It is also the largest exporter [3].
In 2020, China stood out as the largest global consumer of soybeans with 100.3 million tonnes imported, corresponding to a revenue of US $64 billion [1]. The shipments from Brazil, China’s biggest soybean supplier, were 60.6 million tonnes in 2020, corresponding to US $20.9 billion of revenue, or 60.4% of the total imported quantity. In the same year, the Netherlands imported approximately 3.3 million tonnes of Brazilian soya beans, making it the second biggest importer, corresponding to a spend of US $1.74 billion [4].
Currently, most Brazilian soybeans produced above the 16th parallel south are taken to the ports of the so-called “North Arch” of Brazil, which comprises the ports of Aratú/Ilhéus/Cotegipe, São Luís (Itaquí), Barcarena, Santana, Santarém, Itacoatiara and Porto Velho. They were responsible for handling 32% of all soybean and corn exported in 2020 [5]. Furthermore, it’s expected that by 2025, at least 35% of all Brazilian soybean and corn will be exported through these ports, relieving the pressure on the already saturated ports of south and southeast Brazil, the so-called “South Arch”.
The Amazon Biome is home to the state of Pará, which is now Brazil’s newest agricultural frontier. Pará designated 607.4 thousand hectares of land for soybean farming during the 2019–2020 growing season, resulting in an output of roughly 1.859 million tonnes of grain. Pará has three production poles located in distinct regions. The main pole is Paragominas and its neighbouring municipalities due to the largest soybean area with 339.5 thousand hectares under cultivation. The other pole is in the south of Pará, called Redenção, which is responsible for 25% of soybean production. Thereafter, the region of Baixo Amazonas (Santarém pole) contains the rest of the soybean area [6,7] in the west of the state of Pará.
In 2006, under pressure from international retailers and non-governmental organisations (NGOs), the Brazilian Soy Moratorium (SoyM) was established. The goal was to obtain zero deforestation in the Amazon rainforest resulting from soybean cultivation [8]. Thereby, the signatory trading companies are forbidden to market soybean originating from newly deforested areas in the Amazon Biome.
Agricultural production is directly related to greenhouse gas (GHG) emissions [9]. Thus, increasing food production in response to worldwide population growth makes it necessary to identify the GHG emissions associated with every agricultural crop [10]. However, other impact categories should also be assessed, for example, terrestrial acidification, freshwater toxicity, freshwater eutrophication, and human toxicity [11].
Life cycle assessment (LCA) presents itself as a relevant method which enables the quantification of the environmental impacts at each stage of the supply chain. This assessment considers the raw material used in the production chain until the product reaches its final stage of life, where it is either disposed of or recycled [12].
In LCA studies, two ‘scopes’ are the most used options in this type of research: ‘cradle-to-gate‘ or ‘cradle-to-grave‘ for a wider approach. Hence, outputs such as the GHG emissions from the production of 1 kg of soybeans in the cradle-to-gate scope can be used [13] or, alternatively, the quantification of environmental impacts to produce the same 1 kg of soybeans and 1 L of biodiesel, using the cradle-to-grave scope [14].
The LCA studies about global soybean production are performed in different countries around the world, as well as focusing on distinct points of the soybean supply chain in order to clarify how is the ecological footprint associated along the global soybean value chain [2,15,16,17,18]. However, more research is needed to expand the knowledge about this important topic along the soybean supply chain, especially in new agricultural frontiers [19].
Research into LCA applied to the Brazilian soybean supply chain in the north and northeast regions is scarce because it is mainly concentrated in the south-central regions of Brazil. More studies are therefore required to focus on the Brazilian soybean supply chain in this new agricultural frontier located in the state of Pará in the Brazilian Amazon Biome [19].
Here, we investigate each of the stages of the soybean supply chain concerning the inputs used and their operations. However, in addition to the cradle-to-gate scope, we considered the transportation stage too. So, we looked at what type of transport most harms the environment and evaluated the distances from two poles of production (origin) to two ports of shipment and thereafter, as far as the port of destination. In this way, we aim to highlight all the main hotspots of the soybean supply chain for different environmental impact categories concerning two poles of production (Paragominas and Redenção) in the state of Pará, Brazil, by applying the LCA method.

Aim of this Study

Using the LCA method, this study aimed to assess the environmental effects along the soybean supply chain in two production poles in Pará. In addition, we looked for the best port of shipping for the flow of harvested products, taking into account the distances traversed (Table 1), and the mode of transportation utilised.
We also considered the distances between the two ports of shipment and the two ports of destination, namely Rotterdam and Shanghai, with two maritime routes considered for the latter: the Panama Canal and the Cape of Good Hope (Table 2).
The different distances between ports were calculated using the online freight shipping & transit time calculator at [20].

2. Materials and Methods

2.1. Description of Study Area, Transport and Crop

A northeast pole (Paragominas) and a south pole (Redenção) were the two poles of production used in the current study of non-irrigated soybean (Glycine max (L.) Merrill) in the state of Pará. The regions have an annual mean rainfall of 1700 mm and 2000 mm, respectively [21].
The northeast pole comprises the municipalities of Paragominas, Ulianópolis, Dom Eliseu, Rondon do Pará, Abel Figueiredo and Tailândia. The south pole consists of the municipalities of Redenção, São Félix do Xingú, Cumaru do Norte, Santana do Araguaia and Santa Maria das Barreiras (Figure 1).
The soybeans produced in these two poles have two export options: 1. The Port of Barcarena (Vila do Conde) in Pará, with access only via road, and 2. The Port of Itaqui (TEGRAM), located in São Luís, state of Maranhão, has access by road and rail. Access by rail is achieved by two railways: the Carajás railway—EFC (acronym in Portuguese) intersected by the North–South railway—FNS (acronym in Portuguese). This last railway has two multimodal platforms (transhipment), one being called the Palmeirante Integrator Terminal—TIPA (acronym in Portuguese), in the state of Tocantins, and the other terminal located in Porto Franco, state of Maranhão.
The transport of grain by railway (Figure 2) is operated by the VLI logistics enterprise, a private company and the only one with the concession to operate with this type of cargo on that railway. Thus, it provides logistical services for trading companies in the region.

2.2. Life Cycle Assessment

The principles, framework, requirements, and guidelines [12,22] and the LCA’s applicability were all taken from the International Standards Organisation. The LCA process is sufficient for determining the main hotspots linked to each stage of the soybean supply chain and for measuring the extent of environmental consequences related to activities. The results can serve as suggestions for making more environmentally friendly decisions to lessen the most environmentally damaging activities.

2.2.1. Scope of the Study and Crop Management

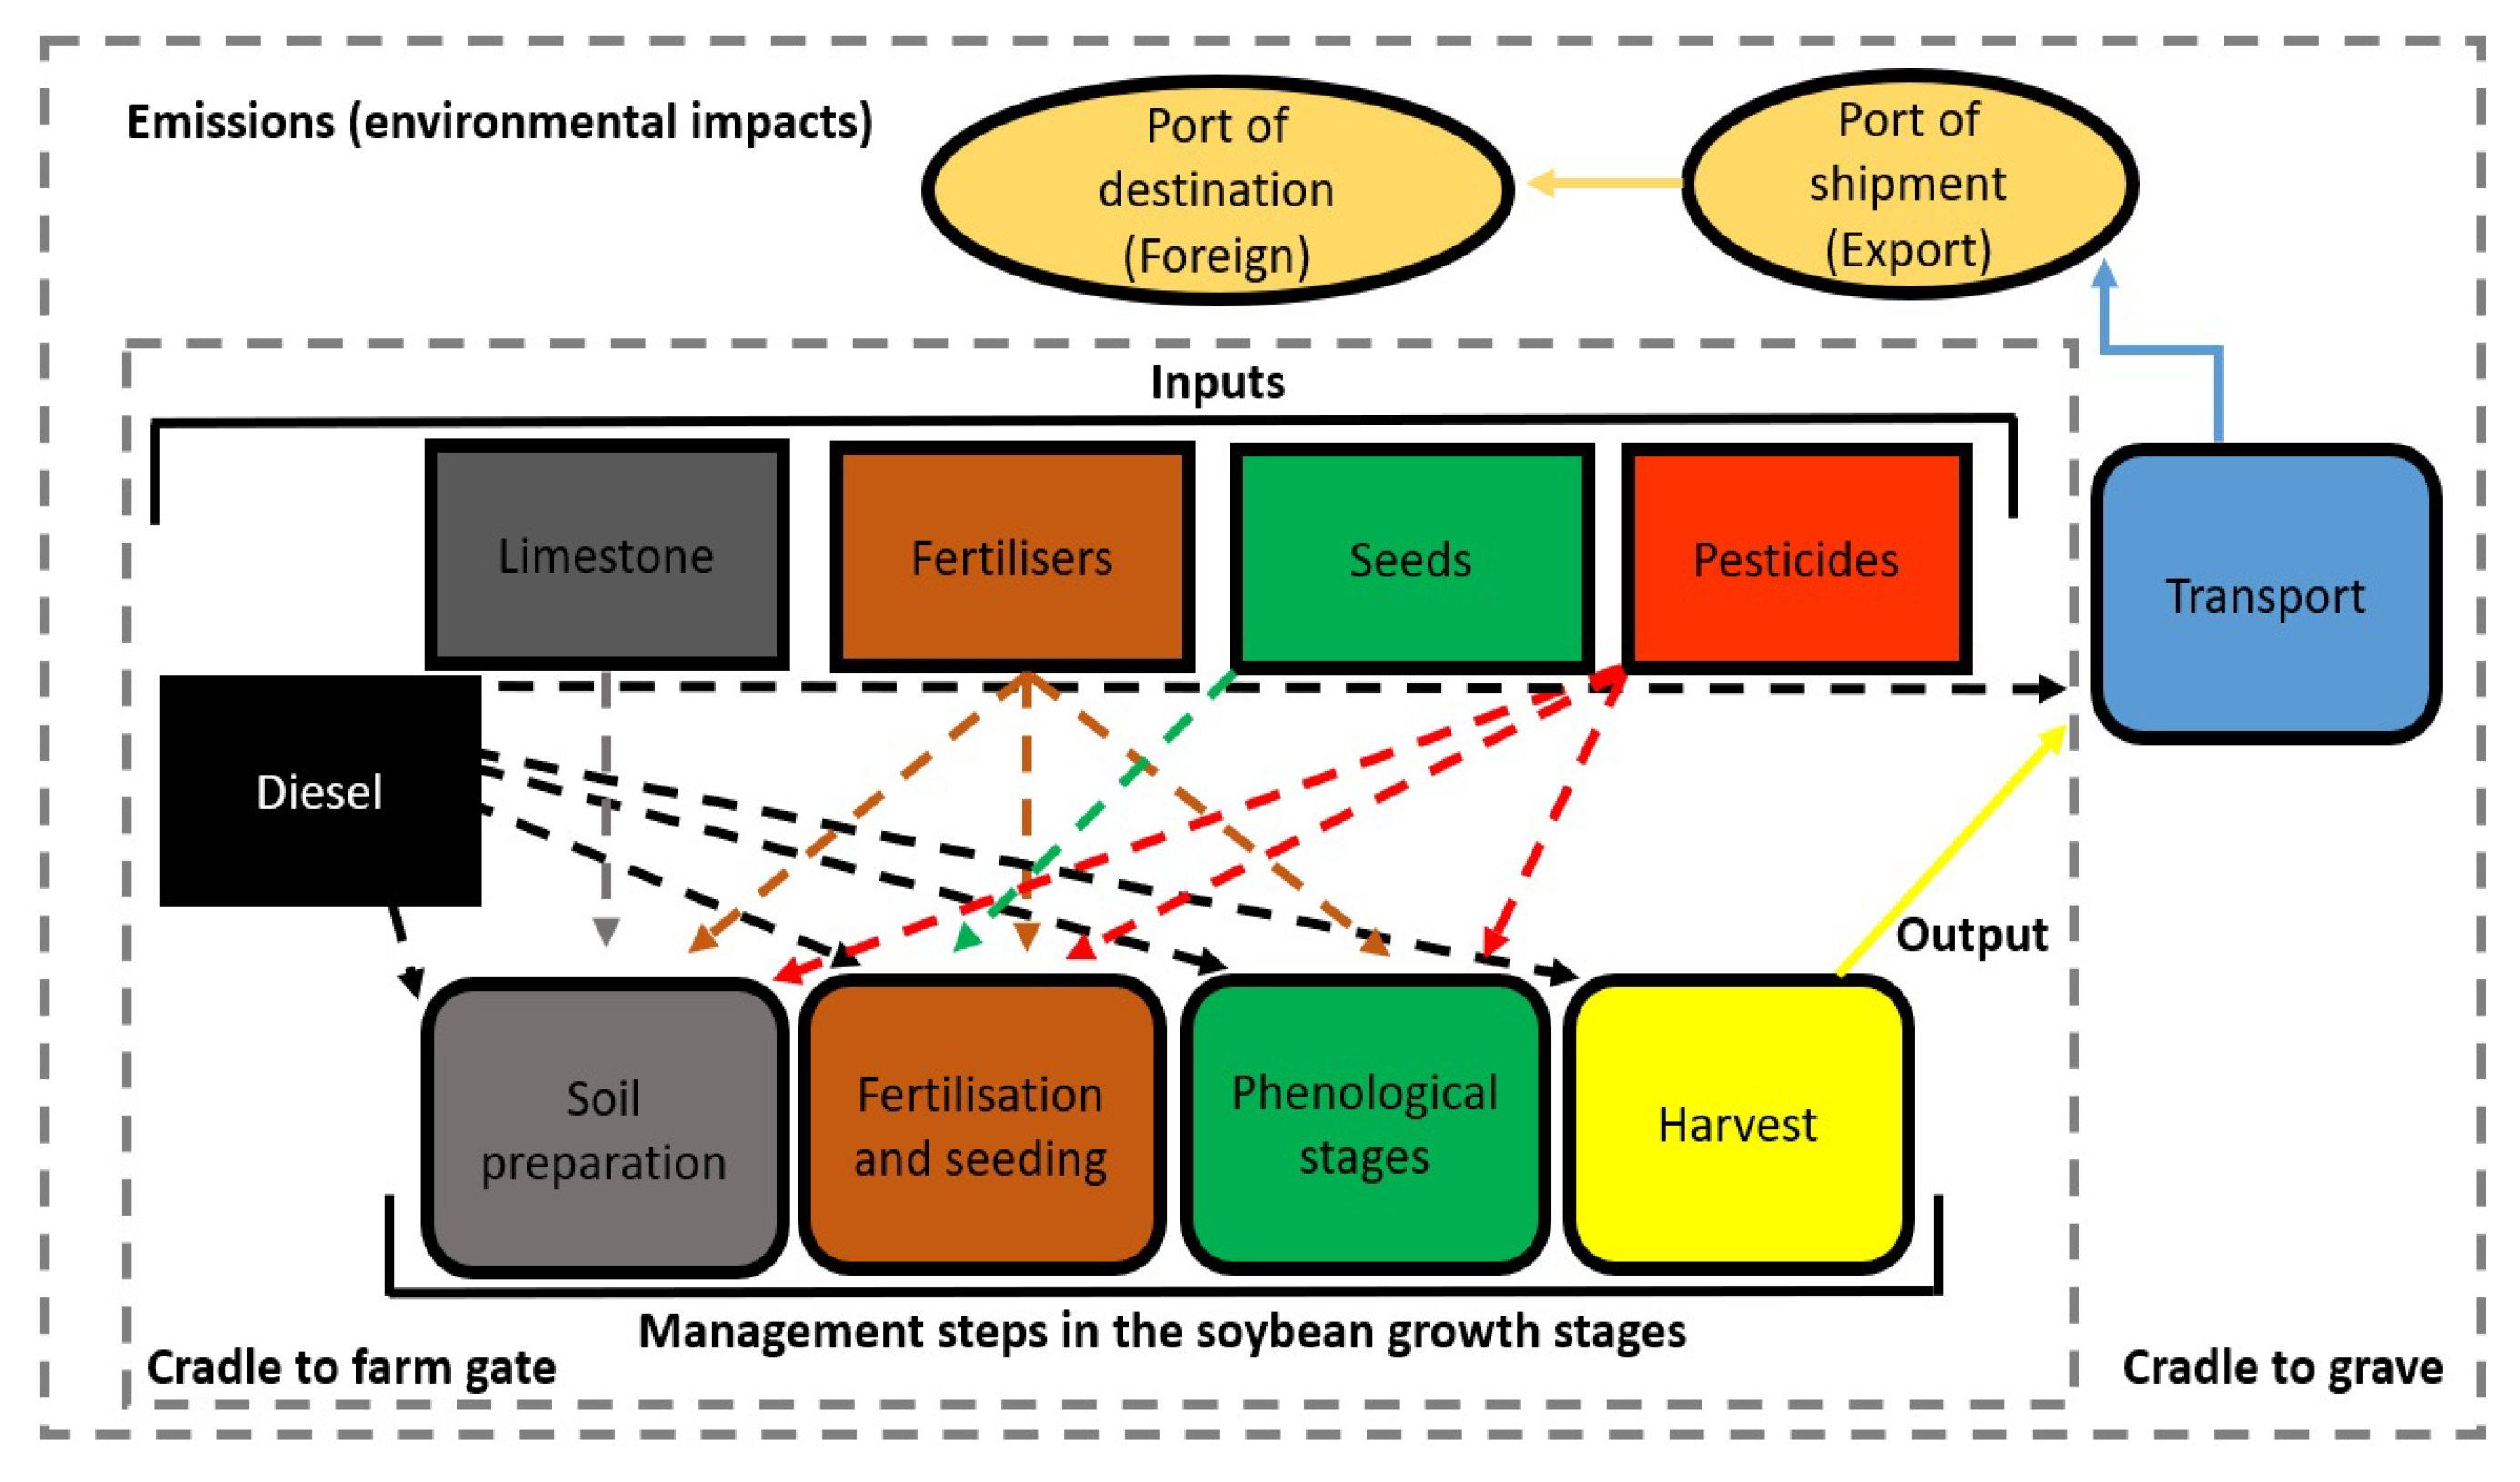
We employed a cradle-to-grave approach, omitting the stages of drying and grain storage as well as consumer consumption at the very end. The conveyance of harvested output to two ports of shipment, the port of Itaqui (TEGRAM), Grains Terminal of Maranhão (acronym in Portuguese), located in São Luis, state of Maranhão, and the port of Barcarena, in the state of Pará, was taken into consideration. The transport of grains from the port of origin to the port of destination was also considered. One kilogram of genetically modified (GMO) soybeans (cv. M 8644 IPRO) is used as the functional unit (FU) in a tillage system. Thus, the input flows (production factors) were used for the agricultural stage (Figure 3).
Typical planting and harvesting seasons at the south pole (Redenção) are between October and November for sowing and January, February, and March for harvesting. In the Paragominas region of the north pole, the sowing is concentrated from December until the beginning of February, and the harvest is completed in March, April, and May. Yellow and red eutrophic ferralsols were mainly used to cultivate soybeans. During the sowing process, NPK chemical fertilisers were applied to all the soils in the study. To limit the dangers of osmotic or ionic stress during the initial development of the crop, which can harm the final stand of plants and production, fertilisation should not be performed in excess of 70 kg K2O ha−1. If necessary, a complement of K2O fertiliser should be administered by the broadcaster a few weeks prior to sowing or 30 days after sowing in accordance with the soil analysis results. This procedure aims to lower the dangers of K2O losses due to leaching, particularly in sandy textured soils [23,24].
It is well known that soybeans, a member of the Fabaceae family, can convert atmospheric nitrogen into NH4+ through a symbiotic interaction with N-fixing bacteria. Therefore, all farmers must utilise Bradyrhizobium japonicum to inoculate seeds (on farm seed treater) before sowing on farms. So, the benefits of using Bradyrhizobium japonicum on soybean cultivated in tropical soils is widely known [25]. The farmers of this study purchased and used commercial inoculants. This study, however, ignored the effects of inoculation. Given that soybeans, in the early stages of development, do not produce rhizobium nodules on their roots, it is strongly advised to add a modest amount of chemical nitrogen to the NPK formulation (7 kg N ha−1) to aid the promotion of better plant germination. Due to the high level of weathering, tropical belt soils typically have low phosphorus supplies in their soil solutions. Consequently, between 100 and 125 kg of P2O5 per hectare is often utilised in both poles for soybeans.
Regarding spraying during the soybean cycle, two insecticides, four fungicides, and one to three herbicides (pre- and post-emergent) are employed, respectively, to focus on controlling pests and diseases and removing weeds from the tillage. Hence, the required amount for pesticide spraying can range from seven to nine times.
The most common method of treating fungi that affect soybeans is to spread out fungicide applications every 15 days while maintaining the following sequence: the first application at the vegetative stage, before closing lines (40 days after germination); the second application at flowering, ±55 days after germination; the third application at string bean formation, ±70 days after germination; and the fourth application at grain filling, ±85 days after germination.

2.2.2. Software, Database and LCIA Method Used

We used the average inventory value from four farms (two in each pole), and we found this information by either calling or messaging farmers with questions related to their used inventory in their farms. We employed the open access programme OpenLCA 1.10.2 to process all inventory data. The French Life Cycle Inventory (LCI) database Agribalyse (v.3) provided the input and output flow throughout the process. We employed the IPCC 2013 and Recipe Midpoint (H), two life cycle impact assessment (LCIA) methodologies.

2.2.3. Land Use Change (LUC)

The BRLUC regionalised model (v1.3) of [26], which looks at land coverage over 20 years (1999–2018), comparing cultivated areas with other land use types in the state of Pará, was used to compute the LUC. This model estimates three emission scenarios: (I) minimum, (II) maximum and (III) proportional rate, taking into account the potential impact of changes in land occupation. The BRLUC used the simplex technique, based on a linear programming problem, to consider the allocation of areas and emission rates to estimate scenarios (I) and (II).

3. Results

The input and output flow for each stage of the soybean production process are shown in Table 3, which have been normalised using the FU of 1 kg of soybean (fresh matter). According to [27], nitrate production (NO3) was calculated. This suggested the model (SQCB-NO3) considers the relations between the nitrogen inputs in fertilisation and the nitrogen existing in organic matter in the soil, as well as other variables.
Table 4 shows 13 impact categories from 18 existing on Recipe Midpoint (H). These results discarded five impact categories due to their values being null.
All pesticides (active principles) used in cropping should be classified as a specific category of soil emissions due to the production system (agricultural stage). All pesticide chemical classes, however, ought to be categorised as inputs. Following the guidelines of [28], estimates of ammonia, dinitrogen monoxide, nitrogen oxides, and carbon dioxide fossil emissions were made. The average yield of soybean grain in both poles was 3300 kg ha−1, with a 115-day soybean crop cycle.
The FU production phase and their principal hotspots (most influential processes in each category) were described as the total values for either impact category. In addition, referencing the outcomes, the percentage of collaboration relates to the overall impact category.
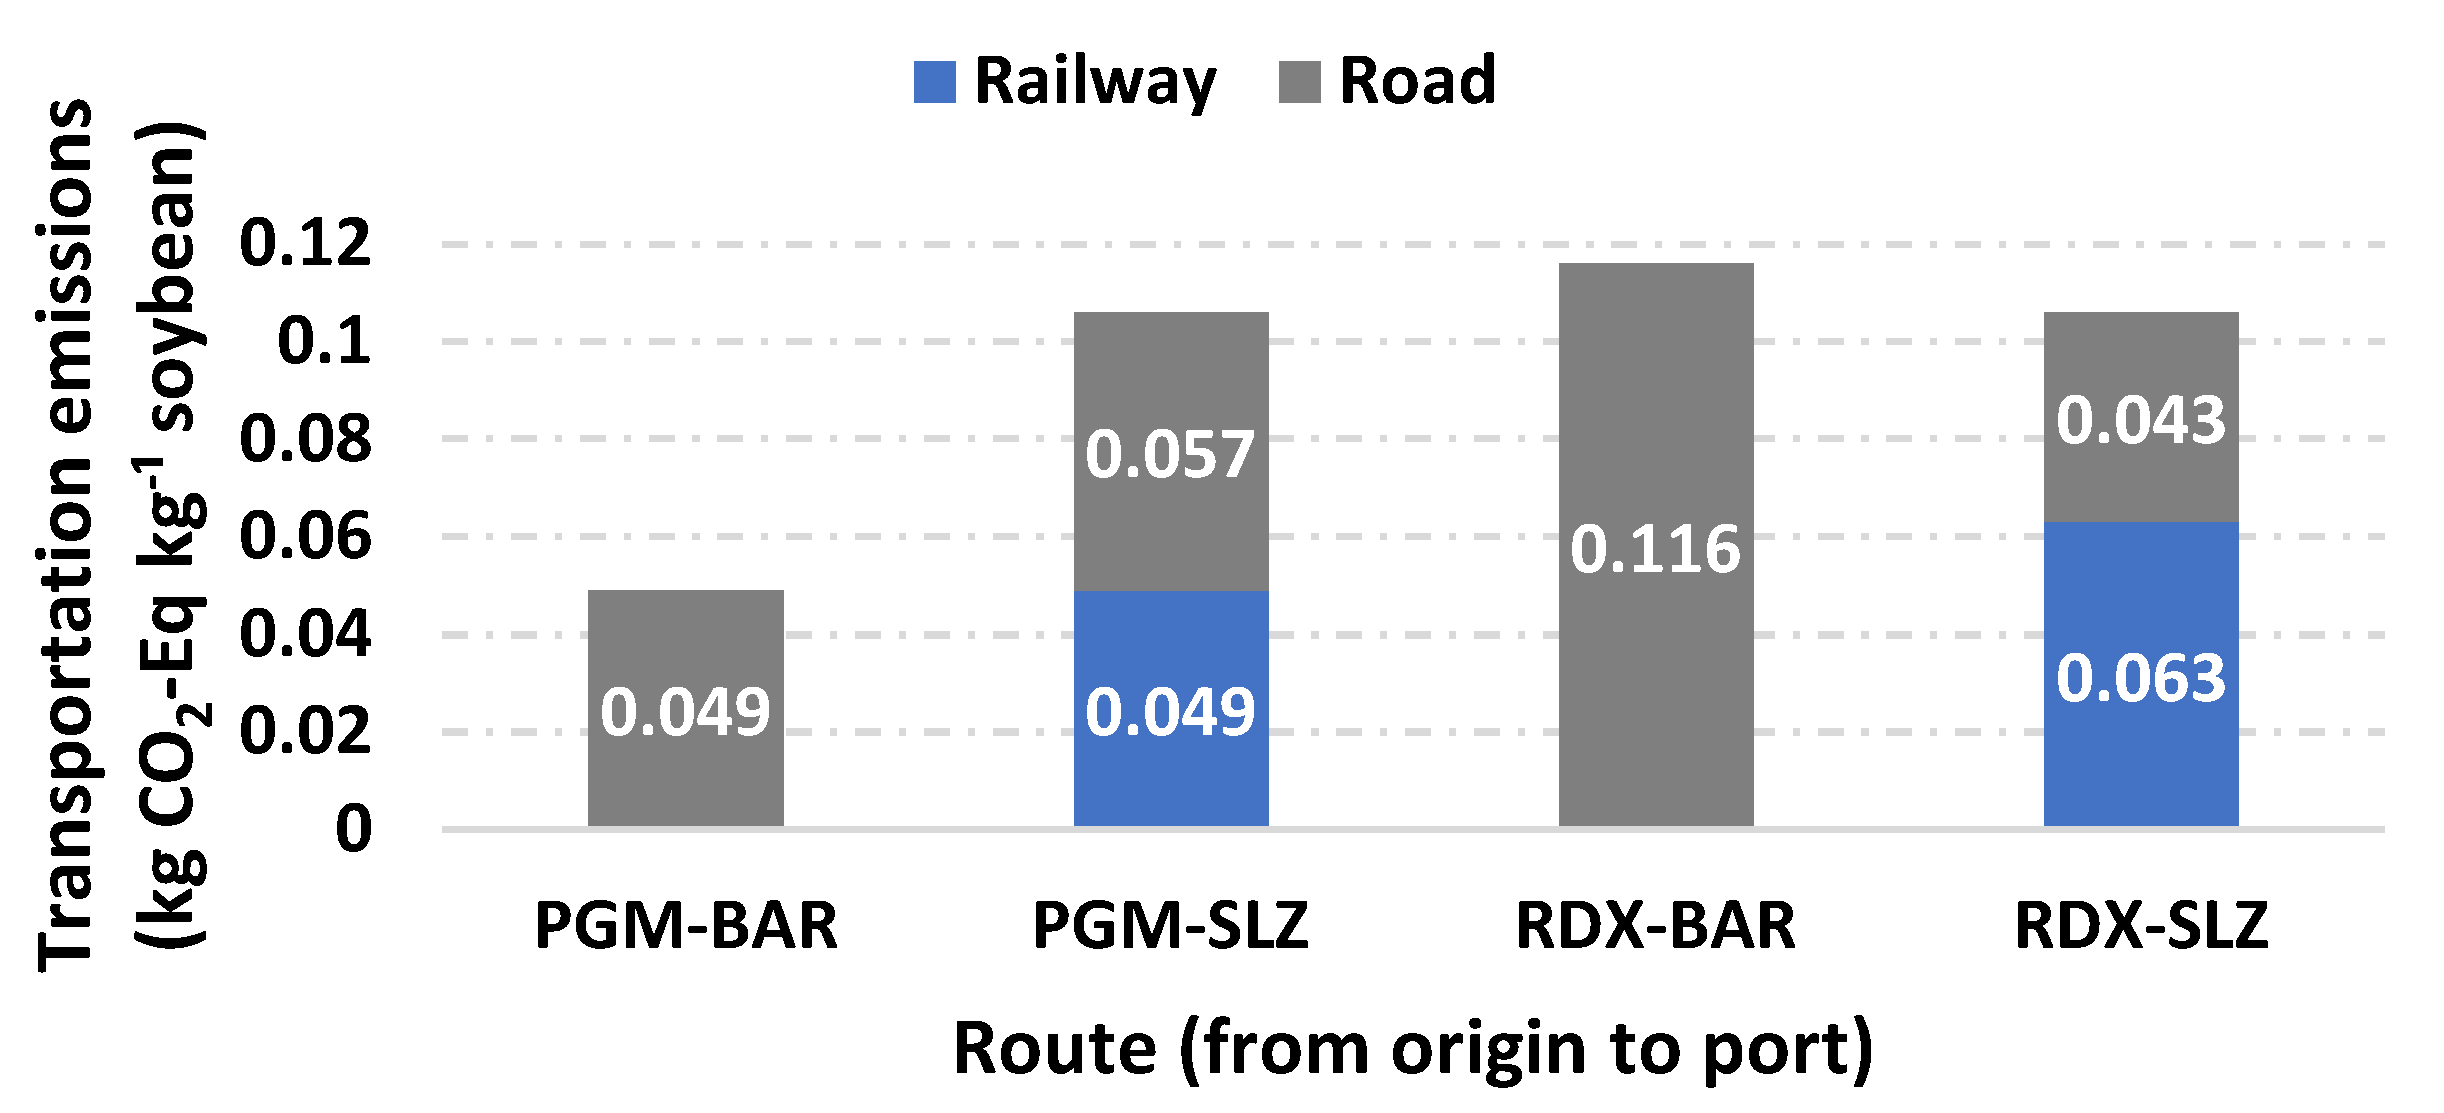
There are two potential routes for soybeans grown at both poles (Paragominas and Redenção). The routes’ projected CO2 emissions per kilogramme of soybean were calculated. While lorry transport was included in the routes to the port of Barcarena, the routes to São Luis (TEGRAM) had both lorry and railway transport. Because of this, the emissions from Paragominas to Barcarena were lower than those from São Luis. However, in Redenção, the opposite was true, and the emissions to Barcarena were greater than those to São Luis (Figure 4).
We consider the same energy consumption for train and lorry transport described by [29], where the railway transport presented the least energy expense specific (0.42 MJ km−1 t−1) than lorry transport (0.50 MJ km−1 t−1) during the transported grains between Rio Verde, state of Goiás and Santos, state of São Paulo.
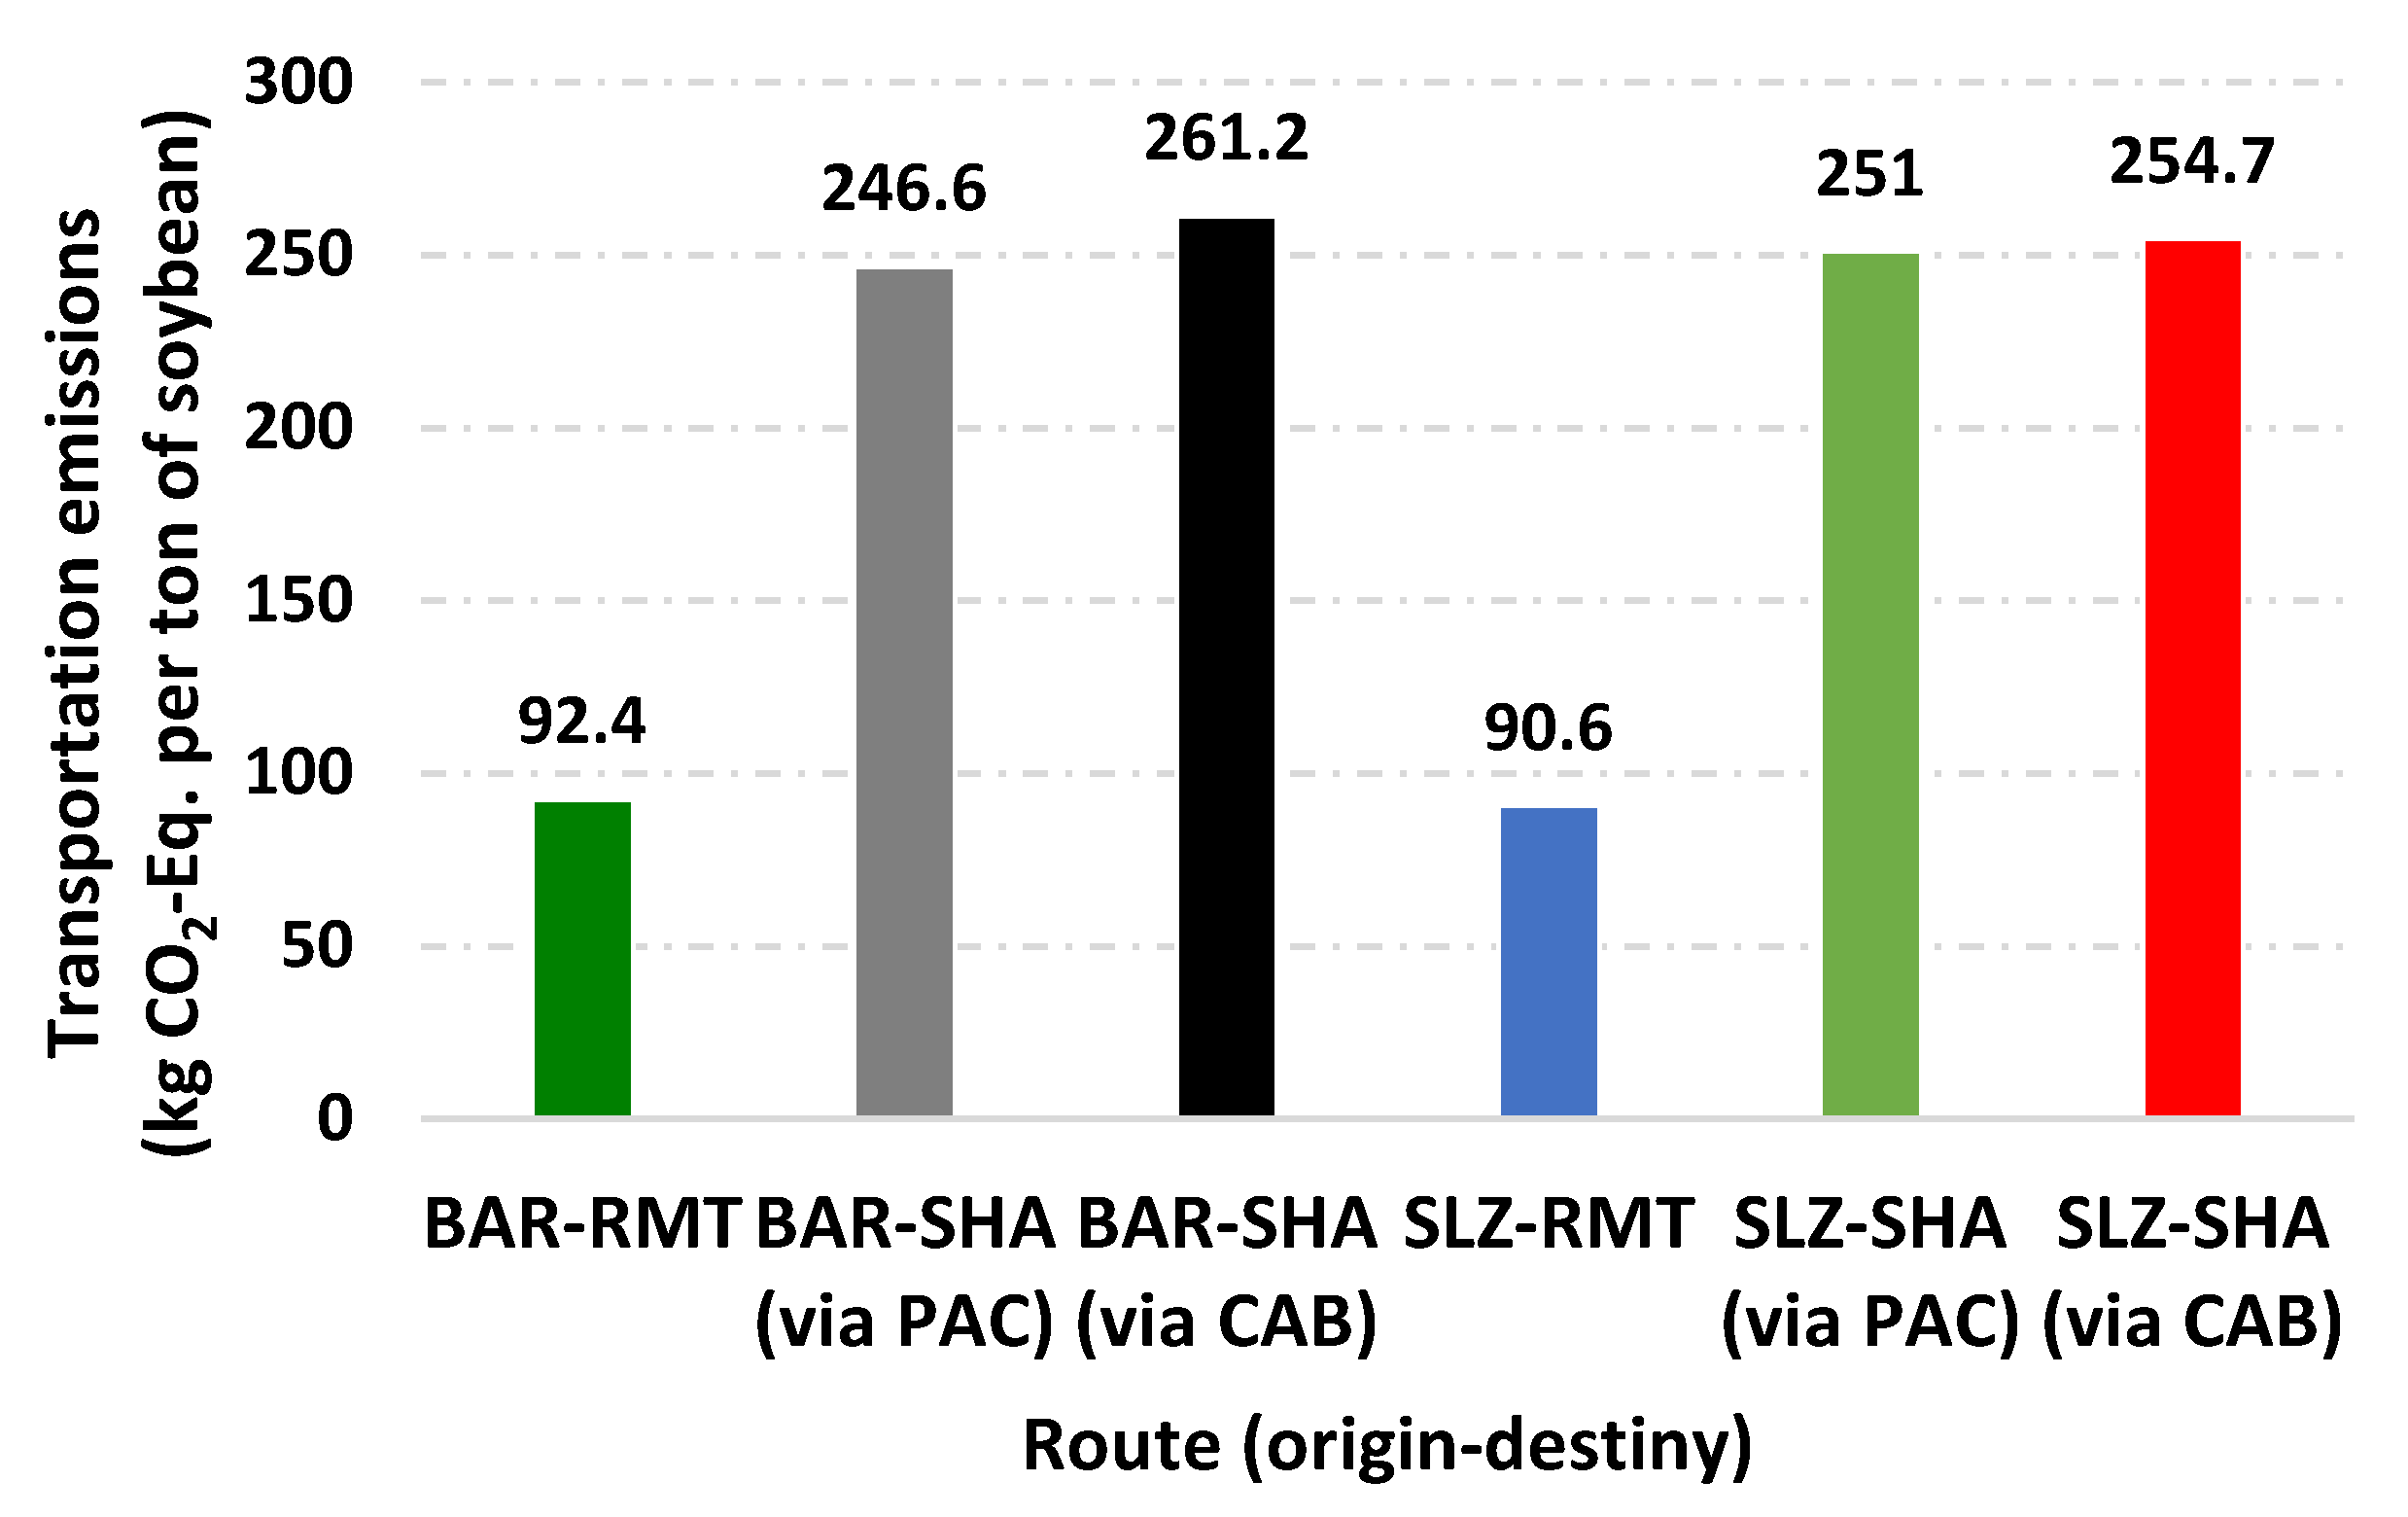
The soybeans loaded in both ports of origin have two potential destination routes abroad. Hence, the CO2 emissions per tonne of soy resulted from different shipment routes, which were calculated (Figure 5).
Based on distances, soybeans exported through the Port of São Luis (TEGRAM) are better than the Port of Barcarena to the port of Rotterdam due to the lower distances and, consequently, lower CO2 emissions. However, the converse was observed for the Port of Barcarena, which has fewer CO2 emissions and distance than the Port of São Luis (TEGRAM) to the Port of Shanghai via the Panama Canal. From both ports of origin, the route to Shanghai (via the Cape of Good Hope) has a longest distance and transit time, hence upper CO2 emissions.
Based on distances, the transit time of one ship from São Luis to Rotterdam is 13 days and 6 h. To Shanghai via the Cape of Good Hope, it is 37 days and 6 h, and to Shanghai via the Panama Canal, it is 36 days and 16 h. The transit time of one ship from Barcarena to Rotterdam is 13 days and 12 h; to Shanghai via the Cape of Good Hope, it is 38 days and 5 h, and to Shanghai via the Panama Canal, it is 36 days.
Table 5 highlights the land use change and its, respectively estimated CO2 emissions referring to three possible scenarios related to soybean cultivation, following the BRLUC proposed by [26], taking into consideration the carbon footprint of standardised amortisation over 20 years in the state of Pará.

4. Discussion

Understanding the environmental footprint of agricultural production is crucial. The production system (agricultural stage) had the most significant influence (hotspot) in eight impact categories: ALOP, GWP100, FETPinf, FEP, METPinf, MEP, TAP100, and TETPinf. In addition to the actual actions, the aggregate of all the inputs employed at this stage was what caused this outcome [30]. Nonetheless, the GWP100 value was close to that of [2], with the production stage accounting for 43.8% of this impact category. This was caused by the existing flows at this stage, which converged to produce emissions of CO2 and nitrogen monoxide (N2O) into the atmosphere.
Indeed, [19] warns that the soybean production stage of the supply chain is responsible for most of the environmental impacts, mainly due to the type of land use, the soil management and the inputs used, such as pesticides, fuels, limestone, seeds and fertiliser applications.
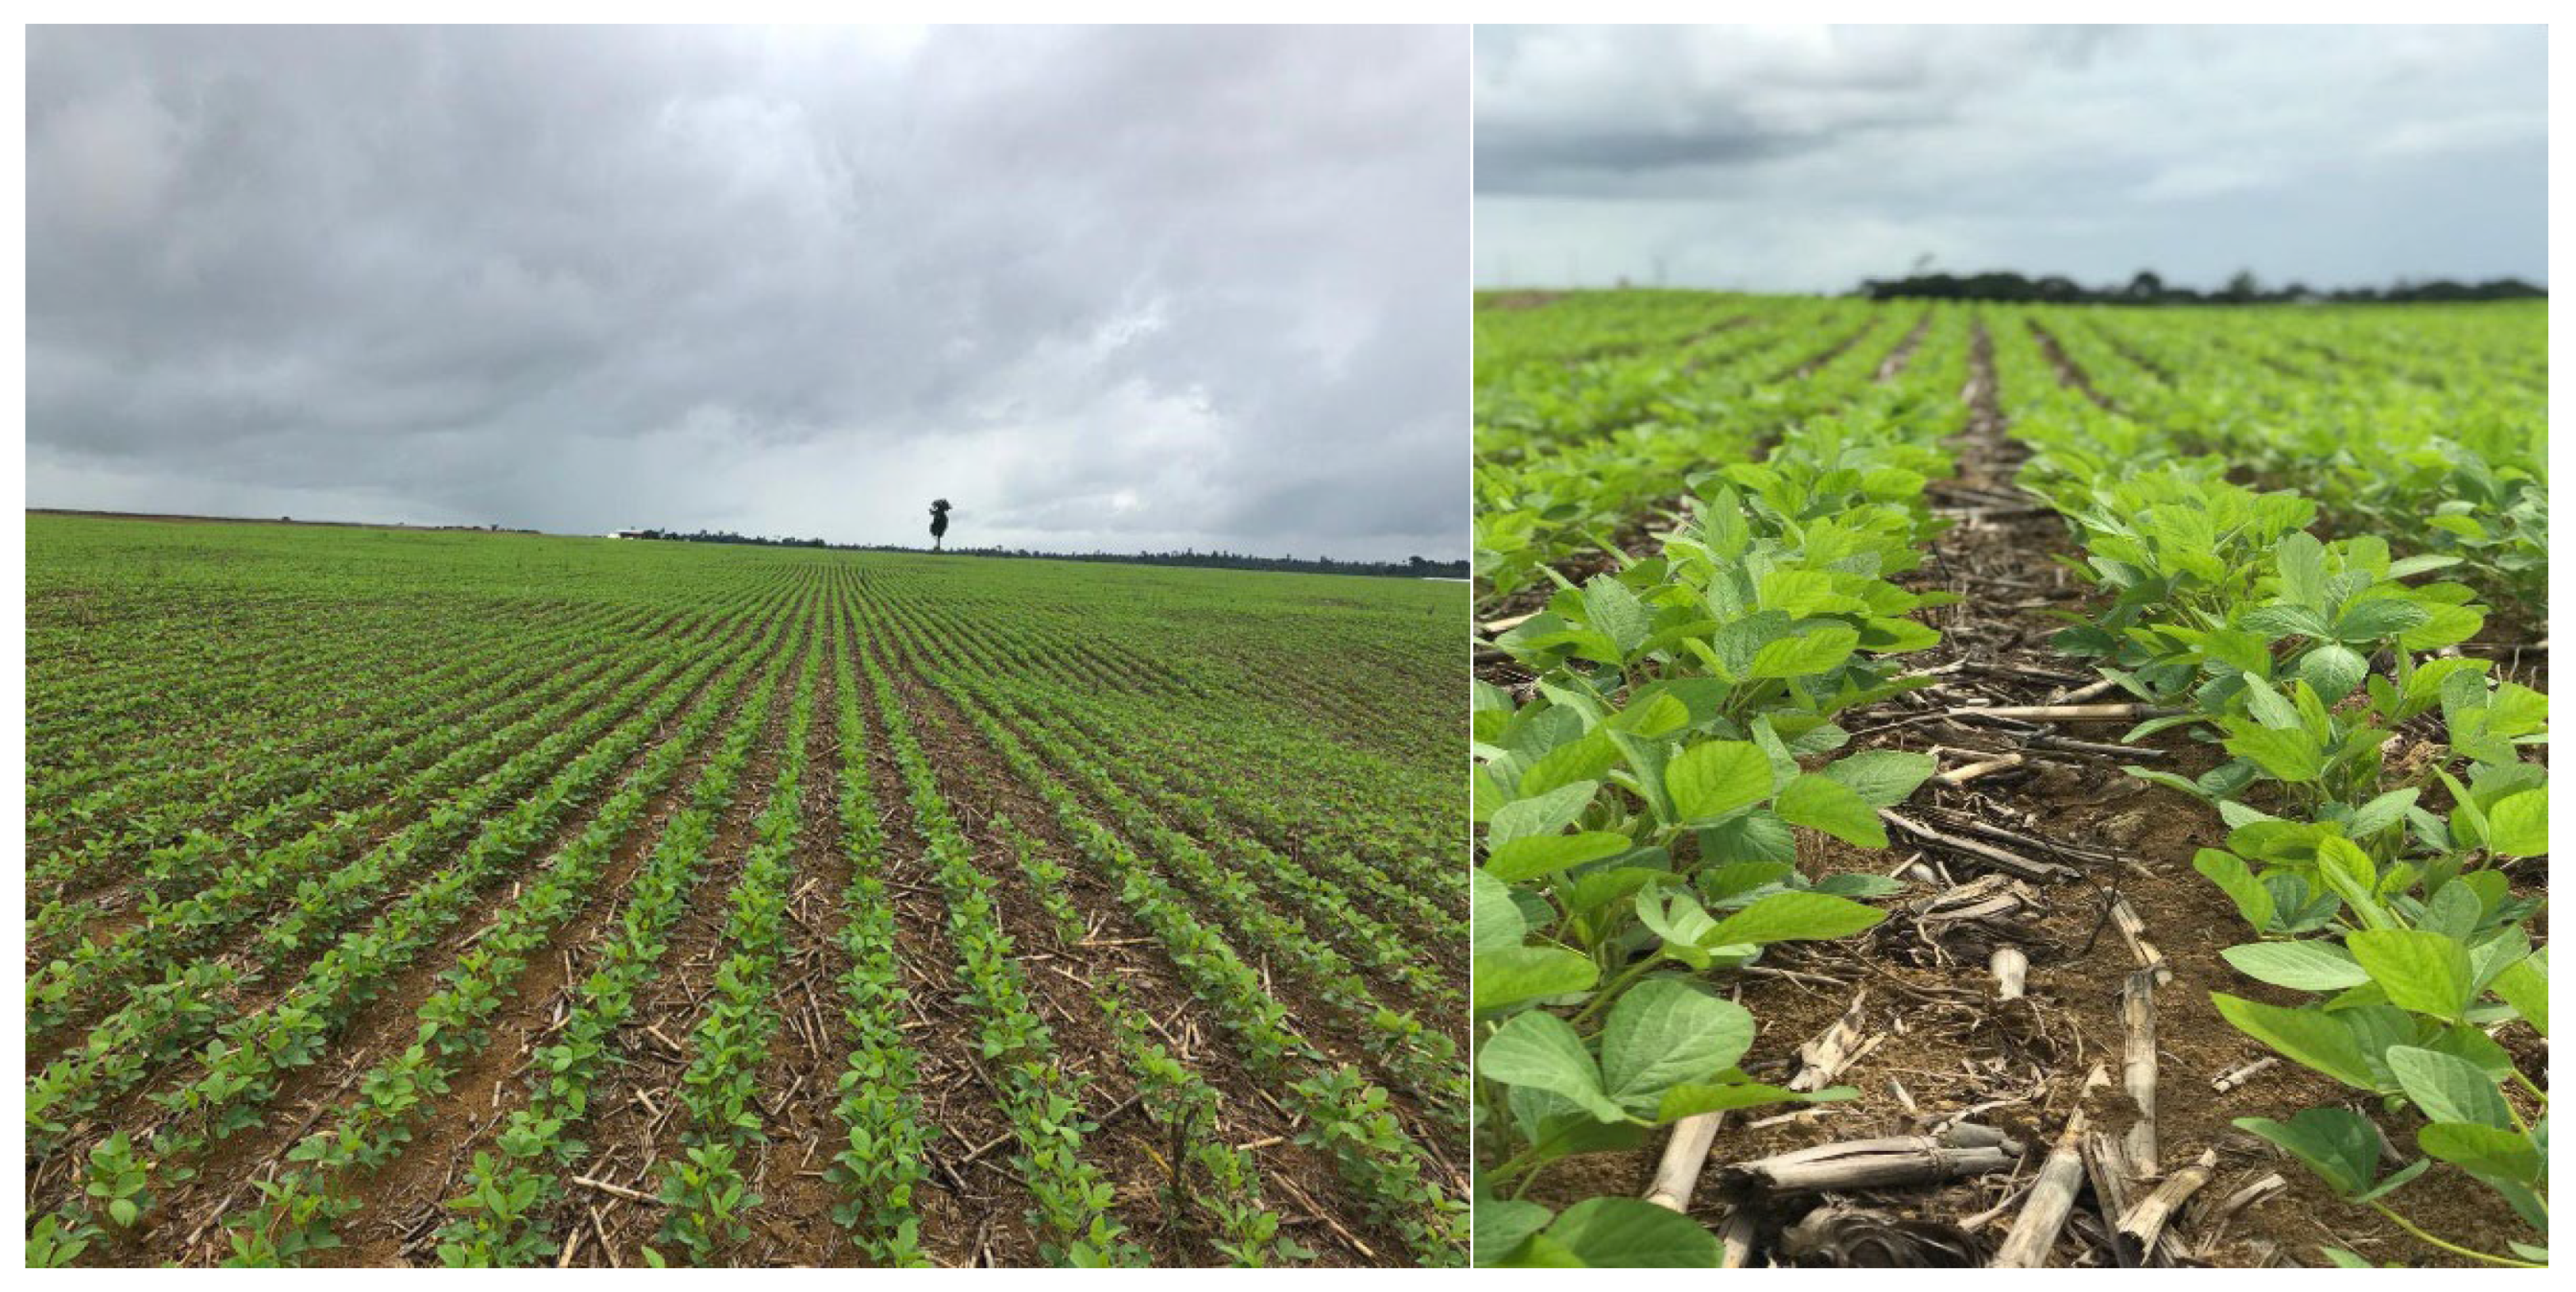
Despite the short rainy season in both production poles, efforts to promote the adoption of no-tillage systems in the region have become notoriously difficult (Figure 6), as have been efforts to sow cover crops after harvest to make straw such as Brachiaria ruziziensis, millet, sesame, sorghum and corn as interim cash crops, thereby favouring the so-called low carbon agriculture—ABC (acronym in Portuguese). In this regard, we encourage using a no-tillage system to ensure better efficiency from the use of inputs at the agricultural stage, resulting in less harmful management and, consequently, a lower environmental impact on the agroecosystem.
In this respect, [31] highlighted the positive effects of soybean cropping under a no-tillage system. These effects are on soil water dynamics related to the permanent soil cover favouring higher organic matter, porosity, the water storage capacity of the soil, higher rate of infiltration, as well as decreased runoff and water evapotranspiration from the surface due to better physical soil conditions and the improvement in hydric properties compared to the conventional tillage system. These authors also describe that soybean grown under no-tillage systems showed higher indices, such as yields, greater weight per 1000 grains, greater plant height, relative water content and water leaf potential than plants under the tillage system [32,33].
The transportation of the output ranks as the second stage of the supply chain for soybeans with the greatest environmental impact [19]. Due to the lesser CO2 release from rail carriage, soybeans transported from the Redenção pole were better taken to São Luis despite the greater distance. Some authors [16] also noted that grain conveyed by train had fewer CO2 emissions than grain transported by lorry. Additionally, each waggon on this route has a carrying capacity of 92.5 tonnes, and a company train may transport up to 80 waggons or 7400 tonnes. Three locomotives are often connected at once, expanding the capacity by up to 240 waggons each (or 22,200 tonnes). In contrast, a lorry can only transport between 32 and 50 tonnes. So, soybean cultivated in the Paragominas pole is better taken to Barcarena due to its proximity and lower emission of pollutants.
Both ports of shipment (Barcarena and São Luis) are close to the Equator line, being at a latitude, respectively, of 01°30′ S and 02°31′ S. Thus, they have easy access to the Panama Canal and other main ports located in their proximity, serving the largest global markets of the northern hemisphere.
In this sense, [16] evaluated the environmental impacts of soybean crops from the state of Paraná in the south of Brazil. These were loaded at a seaport of this region and delivered to Rotterdam by ship. They described emissions of 114.9 kg CO2-Eq. over this sea transport for each tonne of soybeans transported. However, our study found lower emissions for sea transport to Rotterdam from both ports of origin (Barcarena and São Luis), with 92.4 kg CO2-Eq. and 90.6 kg CO2-Eq being released into the atmosphere, respectively. Thus, exporting grains to the European market from both ports of origin in the so-called “North Arch” of Brazil is extremely advantageous. However, infrastructure improvements are needed to achieve better export performance, avoid possible logistical bottlenecks, and ensure lower environmental impacts.
Currently, some efforts are being made to lower dependence on road transport, such as the project of the Paraense railway S.A. [34], which intends to connect both Poles (Redenção and Paragominas) directly to the port of Barcarena, leading to a considerable decreasing of GHG emissions into the atmosphere.
Over the last two decades, the supply and export of grains from Brazil has witnessed impressive growth. Thus, it is expected that this tendency will continue to grow over the next few years. In anticipation of this, the expansion of the current capacity of the ports should be implemented. In addition, the construction of a new private terminal, TUP (acronym in Portuguese), is planned for global agribusiness traders, such as Cargill in Abaetetuba (near Barcarena), Pará. This new infrastructure by Cargill should be operational by 2024, having a port capacity of 9 million tonnes per year, with the final stage of implementation of the terminal scheduled for the year 2045 [35]. The trading company Louis Dreyfus Company, LDC, will also build a new terminal in Malato on the island of Marajó, Pará, with an estimated port capacity of 9 million tonnes per year and operations starting in 2024 [36].
Other authors [37] warn that land use change can affect regional climates. They describe the conversion of native forest in Caatinga areas (a biome exclusively to Brazil) into grassland, which has resulted in increased water losses by drainage and reduced evapotranspiration.
Of all the Brazilian biomes, the largest carbon stock rate per hectare is found in the Amazon Biome. Additionally, over the past 20 years, Pará has entered a new phase of agricultural development. The conversion of rainforest (unspecified, natural) to the use of arable land with an increase in soybean farming is associated with significant CO2 emissions [26]. LUC estimates should consider some aspects of uncertainty, and it is justified to describe soybean production separately, given its magnitude and potential impact on the total emissions of agricultural products [2]. LUC estimates should be reported separately from other data in LCA studies [26,38].
The LUC technique only considers deforestation that has occurred in the last 20 years, which inadvertently penalises supply chains for agriculture located on new agricultural frontiers, such as the region of northern Brazil [26,38]. The same author claims that numerous initiatives have been launched to advance low-carbon agriculture. [8] emphasises that after the soy moratorium, soybean farming has expanded in the previously cleared areas of the Amazon Biome.
Only 1.9% of the soybean cropping area in the state of Pará has been allocated to deforested areas since 22 July 2008. This is due to the soy moratorium, which aims to guarantee that soybean cultivated and traded in the Amazon Biome is only produced without any deforestation of the Amazon rainforest [39].
Knowing that Brazil is a country with continental dimensions and that most studies that have applied LCA methodology in the Brazilian soy supply chain are concentrated in the south-central region of the country, it is essential to deepen our knowledge of new areas where soybean cultivation is expanding (new agricultural frontiers), mainly in the sensitive region of the so-called Brazilian Legal Amazon [19].

5. Conclusions

The production system was the primary hotspot of most categories in the applications made using the Recipe Midpoint (H). To promote more efficient cargo loading and lower GHG emissions from transportation, we advise expanding the train network, primarily by expanding the existing infrastructure and constructing a railway connecting the production poles and the ports in the Barcarena region. Soybean loaded from the port of Itaqui in São Luis goes better to the ports of Rotterdam and Shanghai via the Panama Canal due to the shorter distance and transit time, hence having lower CO2 emissions. On the other hand, soybean loaded from Barcarena also goes better to Shanghai via the Panama Canal.
Due to soybean farming being located on a new agricultural frontier, which has experienced a considerable increase over the last 20 years, the LUC revealed notable factors concerning climate change. Ultimately, this study was the first to apply the LCA technique to the state of Pará’s soybean supply chain. Further, this research can serve as a foundation for future work by new stakeholders looking to expand their understanding of LCA as it applies to soybeans grown in this important Brazilian region.

Author Contributions

Conceptualisation, methodology, investigation, and writing—original draft preparation, T.B.; review and editing, R.F., L.S., J.A.M., A.A.F.S. and J.A. All authors have read and agreed to the published version of the manuscript.

Funding

This work was developed through collaboration with National Funds by FCT, Portuguese Foundation for Science and Technology (project UIDB/04033/2020) and (project UIDB/04007/2020).

Data Availability Statement

Not applicable.

Acknowledgments

The authors would like to thank Carlos Teles, Diego Gonçalves, Marcelo Dourado and Gustavo Justino for the kindly provided information.

Conflicts of Interest

The authors declare no conflict of interest.

References

  1. Liu, Z.; Ying, H.; Chen, M.; Bai, J.; Xue, Y.; Yin, Y.; Batchelor, W.; Yang, Y.; Bai, Z.; Du, M.; et al. Optimization of China’s maize and soy production can ensure feed sufficiency at lower nitrogen and carbon footprints. Nat. Food 2021, 2, 426–433. [Google Scholar] [CrossRef]
  2. Castanheira, E.G.; Freire, F. Greenhouse gas assessment of soybean production: Implications of land use change and different cultivation systems. J. Clean. Prod. 2013, 54, 49–60. [Google Scholar] [CrossRef]
  3. USDA—United States Department of Agriculture; Foreign Agricultural Service. World Agricultural Production, Circular Series, WAP 4-21. 2021. Available online: http://apps.fas.usda.gov/psdonline/circulars/production.pdf (accessed on 15 April 2021).
  4. Trademap—Trade Statistics for International Business Development. Imports and Exports. 2022. Available online: https://www.trademap.org/Index.aspx (accessed on 21 March 2022).
  5. ANTAQ—Agência Nacional de Transportes Aquaviários. 2022. Available online: http://ea.antaq.gov.br/ (accessed on 15 November 2022).
  6. CONAB—Companhia Nacional de Abastecimento. Acompanhamento da Safra Brasileira de Grãos, v. 7—Safra 2019/20—Nono Levantamento; CONAB—Companhia Nacional de Abastecimento: Brasília, Brazil, 2020; pp. 1–66. Available online: http://www.conab.gov.br (accessed on 29 March 2021)ISSN 2318-6852.
  7. CONAB—Companhia Nacional de Abastecimento. Séries Históricas das Safras—Soja. Available online: https://www.conab.gov.br/info-agro/safras/serie-historica-das-safras?start=30 (accessed on 29 March 2021).
  8. Gibbs, H.K.; Rausch, L.; Munger, J.; Schelly, I.; Morton, D.C.; Noojipady, P.; Soares-Filho, B.; Barreto, P.; Micol, L.; Walker, N.F. Brazil’s Soy Moratorium. Science 2015, 347, 377–378. [Google Scholar] [CrossRef]
  9. Zhao, Z.; Wang, P.; Xiong, X.; Wang, Y.; Zhou, R.; Tao, H.; Grace, U.; Wang, N.; Xiong, Y. Environmental risk of multi-year polythene film mulching and its green solution in arid irrigation region. J. Hazard. Mater. 2022, 435, 128981. [Google Scholar] [CrossRef]
  10. Maciel, V.G.; Zortea, R.B.; Grillo, I.B.; Lie Ugaya, C.M.; Einloft, S.; Seferin, M. Greenhouse gases assessment of soybean cultivation steps in southern Brazil. J. Clean. Prod. 2016, 131, 747–753. [Google Scholar] [CrossRef]
  11. Matsuura, M.I.S.F.; Dias, F.R.T.; Picoli, J.F.; Lucas, K.R.G.; de Castro, C.; Hirakuri, M.H. Life-cycle assessment of the soybean-sunflower production system in the Brazilian Cerrado. Int. J. Life Cycle Assess. 2017, 22, 492–501. [Google Scholar] [CrossRef] [Green Version]
  12. ISO 14040:2006; Environmental Management—Life Cycle Assessment—Principles and Framework (ISO 14040). ISO: Geneva, Switzerland, 2006.
  13. Raucci, G.S.; Moreira, C.S.; Alves, P.A.; Mello, F.F.C.; Frazão, L.D.A.; Cerri, C.E.P.; Cerri, C.C. Greenhouse gas assessment of Brazilian soybean production: A case study of Mato Grosso State. J. Clean. Prod. 2015, 96, 418–425. [Google Scholar] [CrossRef]
  14. Cavalett, O.; Ortega, E. Integrated environmental assessment of biodiesel production from soybean in Brazil. J. Clean. Prod. 2010, 18, 55–70. [Google Scholar] [CrossRef]
  15. Lehuger, S.; Gabrielle, B.; Gagnaire, N. Environmental impact of the substitution of imported soybean meal with locally-produced rapeseed meal in dairy cow feed. J. Clean. Prod. 2009, 17, 616–624. [Google Scholar] [CrossRef] [Green Version]
  16. Silva, V.P.; van der Werf, H.M.G.; Spies, A.; Soares, S.R. Variability in environmental impacts of Brazilian soybean according to crop production and transport scenarios. J. Environ. Manag. 2010, 91, 1831–1839. [Google Scholar] [CrossRef]
  17. Knoope, M.M.J.; Balzer, C.H.; Worrell, E. Analysing the water and greenhouse gas effects of soya bean-based biodiesel in five different regions. GCB Bioenergy 2019, 11, 381–399. [Google Scholar] [CrossRef]
  18. Selvaraj, A.; Gautam, J.; Verma, S.; Verma, G.; Jain, S. Life cycle sustainability assessment of crops in India. Curr. Res. Environ. Sustain. 2021, 3, 10074. [Google Scholar] [CrossRef]
  19. Brito, T.R.C.; Aranha, J.T.M.; Fernandes-Silva, A.A.; Santos, L.A.C.; Fragoso, R.M.S. A review and analysis of life cycle assessment tendencies in the Brazilian soybean supply chain. Biol. Environ. Proc. R. Ir. Acad. 2022, 122, 53–65. [Google Scholar] [CrossRef]
  20. SEARATES. Online Freight Shipping & Transit Time Calculator. 2023. Available online: https://www.searates.com/es/services/distances-time/ (accessed on 30 May 2023).
  21. INMET—Instituto Nacional de Meteorologia. Meteorological Database of INMET. Available online: https://bdmep.inmet.gov.br/ (accessed on 29 March 2021).
  22. ISO 14044:2006/Amd 1:2017; Environmental Management—Life Cycle Assessment—Requirements and Guidelines (ISO 14044). ISO: Geneva, Switzerland, 2006.
  23. Yan, Y.; Jarvie, S.; Liu, Q.; Zhang, Q. Effects of fragmentation on grassland plant diversity depend on the habitat specialization of species. Biol. Conserv. 2022, 275, 109773. [Google Scholar] [CrossRef]
  24. Yang, Y.; Li, T.; Pokharel, P.; Liu, L.; Qiao, J.; Wang, Y.; An, S.; Chang, S. Global effects on soil respiration and its temperature sensitivity depend on nitrogen addition rate. Soil Biol. Biochem. 2022, 174, 108814. [Google Scholar] [CrossRef]
  25. Zilli, E.; Campo, R.J.; Hungria, M. Eficácia da inoculação de Bradyrhizobium em pré-semeadura da soja. Pesqui. Agropecuária Bras. 2010, 45, 335–338. [Google Scholar] [CrossRef]
  26. Novaes, R.M.L.; Pazianotto, R.A.A.; Brandão, M.; Alves, B.J.R.; May, A.; Folegatti-Matsuura, M.I.S. Estimating 20-year land use change and derived CO2 emissions associated with crops, pasture and forestry in Brazil and each of its 27 states. Glob. Chang. Biol. 2017, 23, 3716–3728. [Google Scholar] [CrossRef]
  27. Faist Emmenegger, M.; Reinhard, J.; Zah, R. Sustainability Quick Check for Biofuels—Intermediate Background Report; Agroscope Reckenholz-Tänikon: Dübendorf, Switzerland, 2009. [Google Scholar]
  28. Nemecek, T.; Schnetzer, J. Methods of Assessment of Direct Field Emissions for LCIs of Agricultural Production Systems, Data v3.0; Agroscope Recknholz-Tänikon Research Station ART: Zurich, Switzerland, 2012. [Google Scholar]
  29. Biaggioni, M.A.M.; Bovolenta, F.C. Comparative energy analysis for soybean journey transport. Eng. Agrícola 2010, 30, 587–599. [Google Scholar] [CrossRef]
  30. Wang, Z.; Ma, S.; Sun, B.; Wang, F.; Huang, J.; Wang, X.; Bao, Q. Effects of thermal properties and behavior of wheat starch and gluten on their interaction: A review. Int. J. Biol. Macromol. 2021, 177, 474–484. [Google Scholar] [CrossRef]
  31. Silva, G.F.; Calonego, J.C.; Luperini, B.C.O.; Chamma, L.; Alves, E.R.; Rodrigues, S.A.; Putti, F.F.; Silva, V.M.; Silva, M.A. Soil-plant relationships in soybean cultivated under conventional tillage and long-term no-tillage. Agronomy 2022, 12, 697. [Google Scholar] [CrossRef]
  32. Zhang, L.; Buatois, L.; Mángano, M. Potential and problems in evaluating secular changes in the diversity of animal-substrate interactions at ichnospecies rank. Terra Nova 2022, 34, 433–440. [Google Scholar] [CrossRef]
  33. Sun, J.; Jia, Q.; Li, Y.; Zhang, T.; Chen, J.; Ren, Y.; Dong, K.; Xu, S.; Shi, N.; Fu, S. Effects of Arbuscular Mycorrhizal Fungi and Biochar on Growth, Nutrient Absorption, and Physiological Properties of Maize (Zea mays L.). J. Fungi 2022, 8, 1275. [Google Scholar] [CrossRef] [PubMed]
  34. SEDEME—Secretaria de Estado de Desenvolvimento Econômico, Mineração e Energia. Relatório de Impacto Ambiental, Ferrovia Paraense S.A. 2017. Available online: https://www.semas.pa.gov.br/wp-content/uploads/2017/06/rima/RIMA_FerroviaParaenseSA.pdf (accessed on 2 December 2022).
  35. CARGILL. Relatório de Impacto Ambiental, Terminal de Uso Privado—TUP Abaetetuba. 2018. Available online: https://www.semas.pa.gov.br/wp-content/uploads/2019/07/RIMA_TUP_Abaetetuba.pdf (accessed on 2 October 2022).
  36. LDC—Louis Dreyfus Company. Relatório de Impacto Ambiental, Terminal de Uso Privado—TUP Rio Pará. Available online: https://www.semas.pa.gov.br/wp-content/uploads/2012/12/RIMA-TUP-LDC-PONTA-DE-PEDRAS.pdf (accessed on 2 October 2022).
  37. Brito, T.C.B.; Lima, J.R.S.; Oliveira, C.L.; Souza, R.M.S.; Antonino, A.C.D.; Medeiros, E.V.; Souza, E.S.; Alves, E.M. Mudanças no uso da terra e efeito nos componentes do balanço hídrico no agreste pernambucano. Rev. Bras. Geogr. Física 2020, 13, 870–886. [Google Scholar] [CrossRef]
  38. Cederberg, C.; Henriksson, M.; Berglund, M. An LCA researcher’s wish list—Data and emission models need to improve LCA studies of animal production. Animal 2013, 7, 212–219. [Google Scholar] [CrossRef] [PubMed] [Green Version]
  39. ABIOVE—Associação Brasileira das Indústrias de Óleos Vegetais. Soy Moratorium—12th Year Report, Cropping 2018/19. 2020. Available online: https://www.abiove.org.br/relatorios/moratoria-da-soja-relatorio-12o-ano/ (accessed on 15 April 2021).
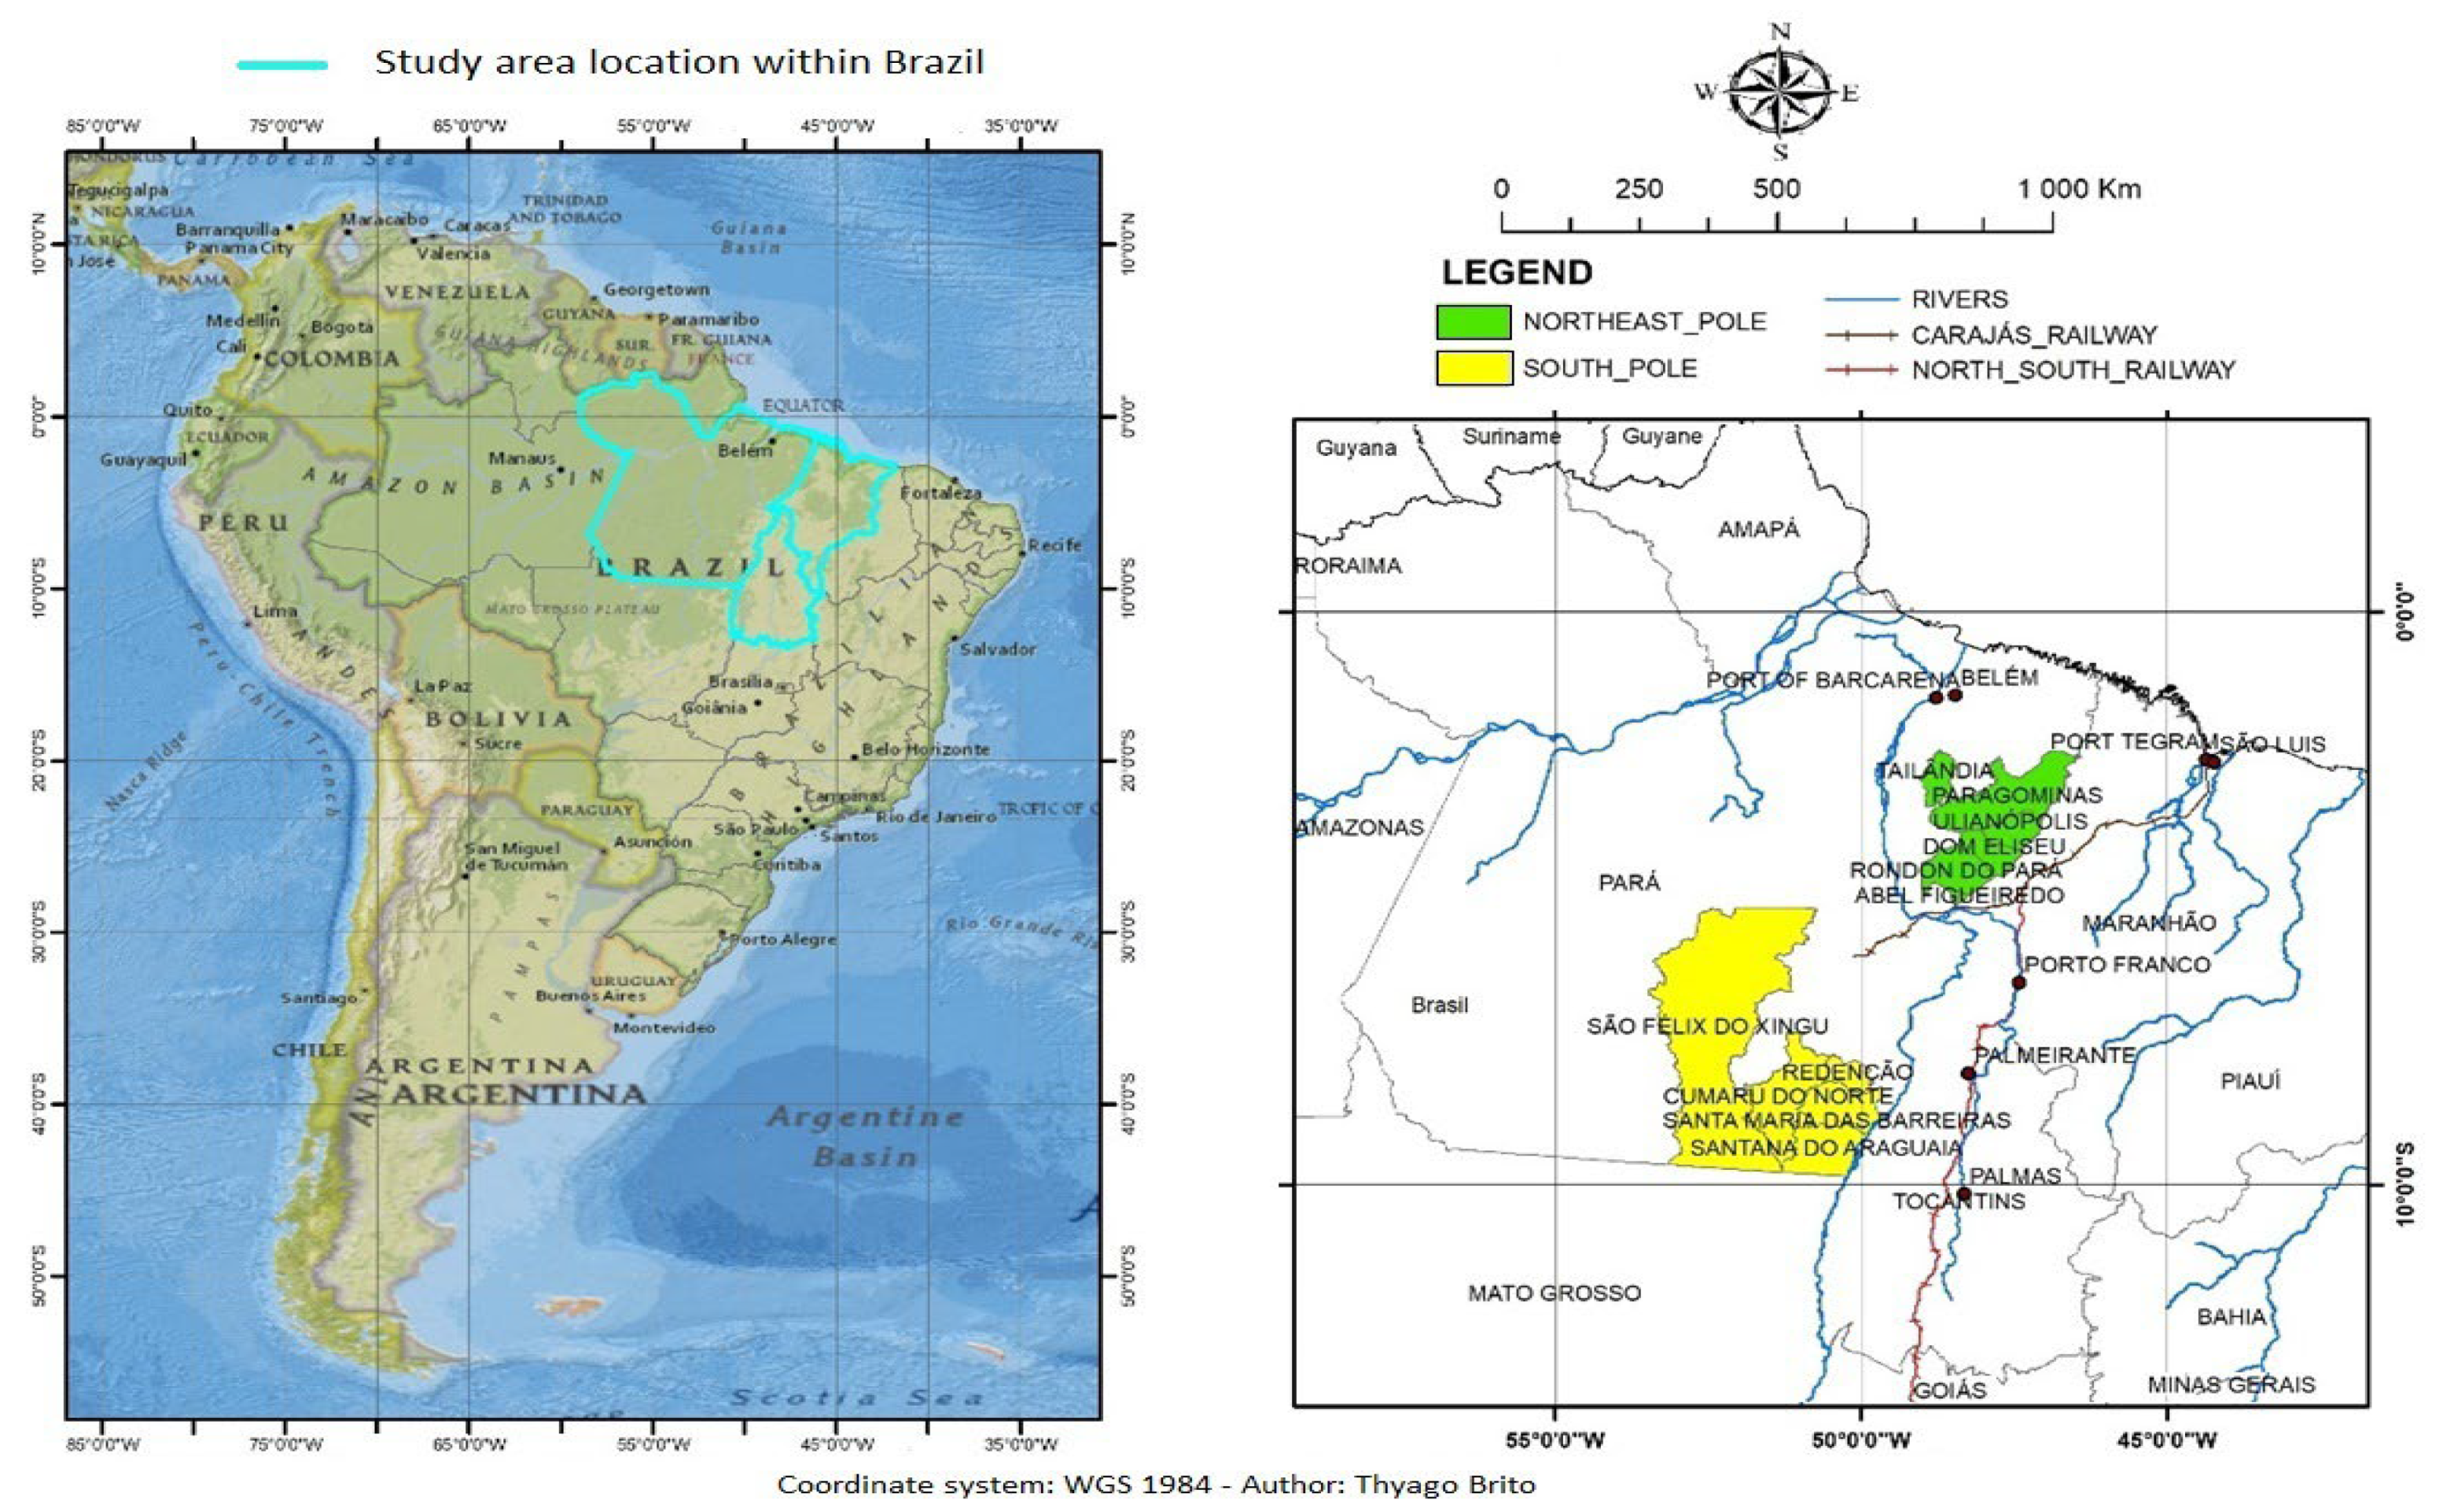
Figure 1. Map of study areas and export corridors of the soybean crop from the state of Pará, Brazil.
Agronomy 13 01648 g001
Figure 2. VLI’s train on the Carajás railway (EFC) transporting soybeans to the port of Itaqui (TEGRAM), located in São Luis, state of Maranhão, Brazil.
Agronomy 13 01648 g002
Figure 3. Supply chain flowchart for the life cycle of soybean crops. Source: adapted from [19].
Agronomy 13 01648 g003
Figure 4. Climate change (GWP 20a) emissions from soybean transportation using IPCC 2013 method.
Agronomy 13 01648 g004
Figure 5. Climate change (GWP 20a) emissions from sea transportation for one tonne of soybeans shipped from ports of origin to ports of destination using IPCC 2013 method. BAR-RMT = Barcarena-PA-BR to Rotterdam-NL; BAR-SHA = Barcarena-PA-BR to Shanghai-CN; SLZ-RMT = São Luis-MA-BR to Rotterdam-NL; SLZ-SHA = São Luis-MA-BR to Shanghai-CN; via PAC = Panama Canal; via CAB = Cape of Good Hope.
Agronomy 13 01648 g005
Figure 6. Soybean (first crop) in vegetative stage sown under corn straw in a no-tillage system in Rondon do Pará and Dom Eliseu, state of Pará, Brazil.
Agronomy 13 01648 g006
Table 1. Travelling distances (km) and models, and port of shipment.
Pole OriginRoad Distance (km)Multimodal PlatformRailway Distance (km)Total Distance Travelled (km)Port of Shipment
Paragominas (PGM)351 351BAR-PA 3
Paragominas (PGM)406Porto Franco-MA 17831189SLZ-MA 4
Redenção (RDX)827 827BAR-PA 3
Redenção (RDX)305Palmeirante-TO 210011306SLZ-MA 4
1 Transshipment in Porto Franco, state of Maranhão; 2 Transshipment in Palmeirante, state of Tocantins; 3 Barcarena, state of Pará; 4 São Luis, state of Maranhão.
Table 2. Distances of sea transportation of soybeans to the Port of Rotterdam (the Netherlands) and Port of Shanghai (China) from Brazilian ports (Barcarena, Pará and Itaqui, São Luís, Maranhão).
Port of Origin (Export)Port of Destination (Foreign)RouteSea Transport Distance (km)
BAR-PA, BR 1RTM, NL 3 7808
BAR-PA, BR 1SHA, CN 4Via PAC 520,848
BAR-PA, BR 1SHA, CN 4Via CAB 622,083
SLZ-MA, BR 2RTM, NL 3 7658
SLZ-MA, BR 2SHA, CN 4Via PAC 521,221
SLZ-MA, BR 2SHA, CN 4Via CAB 621,531
1 Barcarena, state of Pará; 2 São Luis, state of Maranhão; 3 Rotterdam, the Netherlands; 4 Shanghai, China; 5 Panama Canal; 6 Cape of Good Hope.
Table 3. Input and output of soybean production systems in the state of Pará, Brazil (FU 1 kg of soybean).
InputAmountOutputAmount
Application of plant protection product by field sprayer0.00258 haAmmonia (NH3)0.00028 kg
Combine harvesting0.00030 haDinitrogen monoxide (N2O)0.00063 kg
Fertilising, by broadcaster0.00030 haNitrate0.02804 kg
Sowing0.00030 haNitrogen oxides0.00013 kg
Tillage, harrowing, by spring tine harrow0.00028 haCarbon dioxide, fossil0.02502 kg
Tillage, ploughing0.00010 ha2,4-D0.00045 kg
Transport, tractor and trailer, agricultural0.01570 t kmAcetamiprid2.65000 × 10−5 kg
Soybean seed, for sowing0.01280 kgFenpropathrin1.70000 × 10−5 kg
Lime0.04929 kgFluazinam0.00011 kg
Urea, as N0.00212 kgGlyphosate0.00061 kg
Phosphate fertiliser, as P2O50.03576 kgMancozeb0.00034 kg
Phosphate Rock, as P2O5, beneficiated, dry0.00212 kgProthioconazol2.65000 × 10−5 kg
Potassium chloride, as K2O0.03030 kgPyraclostrobin (prop)2.52300 × 10⁻⁵ kg
Occupation, annual crop, non-irrigated, intensive3.25298 m2 yearPyriproxyfen7.60000 × 10−6 kg
Transformation, from annual crop, non-irrigated3.03030 m2Phosphorus0.00128 kg
Transformation, to annual crop, non-irrigated, intensive3.03030 m2Thiophanate-methyl0.00011 kg
Energy, gross calorific value, in biomass20.5000 MJTrifloxystrobin2.27000 × 10−5 kg
Carbon dioxide, in air1.37808 kgSoybean production1 kg
2,4-dichlorophenol0.00045 kg
Pesticide, unspecified7.44300 × 10−5 kg
Pyrethroid-compound1.70000 × 10−5 kg
Pyridine-compound0.00012 kg
Glyphosate0.00061 kg
Mancozeb0.00034 kg
Triazine-compound2.65000 × 10−5 kg
[Sulfonyl] urea-compound0.00011 kg
Table 4. Life cycle impact assessment (LCIA) results at recipe midpoint (H) (FU 1 kg of soybean).
Impact CategoryUnitTotal EmissionsMain Hotspot
Agricultural land occupation (ALOP)m2 year3.25298 × 100PS = 3.25298 × 100 (100%)
Climate change (GWP100)kg CO2-Eq4.83120 × 10−1PS = 2.11540 × 10⁻¹ (43.8%)
Freshwater ecotoxicity (FETPinf)kg 1,4-DCB-Eq1.99383 × 10−2PS = 1.946 × 10⁻² (95.4%)
Freshwater eutrophication (FEP)kg P-Eq1.89967 × 10−4PS = 1.011 × 10⁻⁴ (53.2%)
Human toxicity (HTPinf)kg 1,4-DCB-Eq1.09150 × 10−1MFPF = 4.81 × 10⁻² (44.1%)
Ionising radiation (IRP_HE)kg U235-Eq1.97907 × 10−2MFPF = 8.14 × 10⁻³ (41.1%)
Marine ecotoxicity (METPinf)kg 1,4-DCB-Eq2.42444 × 10−3PS = 1.429 × 10⁻³ (58.9%)
Marine eutrophication (MEP)kg N-Eq7.10465 × 10−3PS = 6.413 × 10⁻³ (90.2%)
Ozone depletion (ODPinf)kg CFC-11-Eq2.82500 × 108MFCH = 7.59 × 10⁻⁹ (26.9%)
Particulate matter formation (PMFP)kg PM10-Eq9.67280 × 10−3MFPF = 3.24 × 10⁻⁴ (29.6%)
Photochemical oxidant formation (POFP)kg NMVOC-Eq2.03110 × 10−3MFCH = 6.67 × 10⁻³ (32.8%)
Terrestrial acidification (TAP100)kg SO2-Eq2.57782 × 10−3PS = 7.623 × 10⁻⁴ (29.6%)
Terrestrial ecotoxicity (TETPinf)kg 1,4-DCB-Eq1.32600 × 10−2PS = 1.243 × 10⁻² (93.7%)
PS = production system; MFPF = market for phosphate fertiliser; MFCH = market for combined harvesting.
Table 5. LUC and estimated scenarios of CO2 emissions between 1999 and 2018 in the state of Pará.
Soybean Crop Expansion (%)ScenariosEmissions (tCO2 Eq·ha−1·yr−1)T0 Soy (ha), Pre-Existent 1999T1 Soy (ha), 1st Season 2018ArablePermanent CropsUnspecified, Natural
Min.3.81238545,227455,187 (84%)38,523 (7%)50,279 (9%)
100Pro.30.351238545,22736,811 (7%)3115 (1%)504,063 (92%)
Max.32.691238545,227543,989 (100%)
Source: adapted from [26].
Disclaimer/Publisher’s Note: The statements, opinions and data contained in all publications are solely those of the individual author(s) and contributor(s) and not of MDPI and/or the editor(s). MDPI and/or the editor(s) disclaim responsibility for any injury to people or property resulting from any ideas, methods, instructions or products referred to in the content.