Article

Optimization of Nitrogen Fertilizer Management in the Yellow River Irrigation Area Based on the Root Zone Water Quality Model

1
School of Water Conservancy, North China University of Water Resources and Electric Power, Zhengzhou 450046, China
2
Collaborative Innovation Center for the Efficient Utilization of Water Resources, Zhengzhou 450046, China
*
Author to whom correspondence should be addressed.
Agronomy 2023, 13(6), 1628; https://doi.org/10.3390/agronomy13061628
Submission received: 16 May 2023 / Revised: 12 June 2023 / Accepted: 14 June 2023 / Published: 17 June 2023
(This article belongs to the Section Water Use and Irrigation)

Abstract

:
Strategic management of nitrogen fertilizers can not only mitigate agricultural nitrogen pollution but also significantly enhance crop yield and nitrogen use efficiency. This study was designed to determine the optimal nitrogen fertilizer management strategy for the Yellow River irrigation area. Leveraging two years of field data related to soil water nitrogen and summer maize growth indices, parameters for the Root Zone Water Quality Model 2 (RZWQM2) were calibrated and validated. Subsequently, various scenarios were generated to simulate the impacts of different nitrogen application rates and basal chasing ratios on summer maize yield, nitrogen agronomic efficiency, nitrogen physiological efficiency, and nitrogen apparent recovery rate. The Technique for Order of Preference by Similarity to Ideal Solution (TOPSIS) method was employed for a comprehensive evaluation. RZWQM2 can effectively simulate the dynamic changes in soil moisture and nitrogen in the Yellow River irrigation area, and the results indicated that the mean relative error (MRE) between the simulated and observed values varied from 5.77% to 14.09%, and 4.36% to 33.01%, while the root mean square error (RMSE) ranged from 0.016 to 0.037 cm3/cm3, and 0.111 to 1.995 mg/kg. The normalized root mean square error (NRMSE) varied between 6.20% to 14.42% and 5.24% to 17.84%, respectively. The results validate the model’s effectiveness in simulating summer maize yields and nitrogen metrics under varying nitrogen fertilizer management practices. A nitrogen application rate of 180–200 kg/hm2 (expressed in terms of pure nitrogen) in the Yellow River irrigation area could adequately meet the requirements for summer maize production. The recommended nitrogen fertilizer management strategy in the Yellow River irrigation area involves applying 200 kg/hm2 of nitrogen in a 1:2:1 ratio during the sowing, trumpeting, and anthesis stages.

1. Introduction

The Yellow River irrigation area, situated in the Yellow River basin in China, boasts a rich history of cultivation and supports a wide variety of crops, rendering it a prominent grain base and agricultural demonstration site in the country. In recent years, the government’s promotion of water conservation concepts and implementation of relevant policies have effectively mitigated the wastage of water resources in agriculture. Nevertheless, the annual fertilizer usage in agricultural production considerably surpasses the internationally accepted safe upper limit for fertilizer application, resulting in persistently low fertilizer utilization efficiency in China [1]. Excessive fertilizer application leads to reduced economic efficiency due to diminished crop quality, and poses the risk of irreversible ecological damage [2,3]. Consequently, the contemporary goals of nitrogen fertilizer management encompass enhancing agricultural development quality in the Yellow River irrigation area, significantly improving fertilizer use efficiency, minimizing agricultural surface pollution, and preventing further damage to the environment.
A substantial amount of research has been dedicated to the study of nitrogen fertilizer management. Numerous academic studies demonstrate that inadequate nitrogen application leads to stunted growth and insufficient nutrient accumulation within plants [4]. Conversely, an excess of nitrogen can impede light transmission through the maize canopy [5], accelerate leaf senescence [6], and diminish maize yields [7]. Thus, determining the optimal amount of nitrogen application for crops is of paramount importance. Field trials in the sandy soil region of Ningxia, China, conducted by Yan et al. [8], recommend an optimal nitrogen application rate of 300 kg/hm2 considering both yield and environmental benefits. Nevertheless, some researchers have noted that such an application rate does not significantly increase maize yield. Based on a seven-year field trial, Yang et al. [9] proposed that a suitable nitrogen application rate in the Guanzhong Plain should be around 180–200 kg/hm2, taking into account maize yield and nitrogen leaching. Similarly, Huang et al. [10] suggested an optimal nitrogen application rate of 150 kg/hm2 for maize in the Yellow Huaihai Plain, weighing both production and environmental benefits.
These studies reveal that the appropriate nitrogen application amount can vary according to regional differences in climate conditions, soil type, and other factors [11]. Current research on nitrogen fertilization concurs that a split application of nitrogen better accommodates the plant’s growth and developmental needs than a single application. It also significantly mitigates nitrogen pollution in farmland [12,13]. The success of this method largely depends on the timing of each application and the distribution ratio of nitrogen fertilizer. Despite this, there is a dearth of reports on the optimal amount of nitrogen application in the Yellow River irrigation area, and how different periods and rates of nitrogen application affect the yield and physiological traits of maize, as well as its nitrogen use efficiency.
Given the numerous variables involved, conducting such studies can be both time-consuming and labor-intensive, limitations that model simulations can address. The Root Zone Water Quality Model 2 (RZWQM2) incorporates modules on the meteorological environment, field management, soil conditions, and crop growth to simulate and predict soil nitrogen transport [14], optimization of water and nitrogen regimes [15], crop growth conditions [16], and N2O gas emissions [17]. To date, minimal research has explored the application of RZWQM2 for optimizing nitrogen fertilizer management in summer maize in the Yellow River irrigation area, and its suitability for this region remains uncertain.
This study first determines and validates the model’s relevant parameters using field measurement data, then employs the validated model to simulate various nitrogen application scenarios to investigate the impacts of different nitrogen fertilizer management strategies on maize yield and nitrogen use efficiency. Combining the Technique for Order of Preference by Similarity to Ideal Solution (TOPSIS) method, suitable nitrogen fertilizer management strategies are identified to provide scientific guidance for reducing nitrogen pollution and fostering sustainable agricultural development in the region.

2. Materials and Methods

2.1. Overview of the Experimental Area

The study site is situated at the North China University of Water Resources and Hydropower Agricultural Efficient Water Use Test Site in Zhengzhou (34.78° N, 113.76° E, 110 m above sea level). This region experiences a warm temperate continental monsoonal humid climate with high temperatures and rainfall in the summer (accounting for approximately 70% of annual rainfall) and low rainfall in spring and winter. The area has an average annual temperature of 14.3 to 14.8 °C, an average sunshine duration of 6.57 h/d, and an average annual rainfall of 584 to 667 mm. The test area’s location is depicted in Figure 1. The test site has a flat terrain and sandy loam soil texture, with the corresponding physicochemical properties and mechanical composition of the soil presented in Table 1. The average soil organic matter (13.6 g/kg), readily available potassium (104.4 mg/kg), readily available phosphorus (11.8 mg/kg), and total nitrogen (1.21 g/kg) in the 0–100 cm soil layer is illustrated in Figure 2.

2.2. Experimental Design

The experiment was conducted from June 2021 to September 2022, with summer maize as the cultivated crop. Three levels of nitrogen (all nitrogen values mentioned below are in pure nitrogen form) were applied: 120 kg/hm2 (N120), 220 kg/hm2 (N220), and 320 kg/hm2 (N320). The N fertilizer used was urea (46.3% nitrogen). In addition to the corresponding 60 kg/hm2 of nitrogen, 60 kg/hm2 of P2O5 and 60 kg/hm2 of K2O were also applied. Nitrogen was applied at jointing (P1), trumpeting (P2), and anthesis (P3) stages, and mixed with water in the field. The experiment utilized a two-factor, three-level split-zone design (Table 2), supplemented by a control CK, with no nitrogen fertilizer applied throughout the reproductive period. This resulted in a total of 10 treatments, with each treatment replicated thrice.

2.3. Measurement and Calculation of Observation Indicators

2.3.1. Soil Moisture Measurement

Soil moisture determination primarily involves assessing the volumetric moisture content of the soil using the drying method to measure the moisture content of the 0–100 cm soil layer, with one soil layer every 20 cm, totaling five soil layers. Measurements were taken every 7–10 days, with a one-day extension in case of rainfall.

2.3.2. Soil Nitrogen Determination

Soil nitrogen was primarily measured as soil NO3-N Soil samples were collected using a soil auger before sowing, after harvest, and three days before and after fertilizer application in summer maize, at 20 cm intervals up to 100 cm. Soil samples were then extracted using KCl solution and measured by UV spectrophotometry [18,19].

2.3.3. Measurement of Crop Growth Indicators

The crop growth section focused on determining the phenological stage, above-ground biomass, above-ground nitrogen content, and yield.
Phenological stages: The growth of maize at each reproductive stage was assessed by recording the time of emergence, jointing, flare, anthesis, and maturity under each nitrogen treatment. A crop was considered to have reached that stage of reproduction when 50% of the plots in each treatment exhibited fertility-specific traits.
Above-ground biomass: Three representative plants with uniform growth were selected in each plot at the maturity stage of summer maize, cut along the base of the stalk, bagged separately for leaves, stems, and fruits, placed in an oven, and heated at 105 °C for half an hour. The samples were then dried at 75 °C until constant weight (approximately 48 h) was achieved. The weight of each part of the plant was measured separately and added up to obtain the plant biomass, which was converted in accordance with the planting density to obtain the above-ground biomass of the crop.
Above-ground nitrogen content: Dried and weighed above-ground plant samples of summer maize were first crushed in a grinder, mixed, and passed through a 0.5 mm sieve. The total nitrogen content of the crop was determined using the Kjeldahl method after boiling the samples with H2SO4-H2O2.
Yield: 1 m2 sized plots were allocated to each plot separately at summer maize harvest, and the maize was threshed, dried, and weighed. Finally, the measurements were converted to total maize yield (kg·ha−1).

2.3.4. Calculation of Nitrogen Indicators

The nitrogen indicators were divided into nitrogen agronomic efficiency, nitrogen physiological efficiency, and nitrogen apparent recovery [20], and were calculated as follows:
A E N = Y 1 Y 2 N
P E N = Y 1 Y 2 N u p t a k e , 1 N u p t a k e , 2
R E N = N u p t a k e , 1 N u p t a k e , 2 N
where: AEN refers to nitrogen agronomic efficiency (kg/kg); PEN represents nitrogen physiological efficiency (kg/kg); REN denotes to nitrogen apparent recovery (%); Y1 represents maize yield (kg/hm2) in the nitrogen application zone; Y2 stands for maize yield (kg/hm2) in the non-nitrogen application zone; Nuptake,1 represents above-ground nitrogen content (kg/hm2) in the nitrogen application zone; Nuptake,2 refers to above-ground nitrogen content (kg/hm2) in the non-nitrogen application zone; N represents nitrogen application (kg/hm2).

2.4. Model Introduction

RZWQM2 is a process-based model that operates one-dimensionally (perpendicular to the soil profile). It simulates the interaction between water, nutrients, pesticides, and other elements within agricultural systems and their impact on crop growth. This model comprises six sub-modules: physical processes, soil chemical processes, nutrient processes, pesticide processes, crop growth processes, and management practices processes [21,22]. In the model, the Brooks–Corey equation [23] outlines the soil moisture characteristics curve, while the modified Green–Ampt equation [24] calculates the soil moisture infiltration process. The distribution of soil moisture across each layer is simulated by the Richards equation [25]. The organic matter and nitrogen cycle nutrient sub-model (OMNI), used in the nutrient module, depicts the main nitrogen fate [21]. The DSSAT 4.0 module [26], integrated into RZWQM2, simulates crop growth.

2.5. Input, Calibration, and Evaluation of Model Parameters

The 2021 field trial data was selected for model calibration, and the 2022 experimental data was used for validation. The calibration process followed the model developer’s recommendations [27] for the soil moisture module, soil nutrient module, and crop growth module in that order. First, the measured soil hydraulic parameters were input into the model. The model output was compared with the measured values and manually fine-tuned using the trial-and-error method to improve the simulation of the volumetric soil moisture content and ultimately clarify the physical properties of the soil in the test area (Table 1). Next, the soil nutrient module was calibrated based on the measured soil nitrate-nitrogen data, and the calibrated parameters are shown in Table 3. Finally, the genetic parameters of summer maize were obtained in combination with the model’s PEST conditioning (Table 3).
To accurately evaluate the model’s simulation performance, four statistical tests were chosen for this study: root mean square error (RMSE), normalized root mean square error (NRMSE), mean relative error (MRE), and relative error (RE). During model calibration, NRMSE was employed as a benchmark to classify the simulation results into four categories: NRMSE < 10% (excellent level), 10% < NRMSE < 20% (good level), 20% < NRMSE < 30% (moderate level), and NRMSE > 30% (poor level) [28,29]. RE represents the individual deviation of the system in the forecast, with positive values indicating over-prediction and negative values indicating under-prediction; the closer it is to 0, the better the simulation [30]. The maximum allowable deviation of MRE can reach up to 50% [31]. The calculation formula is as follows:
R M S E = 1 n i = 1 n P i O i 2
N R M S E = R M S E O a v g × 100 %
R E = P i O i O i × 100 %
M R E = 1 n i = 1 n R E i
where: Pi refers to the i-th simulated value, Oi stands for the i-th measured value, Oavg represents the average measured value, and n denotes the number of measured values.

2.6. Construction of the Decision-Making System

2.6.1. Selection of Indicators and Methods

To explore the best nitrogen fertilizer management model, four evaluation indicators were selected for this study: yield, nitrogen agronomic efficiency, nitrogen physiological efficiency, and nitrogen apparent recovery. The method used is the TOPSIS method [32], also known as the approximate ideal solution ranking method, a scientific decision-making method proposed by Hwang and Yoon [33] in 1981, which is commonly used in finite solution, multi-objective decision analysis to find out the positive and negative ideal solutions and the distance between positive and negative ideal solutions by the size of the data, and finally to obtain the relative proximity C value, and combined with the C value ranking (the closer the C value is to 1, the better), so as to arrive at the superior and inferior solution ranking.

2.6.2. General Steps of the TOPSIS Method

The TOPSIS analysis method usually consists of the following 5 steps:
Step 1: Prepare the data to be analyzed and then homotrend the data, setting the processed matrix to A;
A = a 11 a 12 a 1 n a 21 a 22 a 2 n a m 1 a m 2 a m n
Step 2: Normalize (dimensionless) the homotrended data to obtain matrix B;
b i j = a i j min a i j max a i j min a i j
B = b 11 b 12 b 1 n b 21 b 22 b 2 n b m 1 b m 2 b m n
Step 3: Identify the positive ideal solution B+ and the negative ideal solution B;
B + = max 1 i m b i j i = 1 , 2 , , m = b 1 + , b 2 + , , b m +
B = max 1 i m b i j i = 1 , 2 , , m = b 1 , b 2 , , b m
Step 4: Calculation of the distance D+ and the distance D from the evaluation object to the positive ideal solution;
D i + = j = 1 m w j b j + b i j 2
D i = j = 1 m w j b j b i j 2
Step 5: Combine the distance values to calculate a relative proximity C value and rank them.
C i = D i D i + + D i

2.7. Data Analysis

The trial used Excel 2021 and SPSS 26.0 for data analysis, processing, and graphing.

3. Results

3.1. Model Validation

3.1.1. Soil Moisture Module Validation

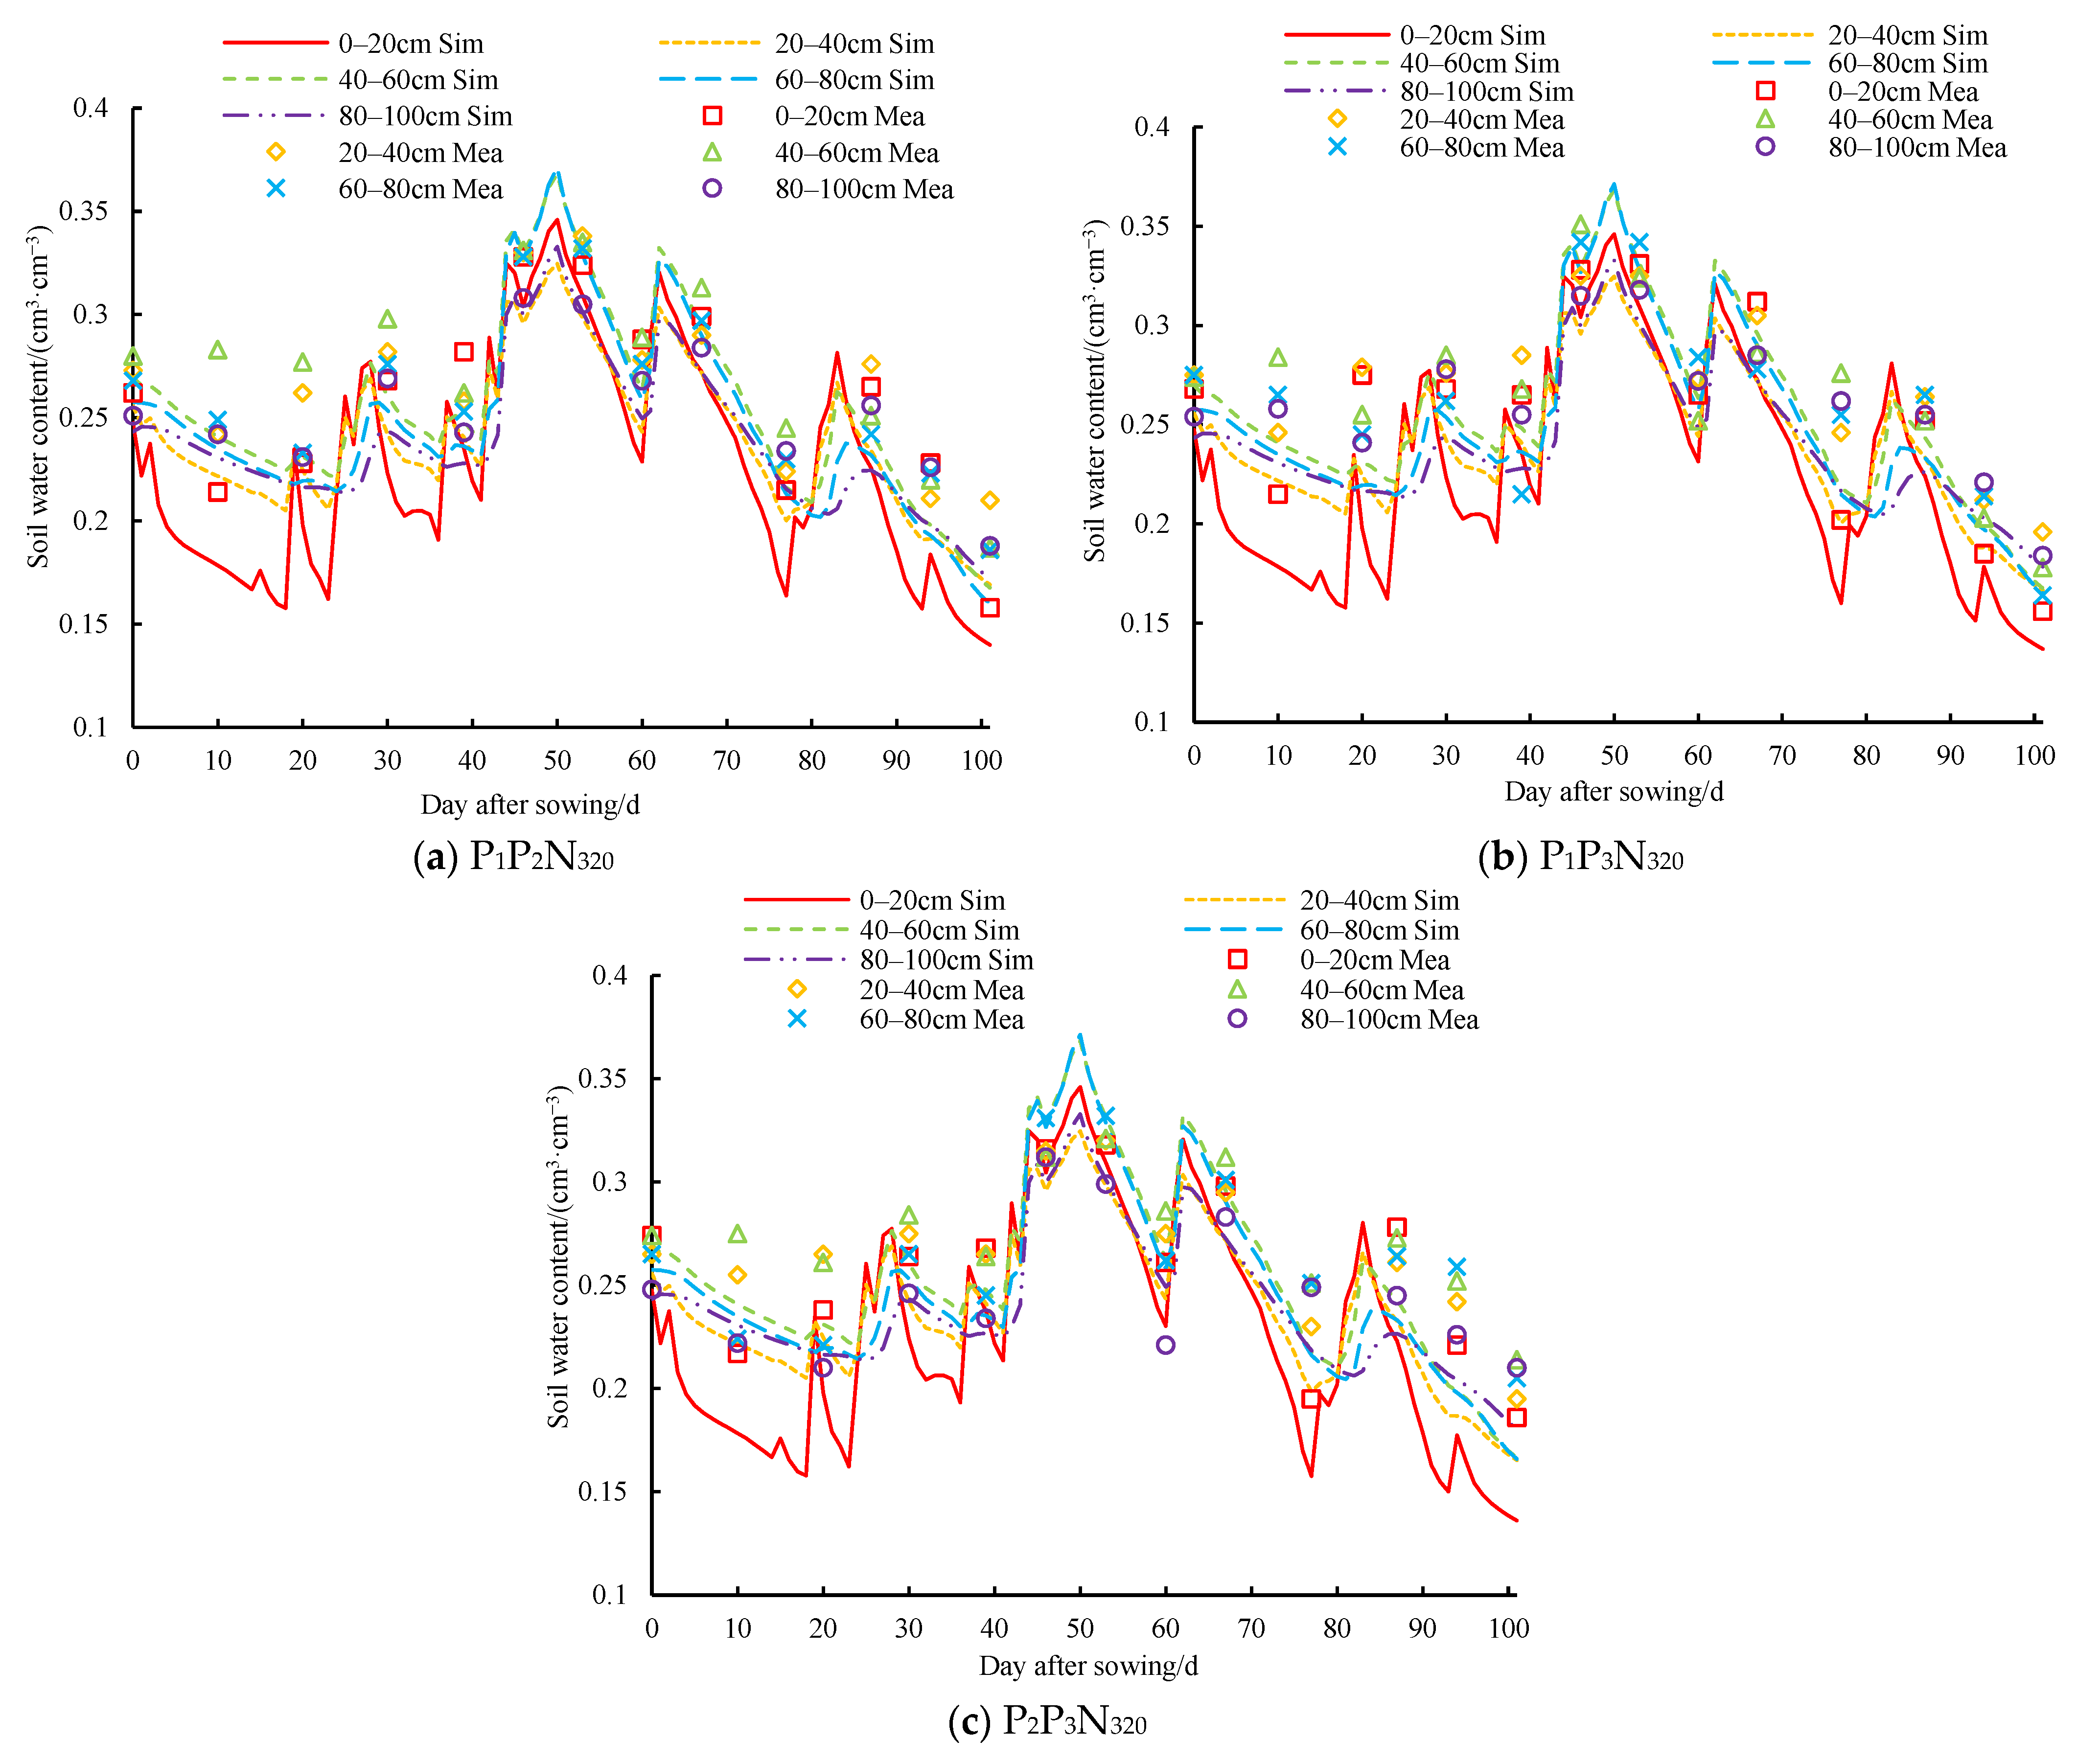
Figure 3 displays the simulated and measured values of soil volumetric water content in the 0–100 cm soil layer under treatments PxPyN320 (x, y = 1, 2, 3, and x < y) in 2022. As observed in Figure 3, the simulated values of volumetric soil moisture content after calibration exhibit a similar trend to the measured values. The influence of the nitrogen application period on volumetric soil moisture content is not apparent under the same nitrogen application rate. The RMSE of simulated and measured values ranged from 0.017 to 0.037 cm3/cm3, MRE values ranged from 5.97% to 14.09%, and NRMSE values ranged from 6.39% to 14.42%. More detailed validation results are provided in Table 4, where the RMSE of simulated and measured values of volumetric water content for different soil layers in each treatment ranged from 0.016 to 0.037 cm3/cm3, MRE values ranged from 5.77% to 14.09%, and NRMSE values ranged from 6.20% to 14.42%. The simulations demonstrate good quality.

3.1.2. Calibration and Validation of the Soil Nutrient Module

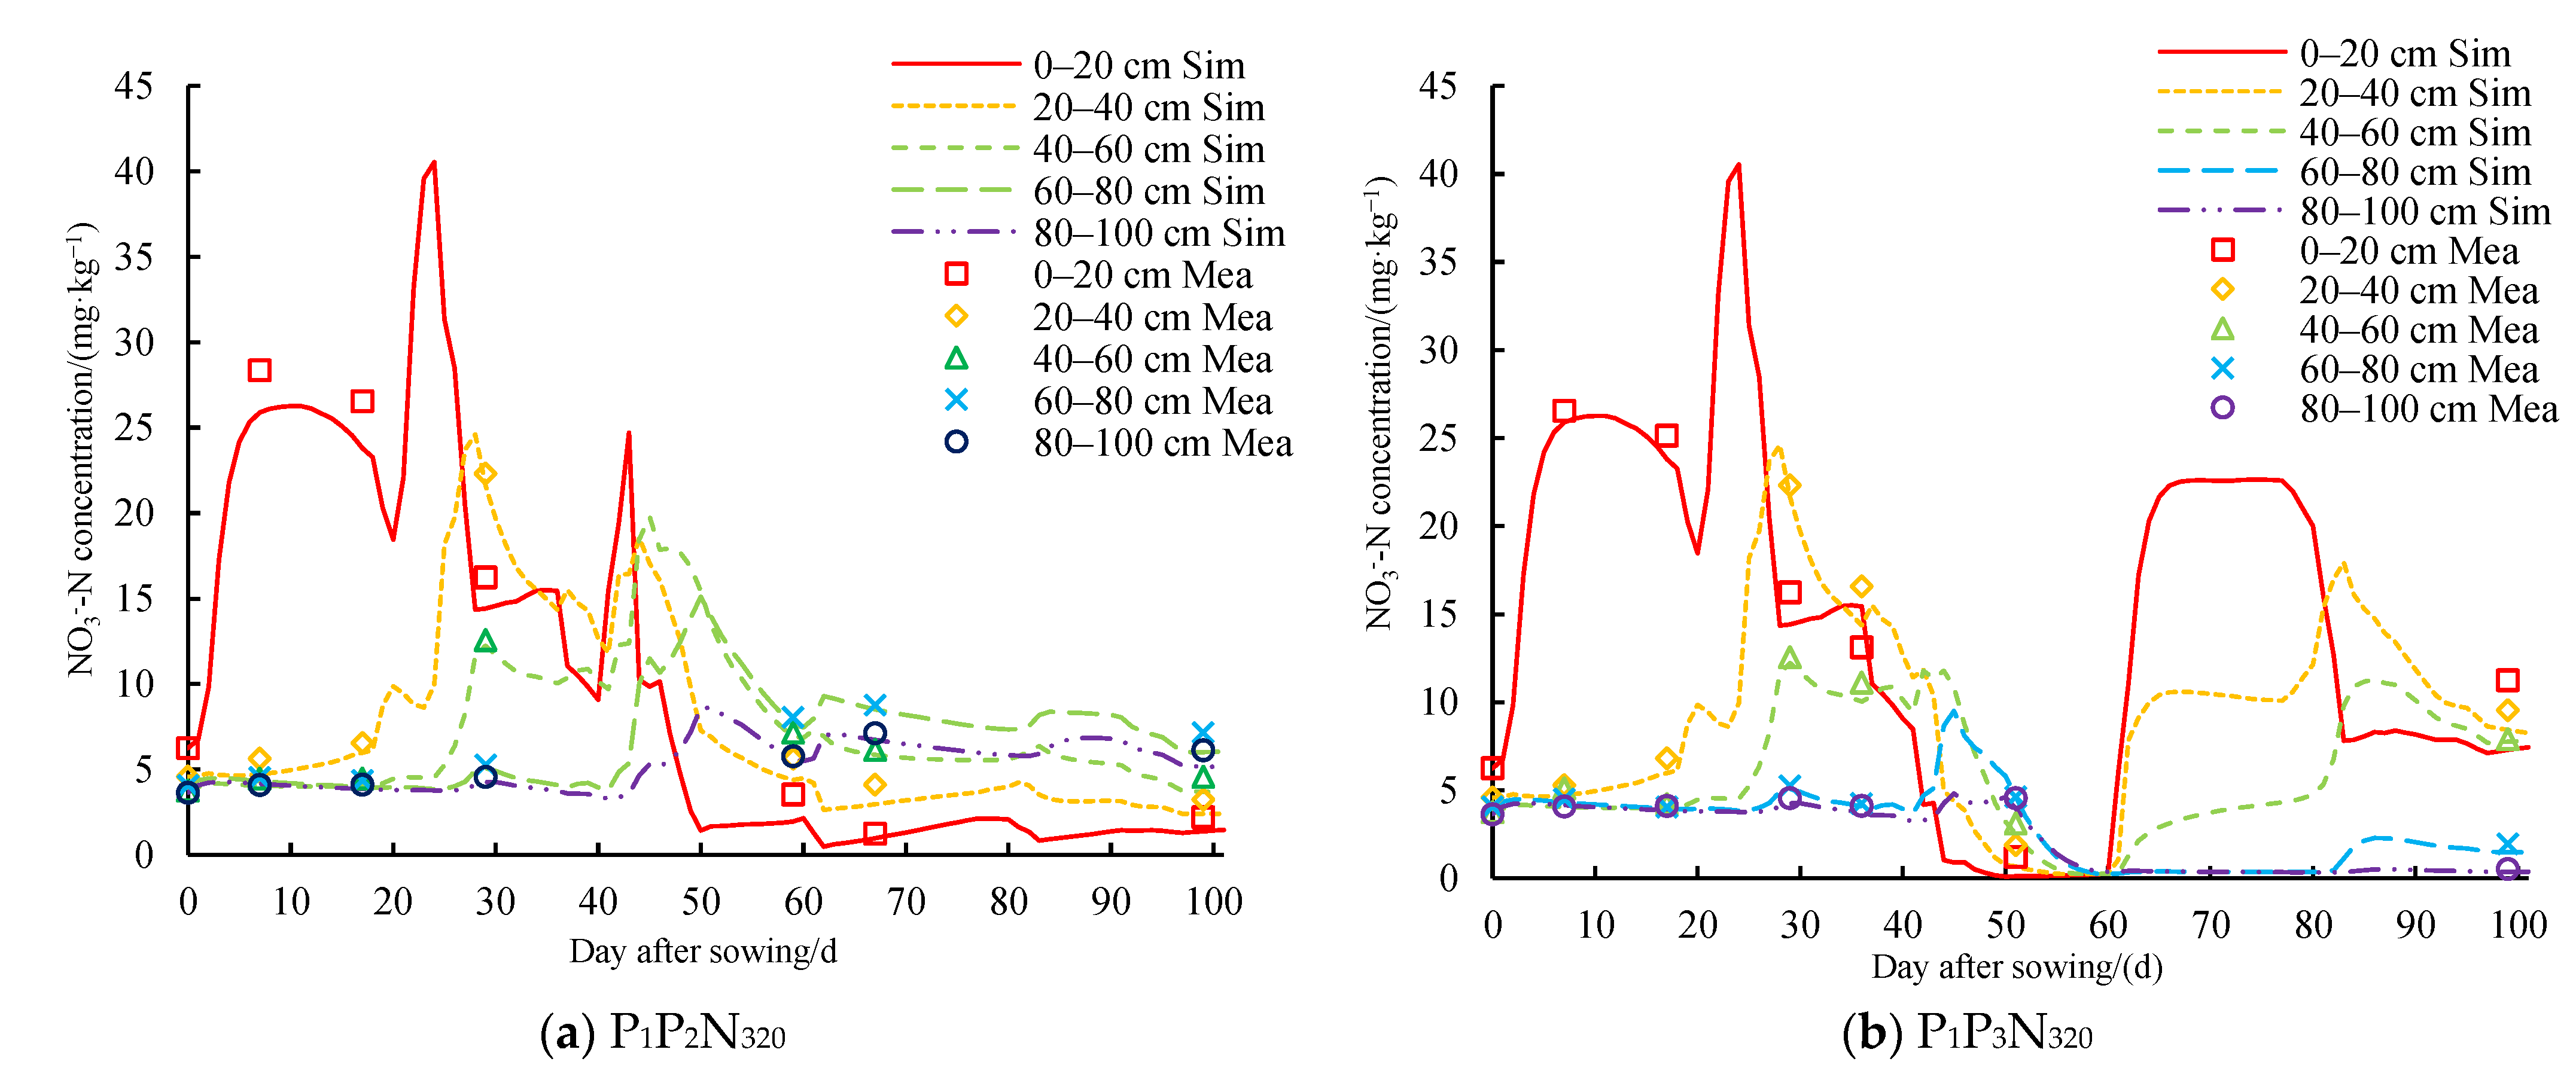
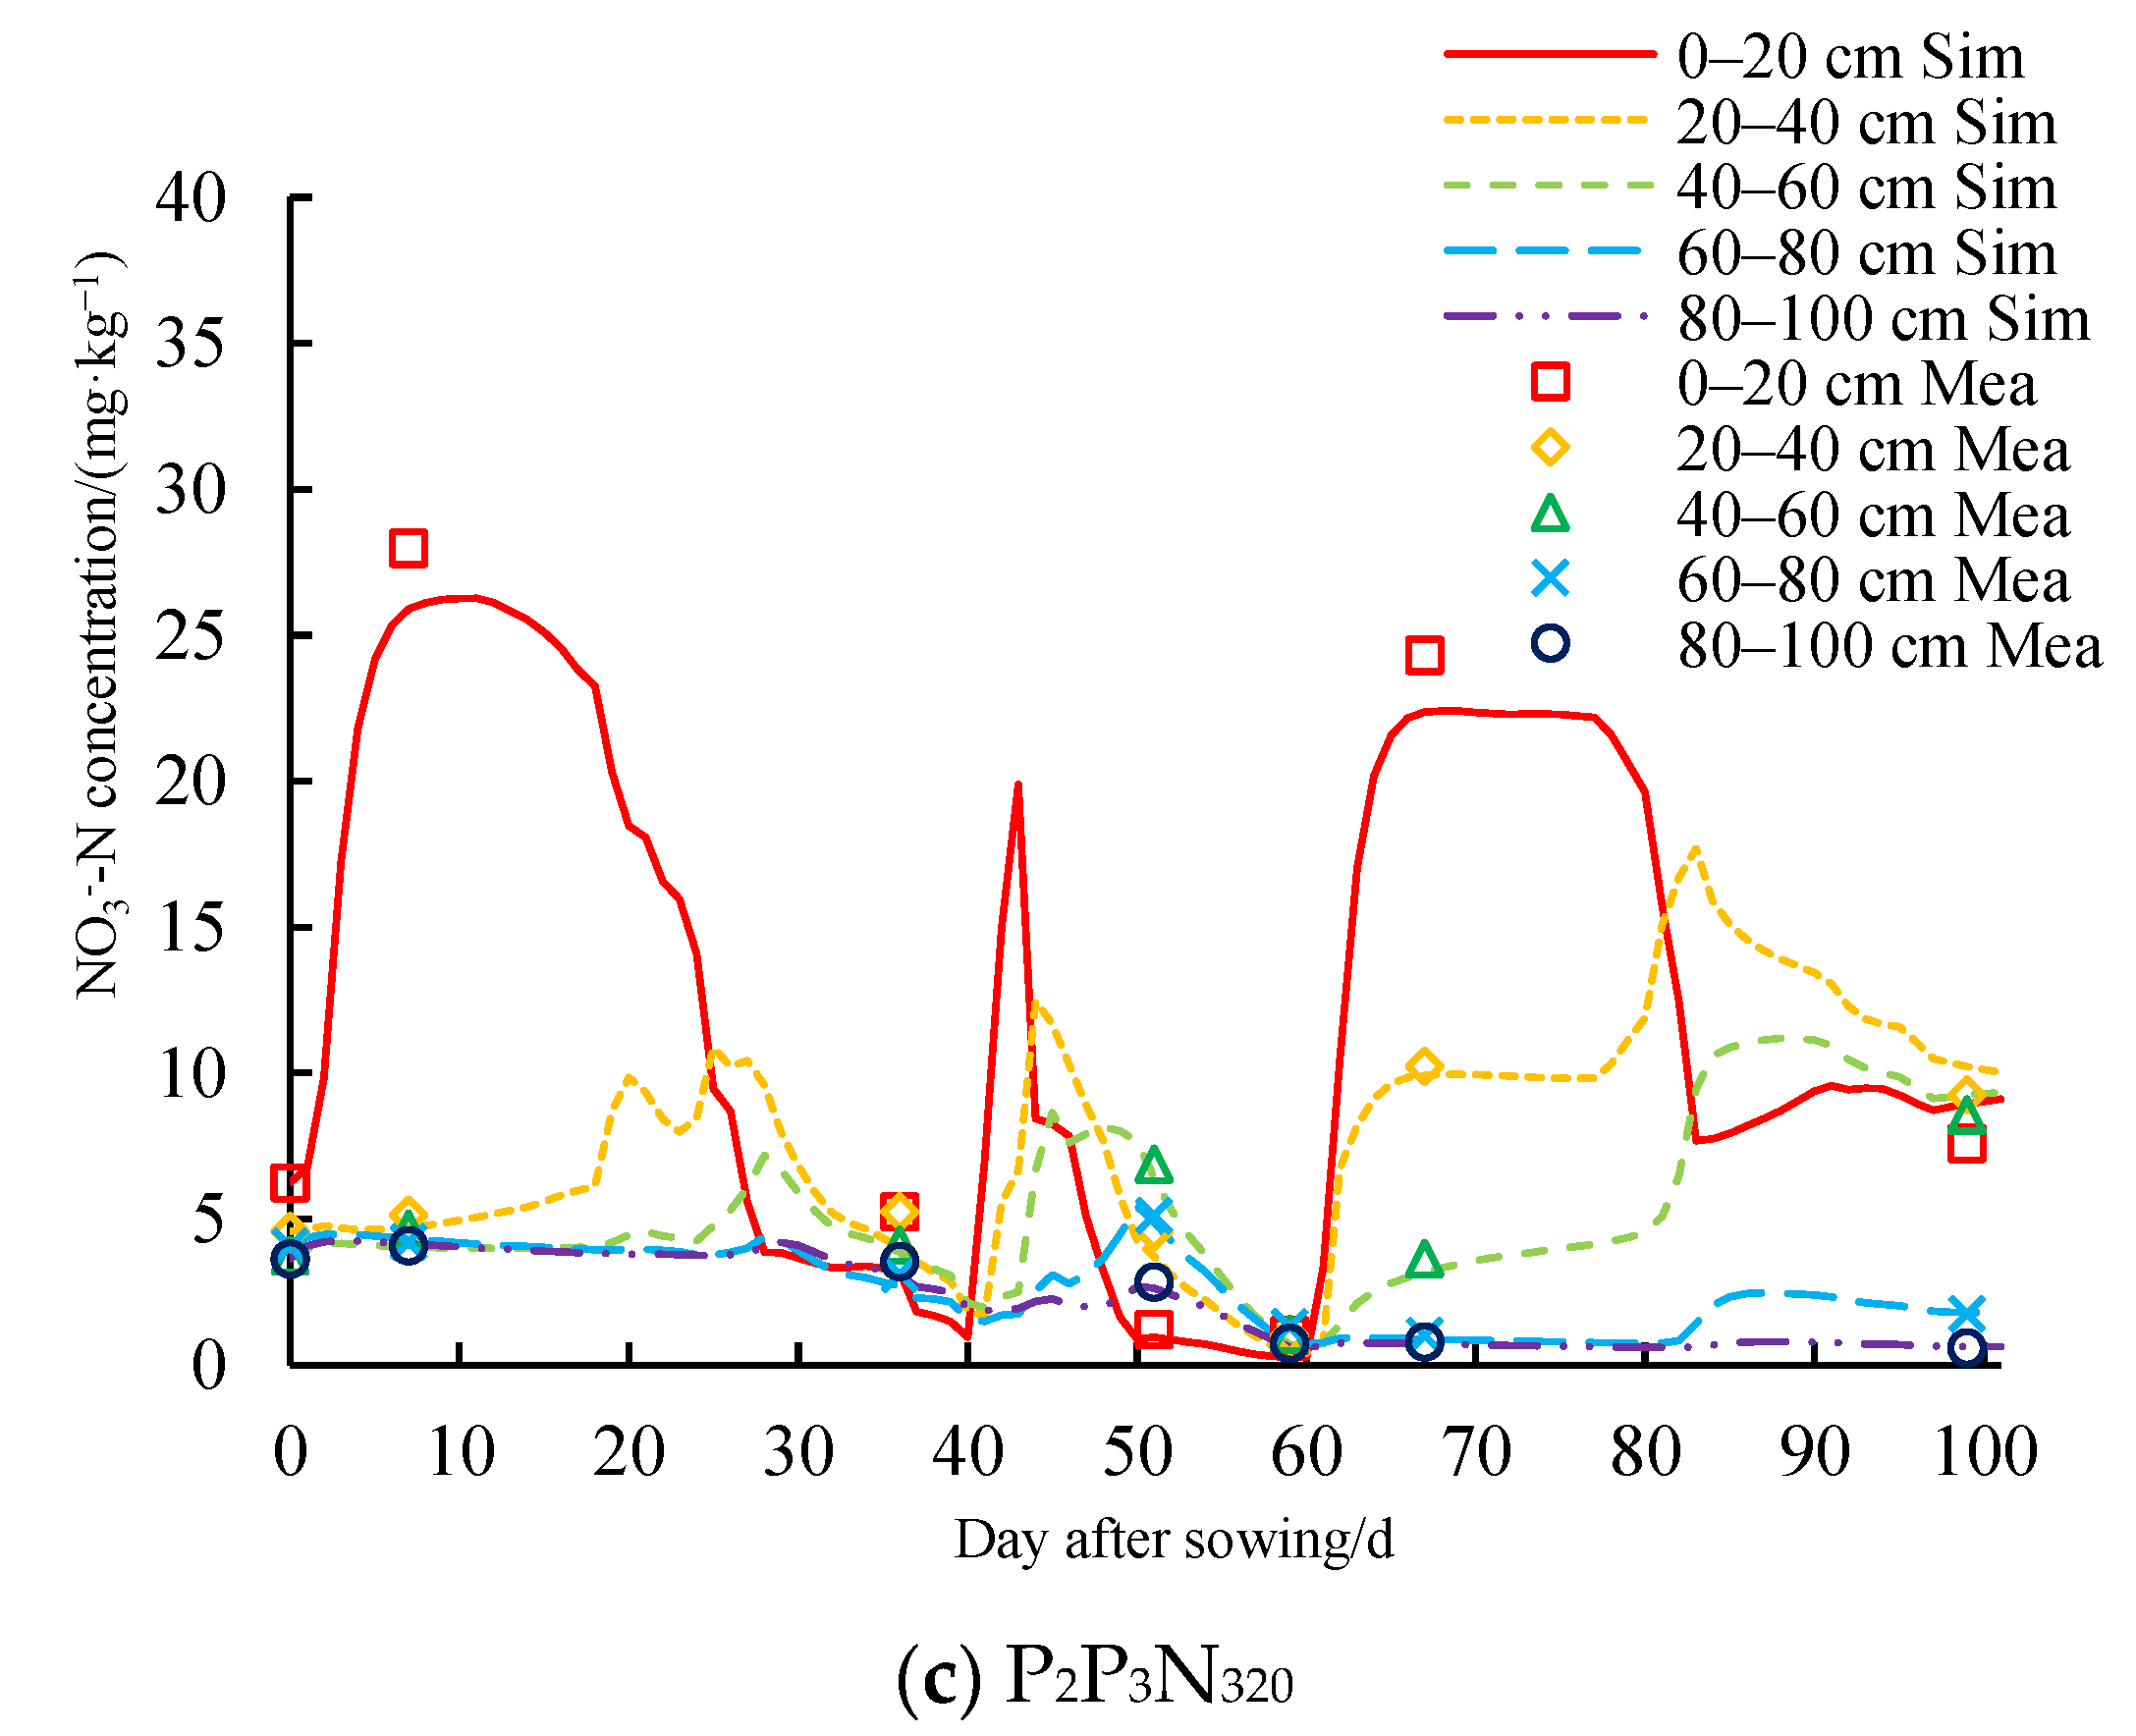
Figure 4 displays the simulated and measured nitrate-nitrogen content of the PxPyN320 (x, y = 1, 2, 3, and x < y) treatment in 2022 during the validation process. With the application of subsoil fertilizer, nitrate nitrogen primarily accumulates in the 0–40 cm soil layer at the onset of summer maize growth. In the absence of additional nitrogen fertilizer input, the nitrate nitrogen in the upper layer is progressively absorbed by maize roots and diminished. Concurrently, nitrate nitrogen in the soil is leached and transported further to deeper soil strata due to sustained rainfall. Table 5 displays the MRE, RMSE, and NRMSE related to the nitrate nitrogen content during the validation process. The simulated values of nitrate nitrogen content across various soil layers under each treatment ranged from 4.36% to 33.01% for MRE, 0.111 to 1.995 mg/kg for RMSE, and 5.24% to 17.84% for NRMSE, signifying strong simulation outcomes.

3.1.3. Calibration and Validation of the Crop Growth Module

Table 6 presents a comparison between the measured and simulated maize phenology values for different nitrogen application rates and periods of application during the validation process. The error between the observed and simulated maize phenology values for different nitrogen application rates and periods of application does not exceed three days. The analysis of observations revealed that the anthesis and maturity of maize under low-nitrogen treatments (P1N120, P2N120, P3N120, and CK) were earlier than under high-nitrogen treatments, ranging from two to three days. This finding serves as a preliminary indication of an early trend in the phenological stage of maize under low nitrogen stress. However, the simulations showed no difference in the simulated values of phenological stages between treatments. This is because the model’s calculation of phenological stages primarily relies on temperature and does not consider the effects of water and nitrogen stress [34].
Table 7 demonstrates that the simulated values of maize yield, above-ground biomass, and above-ground nitrogen content were generally lower than the measured values under different treatments of nitrogen application periods and application rates during the validation process. The RE for maize yield ranged from −15.32% to −5.06%, the RE for above-ground biomass ranged from −15.19% to −7.07%, and the RE for above-ground nitrogen content ranged from −13.14% to −3.14%. From the RE values for each treatment, it is evident that maize yield, biomass, and nitrogen content were severely underestimated under the CK treatment. This is possibly due to the fact that the model’s embedded CERES-Maize module significantly underestimated crop leaf area index (LAI) values in the stress scenario [35], affecting crop photosynthesis. Additionally, the CERES module is driven by photosynthesis as the main process [36], which contributes to this situation. Despite this, the model is reliable in simulating the yield, biomass, and nitrogen content of maize in this study (NRMSEs for yield, biomass, and nitrogen content for all treatments were less than 10%, representing an “excellent” level).

3.1.4. Comparison of Simulated and Measured Values of Nitrogen Indicators

Nitrogen indicators calculated based on model simulations were analyzed in comparison with those based on actual measurements, and the comparisons are demonstrated in Table 8. The MRE values for nitrogen agronomic efficiency were 15.29%, RMSE 1.720 kg/kg, and NRMSE 15.25% based on simulated and measured values, demonstrating a good level. The MRE values for nitrogen physiological efficiency were 10.33%, RMSE 2.820 kg/kg, and NRMSE 10.62%, being at a good level. The MRE values for nitrogen apparent recovery were 4.50%, RMSE 0.020, and NRMSE 4.75%, representing an excellent level. The trend of the nitrogen indicators was consistent, showing an increase followed by a decrease (“same period, different nitrogen application” or “same nitrogen application, different period”). In summary, the model is suitable for simulating nitrogen agronomic efficiency, nitrogen physiological efficiency, and nitrogen apparent recovery.

3.2. Analysis of Field Experiment Results

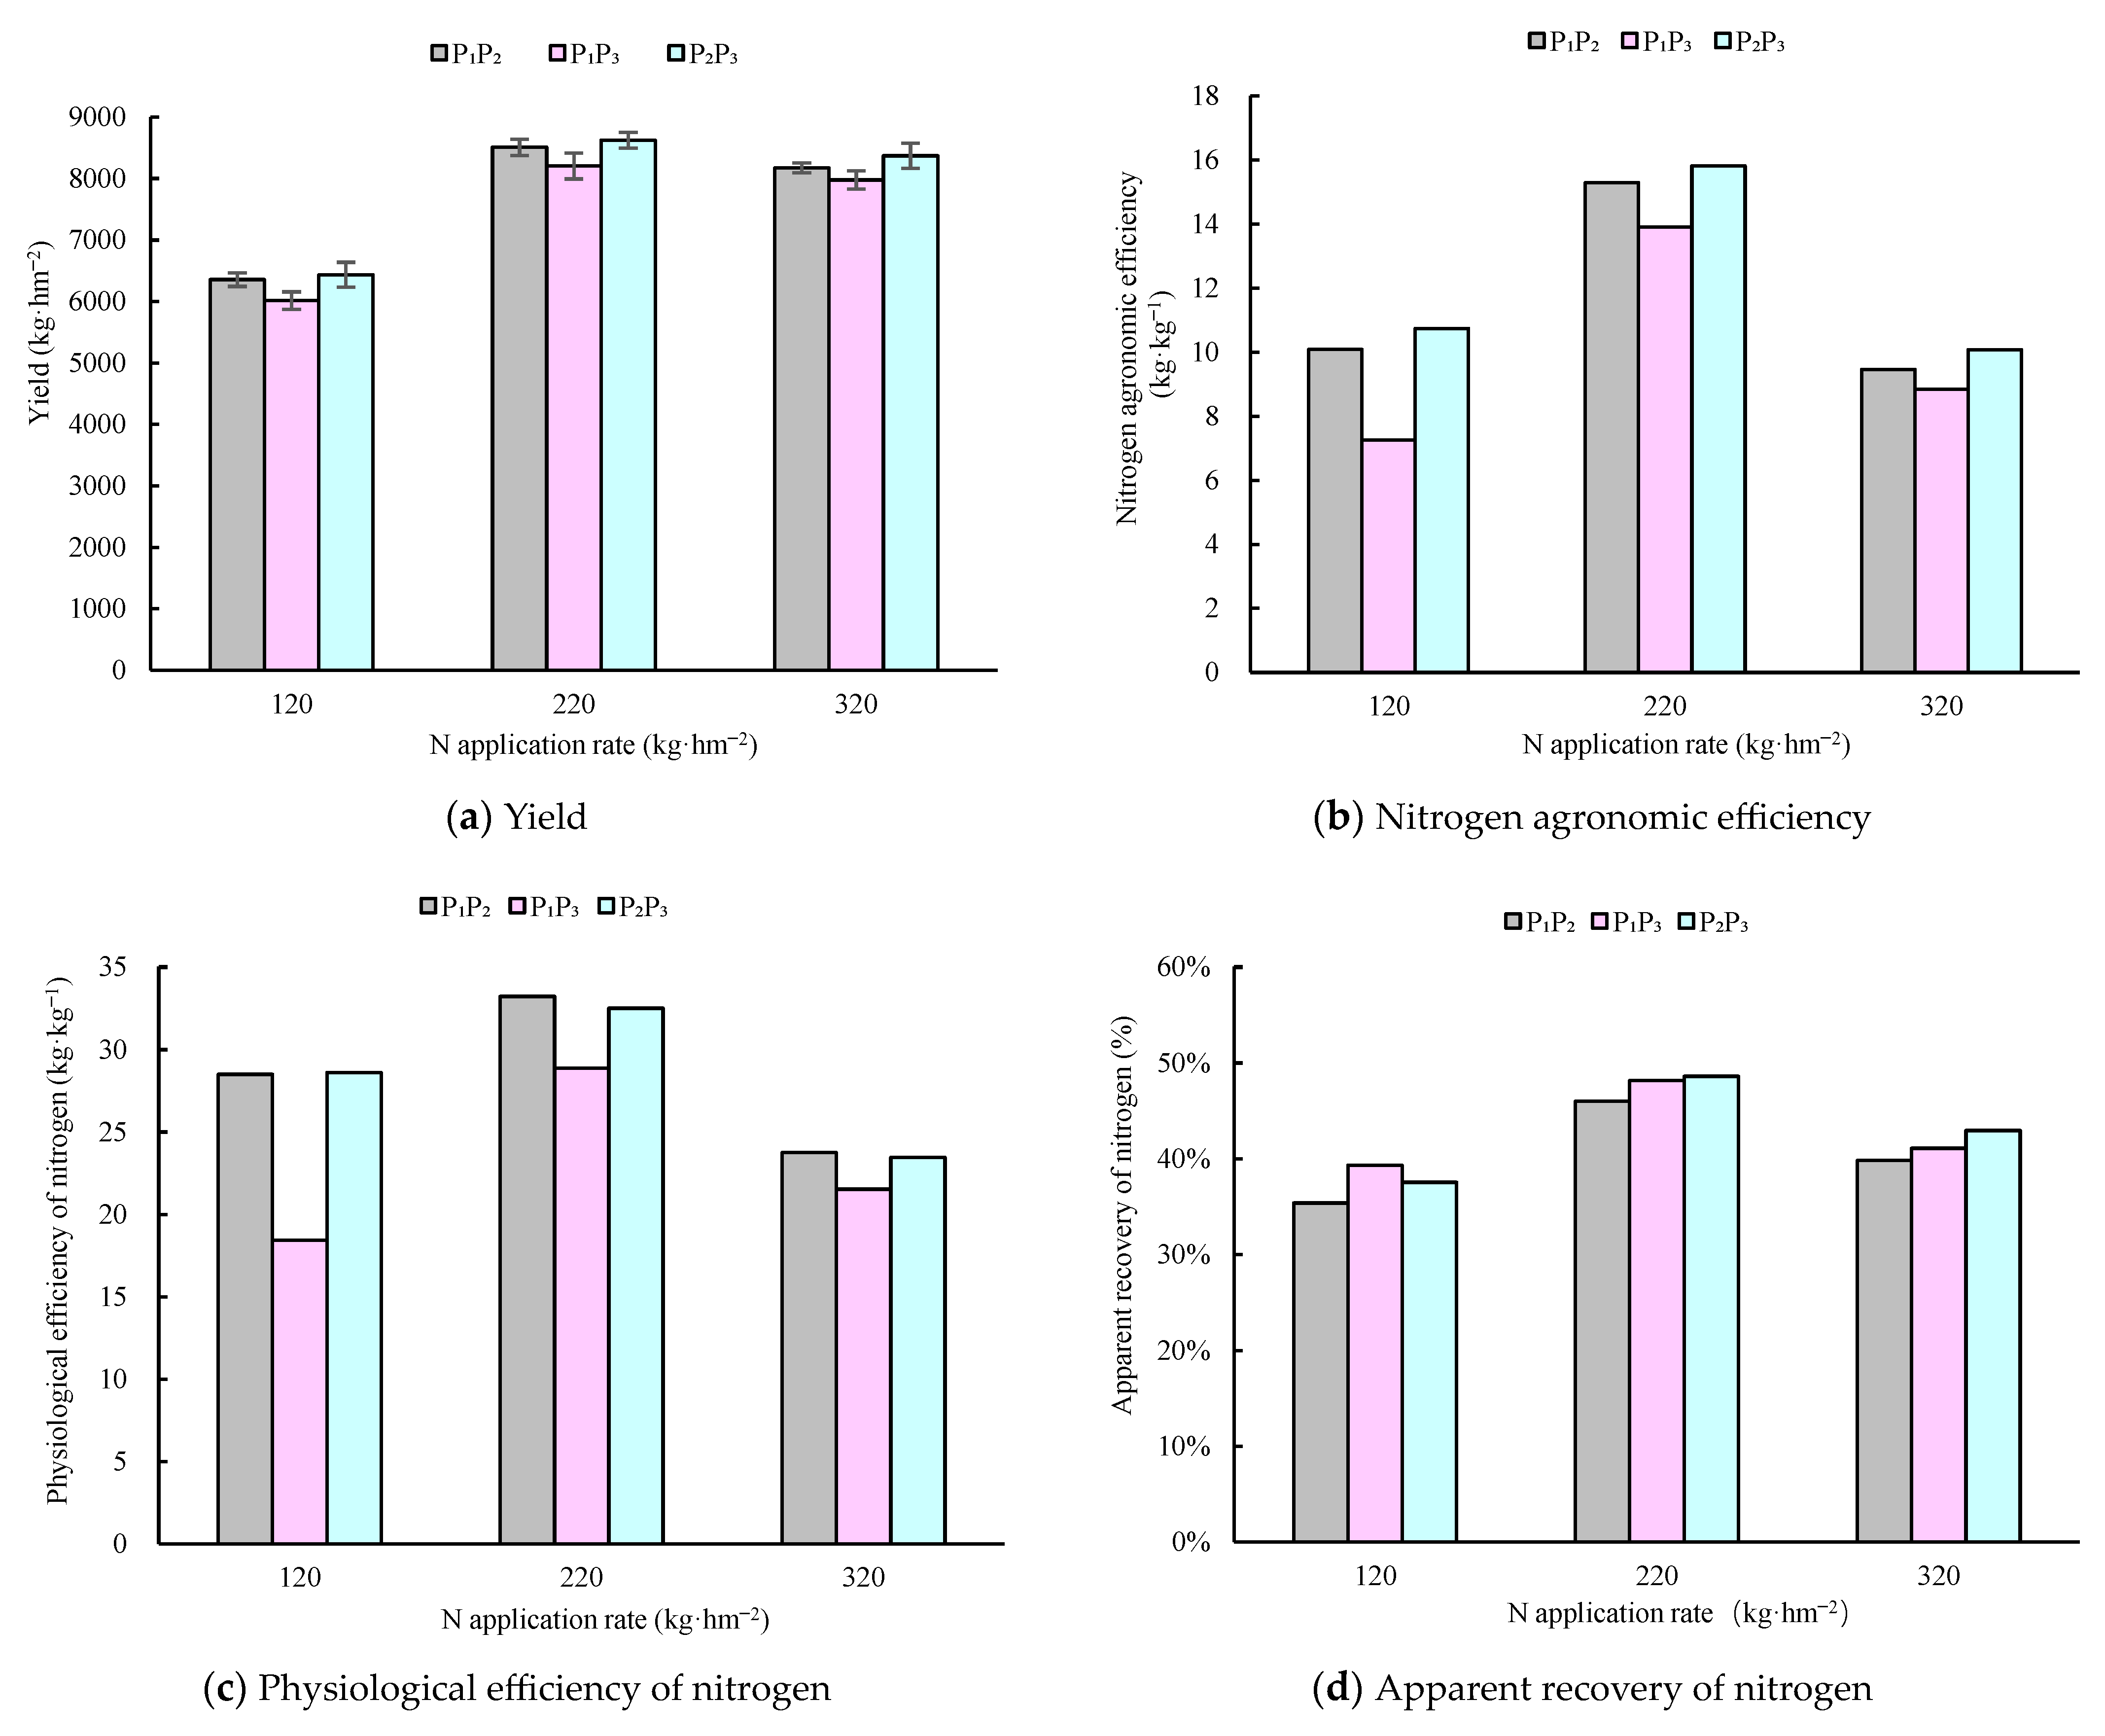
The results of field trials demonstrate that the amount and period of nitrogen application significantly influence the yield, above-ground biomass, and above-ground nitrogen content of summer maize. The yield of summer maize increased with increasing nitrogen application when the application period was consistent and began to decrease when the nitrogen application rate exceeded 220 kg/hm2. However, the above-ground biomass and above-ground nitrogen content exhibited a continuous increase with the increase of the nitrogen application rates. Yield, above-ground biomass, and above-ground nitrogen content were highest for P2P3 (trumpeting and anthesis) when applied at the same nitrogen level but at different times of the year. As illustrated in Figure 5, nitrogen agronomic efficiency, nitrogen physiological efficiency, and nitrogen apparent recovery all exhibit an increase followed by a decrease with the increase of the nitrogen application for the same period, with the maximum value occurring at 220 kg/hm2 of applied nitrogen. Yield, nitrogen agronomic efficiency, and apparent nitrogen recovery were all maximized at P2P3 when nitrogen was applied at the same rate, while nitrogen physiological efficiency was maximized at P1P2 (jointing and trumpeting). By using yield, nitrogen agronomic efficiency, nitrogen physiological efficiency, and nitrogen apparent recovery as indicators and based on the TOPSIS method (Table 9), it becomes evident that the P2P3 period is the most suitable for fertilizer application at the same nitrogen application level.

3.3. Situational Application Analysis

3.3.1. Scenario Building

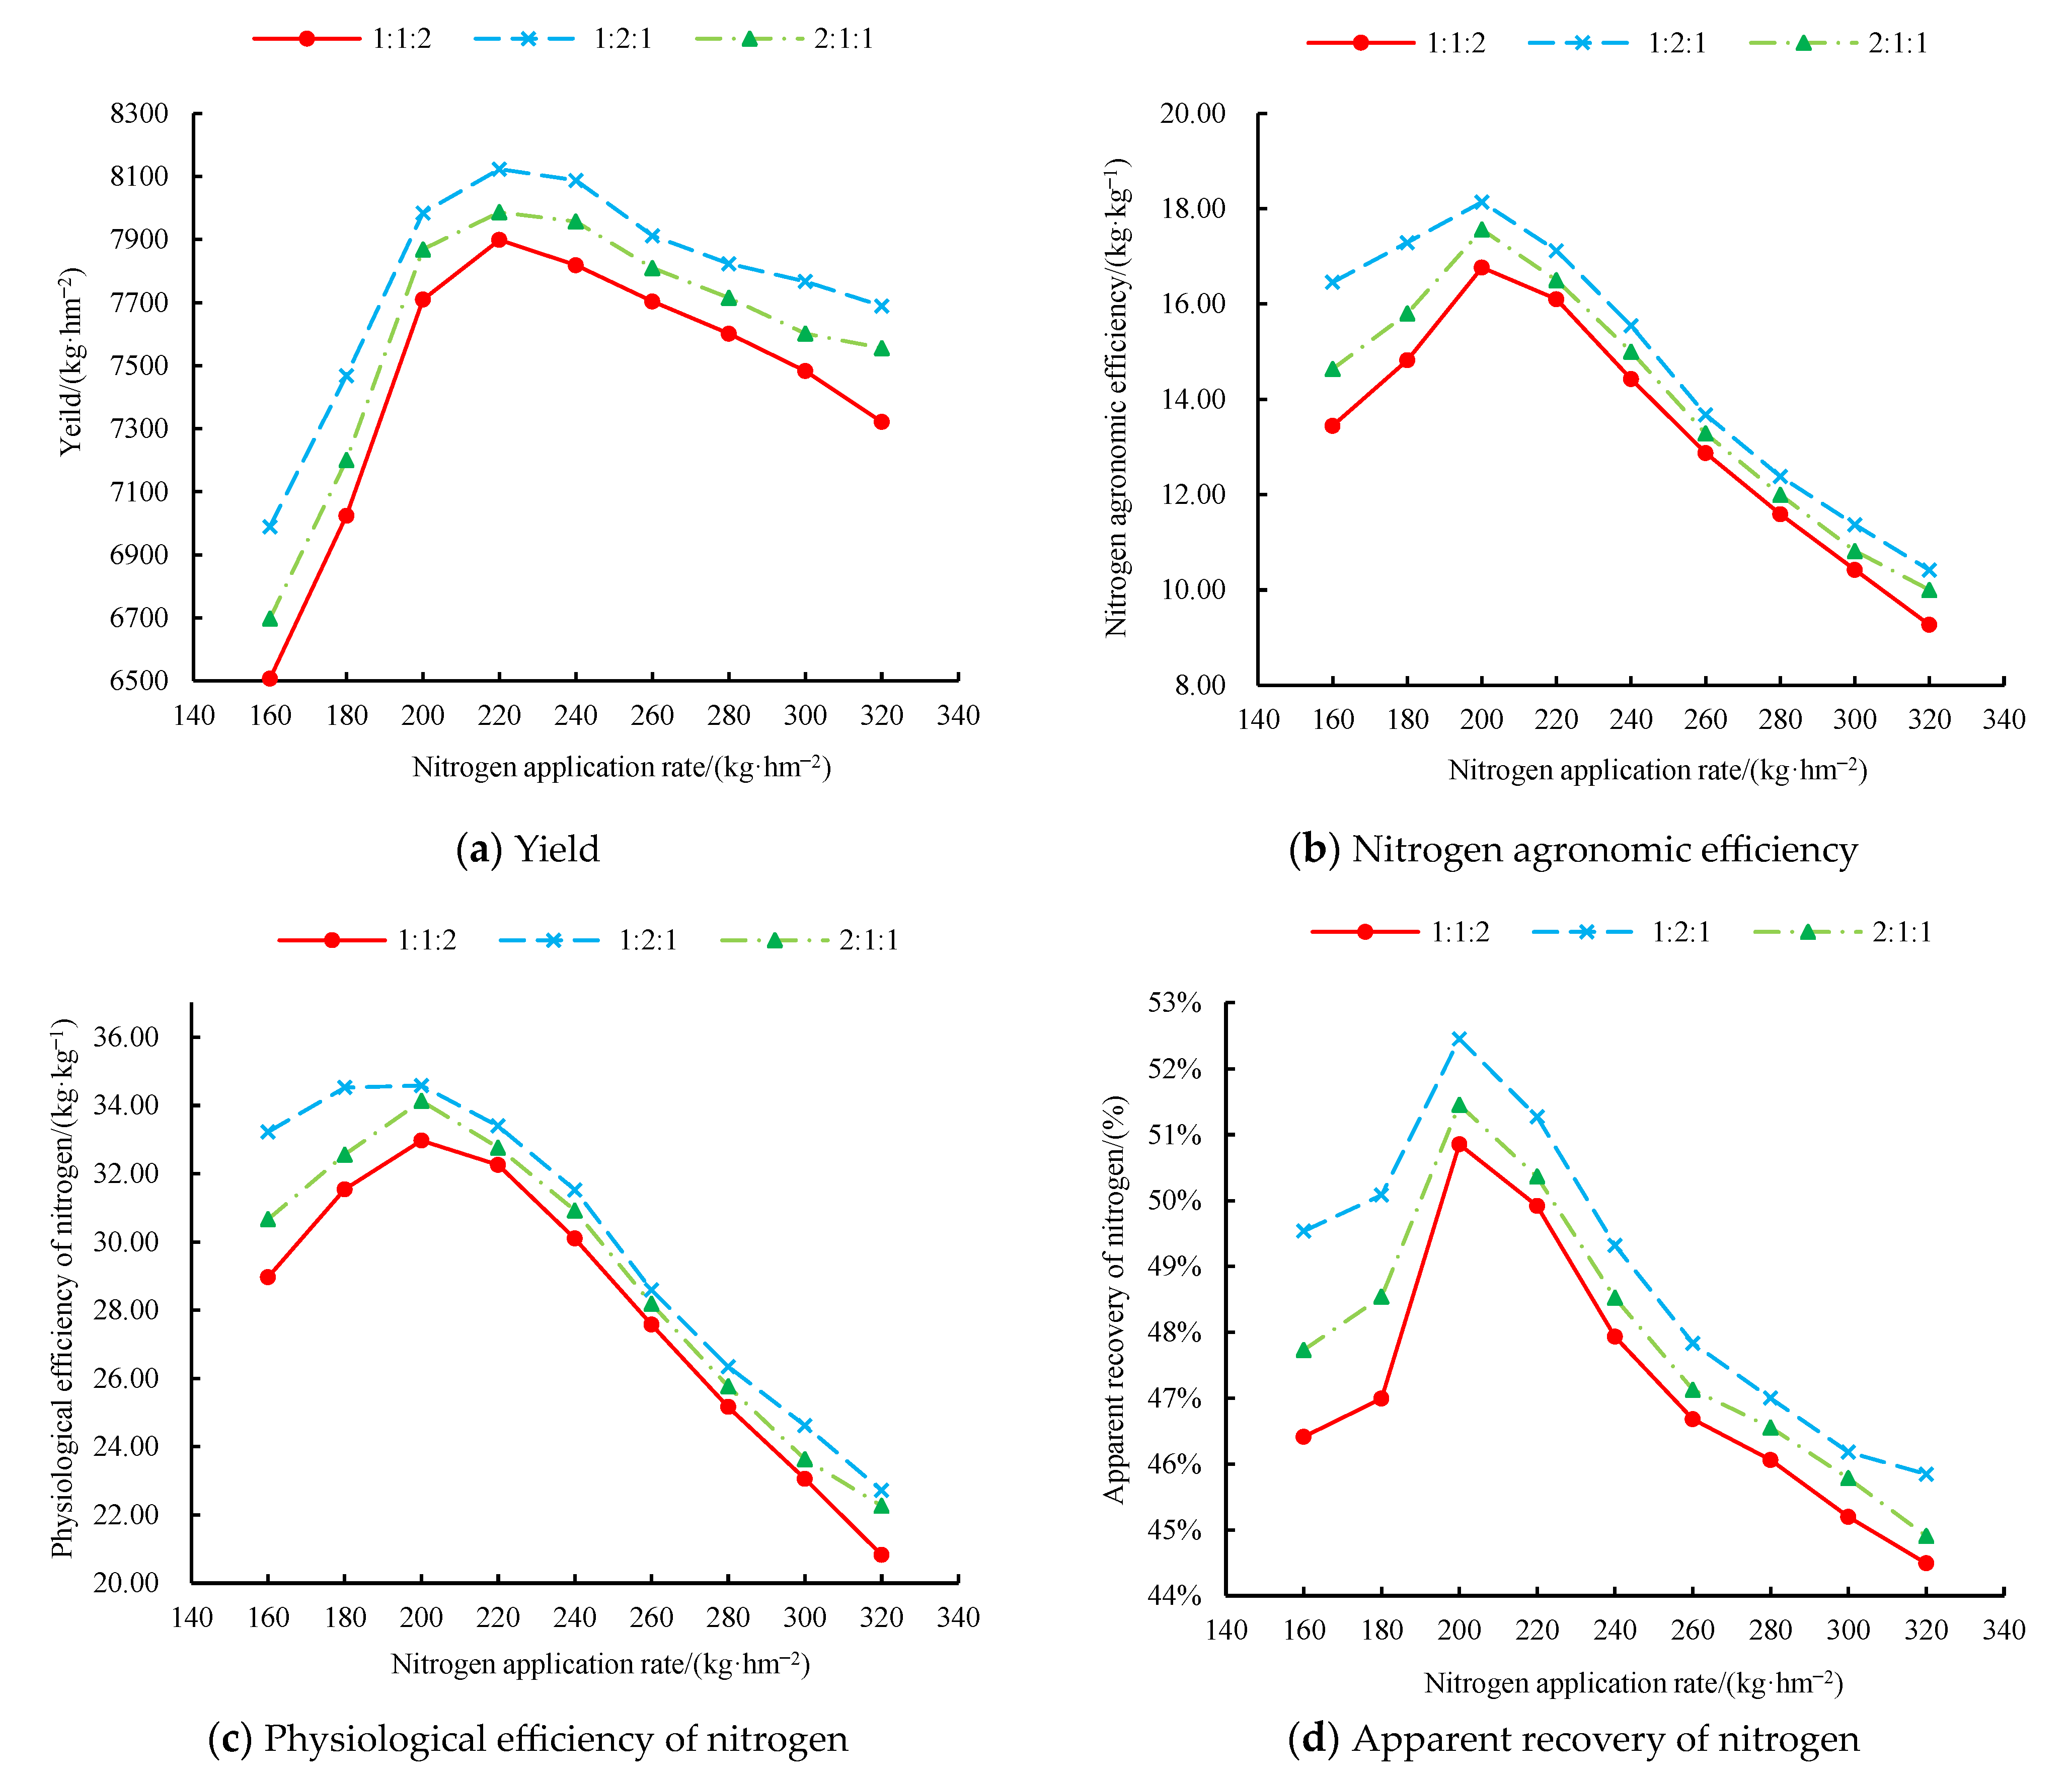
Based on field trials, the appropriate secondary nitrogen application timings for summer maize in this region are the trumpeting and anthesis stages. Nitrogen application rates of 160–320 kg/hm2 were subdivided into nine scenarios of 160, 180, 200, 220, 240, 260, 280, 300, and 320 kg/hm2, and the nitrogen application periods were set at the trumpeting and anthesis stages, with three levels of basal chasing ratios of 1:1:2, 1:2:1, and 2:1:1, as presented in Table 10. The model was simulated to find the optimal nitrogen fertilizer management model using the TOPSIS method with yield, nitrogen agronomic efficiency, nitrogen physiological efficiency, and nitrogen apparent recovery as indicators.

3.3.2. Analysis of Scenario Results

Figure 6 provides a comparative analysis of summer maize yield, nitrogen use efficiency, nitrogen physiological efficiency, and nitrogen apparent recovery under varying nitrogen application rates and basal chasing ratios. The data indicate that the summer maize yield, nitrogen agronomic efficiency, and nitrogen apparent recovery for different basal chasing ratios from 180 to 320 kg/hm2 initially show an increasing trend, followed by a decrease. However, nitrogen physiological efficiency consistently decreases over this range. Under identical nitrogen application rates, the crop yield, nitrogen agronomic efficiency, nitrogen physiological efficiency, and nitrogen apparent recovery were greater with a 1:2:1 base-to-chase ratio than with the other two tested ratios. This suggests that a light application of base-to-flower fertilizer, combined with a heavy application of trumpet fertilizer, supports optimal maize growth. As illustrated in Figure 6a, the rate of yield increase surpassed the rate of yield decrease at an application rate of 220 kg/hm2. The relationship between yield at different basal chasing ratios with increasing nitrogen application followed the order: 1:2:1 > 2:1:1 > 1:1:2. According to Figure 6b, the relationship between nitrogen agronomic efficiency and yield at different basal chasing ratios remained consistent with the increase in nitrogen application, but the difference in nitrogen agronomic efficiency at varying basal chasing ratios was insignificant. As shown in Figure 6c, nitrogen physiological efficiency remained at a high level when the application rate ranged between 180 and 220 kg/hm2. However, Figure 6d depicts that when the nitrogen application rate exceeded 200 kg/hm2, the plant’s nitrogen uptake was lower than the increase in nitrogen, resulting in a decrease in the apparent recovery of nitrogen as the nitrogen application rate increased.

3.3.3. Selection of Optimal Scenarios

The results of the TOPSIS analysis are depicted in Table 11. In the top 2 scenarios, the basal chasing ratio was 1:2:1, indicating that a basal chasing ratio of 1:2:1 at the trumpeting and anthesis stages was the optimal nitrogen allocation, consistent with the results obtained from Figure 5. A more reasonable nitrogen application range is 180–200 kg/hm2. The optimal scenario is 200 kg/hm2 of nitrogen and a 1:2:1 basal chasing ratio.

4. Discussion

4.1. Adaptation Analysis of the RZWQM2 Model

In this study, the soil moisture module, soil nutrient module, and crop growth module of the RZWQM2 model were calibrated and validated based on field measurement data, and the results demonstrated a high simulation accuracy. For the moisture module, the MRE of soil volumetric moisture content for each soil layer under different treatments ranged from 5.58% to 14.09%, RMSE from 0.016 to 0.037 cm3/cm3, and NRMSE from 6.20% to 14.42%. The simulation performance of the upper soil layer’s moisture content was lower than that of the lower soil layer, which differed from the simulation results of Zhou et al. [37]. This discrepancy may be due to (a) the upper soil layer’s moisture state being more susceptible to instability from rainfall, plant root growth, evaporation, and other factors, making accurate simulation challenging; and (b) the surface soil capacity, field water holding capacity, and saturated hydraulic conductivity being prone to significant spatial and temporal variability due to external condition changes, which the model does not account for [38]. The simulated values of soil volumetric moisture content were greater than the measured values, primarily because the trial period had high rainfall, and the model input is an average of the time periods, differing from the actual instantaneous rainfall in the field [39].
For the nutrient module, the MRE for nitrate nitrogen content in each soil layer ranged from 4.36% to 33.01%, RMSE from 0.111 to 1.995 mg/kg, and NRMSE from 5.24% to 17.84%, with the upper layer being less effectively simulated than the lower layer. This is not only related to the poor simulation accuracy of the topsoil layer’s water content, but may also be due to the top layer of the soil being prone to ammonia volatilization and denitrification reactions. This is probably because ammonia volatilization and denitrification are likely to occur in the top layer of the soil, making accurate simulation difficult. For the plant growth module, the simulated value of the phenological period is within three days of the measured value. Both Ma et al. [35] and Fang et al. [40] reported a simulation error of approximately 4–5 days regarding maize phenology. In comparison, the simulations in this study proved to be more accurate. MRE, RMSE, and NRMSE for yield were 7.49%, 535.59 kg/hm2, and 7.26%, respectively; MRE, RMSE, and NRMSE for above-ground biomass were 8.92%, 1483.58 kg/hm2, and 8.93%, respectively, and MRE, RMSE, and NRMSE for above-ground nitrogen content were 5.43%, 8.68 kg/hm2, and 5.20%. The model simulation underestimates the three of these indicators, potentially because the model underestimates the LAI values at the time of filling, resulting in a reduction in plant organic matter accumulation and consequently in biomass, nitrogen content, and yield. The nitrogen agronomic efficiency, nitrogen physiological efficiency, and nitrogen apparent recovery calculated based on the simulated values fail to differ significantly from the values calculated from the field measurements. Thus, the RZWQM2 model can be effectively applied to simulate summer maize nitrogen fertilizer management in the Yellow River irrigation area.

4.2. Suitable Nitrogen Fertilizer Management Patterns for Summer Maize

The appropriate amount of nitrogen application not only increases crop yield but also provides significant environmental benefits. Through field trials in the North China Plain, Wang et al. [41] identified a suitable nitrogen application rate of 185 kg/hm2. Despite a slight 2% decrease in yield, this rate led to a notable 30% reduction in nitrate nitrogen residues and wetting. The results of these trials indicated that, for a constant nitrogen application period, maize yield initially rises and then declines with increasing nitrogen application. This suggests that a certain nitrogen threshold exists for maize seed formation, beyond which the yield decreases. This finding echoes a 2-year field trial in Shandong by Shi et al. [7] and supports the phenomenon referred to as the “law of diminishing returns” by Meng et al. [42]. Notably, after reaching the threshold, above-ground biomass barely increases, and above-ground nitrogen content significantly increases, a trend that contradicts yield, A similar phenomenon emerged during the study by Yu et al. [43] and Li et al. [44]. This may be due to the inhibition of nitrogen transport from the maize organ to the kernel after a certain nitrogen application threshold, and the continued accumulation of nitrogen in the stems and leaves of the plant, leading to a reduction in yield. In the scenario simulation, combined with the TOPSIS method analysis, applying 180–200 kg/hm2 of nitrogen fertilizer can essentially meet the needs of high and stable yield of summer maize. Compared to the traditional fertilizer application of 360 kg/hm2 by farmers in the Yellow River irrigation Area [45], the reduction of 160–180 kg/hm2 of nitrogen fertilizer reduces agricultural surface source pollution as well as significantly improves nitrogen utilization efficiency.
Field trial results demonstrated that crop yield, above-ground biomass, and above-ground nitrogen content did not differ significantly between the P1P2 and P2P3 periods of nitrogen application at the same nitrogen application level, while it was observed in the field that treatments with nitrogen follow-up at the jointing period were prone to lodging when encountering higher-intensity rainfall, a phenomenon also found by Tang et al. [46] and others. This is possibly because the follow-up at the jointing period tends to bring about high plant height and ear position of maize, so the follow-up period could be delayed until the trumpeting stage, if possible. Ding et al. [47] showed that maize absorbed 43.9% to 50.9% of the plant’s nitrogen accumulation after anthesis, explaining the reason that plants with over-treated nitrogen at anthesis contained higher nitrogen than other treatments. The combination of yield, nitrogen physiological efficiency, nitrogen agronomic efficiency, and nitrogen apparent recovery, based on TOPSIS analysis, resulted in the best fertilizer follow-up at P2P3.
The use of different nitrogen fertilizer application rates for the same period of maize significantly affects maize growth, development, and yield [43,47,48,49,50]. In the scenario simulations, the basal chasing ratios of 2:1:1, 1:2:1, and 1:1:2 represented heavy application of basal fertilizer, heavy application of trumpet fertilizer, and heavy application of anthesis fertilizer, respectively. The simulation results revealed that heavy application of basal fertilizer resulted in excessive nitrogen concentration in the maize seedling stage, where maize failed to possess a high demand for nitrogen [51], leading to serious nutrient wastage and resulting in low yield and nitrogen use efficiency. Heavy application of anthesis fertilizers stunted maize growth during critical fertility periods, affecting nutrient accumulation and not fully exploiting maize yield and nitrogen use efficiency despite its high nitrogen content. Conversely, heavy application of trumpet fertilizer met the nutrient requirements of the nutritional stage and supplemented post-anthesis nitrogen requirements, ultimately allowing yields and nitrogen use efficiency to be maintained at a high level. However, the above conclusion contradicts the findings of Liu et al. [13] who concluded that heavy application of pulling fertilizer is more appropriate. The authors posit that although maize nitrogen-chasing typically occurs during the pulling stage. The maize plants fertilized during the pulling stage demonstrated higher plant height and ear position, and were less resistant to lodging, with a quite high intensity of rainfall in summer. The combination of the above plants’ physiological factors and external environmental factors further elevates the risk of lodging. Consequently, a heavy application of trumpet fertilizer is more advantageous than a heavy application of pulling fertilizer.

5. Conclusions

Based on a two-year summer maize trial in the field, this study investigated the response of summer maize to different nitrogen application rates and periods of application. RZWQM2 was calibrated and validated using field-measured data. Based on the field trial results, different scenarios were created using RZWQM2 to examine the effects of different nitrogen application rates and basal chasing ratios on summer maize yield, nitrogen agronomic efficiency, nitrogen physiological efficiency, and nitrogen apparent recovery. The TOPSIS method was utilized for a comprehensive evaluation, yielding the following conclusions:
(1)
The simulation errors of the RZWQM2 model for soil moisture, soil nitrogen, and crop growth during the summer maize fertility period remained within reasonable limits. The simulated yields responded significantly to different nitrogen fertilizer management patterns, and the nitrogen indicators calculated based on the simulated values were generally consistent with the field measurements. Consequently, the RZWQM2 model is appropriate for research related to summer maize in the Yellow River irrigation area.
(2)
In accordance with the field trials and scenario simulations, a more appropriate nitrogen application rate for the Yellow River irrigation area, determined by applying the TOPSIS evaluation method, is 180–200 kg/hm2. The optimal nitrogen fertilizer management pattern involves applying 200 kg/hm2 of nitrogen with a 1:2:1 basal chasing ratio at the sowing, trumpeting, and anthesis stages.

Author Contributions

Conceptualization, H.Z.; methodology, J.D. and R.Y.; validation, Y.L. (Yulong Liu); formal analysis, D.W.; data curation, Y.L.(Yuan Li); writing—original draft preparation, M.L.; writing—review and editing, T.L. and H.Z.; visualization, W.Z.; project administration, S.W. All authors have read and agreed to the published version of the manuscript.

Funding

This work was financially supported by the General Project of the National Natural Science Foundation of China, No. 52079051, Key Scientific Research Project of Henan Province Colleges and Universities, No. 22A570004 and No. 23A570006, Henan Provincial Science and Technology Plan Project, No. 162102110130.

Data Availability Statement

The data presented in this study are available on request from the corresponding author.

Acknowledgments

We fully appreciate the editors and all anonymous reviewers for their constructive comments on this manuscript.

Conflicts of Interest

The authors declare no conflict of interest.

References

  1. Xu, B.; Niu, Y.; Zhang, Y.; Chen, Z.; Zhang, L. China’s agricultural non-point source pollution and green growth: Interaction and spatial spillover. Environ. Sci. Pollut. 2022, 29, 60278–60288. [Google Scholar] [CrossRef] [PubMed]
  2. Malhi, S.S.; Nyborg, M.; Goddard, T.; Puurveen, D. Long-term tillage, straw and N rate effects on some chemical properties in two contrasting soil types in Western Canada. Nutr. Cycl. Agroecosyst. 2011, 90, 133–146. [Google Scholar] [CrossRef]
  3. Zhang, Y.T.; Wang, H.Y.; Lei, Q.L. Optimizing the nitrogen application rate for maize and wheat based on yield and environment on the Northern China Plain. Sci. Total Environ. 2018, 618, 1173–1183. [Google Scholar] [CrossRef] [PubMed]
  4. Zhao, Y.; Tong, Y.A.; Zhao, H.B. Effects of different N rates on nutrients accumulation, transformation and yield of summer maize. Plant Nutr. Fertil. Sci. 2006, 12, 622–627. [Google Scholar]
  5. Lü, L.; Zhao, M.; Zhao, J.R.; Tao, H.B.; Wang, P. Canopy structure and photosynthesis of summer maize under different nitrogen fertilizer application rates. Chin. Agric. Sci. 2008, 41, 2624–2632. [Google Scholar]
  6. Zhang, Z.; Shang, W.; Qi, Z.; Zheng, E.; Liu, M. Effects of different water and nitrogen managements on nitrogen remobilization efficiency during leaf senescence in maize. Trans. Chin. Soc. Agric. Mach. 2019, 50, 297–303. [Google Scholar]
  7. Shi, D.Y.; Li, Y.H.; Zhang, J.W.; Liu, P.; Zhao, B.; Dong, S.T. Increased plant density and reduced n rate lead to more grain yield and higher resource utilization in summer maize. J. Integr. Agric. 2016, 15, 2515–2528. [Google Scholar] [CrossRef] [Green Version]
  8. Yan, F.; Zhang, F.; Fan, X.; Wang, Y.; Guo, J.; Zhang, C. Effects of water and nitrogen fertilizer supply on yield and nitrogen absorption and utilization efficiency of spring maize in sandy soil area in Ningxia. Trans. Chin. Soc. Agric. Mach. 2020, 51, 283–293. [Google Scholar]
  9. Yang, X.; Lu, Y.; Ding, Y.; Yin, X.; Raza, S.; Tong, Y.A. Optimising nitrogen fertilisation: A key to improving nitrogen-use efficiency and minimising nitrate leaching losses in an intensive wheat/maize rotation (2008–2014). Field Crop Res. 2017, 206, 1–10. [Google Scholar] [CrossRef]
  10. Huang, P.; Zhang, J.; Zhu, A.; Li, X.; Ma, D.; Xin, X.; Zhang, C.; Wu, S.; Garland, G.; Pereira, E.I.P. Nitrate accumulation and leaching potential reduced by coupled water and nitrogen management in the Huang-Huai-Hai Plain. Sci. Total Environ. 2018, 610–611, 1020–1028. [Google Scholar] [CrossRef]
  11. Ju, X.; Liu, X.; Zhang, F.; Roelcke, M. Nitrogen fertilization, soil nitrate accumulation, and policy recommendations in several agricultural regions of China. AMBIO 2004, 33, 300–305. [Google Scholar] [CrossRef] [PubMed]
  12. Li, E.; Jin, C.; Yan, H.; Liu, J.; Wang, J. Effect of application period and ratio of nitrogen fertilizer on photosynthetic and yield of spring maize. Soil Fert. Sci. China 2017, 5, 12–16. [Google Scholar]
  13. Liu, X.M.; Chen, G.; Wang, Z.G.; He, Y.H.; Li, W.; Wu, Y. Effects of different nitrogen fertilizers on nitrogen uptake and utilization, soil nitrogen supply and yield of maize. Acta Agric. Boreal-Sin. 2020, 35, 124–131. [Google Scholar]
  14. Wang, G.Y.; Zhang, K.Q.; Fu, L.; Dou, G.F.; Zhang, J.S.; Du, H.Y. Simulation of the sail irate nitrogen migration characteristics of summer maize fertilized with dairy manure and wastewater using RZWOM2. Trans. Chin. Soc. Agric. Eng. 2020, 36, 47–54. [Google Scholar] [CrossRef]
  15. Sohoulande, D.D.C.; Ma, L.; Szogi, A.A.; Sigua, G.C.; Stone, K.C.; Malone, R.W. Evaluating Nitrogen Management for Corn Production with Supplemental Irrigation on Sandy Soils of the Southeastern Coastal Plain Region of the U.S. Trans. ASAE 2020, 63, 731–740. [Google Scholar] [CrossRef]
  16. Jiang, T.; Dou, Z.; Yao, N.; Feng, H.; He, J. Simulation of winter wheat growth under different scenarios of water stress with RZWOM2 model. Trans. Chin. Soc. Agric. Mach. 2018, 49, 205–216. [Google Scholar]
  17. Gillette, K.; Malone, R.W.; Kaspar, T.C.; Ma, L.; Parkin, T.B.; Jaynes, D.B.; Fang, Q.X.; Hatfield, J.L.; Feyereisen, G.W.; Kersebaum, K.C. N loss to drain flow and N2O emissions from a corn-soybean rotation with winter rye. Sci. Total Environ. 2018, 618, 982–997. [Google Scholar] [CrossRef]
  18. Lu, R. Methods for Soil Agrochemical Analysis; China Agriculture Scientech Press: Beijing, China, 2000. [Google Scholar]
  19. Song, G.; Sun, B.; Jiao, J. Comparison between ultraviolet spectrophotometry and other methods in determination of soil nitrate-N. Acta Pedol. Sin. 2007, 44, 288–293. [Google Scholar]
  20. Ladha, J.K.; Pathak, H.; Krupnik, T.J.; Six, J.; van Kessel, C. Efficiency of Fertilizer Nitrogen in Cereal Production: Retrospects and Prospects. Adv. Agron. 2005, 87, 85–156. [Google Scholar]
  21. Ahuja, L.R.; Rojas, K.W.; Hanson, J.D.; Shaffer, M.J.; Ma, L. Modeling Management Effects on Water Quality and Crop Production. Root Zone Water Quality Model; Water Resources Publications, LLC: Littleton, CO, USA, 2000; pp. 372–379. [Google Scholar]
  22. Ma, L.; Ahuja, L.; Ascough, J.; Shaffer, M.; Rojas, K.; Malone, R.; Cameira, M. Integrating system modeling with field research in agriculture: Applications of the Root Zone Water Quality Model (RZWQM). Adv. Agron. 2001, 71, 233–292. [Google Scholar]
  23. Brooks, R.H.; Corey, A.T. Hydraulic Properties of Porous Media; Colorado State University: Fort Collins, CO, USA, 1964; pp. 3–27. [Google Scholar]
  24. Green, W.H.; Ampt, G. Studies on soil physics, 1. The flow of air and water through soils. J. Agric. Sci. 1911, 4, 11–24. [Google Scholar]
  25. Richards, L.A. Capillary conduction of liquids through porous mediums. J. Appl. Phys. 1931, 1, 318–333. [Google Scholar] [CrossRef]
  26. Ma, L.; Malone, R.W.; Jaynes, D.B.; Thorp, K.R.; Ahuja, L.R. Simulated effects of nitrogen management and soil microbes on soil nitrogen balance and crop production. Soil Sci. Soc. Am. J. 2008, 72, 1594–1603. [Google Scholar] [CrossRef] [Green Version]
  27. Hanson, J.D.; Rojas, K.W.; Shaffer, M.J. Calibration and evaluation of the root zone water quality model. Agron. J. 1999, 91, 171–177. [Google Scholar] [CrossRef]
  28. Bannayan, M.; Hoogenboom, G. Using pattern recognition for estimating cultivar coefficients of a crop simulation model. Field Crop Res. 2009, 111, 290–302. [Google Scholar] [CrossRef]
  29. Jamieson, P.D.; Porter, J.R.; Wilson, D.R. A test of the computer simulation model ARCWHEAT1 on wheat crops grown in New Zealand. Field Crop Res. 1991, 27, 337–350. [Google Scholar] [CrossRef]
  30. Ma, L.; Ahuja, L.R.; Saseendran, S.A.; Malone, R.W.; Green, T.R.; Nolan, B.T.; Bartling, P.N.S.; Flerchinger, G.N.; Boote, K.J.; Hoogenboom, G. A Protocol for Parameterization and Calibration of RZWQM2 in Field Research. In Methods of Introducing System Models into Agricultural Research; John Wiley: Hoboken, NJ, USA, 2011; Volume 2, pp. 1–64. [Google Scholar]
  31. Malone, R.W.; Nolan, B.T.; Ma, L.; Kanwar, R.S.; Pederson, C.; Heilman, P. Effects of tillage and application rate on atrazine transport to subsurface drainage: Evaluation of RZWQM using a six-year field study. Agric. Water Manag. 2014, 132, 10–22. [Google Scholar] [CrossRef] [Green Version]
  32. Yu, X.F.; Fu, D. Review of multi-index comprehensive evaluation methods. Stat. Decis. Mak. 2004, 11, 119–121. [Google Scholar]
  33. Hwang, C.L.; Yoon, K. Multiple Attribute Decision Making: Methods and Applications; CRC Press: Boca Raton, FL, USA, 1981. [Google Scholar]
  34. Song, L.B.; Chen, S.; Yao, N.; Feng, H.; Zhang, T.B.; He, J.Q. Parameter estimation and verification of CERES-maize model with GLUE and PEST methods. Trans. Chin. Soc. Agric. Mach. 2015, 46, 95–111. [Google Scholar]
  35. Ma, L.; Trout, T.J.; Ahuja, L.R.; Bausch, W.C.; Saseendran, S.; Malone, R.W.; Nielsen, D.C. Calibrating RZWQM2 model for maize responses to deficit irrigation. Agric. Water Manag. 2012, 103, 140–149. [Google Scholar] [CrossRef]
  36. Gerakis, A.; Ritchie, J. Simulation of Atrazine Leaching in Relation to Water-table Management using the CERES Model. J. Environ. Manag. 1998, 52, 241–258. [Google Scholar] [CrossRef]
  37. Zhou, S.; Hu, X.; Wang, W.E.; Allan, A.A.; Zhang, Y. Optimization of irrigation schedule based on RZWQM model for spring wheat in Shiyang River Basin. Trans. Chin. Soc. Agric. Eng. 2016, 32, 121–129. [Google Scholar]
  38. Xu, H.; Tian, Z.; He, X.; Wang, J.; Sun, L.; Fischer, G.; Fan, D.; Zhong, H.; Wu, W.; Pope, E.; et al. Future increases in irrigation water requirement challenge the water-food nexus in the northeast farming region of China. Agric. Water Manag. 2019, 213, 594–604. [Google Scholar] [CrossRef]
  39. Zhu, G.; Ren, L. Parameters sensitivity analysis and scaling of RZWQM. J. Irrig. Drain. 2011, 30, 5–9. [Google Scholar]
  40. Fang, Q.; Ma, L.; Harmel, R.D.; Yu, Q.; Sima, M.W.; Bartling, P.N.S.; Malone, R.W.; Nolan, B.T.; Doherty, J. Uncertainty of CERES-Maize Calibration under Different Irrigation Strategies Using PEST Optimization Algorithm. Agronomy 2019, 9, 241. [Google Scholar] [CrossRef] [Green Version]
  41. Wang, H.; Zhang, Y.; Chen, A.; Liu, H.; Zhai, L.; Lei, B.; Ren, T. An optimal regional nitrogen application threshold for wheat in the North China Plain considering yield and environmental effects. Field Crop Res. 2017, 207, 52–61. [Google Scholar] [CrossRef]
  42. Meng, K.; Zhang, X.Y.; Sui, Y.Y.; Zhao, J. The crop yields and water use efficiencies under different water and fertilizer conditions in the field of black soil. Chin. J. Eco-Agric. 2005, 13, 119–121. [Google Scholar]
  43. Yu, H.; Yang, G.H.; Wang, Z.J. Nitrogen rate and timing considerations on yield and physiological parameters of corn canopy. Plant Nutr. Fertil. Sci. 2010, 16, 266–273. [Google Scholar]
  44. Li, X.; Xin, M.; Shi, H.; Yan, J.; Zhao, C.; Hao, Y. Coupling Effect and System Optimization of Controlled-release Fertilizer and Water in Arid Salinized Areas. Trans. Chin. Soc. Agric. Mach. 2022, 53, 397–406. [Google Scholar]
  45. Zhao, Y.; Liu, X.; Luo, J.; Zhao, T.; Zhang, X. Yield, N uptake, and apparent N balance in spring maize as affected by side bar application of slow/controlled release fertilizers. Soil Fert. Sci. China 2020, 5, 34–39. [Google Scholar]
  46. Tang, L.Y.; Li, C.F.; Ma, W.; Zhao, M.; Li, X.L.; Li, L.L. Characteristics of plant morphological parameters an its correlation analysis in maize under planting with gradually increased density. Acta Agron. Sin. 2012, 38, 1529–1537. [Google Scholar] [CrossRef]
  47. Ding, M.W.; Du, X.; Liu, M.X.; Zhang, J.H.; Cui, Y.H. Effects of nitrogen management modes on yield formation and nitrogen utilization efficiency of summer maize. Plant Nutr. Fertil. Sci. 2010, 16, 1100–1107. [Google Scholar]
  48. Lv, L.H.; Wang, P.; Yi, Z.X.; Wei, F.T.; Liu, M. Effects of plant density on photosynthetic character and yield trait in summer corn. J. Maize Sci. 2017, 15, 79–81. [Google Scholar]
  49. Wang, Y.J.; Sun, Q.Z.; Yang, J.S.; Wang, K.J.; Dong, S.T.; Yuan, C.P.; Wang, L.C. Effects of controlled-release urea on yield and photosynthesis characteristics of maize (Zea mays L.) under different soil fertility conditions. Acta Agron. Sin. 2011, 37, 2233–2240. [Google Scholar] [CrossRef]
  50. Chen, X.P.; Cui, Z.L.; Vitousek, P.M.; Cassman, K.G.; Matson, P.A.; Bai, J.S.; Meng, Q.F.; Hou, P.; Yue, S.C.; Römheld, V.; et al. Integrated soil-crop system management for food security. Proc. Natl. Acad. Sci. USA 2011, 108, 6399–6404. [Google Scholar] [CrossRef] [Green Version]
  51. Huang, J.; Shi, Y.; Ma, Q.; Wang, L.; Chen, G. Effects of Nitrogen Application on Nitrogen Uptake and N2O Emission of Maize at Different Growth Stages. Shandong Agric. Sci. 2023, 55, 109–116. [Google Scholar]
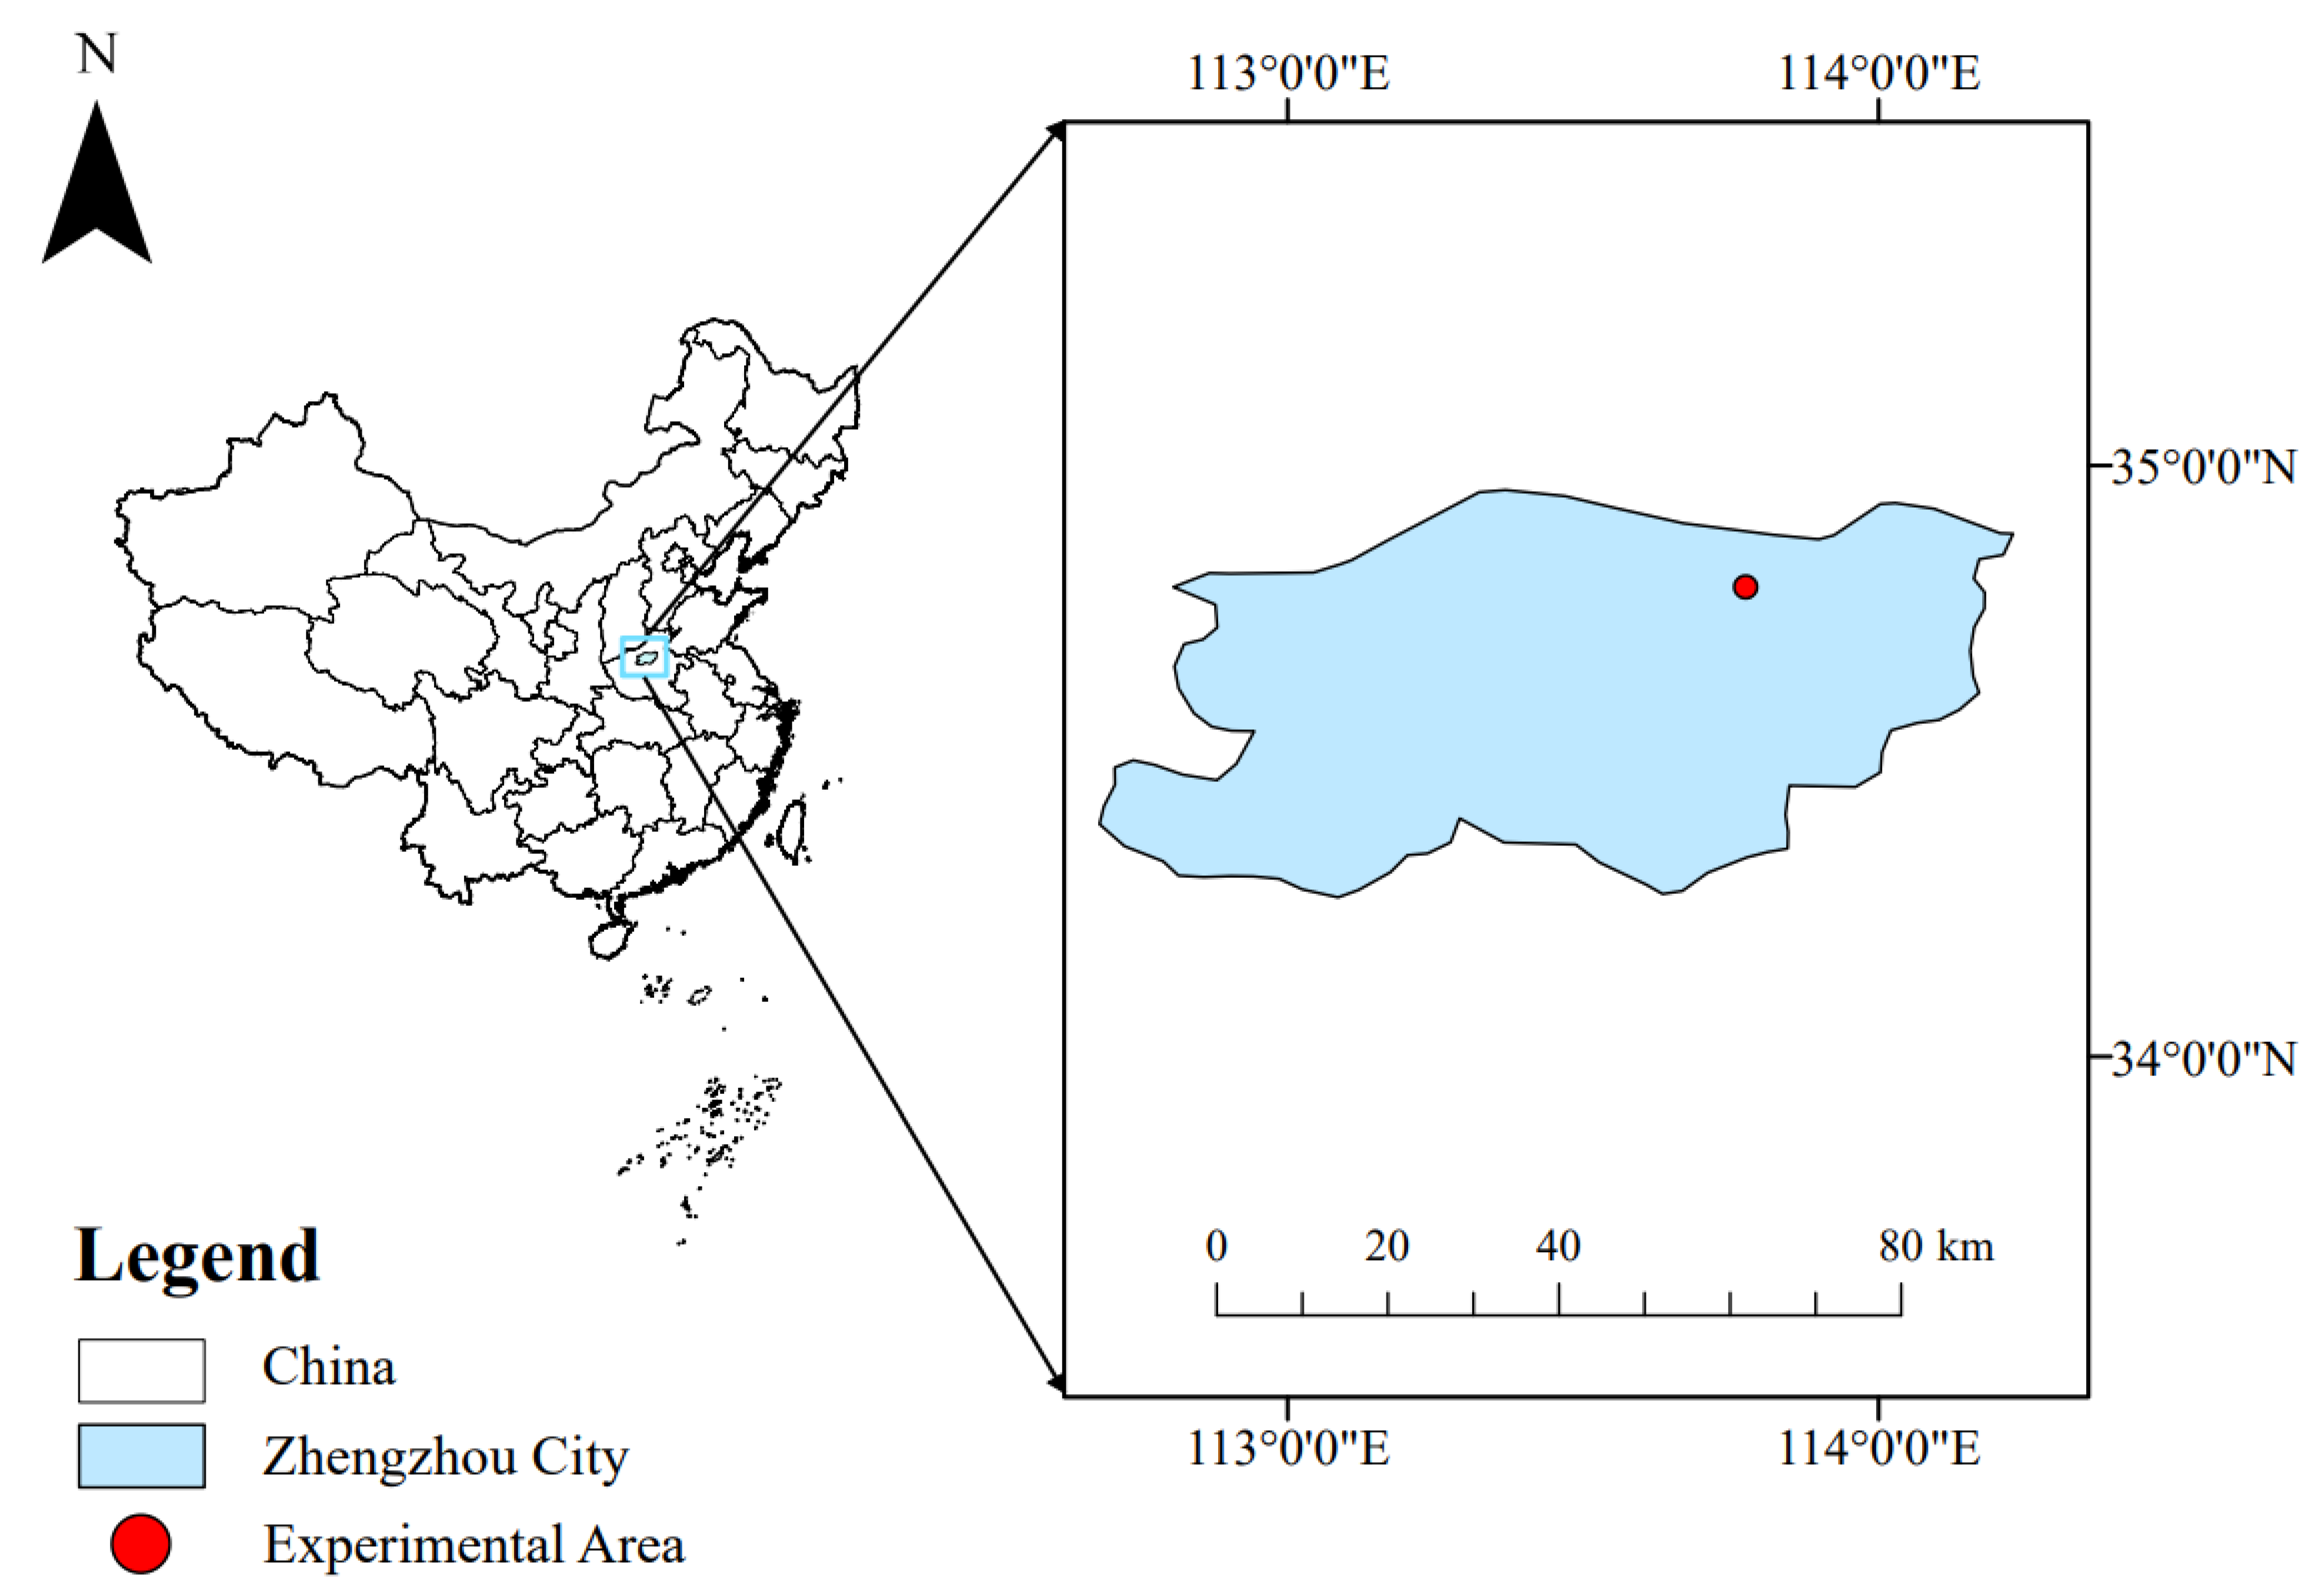
Figure 1. Location of the test area.
Agronomy 13 01628 g001
Figure 2. Air temperature and rainfall during the growth period of summer maize in 2021 and 2022.
Agronomy 13 01628 g002
Figure 3. Measured and simulated values of soil volumetric water content of 0–100 cm soil layers under the PxPyN320 (x, y = 1, 2, 3, and x < y) treatment in 2022. Note: In the diagram, “Sim” stands for “simulated value” and “Mea” stands for “measured value”.
Agronomy 13 01628 g003
Figure 4. Measured and simulated values of NO3-N concentration of 0–100 cm soil layers under the PxPyN320 (x, y = 1, 2, 3, and x < y) treatment in 2022. Note: In the diagram, “Sim” stands for “simulated value” and “Mea” stands for “measured value”.
Agronomy 13 01628 g004aAgronomy 13 01628 g004b
Figure 5. Comparison of summer maize yield, nitrogen agronomic efficiency, nitrogen physiological efficiency, and nitrogen apparent recovery at different nitrogen application periods and rates and apparent recovery of nitrogen in 2022.
Agronomy 13 01628 g005
Figure 6. Comparison of summer maize yield, nitrogen agronomic efficiency, nitrogen physiological efficiency, and nitrogen apparent recovery at different nitrogen application and basal chasing ratios.
Agronomy 13 01628 g006
Table 1. Basic physiochemical properties.
Soil
Depth
(cm)
Bulk
Density
(g·cm−3)
Field Water Capacity
(cm3·cm−3)
Permanent Wilting Point (cm3·cm−3)Saturated Hydraulic Conductivity
(cm·h−1)
Particle Gradation Composition (%)
<0.0020.002–0.05>0.05–2.00
0–201.48 0.2915 0.1151.025 4.5646.5348.91
20–401.54 0.2814 0.1360.278 7.3844.2148.41
40–601.52 0.3025 0.1310.196 6.2349.2544.52
60–801.46 0.2924 0.1220.523 4.3648.2547.39
80–1001.48 0.2716 0.1313.527 12.7345.1542.12
Table 2. Field trial design.
TreatmentBase Fertilizer **Topdressing **Total **
Jointing * (P1)Trumpeting * (P2)Anthesis * (P3)
P1P2N1206030300120
P1P3N1206030030120
P2P3N1206003030120
P1P2N2206080800220
P1P3N2206080080220
P2P3N2206008080220
P1P2N320601301300320
P1P3N320601300130320
P2P3N320600130130320
CK00000
* Specific timing of nitrogen application: jointing (25 June 2021, 28 June 2022); trumpeting (15 July 2021, 18 July 2022) anthesis (8 August 2021, 7 August 2022). ** Both substrate and chase fertilizer are measured in pure nitrogen, unit kg/hm2.
Table 3. Relevant parameters after calibration.
Type of ParametersParameterDefinitionValue RangesCalibration Values
Nitrogen conversion parametersAnit/(s·day−1·organism−1)Nitrification1.0 × 10−10–1.0 × 10−81.73 × 10−8
Aden/(s·day−1·organism−1)Denitrification1.0 × 10−14–1.0 × 10−124.51 × 10⁻¹³
Ahyd/(s·day−1)Hydrolysis of Urea2.5 × 10−5–2.5 × 10−33.0 × 10−4
Crop parametersP1/(°C·d−1)Growth characteristic parameters at the seedling stage100–400245
P2/(d·h−1)Photoperiod sensitivity0.01–2.000.85
P5/(°C·d−1)Characteristic parameters during the grouting stage600–1000800
G2Maximum number of grains per plant700–1000850
G3/(mg·d−1)Potential grouting rate6–129.2
PHINT/(°C·d−1)Outlet leaf interval characteristic parameters30–7544.5
Table 4. Comparison of simulated and measured values of soil volumetric water content in the 0–100 cm soil layer during validation.
TreatmentIndexSoil Depth/cm
0–2020–4040–6060–8080–100
P1P2N120MRE/%13.01%12.50%8.50%6.95%6.30%
RMSE/(cm3·cm−3)0.036 0.035 0.026 0.021 0.018
NRMSE/%13.73%12.78%9.46%8.12%7.08%
P1P3N120MRE/%12.42%10.26%8.80%6.99%7.01%
RMSE/(cm3·cm−3)0.033 0.027 0.025 0.020 0.019
NRMSE/%13.16%10.54%9.27%7.51%7.65%
P2P3N120MRE/%10.11%9.71%8.65%6.51%6.46%
RMSE/(cm3·cm−3)0.026 0.026 0.025 0.018 0.017
NRMSE/%10.58%10.15%9.09%6.96%6.72%
P1P2N220MRE/%12.73%10.19%8.77%5.77%7.28%
RMSE/(cm3·cm−3)0.033 0.027 0.025 0.016 0.019
NRMSE/%13.05%10.33%9.17%6.20%7.57%
P1P3N220MRE/%13.11%10.99%8.69%6.93%8.76%
RMSE/(cm3·cm−3)0.034 0.029 0.025 0.020 0.024
NRMSE/%13.51%11.17%9.11%7.71%9.34%
P2P3N220MRE/%12.72%11.22%9.39%7.04%8.66%
RMSE/(cm3·cm−3)0.032 0.030 0.027 0.021 0.024
NRMSE/%12.81%11.34%9.78%8.09%9.35%
P1P2N320MRE/%13.81%11.18%8.03%6.09%6.60%
RMSE/(cm3·cm−3)0.037 0.031 0.025 0.017 0.018
NRMSE/%14.42%11.68%9.19%6.39%7.07%
P1P3N320MRE/%12.88%12.23%6.98%7.67%8.55%
RMSE/(cm3·cm−3)0.036 0.034 0.024 0.022 0.025
NRMSE/%14.26%12.56%9.10%8.57%9.42%
P2P3N320MRE/%14.09%11.34%9.94%7.11%5.97%
RMSE/(cm3·cm−3)0.036 0.031 0.029 0.025 0.017
NRMSE/%14.09%11.68%10.65%9.41%7.00%
CKMRE/%13.04%10.68%9.57%6.81%7.30%
RMSE/(cm3·cm−3)0.033 0.030 0.028 0.019 0.020
NRMSE/%13.11%11.11%10.17%7.25%7.83%
Table 5. Comparison of simulated and measured values of NO3-N concentration in the 0–100 cm soil layer during validation.
TreatmentIndexSoil Depth/cm
0–2020–4040–6060–8080–100
P1P2N120MRE/%21.06%15.26%11.85%7.09%7.62%
RMSE/(mg·kg−1)1.1020.4820.2300.1990.160
NRMSE/%12.29%11.94%11.85%5.89%7.09%
P1P3N120MRE/%17.77%10.88%4.96%5.03%4.98%
RMSE/(mg·kg−1)1.0410.6370.2610.1510.171
NRMSE/%10.49%14.42%8.20%5.84%7.33%
P2P3N120MRE/%24.27%14.41%8.67%8.37%7.74%
RMSE/(mg·kg−1)0.9110.3120.2060.1160.160
NRMSE/%15.58%13.53%10.62%6.53%9.18%
P1P2N220MRE/%20.54%15.16%10.34%6.30%4.36%
RMSE/(mg·kg−1)1.6931.1470.6120.2710.220
NRMSE/%13.34%14.81%10.38%5.96%5.66%
P1P3N220MRE/%25.61%21.54%11.64%15.84%9.44%
RMSE/(mg·kg−1)1.6800.9340.4780.2500.205
NRMSE/%12.79%13.84%11.55%8.98%8.34%
P2P3N220MRE/%20.95%13.57%7.74%10.70%6.81%
RMSE/(mg·kg−1)1.1020.4820.2300.1990.160
NRMSE/%13.09%12.59%8.08%9.87%8.43%
P1P2N320MRE/%23.24%16.43%8.35%5.40%9.73%
RMSE/(mg·kg−1)1.9951.1410.6360.2150.313
NRMSE/%14.00%11.92%9.31%5.24%8.55%
P1P3N320MRE/%19.18%14.84%6.94%5.86%5.48%
RMSE/(mg·kg−1)1.7060.8620.4410.5040.421
NRMSE/%14.15%11.59%7.16%8.37%8.32%
P2P3N320MRE/%24.11%17.65%11.48%11.38%7.76%
RMSE/(mg·kg−1)1.4610.7370.4570.2900.208
NRMSE/%13.89%12.89%9.78%9.84%8.93%
CKMRE/%33.01%12.67%12.65%8.34%7.80%
RMSE/(mg·kg−1)0.5100.2330.1360.1330.111
NRMSE/%17.84%13.41%8.61%7.36%5.89%
Table 6. Comparison of measured and simulated maize phenological stage values at different nitrogen application rates and periods of nitrogen application during validation.
TreatmentEmergence (d)Anthesis (d)Maturity (d)
Measured SimulatedErrorMeasured Simulated ErrorMeasured Simulated Error
P1P2N12075−256571981002
P1P3N12075−256571981002
P2P3N12075−256571981002
P1P2N22075−25857−11001000
P1P3N22075−25857−1101100−1
P2P3N22075−2575701001000
P1P2N32075−25857−1101100−1
P1P3N32075−257570101100−1
P2P3N32075−25857−11001000
CK75−255572971003
Note: Error = Simulated value − Measured value.
Table 7. Comparison of simulated and measured values of summer maize yield, above-ground biomass, and above-ground nitrogen content at different nitrogen application periods and nitrogen application rates during validation.
TreatmentYield
(kg·hm−2)
Aboveground Biomass
(kg·hm−2)
Aboveground Nitrogen Uptake
(kg·hm−2)
Simulated Measured RESimulated Measured RESimulated Measured RE
P1P2N1205859.566355 ± 110.62 de−7.80%14,005.97 15,112.74 ± 243.16 c−7.32%118.11 124.81 ± 9.33 d−5.36%
P1P3N1205545.566014.95 ± 141.57 e−7.80%13,727.36 14,813.77 ± 157.37 c−7.33%120.83 129.53 ± 13.24 d−6.72%
P2P3N1205923.676433.72 ± 203.74 d−7.93%14,163.88 15,241.36 ± 203 c−7.07%122.74 127.39 ± 6.13 d−3.65%
P1P2N2207987.178508.75 ± 132.73 ab−6.13%16,430.72 18,139.29 ± 218.05 ab−9.42%176.72 183.58 ± 12.72 c−3.74%
P1P3N2207789.508204.99 ± 211.13 bc−5.06%16,101.62 17,719.27 ± 96.95 b−9.13%181.39 188.33 ± 8.3b c−3.68%
P2P3N2208123.898623.67 ± 126.56 a−5.80%16,872.32 18,311.01 ± 123.96 ab−7.86%183.39 189.33 ± 10.02 bc−3.14%
P1P2N3207620.988173.75 ± 78.36 bc−6.76%16,562.23 18,256.32 ± 216.02 ab−9.28%201.97 209.84 ± 11.16 ab−3.75%
P1P3N3207545.507975.9 ± 147.79 c−5.40%16,352.56 17,992.32 ± 135.89 ab−9.11%203.78 213.87 ± 12.26 ab−4.72%
P2P3N3207789.608369.32 ± 203.53 abc−6.93%17,025.56 18,411.74 ± 206.8 a−7.53%205.69 219.81 ± 8.76 a−6.42%
CK4356.565144.76 ± 194.92 f−15.32%10,234.26 12,066.73 ± 636.59 d−15.19%71.52 82.34 ± 9.35 e−13.14%
RMSE535.59 1483.588.68
NRMSE7.26%8.93%5.20%
MRE7.49%8.92%5.43%
Note: Different lowercase letters in the same column indicate significant differences among treatments (p < 0.05).
Table 8. Comparison of simulated and measured values of nitrogen indicators.
TreatmentNitrogen Agronomic Efficiency
(kg/kg)
Physiological Efficiency of Nitrogen
(kg/kg)
Apparent Recovery of Nitrogen
(%)
Measured Simulated REMeasured Simulated REMeasured Simulated RE
P1P2N12010.0912.5324.13%28.532.2613.18%35.3940.939.72%
P1P3N1207.259.9136.67%18.424.1230.78%39.3243.194.47%
P2P3N12010.7413.0621.59%28.6130.606.95%37.5444.7813.69%
P1P2N22015.2916.507.93%33.2334.513.86%46.0248.963.90%
P1P3N22013.9115.6012.18%28.8731.258.23%48.1851.093.66%
P2P3N22015.8117.128.31%32.5233.683.55%48.6352.004.57%
P1P2N3209.4710.207.72%23.7625.025.32%39.8441.552.33%
P1P3N3208.859.9712.60%21.5224.1112.04%41.1042.120.56%
P2P3N32010.0810.736.43%23.4625.599.07%42.9642.72−2.40%
CK---------
MRE15.29%10.33%4.50%
RMSE1.720 2.820 0.020
NRMSE15.25%10.62%4.75%
Table 9. TOPSIS analysis table for field trials.
ScenarioPositive Ideal Solution Distance
(D+)
Negative Ideal Solution Distance
(D)
Relative Proximity
(C)
Sorting Result
P1P2N1200.2250.1490.3986
P1P2N2200.0260.3240.9262
P1P2N3200.2280.1350.3737
P1P3N1200.3340.0310.0859
P1P3N2200.0790.2690.7733
P1P3N3200.2550.1130.3078
P2P3N1200.2030.1630.4454
P2P3N2200.0090.3380.9751
P2P3N3200.2090.1560.4285
Table 10. Scenario simulation design.
TreatmentBase FertilizerTopdressingFertilizer Application RateTotal
TrumpetingAnthesis
N160 (1:1:2)4040801:1:2160
N160 (1:2:1)4080401:2:1160
N160 (2:1:1)8040402:1:1160
N180 (1:1:2)4545901:1:2180
N180 (1:2:1)4590451:2:1180
N180 (2:1:1)9045452:1:1180
N200 (1:1:2)50501001:1:2200
N200 (1:2:1)50100501:2:1200
N200 (2:1:1)10050502:1:1200
N220 (1:1:2)55551101:1:2220
N220 (1:2:1)55110551:2:1220
N220 (2:1:1)11055552:1:1220
N240 (1:1:2)60601201:1:2240
N240 (1:2:1)60120601:2:1240
N240 (2:1:1)12060602:1:1240
N260 (1:1:2)65651301:1:2260
N260 (1:2:1)65130651:2:1260
N260 (2:1:1)13065652:1:1260
N280 (1:1:2)70701401:1:2280
N280 (1:2:1)70140701:2:1280
N280 (2:1:1)14070702:1:1280
N300 (1:1:2)75751501:1:2300
N300 (1:2:1)75150751:2:1300
N300 (2:1:1)15075752:1:1300
N320 (1:1:2)80801601:1:2320
N320 (1:2:1)80160801:2:1320
N320 (2:1:1)16080802:1:1320
Table 11. TOPSIS analysis table for scenario simulation.
ScenarioPositive Ideal Solution Distance
(D+)
Negative Ideal Solution Distance
(D)
Relative Proximity
(C)
Sorting Result
N160 (1:1:2)0.0840.0820.49417
N160 (1:2:1)0.0380.1310.7768
N160 (2:1:1)0.0650.1010.61014
N180 (1:1:2)0.0590.1060.64312
N180 (1:2:1)0.0220.1450.8694
N180 (2:1:1)0.0430.1200.7379
N200 (1:1:2)0.0240.1340.8475
N200 (1:2:1)0.0040.1570.9781
N200 (2:1:1)0.0110.1480.9292
N220 (1:1:2)0.0340.1250.7887
N220 (1:2:1)0.0170.1420.8923
N220 (2:1:1)0.0270.1320.836
N240 (1:1:2)0.0610.0980.61613
N240 (1:2:1)0.0430.1170.73310
N240 (2:1:1)0.0520.1080.67811
N260 (1:1:2)0.0880.0720.45118
N260 (1:2:1)0.0750.0860.53615
N260 (2:1:1)0.0810.0800.49616
N280 (1:1:2)0.1110.0510.31321
N280 (1:2:1)0.0970.0650.39919
N280 (2:1:1)0.1040.0580.35720
N300 (1:1:2)0.1320.0330.19825
N300 (1:2:1)0.1150.0490.29922
N300 (2:1:1)0.1250.0390.23923
N320 (1:1:2)0.1540.0210.11827
N320 (1:2:1)0.1330.0360.21324
N320 (2:1:1)0.1400.0300.17526
Disclaimer/Publisher’s Note: The statements, opinions and data contained in all publications are solely those of the individual author(s) and contributor(s) and not of MDPI and/or the editor(s). MDPI and/or the editor(s) disclaim responsibility for any injury to people or property resulting from any ideas, methods, instructions or products referred to in the content.