Abstract
Analysis of the nematode community has been considered a key indicator of soil health. In this study, the assessment of nematodes was performed two times during the third growing season in soil contaminated by chemical elements where Miscanthus × giganteus was cultivated in the years 2019–2022. A morphological approach was used to identify the nematode communities that showed sensitivity to the level of soil contamination. In contrast, the value of M × g dry biomass was a more conservative indicator and displayed only a small yield, which decreased (3.6%) at the highest level of soil contamination by lead to 290.5 ± 75.4 µg/g. Principal component analysis revealed four trends associated with the coherent variability of contamination in soil and various organs of M × g. The variability of elements was reflected by the first three principal components and did not affect the nematode community. The variability of lead concentration was associated with principal component 4, which was the largest driver of changes in the nematode community. The trophic structure of the nematode communities was the most sensitive to soil contamination by lead. A decrease in the Structural Index was the general indicator in the transformation of the nematode community structure due to increasing levels of soil contamination.
1. Introduction
The global increase of contaminated areas is a key challenge restricting the satisfaction of society’s needs for a healthy environment [1]. In Ukraine, the contamination of soil by varied chemical elements has become a tremendous large-scale problem due to previous impacts caused by industrial, mining, and agricultural activities, as well as the current influence of the ongoing war’s consequences, which have extremely exacerbated the level of contamination. The biggest current concern is the development of cheap, common, and environmentally friendly technologies that can assist in soil revitalization, among which phytoremediation has appeared as a suitable option [2]. Plants utilized for phytoremediation should produce high biomass and large root systems and be fast growing, easy to harvest, and tolerant to abiotic environmental factors [3]. Some herbs that meet these requirements are used in phytotechnology that ensures the regeneration of soil and the simultaneous production of biomass for further processing as energy or bioproducts. Studies conducted over the last 10–15 years have indicated that the perennial grass Miscanthus × giganteus (M × g) is a rather promising crop in phytotechnology [2]. The plant rather often fixes chemical elements via phytostabilization [4]; thus, its plantations can be considered for reducing the spread of toxicants. Despite a growing amount of research on using M × g as a phyto-agent, less attention has been paid to changes in soil biodiversity during a crop’s cultivation.
In general, M × g plantations established on soil contaminated with chemical elements have shown an increase in the abundance and diversity of soil invertebrates compared to soil under annual crops. The multiyear cultivation of this plant increased the number of resident, detritivorous, and rhizophagous species and stimulated a trend toward an increasing proportion of larger invertebrates [5,6]. Soil nematodes are highly resistant to toxic effects and can therefore form diverse and stable communities in soils contaminated with different toxicants [7]. Nematodes participate in the soil processes of organic matter transformation [8], which directly affects the immobilization of toxicants [9], and they can considered as bioindicators of soil disturbance in terrestrial ecosystems.
The characteristics of nematodes provide valuable tools for determining soil health [10]. They respond to the application of organic amendments during the growth of various crops, including perennial grasses [11]. Extensive studies have allowed determination of the response of nematode communities to microelement pollution, but there is no investigation that has adequately examined the bioindication of soil health in an M × g plantation. In our previous research [7], the response of soil nematodes to agronomic practices in M × g cultivation on old lead-contaminated soil was evaluated. It was revealed that avoidance of the most contaminated microlocations and selection for resistance were among the possible mechanisms of nematode tolerance. Based on these findings, we assumed that nematode fauna might develop lead-tolerant populations. However, we did not consider the potential of soil contamination by lead to alter nematode communities [7]. That is why the current study has a goal of evaluating nematodes as indicators of soil health in an M × g plantation established on soil exposed to four levels of lead.
2. Materials and Methods
2.1. The Site Location and Soil Characteristics
The research site was in Kyiv (Ukraine), GPS: 50°22′57.1″ N and 30°30′30.4″ E. According to the soil classification, the soil belongs to Haplic Luvisols. The samples for analysis were collected from 5 × 5 m testing squares from across the research field; altogether, five parallel samples were taken from a depth of 0.3 m using quartering and mixed. After sampling, plant materials and stones were manually removed from the soil, and samples were dried to a constant weight, passed through a sieve (d = 2 mm), mixed using the envelope method, and processed for analysis.
The soil agrochemical characterictics were measured in accordance with the relevant standards (Table 1). It may be seen that the soil was alkaline-free, non-saline, and rich in P and K. It had a high level of organic matter; a low value of N, S, and Mg; and an average value of Ca. The concentration of chemical elements in the soil was determined using X-ray diffraction analysis, as previously described in detail in [12].

Table 1.
Agrochemical parameters of the research soil.
A preliminary study indicated that the soil was predominantly contaminated with lead, along with other chemical elements. The level of lead was varied in four levels as follows: plot 1 (variant 1), 74.3 ± 33.0 µg/g; plot 2 (variant 2), 108.5 ± 25.4 µg/g; plot 3 (variant 3), 214.2 ± 50.0 µg/g; plot 4 (variant 4), 290.5 ± 75.4 µg/g.
2.2. Plants
M × g was planted in the site on 20 April 2019. The experimental field was divided into blocks that were 2 × 3 m each, depending on the degree of lead contamination. The distance between the blocks was 1 m, and the distance between the planted rhizomes was 0.33 m. Rhizomes of the variety “Osiniy Zorezvit” were utilized, and 40 rhizomes in total were planted per plot to a depth of 10–12 cm.
The plant growing process was monitored each growing season in the years 2019–2022. Every year at the end of the growing season, the biomass was harvested manually. The yield of dry biomass was evaluated in the third year’s growth, when plantation was fully established [13]. The harvested biomass was dried on an open surface until it reached the contact weight; for determination of the dry biomass value (DW), a certain amount of biomass was transferred to a metal box and dried at 100–105 °C in a thermostat-controlled oven. Initially, the biomass was dried for eight hours; then, it was weighed and put back in the oven. The procedure was continued until the difference between the two weights was less than 0.0001 g of the constant biomass weight (henceforth referred to as DM).
2.3. Nematode Sampling, Isolation, and Identification
The nematode identification was performed in the third vegetation season (2022), and the soil samples were collected two times: on 20 May and 20 October. The soil was taken directly from the root zone of the plant at a depth of 35 cm; five sampling spots were used from each replicate, and the samples were assembled into a composite soil sample (500 g). When these samples arrived at the laboratory, they were thoroughly mixed, and 100 cm3 of each sample was used for nematode identification.
The rapid centrifugation-flotation method was used to extract the nematodes. Consequently, 100 cm3 of soil sample was placed in a 600 mL beaker, and the rest of the water volume was added to make a total volume equal to 500 mL. The soil sample was mixed and allowed to settle at the bottom of the beaker. The sediment suspension was then decanted and placed in a 200 mL tube for 3 min centrifugation at 2000× g (RCF). The supernatant was poured off and discarded. The pellet was resuspended in approximately 80 mL of sucrose solution (specific gravity 1.18, 38.5% by weight or 484 g per 1000 mL of water). The tubes were centrifuged again for 2 min at 1800× g (RCF). The nematode-containing supernatant was gently poured through a 25 m sieve. The nematodes were extracted from the sieve and placed in glass containers. Thereafter, the nematodes were heat-killed by 6% formalin (90 °C) fixed with water in equal amount, prior to being passed through a graded series of glycerol-ethanol solutions and stored on slides in anhydrous glycerol [14]. The isolated nematodes were transferred to a fixation dish containing S1 solution (20 mL of 96% ethanol, 1 mL of glycerin, and 79 mL of distilled water). The dishes were placed in a desiccator with a thin layer of 96% ethanol and moved to an incubator set to 40 °C. Using a micropipette, the S1 solution was removed after 16–24 h under the dissecting microscope, and S2 solution (93 mL of 96% ethanol and 7 mL glycerin) was added thereafter. After two hours, the fixation dish was placed back in the incubator, and two drops of dehydrated glycerin were added. The fixation cup was left for 24 h to allow the alcohol to evaporate. It was then placed in a desiccator containing silica gel to allow the last traces of water to evaporate. This way, the nematodes were ready for mounting in slides. Initially, 100 individual nematodes were detected per sample. Permanent nematode mounts on glass slides were prepared using the paraffin wax ring method. Morphological characteristics were used for nematode identification. Each nematode taxon was assigned (based on life traits and food preferences) to five trophic groups: plant parasitic, bacterivores, fungivores, and predators. Nematodes were identified to the species (plant parasitic) and genus (bacterivores, fungivores, predators, omnivores) levels using a Carl Zeiss Jena A-Scope microscope and the diagnostic key of Brzeski [15] and Andrássy [16].
2.4. Nematode Community Analysis
Analysis of the nematode community was performed using the total abundance of nematodes identified to the genus level and community biomass. Nematodes assigned into five trophic groups during the identification process were used for calculating the indices of community ecological strategies. Nematode genus was assigned to one of five classes of colonizer-persisters (c-p). “Colonizers” (c) are nematodes capable to increasing in abundance under favorable conditions [17]. These species have a short life cycle, high colonization ability, and voluminous gonads; exhibit high population density fluctuations; and produce many small eggs, often being viviparous. The colonizers are tolerant to disturbance, eutrophication, and anoxibiosis. “Persisters” (p) are nematodes that have a low reproduction rate and a long life cycle [18]. These species have a low colonization capacity and are very sensitive to habitat disturbance. The population of persisters is relatively stable over time, including in habitats with long-term temporal stability [19]. The Maturity Index (MI) was calculated as the weighted mean of the genus c-p values [19]:
where v(i) is the c-p value of nematode genus I, and f(i) is the frequency of that taxon in a sample. The calculated values of MI are presented in Table S1.
The Plant Parasite Index (PPI) is an MI based exclusively on the plant parasites value [19]. The persisters are more sensitive to soil contamination than the colonizers, so MI can be used to assess the level of soil contamination. There are two groups of opportunistic nematodes: enrichment opportunists (cp-1) and general opportunists (cp-2) [20]. The enrichment opportunists develop only under food-rich conditions and form dauer larvae after a decrease in microbial activity. The general opportunists can live in food-poor conditions and are unable to form dauer larvae. The cp-1 nematodes can be excluded from the calculation of MI for measuring the selective impact of contaminants in the soil, which resulted in an MI value of 2–5 being insensitive to any nutrient enrichment [21].
The ecological indices are used to describe the structure and complexity of food chains with the participation of nematodes. The Channel Index (CI) is based on the fast-growing bacteriophages and fungi characterized by c-p values of 1 or 2. It is an indicator of fungus and measures the ratio of fungal to bacterial activity in the food web. A basal food web is a food web that has become stressed due to resource limitations, unfavorable environmental conditions, or contamination. The Basal Index (BI) is the proportion of bacteriophages and fungi with c-p values equal to 2, implying nematodes’ adaptation to the stress conditions. The enriched food webs are disturbed, and resources become available due to organisms’ mortality, turnover, or favorable environmental changes. The microbial activity increases in the food webs and stimulates an increase in the abundance of opportunistic bacterial feeders. The Enrichment Index (EI) is considered an indicator of conditions favorable for fast-growing bacteriophages. Structured food webs are those in which resources are readily available or in which recovery from stress has occurred. The Structural Index (SI) correlates with the maturity of an ecosystem, combining nematode genera with c-p values between 3 and 5. For calculating the targeted ecological indices, an online tool, NINJA: Nematode Indicator Joint Analysis [22], was utilized.
2.5. Statistical Evaluation
The principal component analysis (PCA) was performed using the function dudi.pca in the ade4 R package [23]. The descriptive statistics and general linear models were calculated in the software package Statistica [24].
The models introduced by Huisman, Olff, and Fresco and expanded by Jansen and Oksanen [25] were utilized to describe the response of nematode species to a gradient of environmental factors, represented by principal components extracted from analysis of the variation in chemical elements’ concentrations.
The following models were used for evaluation of results:
Model I, no significant trend in space or time:
Model II, an increasing or decreasing trend where the maximum is equal to the upper bound M:
Model III, an increasing or decreasing trend where the maximum is below the upper bound M:
Model IV, an increasing and decreasing trend by the same rate—symmetrical response curve:
Model V, an increasing and decreasing trend by different rates—skewed response curve:
Model VI, bimodal symmetric responses:
Model VII, bimodal skewed responses:
In Equations (2)–(8), the abbreviations have the following meaning: y and x are the response and the explanatory variable, respectively; a, b, c, d are the parameters to be estimated (b and d have opposite signs); M is a constant, which is equal to the maximal value that can be attained (for relative frequencies M = 1, for percentages M = 100); and L is a constant equal to the maximal value for the minor extreme value.
The calculations were performed using the eHOF package [26]. The bootstrap method was used to test the robustness of the model with 200 repeated samples. The Index of Qualitative Variation (IQV) was calculated as the evaluation stability of the model form. This index is equal to zero if all repeated runs result in the same model shape, while it is equal to one if all model types are chosen equally often. The IQV value was calculated as follows:
where n is the number of model types, and p is the proportion for each model [27].
External explanatory variables can be involved in community ordination. The principal components (PCs) extracted after analyzing the variation of the chemical element concentrations were used as constraint variables for ordination. Generally, there are two alternatives for conducting a community-constrained ordination: redundancy analysis (RDA) and canonical correspondence analysis (CCA). The monotonic species response model is a basis of the RDA, and the Gaussian (unimodal) response model is a basis of the CCA. The detrend canonical analysis (DCA) should be performed to make an informed choice between RDA and CCA. If the length of the largest extracted axis after DCA exceeds 2, then CCA should be selected; otherwise, RDA should be selected [28]. Community ordination was performed using the vegan package [29]. The triangular diagrams were constructed using the loa package [30].
3. Results
3.1. Response of M × g Biomass in a Gradient of Soil Contamination
Soil contamination levels in the range from 1 to 3 did not affect the value of biomass (planned comparison F = 0.34, p = 0.57) (Figure 1).
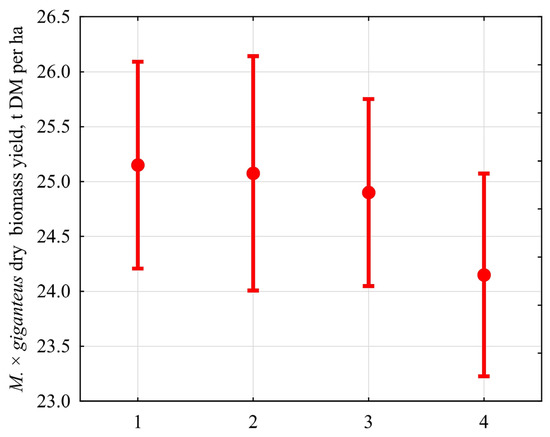
Figure 1.
M × g biomass in a gradient of soil contamination by lead. The value of biomass did not respond to the contamination levels ranging from 1 to 3 (planned comparison F = 0.34, p = 0.57). The abscissa axis presents the variant referring to lead concentration in the soil: (1) 74.3 ± 33.0 µg/g; (2) 108.5 ± 25.4 µg/g; (3) 214.2 ± 50.0 µg/g; (4) 290.5 ± 75.4 µg/g. The ordinate axis presents the value of DM, in t DM ha −1 (mean and 95 confidence interval).
M × g DM yield was 25.0 ± 0.6 t DM ha−1 at the specified contamination levels. At the contamination level 4, there was a statistically significant decrease in the M × g DM value (planned comparison F = 6.71, p = 0.023) to 24.2 ± 0.6 t DM ha −1.
3.2. Variation in Concentration of Chemical Elements in Soil and Plant Organs
Data on lead concentration in the soil were subjected to PCA, which resulted in the extraction of four principal components (PCs) whose eigenvalues exceeded unity (Table 2). These PCs described 73.3% of the variation in the chemical elements’ concentrations. PC1 described 38.7% of the variation in chemical elements’ concentrations and explained a consistent variability in the concentrations of all studied elements excluding lead. PC2 described 15.2% of the variation in chemical elements’ concentrations and explained the opposite dynamics of Al, Si, Y, and Zr compared to P and S (the correlation coefficients of PC2 with the concentration of these elements exceeds 0.4 modulo).
Table 2.
PCs of variation related to the content of elements in soil and M × g organs. Only PCs whose eigenvalues are greater than unity are presented.
PC3 described 10.9% of the variation in chemical elements’ concentrations and explained the opposite dynamics of Mg, Si, and Ca compared to Pb (the correlation coefficients of PC3 with the concentration of these elements exceeds 0.4 modulo). PC4 described only 8.5% of the variation in chemical elements’ concentrations and reflected mainly the variation of lead. PC1, 2, and 3 did not depend on the level of soil contamination, while PC4 was statistically significantly dependent on the level of contamination (Figure S1). All factors showed consistent dynamics of variability in the chemical elements’ concentrations in soil and M × g organs (Figure S2).
3.3. Nematode Abundance and Community Indexes
Overall, 24 genera of nematodes were found in the research soil (Table S1). The nematode abundance ranged from 360.58 ± 48.08 to 478.25 ± 76.07 per 100 g of soil (Table 3). Nematode community abundance in lead contamination variants 1, 2, and 3 did not differ (planned comparison F = 0.21, p = 0.65). Under contamination variant 4, nematode community abundance was statistically significantly lower compared to other levels (planned comparison F = 17.97, p < 0.001). The nematode community biomass decreased monotonically with increases in the level of soil contamination by lead (F = 2331, p < 0.001). The diversity of nematode communities was statistically significantly lower for variant 2 (planned comparison F = 25535, p < 0.001); differences in diversity between contamination variants 1, 3, and 4 were not statistically significant (planned comparison F = 2.15, p = 0.15). The change in PC1 was positively correlated with the total abundance and negatively correlated with diversity of the nematode’s community. PC1 did not correlate with the considered community indices, and PC3 was positively correlated with MI and MI 2–5. Increases in soil contamination were labeled by PC 4 and led to decreases in the abundance and biomass of the nematodes’ community, maturity, enrichment, and structure. Increases in contamination level stimulated increases in the values of PPI, CI, and B.
Table 3.
Abundance, biomass, diversity of nematode communities, nematode community indices, and their correlations with PCs (only correlation coefficients statistically significant at p < 0.05 are presented).
3.4. Responses of Nematode Species to Gradient of Environmental Factors
Results showed that model VII was the best for 58.3% cases in describing the response of nematodes species to the environmental gradient explained by PC1 (Table 4, Figure S3). No significant trend in PC1 gradient was found for five species (20.8%) (Figure S3). The mean IQV was equal to 0.68. Model VII was the best in time (41.7%) in describing species responses referred to PC2 (Figure S4). No significant trend in PC2 gradient was found for 10 species (41.7%), and in PC3 for 13 species (54.2%) (Figure S5). The mean IQVs were equal to 0.58 and 0.56 for PC2 and PC3, respectively. Model II, which corresponds to a monotonic response to environmental factor, was the best in 45.8% cases related to the PC4 gradient (Figure S6). Only one species showed no significant trend in response to this factor. The mean IQV was equal to 0.45.
Table 4.
The best species response patterns from the eHOF list along a gradient of environmental factors described by PC1–4.
3.5. Nematode Community Ordination
The constrained redundancy analysis showed that the variability in the content of contaminants described by PC1, 2, 3, and 4 was able to explain 16.8% of variability in the nematode community (F = 2.89, p = 0.003). PC1 was able to explain 3.6% of the variation in the nematode community (F = 2.78, p = 0.034); PC2 and PC3 did not have a structuring effect on the nematode community (F = 0.32, p = 0.88 and F = 0.46, p = 0.77, respectively); PC4 was able to explain 14.3% of the variation in the nematode community (F = 8.83, p < 0.001).
The community variability trend described by RDA1 was induced by the effect of PC4 (Figure 2). This axis differentiates the community into two groups. The group of genera including Aphelenchus, Filenchus, Scutylenchus, and Aphelenchoides responded positively to increasing the soil contamination level. On the contrary, the group of genera including Trichodorus, Cephalobus, Acrobeles, Merlinius, Sauertylenchus, and Paratylenchus reacted negatively to increasing the soil contamination level. Increasing of the soil contamination level led to transformation of the nematode community, resulted in an increasing value of PPI, CI, and BI, and decreasing the nematode’s community biomass, as reflected by MI, MI 2-5, and SI. Increasing of PI contributes to increasing the presence of Rotylenchus and Helicotylenchus in the community, together with increasing the community abundance and decreasing of community diversity.
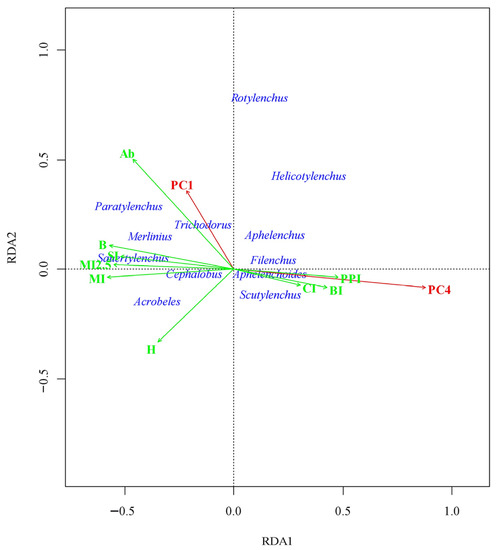
Figure 2.
Biplot of nematode genera and PCs in the space of canonical axis 1 (64.8% of the explained variance of constrained variables or 16.8% of nematode community variation) and canonical axis 2 (25.7% of the explained variance of constrained variables or 6.7% of nematode community variation). The genera of nematodes are shown with centroids at least 0.15 away from the origin. The constrained predictors of the nematode community are shown in red. The indices of the nematode community fitted to the ordination space are shown in green. Only the indices that are statistically significant (p < 0.05) are presented.
3.6. Nematode Community Maturity and Food Chain Dynamics Induced by Soil Contamination
The position of the nematodes’ community in c-p triangle space indicated the location of the stressful conditions (Figure 3). The soil contamination intensifies the stress regime with decreasing nematode community MI. The food chain of the nematode community shifted from a bacterially regulated to bacterially conductive value under the influence of increasing contamination level (Figure 4); simultaneously, the state of maturity of the nematode community was replaced by a state of disturbance.
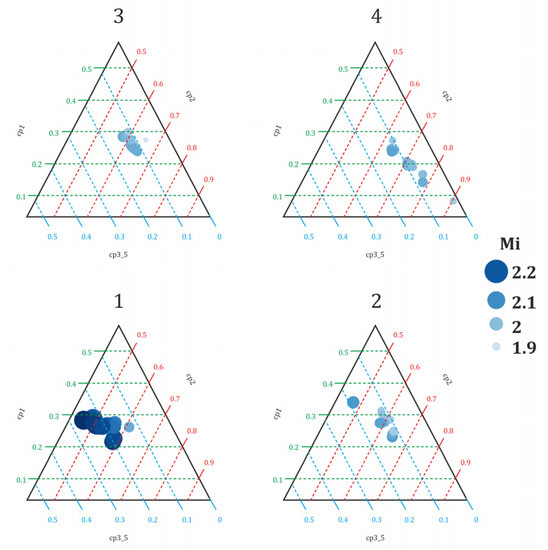
Figure 3.
The variation of MI in c-p triangle space for the different levels of soil contamination by lead (variants 1–4). The right corner denotes stress conditions, the top corner denotes enrichment, and the left corner denotes stability.
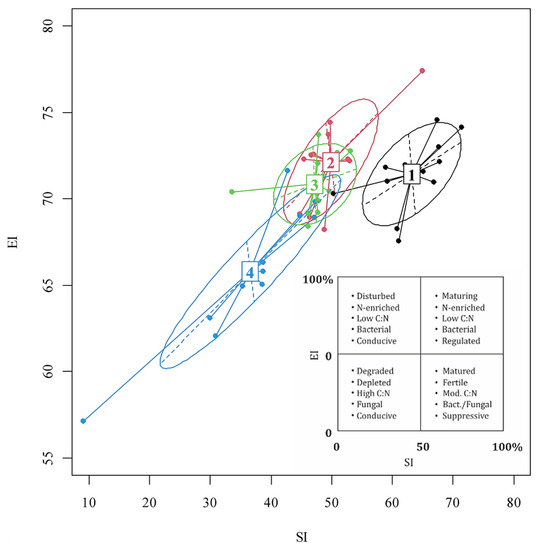
Figure 4.
Location of nematode communities in the SI (represented by the abscissa) and EI (represented by ordinate). Ellipses show communities that are in a similar contamination level of lead in the soil: variant 1—74.3 ± 33.0 µg/g; variant 2—108.5 ± 25.4 µg/g; variant 3—214.2 ± 50.0 µg/g; variant 4—290.5 ± 75.4 µg/g.
4. Discussion
Lead exposure in humans and the environment has been reduced over the past decades; however, lead emissions in agricultural soils still occur due to fertilizer applications, the use of lead shot in hunting, and deposition of lead from the air. Despite the fact that most European farmland can be considered sufficiently safe, about 6.24% needs to be evaluated locally for the application of remediation measures [31]. Lead seems particularly problematic in areas of military exposure because of its high toxicity, spread, and persistence. In peacetime, the contamination of military bases and training grounds is common [32]. The unprecedentedly intense military operations in Ukraine have led to soil disturbance and contamination over a very large area. The real scale of the ecological catastrophe has yet to be assessed, but remote sensing data already show the significant negative effects of the war on the state of the environment [33].
Ukraine is a key candidate to be a global supplier of raw materials for biofuel production [34]. Obviously, the cultivation of energy crops can be a promising alternative for land reclamation, accompanied by significant ecological and economic benefits. Bioenergy crops can provide alternative benefits to the agricultural sector and reduce the risks associated with the transfer of elements into food webs [35]. The immobilization of toxic elements, restoration of soil profile, prevention of soil erosion [36], and carbon sequestration can be significantly accelerated by growing energy crops, first of all Miscanthus spp. [37] in agricultural areas in central Ukraine, where intensive combat operations have taken place. The dynamics of organic carbon in soil ecosystems contaminated with military-origin lead has a significant impact on the restoration of the soil cover [38]. In this respect, the state of soil nematode communities plays a crucial role as one of the important indicators of soil health.
Our field experiment showed the sensitivity of the soil nematode community to soil lead contamination. In turn, harvested biomass of M × g was a much more conservative indicator: only at the highest level of soil contamination by lead was a small decrease (3.6%) observed. These data confirmed earlier reported results [39], validating the high capacity of M × g to resist and tolerate chemical-element-contaminated conditions. Utilization of PCA allowed us to identify four trends related to the coherent variability of chemical elements’ concentration in the soil and various organs of M × g. PC1 describes the variability of chemical properties induced by the natural fluctuations in the environmental regimes, likely including, for example, variability in soil moisture, acidity [40], and soil organic matter content [41]. PC4 describes the variability caused by lead pollution. The current study evaluates the variability in chemical elements’ concentrations in the soil caused by the coordinated dynamics of their concentration in M × g tissues. The study of the variability of elements’ concentrations during M × g phytoremediation showed [12] that the driving factors of an element’s distribution in the plant were the concentration of elements in the soil and different uptake regimes to the plant’s tissue.
PC1 reflects the coordinated dynamics of all monitored elements except lead (Figure 4). These elements represent the main pool of inorganic chemical compounds, so it is reasonable to assume that variation in soil organic matter is the driver that generates this pattern. Heterogeneity in the spatial distribution of organic matter in the soil is a very common phenomenon. However, the variation in total mineral matter levels in soil within the studied range was not a significant factor causing a considerable transformation in the nematode community structure, even though this variation dominated compared to other aspects. The level of variation that is described by PC1 (Figure 4) was within the optimum for most species that constitute this community. The ordination showed that only two nematode genera responded positively to an increase in total elements’ concentration, which also explains the negative correlation of PC1 and community diversity. The optimality of nematode conditions in the PC1 gradient was also supported by fact that bimodal models were effective for describing the species’ responses. Response bimodality is often seen as the result of biotic species’ interactions [42]. This indicates that the structuring influence of environmental factors is receding into the background, and the competition between species is becoming more important. Similar reasoning holds for the PC2 and PC3 trends. As the variables describing community ordination, they are not statistically significant. Thus, the considerable aspect of variability in the chemical composition of soils and plants has no significant effect on the nematode community. Obviously, this result is an illustration of Shelford’s law of tolerance [43], according to which species in the vicinity of the optimum are insensitive to changes in environmental factors.
PC4 is a marker that is connected to the level of lead contamination (Figure 3). It was found that the monotonic response of the nematode community to soil contamination levels was typical for the studied nematode genera: an increase in contamination level reduced both the total number and biomass of the nematode community. An important pattern in the transformation of the functional structure of the nematode community with regard to soil contamination was a decrease in its maturity, enrichment, and structure, but an increase in PPI, CI, and BI (Table 3). Our results concerning the sensitivity of nematode species to the level of lead contamination agree with data obtained by other researchers. A study of the effect of mine tailings on the spatial variability of soil nematodes showed the tolerance of Aphelenchus and Aphelenchoides to lead contamination, which was fully confirmed in our study. However, nematodes of the genus Aphelenchoides are found to be sensitive to soil contamination by Pb, Zn, and As [44]. The levels of contamination by the chemical elements considered in [44] are significantly higher compared to those studied in our research. That explains why we were not able to detect a negative effect of lead on Aphelenchoides. In most studies, the findings indicate that nematodes of the genera Aphelenchus and Aphelenchoides are tolerant or indifferent to soil contamination by chemical elements. PC4 described 7.6 times less variation in the content of concentration of chemical elements in soil and plant organs than PCs 1–3 (64.8 vs. 7.6%); however, PC4 was able to explain 5.7 times more variation in the nematode community structure than PC1, PC2, and PC3 (2.5% explained PCs 1–3 and 14.3% explained PC4). Thus, the nematode community appeared more sensitive to soil contamination than to the natural variability of chemical elements.
The wide trophic spectrum of the genus Filenchus might explain their tolerance to soil lead contamination. The representatives of this genus are tolerant to contamination of the soil by both lead and other chemical elements [45]. Species of the genus Filenchus reproduce by feeding on fungi in the soil, which suggests that feeding on fungi is not an unusual habit in the field for this genus. There is a view [46] that in community studies, nematodes of the genus Filenchus should be considered fungivores or root and fungivores, not just herbivores. However, it is reported that nematodes of the genus Filenchus are sensitive to mining and agricultural activities that lead to soil lead contamination [47].
The decreasing of the total abundance and biomass of the nematode community under soil contamination with toxicants is known [48]. Our results suggest that total nematodes community biomass is a more sensitive indicator than the total abundance. Obviously, this pattern is a consequence of the fact that larger nematodes are more sensitive to habitat degradation. This assumption is supported by trends in the MI, which also decreases in response to soil contamination (Figure 3). However, larger animals have a relatively smaller surface area compared to smaller ones, so the rate at which toxic substances uptake their bodies is lower. Therefore, the direct toxic effects cannot be an immediate cause of the observed greater sensitivity of larger nematodes to contamination. The disturbance of trophic chains can be the most significant mechanism of the preferential decrease in biomass compared to the decrease in community abundance under conditions of soil lead contamination. The large species also have a longer life cycle and lower reproductive capacity, which makes them more sensitive to disturbances [19]. Omnivores and predatory nematodes are both common among large species, so we cannot exclude the increasing influence of toxicants because of bioaccumulation along the food chains.
MI and PPI behave in opposite ways in terms of soil contamination level. These indexes are usually considered as a source of information for assessing the level of ecosystem disturbance. The increase in PPI is also seen as an indicator of plant growth. The chemical-element-resistant microorganisms can become dominant in element-saturated soils [49]. However, this does not guarantee that they can perform the same ecological functions as chemical-element-sensitive microorganisms. Changes in the soil microbial communities can cause a chain reaction effect throughout the soil ecosystem, interrupting regular soil processes and reducing the soil productivity. The chemical elements inhibit the microbial decomposition of organic matter, which slows elemental renewal and reduces nutrient storage [50]. In this case, the soil physical properties can deteriorate, causing poor drainage and decreasing available nutrients [51]. The soil nematodes are also impacted by the chemical elements, showing decreased feeding activity, abundance, and diversity [52]. The disappearance of chemical-element-sensitive microbes affects plant and phytotrophic animal interactions. A selective change in the structure of the microbial population influenced by the chemical elements stimulates an increase in plant nutrient content and biomass, making plants more susceptible to the root nematodes. In the presence of sensitive microbes [53], concentrations of nitrogen, sugar, and amino acid in plant roots appear lower in combination with the higher levels of protective compounds. Thus, the presence of chemical elements in the soil can alter microbial communities in a way that affects the whole soil ecosystem [54]. The value of CI recorded in the current study revealed that lead contamination of soil contributes to the predominance of fungivores over bacterivores, which is in agreement with previous findings [55] when the decomposition aspects of disturbed systems are dominated mainly by fungal organisms.
SI and EI values introduce the ability to assess patterns in the soil food web and trends of the energy flow in the system [56]. EI is an indicator of community enrichment with opportunistic nematodes [57]. The food chain can be recognized as enriched, and only for the highest level of contamination (variant 4) is the level of enrichment decreased slightly (Table 3). An enriched trophic chain indicates a state of perturbation. The resources are available because of generally favorable conditions in the environment. An enrichment may be due to a splash of microbial activity, so the opportunistic bacteria that are enriched are amplified. SI increases with increasing abundance in the community of nematodes with high life span, body size, and sensitivity to disturbance [57]. The decrease of SI value is the main trend in the transformation of the trophic structure of the nematode community under the increasing concentration of contaminants that was observed in our study (Table 3). This trend revealed a decrease in trophic resources because of an increase in stress and decrease in the number of trophic relationships [58]. Our findings are in agreement with other research data illustrating that with an increase of soil contamination, a decrease in SI and an increase in EI occurs. SI is a highly sensitive indicator, specifically to soil contamination by lead [59]. Decreasing SI reflects a selective increasing of the nematode populations with low c-p values in food-rich conditions in which such nematodes are suppressed because of sensitivity to these disturbances [17]. Therefore, SI, which depends on the abundance of omnivorous and predatory nematodes, is an informative tool for assessing changes in the nematode community caused by contamination. Some studies [60] have illustrated that values of MI, SI, and EI indexes are relatively similar at the different levels of soil contamination by chemical elements. Our results indicated that changes in the trophic structure of the nematode community were not significant in the range of lead contamination level for variants 1–3 (Table 3, Figure 3 and Figure 4). The reason for this phenomenon may be the rarity and the stabilization of the relative abundance of groups with high c-p value.
5. Conclusions
Conservation measures commonly reduce the level of threats caused by soil contamination with chemical elements. The military actions in Ukraine have created the problem of soil contamination with different chemical elements, among which lead is the most common. From this point, the cultivation of energy crops, first of all M × g, in military-disturbed soil can become a prospective option for revitalization, which ensures farming on considerable territory after the end of military operations in Ukraine. During the multiyear growing, the immobilization of contaminants and carbon sequestration will be the most important ecosystem services in such M × g plantations. Analysis of the nematode community showed a high level of resistance of the nematode trophic structure to soil contaminated by lead in M × g plantation.
The component of variation in the content of chemical elements in the soil and organs of M × g induced by lead was 7.6 times less than the variation caused by other chemical elements. However, the soil contamination with lead was decisive in inducing transformation of the nematode community. While the response of nematodes to natural gradients was predominantly bell-shaped unimodal or bimodal, lead contamination of the soil edged closer to a monotonic decrease in the abundance of nematode species. SI appeared to be a sensitive tool for indicating the level of soil contamination by lead.
Further research has to be focused on multiyear monitoring of changes in the nematodes communities’ structure in soil under M × g plantation in order to confirm the peculiarities established for the third-year vegetation.
Supplementary Materials
The following supporting information can be downloaded at: https://www.mdpi.com/article/10.3390/agronomy13061620/s1, Figure S1: Variation of PCs related to soil contamination: abscissa axis presents variant of the soil contamination, ordinate axis presents PCs. The median, minimum, and maximum values and 25–75% percentile are shown; Figure S2: The variation of PCs in soil and plant organs: abscissa axis presents the plant tissue; ordinate axis presents PCs. The median, minimum, maximum values, and 25–75% percentile are shown; Figure S3: Models of species response in the gradient of PC1: abscissa axis is the value of PC1, ordinate axis is the abundance of species; Figure S4: Models of species response in the gradient of PC2: abscissa axis is the scores of PC 2, ordinate axis is the abundance of species; Figure S5: Models of species response in the gradient of PC3: abscissa axis is the scores of PC3, ordinate axis is the abundance of species; Figure S6: Models of species response in the gradient of PC4: abscissa axis is the scores of PC4, ordinate axis is the abundance of species; Table S1: Ecological traits and abundance of nematode genera (mean ± SD).
Author Contributions
Conceptualization, T.S. and V.P.; methodology, A.S. and P.S.; software, O.Z.; validation, T.S., A.S. and V.P.; formal analysis, O.Z.; investigation, T.S. and P.S.; resources, V.P.; data curation, T.S.; writing—original draft preparation, T.S. and O.Z.; writing—review and editing, V.P.; visualization, O.Z.; supervision, V.P.; project administration, V.P.; funding acquisition, V.P. All authors have read and agreed to the published version of the manuscript.
Funding
This research was partially funded by NATO SPS MYPG6094.
Data Availability Statement
https://ukrbin.com/ (accessed on 6 May 2023).
Conflicts of Interest
The authors declare no conflict of interest.
References
- Rather, R.A.; Wani, A.W.; Mumtaz, S.; Padder, S.A.; Khan, A.H.; Almohana, A.I.; Almojil, S.F.; Alam, S.S.; Baba, T.R. Bioenergy: A Foundation to Environmental Sustainability in a Changing Global Climate Scenario. J. King Saud. Univ. Sci. 2022, 34, 101734. [Google Scholar] [CrossRef]
- Erickson, L.E.; Pidlisnyuk, V. Phytotechnology with Biomass Production; Erickson, L.E., Pidlisnyuk, V., Eds.; CRC Press: Boca Raton, FL, USA, 2021; ISBN 9781003082613. [Google Scholar]
- Mamirova, A.; Pidlisnyuk, V.; Amirbekov, A.; Ševců, A.; Nurzhanova, A. Phytoremediation Potential of Miscanthus sinensis And. in Organochlorine Pesticides Contaminated Soil Amended by Tween 20 and Activated Carbon. Environ. Sci. Pollut. Res. 2021, 28, 16092–16106. [Google Scholar] [CrossRef]
- DalCorso, G.; Fasani, E.; Manara, A.; Visioli, G.; Furini, A. Heavy Metal Pollutions: State of the Art and Innovation in Phytoremediation. Int. J. Mol. Sci. 2019, 20, 3412. [Google Scholar] [CrossRef]
- Hedde, M.; van Oort, F.; Boudon, E.; Abonnel, F.; Lamy, I. Responses of Soil Macroinvertebrate Communities to Miscanthus Cropping in Different Trace Metal Contaminated Soils. Biomass Bioenergy 2013, 55, 122–129. [Google Scholar] [CrossRef]
- Skwiercz, A.; Stefanovska, T.; Pidlisnyuk, V.; Zouhar, M.; Kornobis, F.; Obruch, M.; Sozanskyi, M. Nematode Community Composition Associated with Miscanthus × Giganteus Growing at the Polluted Site. Commun. Agric. Appl. Biol. Sci. Ghent Univ. 2017, 82, 281–287. [Google Scholar]
- Alasmary, Z.; Todd, T.; Hettiarachchi, G.M.; Stefanovska, T.; Pidlisnyuk, V.; Roozeboom, K.; Erickson, L.; Davis, L.; Zhukov, O. Effect of Soil Treatments and Amendments on the Nematode Community under Miscanthus Growing in a Lead Contaminated Military Site. Agronomy 2020, 10, 1727. [Google Scholar] [CrossRef]
- Gebremikael, M.T.; Steel, H.; Buchan, D.; Bert, W.; De Neve, S. Nematodes Enhance Plant Growth and Nutrient Uptake under C and N-Rich Conditions. Sci. Rep. 2016, 6, 32862. [Google Scholar] [CrossRef]
- Wu, J.; Zhou, Q.; Huang, R.; Wu, K.; Li, Z. Contrasting Impacts of Mobilisation and Immobilisation Amendments on Soil Health and Heavy Metal Transfer to Food Chain. Ecotoxicol. Environ. Saf. 2021, 209, 111836. [Google Scholar] [CrossRef]
- Du Preez, G.; Daneel, M.; De Goede, R.; Du Toit, M.J.; Ferris, H.; Fourie, H.; Geisen, S.; Kakouli-Duarte, T.; Korthals, G.; Sánchez-Moreno, S.; et al. Nematode-Based Indices in Soil Ecology: Application, Utility, and Future Directions. Soil Biol. Biochem. 2022, 169, 108640. [Google Scholar] [CrossRef]
- Pidlisnyuk, V.; Mamirova, A.; Newton, R.A.; Stefanovska, T.; Zhukov, O.; Tsygankova, V.; Shapoval, P. The Role of Plant Growth Regulators in Miscanthus × Giganteus Growth on Trace Elements-Contaminated Soils. Agronomy 2022, 12, 2999. [Google Scholar] [CrossRef]
- Pidlisnyuk, V.; Shapoval, P.; Zgorelec, Ž.; Stefanovska, T.; Zhukov, O. Multiyear Phytoremediation and Dynamic of Foliar Metal(Loid)s Concentration during Application of Miscanthus × Giganteus Greef et Deu to Polluted Soil from Bakar, Croatia. Environ. Sci. Pollut. Res. 2020, 27, 31446–31457. [Google Scholar] [CrossRef] [PubMed]
- Krzyżak, J.; Rusinowski, S.; Sitko, K.; Szada-Borzyszkowska, A.; Stec, R.; Jensen, E.; Clifton-Brown, J.; Kiesel, A.; Lewin, E.; Janota, P.; et al. The Effect of Different Agrotechnical Treatments on the Establishment of Miscanthus Hybrids in Soil Contaminated with Trace Metals. Plants 2022, 12, 98. [Google Scholar] [CrossRef]
- Seinhorst, J.W. Killing Nematodes for Taxonomic Study with Hot f.a. 4: 1. Nematologica 1966, 12, 178–178a. [Google Scholar] [CrossRef]
- Brzeski, M.W. Nematodes of Tylenchina in Poland and Temperate Europe; Muzeum i Instytutu Zoologii, Polska Akademia Nauk (MiIZ PAN): Warsaw, Poland, 1998. [Google Scholar]
- Andrássy, I. Free-Living Nematodes of Hungary (Nematoda Errantia). In Pedozoologica Hungarica No. 4.; Csuzdi, C., Mahunka, S., Eds.; Hungarian Natural History Museum: Budapest, Hungary, 2007; p. 496. ISBN 9637093982. [Google Scholar]
- Bongers, T.; Bongers, M. Functional Diversity of Nematodes. Appl. Soil Ecol. 1998, 10, 239–251. [Google Scholar] [CrossRef]
- Hua, E.; Zhu, Y.; Huang, D.; Liu, X. Are Free-Living Nematodes Effective Environmental Quality Indicators? Insights from Bohai Bay, China. Ecol. Indic. 2021, 127, 107756. [Google Scholar] [CrossRef]
- Bongers, T. The Maturity Index: An Ecological Measure of Environmental Disturbance Based on Nematode Species Composition. Oecologia 1990, 83, 14–19. [Google Scholar] [CrossRef] [PubMed]
- Ettema, C.H.; Bongers, T. Characterization of Nematode Colonization and Succession in Disturbed Soil Using the Maturity Index. Biol. Fertil. Soils 1993, 16, 79–85. [Google Scholar] [CrossRef]
- Bongers, T.; Korthals, G. The Behaviour of Maturity Index and Plant Parasite Index under Enriched Conditions. In Proceedings of the 22nd International Symposium of the European Society of Nematologists, Ghent, Belgium, 7–12 August 1994; p. 39. [Google Scholar]
- Sieriebriennikov, B.; Ferris, H.; de Goede, R.G.M. NINJA: An Automated Calculation System for Nematode-Based Biological Monitoring. Eur. J. Soil Biol. 2014, 61, 90–93. [Google Scholar] [CrossRef]
- Dray, S.; Dufour, A.B. The Ade4 Package: Implementing the Duality Diagram for Ecologists. J. Stat. Softw. 2007, 22, 1–20. [Google Scholar] [CrossRef]
- StatSoft Inc. STATISTICA Data Analysis Software System, Version 12.0, 1984–2014; StatSoft Inc.: Tulsa, OK, USA, 2014.
- Jansen, F. Hierarchical Species Response Curves in Package EHOF. 2013. Volume 1, pp. 1–9. Available online: ftp://mirror.hmdc.harvard.edu/mirrors/cran.r-project.org/web/packages/eHOF/vignettes/eHOF.pdf (accessed on 23 April 2023).
- Jansen, F.; Oksanen, J. How to Model Species Responses along Ecological Gradients—Huisman-Olff-Fresco Models Revisited. J. Veg. Sci. 2013, 24, 1108–1117. [Google Scholar] [CrossRef]
- Michaelis, J.; Diekmann, M.R. Biased Niches—Species Response Curves and Niche Attributes from Huisman-Olff-Fresco Models Change with Differing Species Prevalence and Frequency. PLoS ONE 2017, 12, e0183152. [Google Scholar] [CrossRef]
- Šmilauer, P.; Lepš, J. Multivariate Analysis of Ecological Data Using CANOCO 5; Cambridge University Press: Cambridge, UK, 2014. [Google Scholar]
- Oksanen, J.; Blanchet, F.G.; Kindt, R.; Legendre, P.; Minchin, P.R.; O’Hara, R.B.; Simpson, G.L.; Solymos, P.; Stevens, M.H.H.; Wagner, H. Community Ecology Package; R Package Version 2.5-2. 2018. Available online: http://CRAN.Rproject.org/package=vegan (accessed on 6 May 2023).
- Loecher, M.; Ropkins, K. RgoogleMaps and Loa: Unleashing R Graphics Power on Map Tiles. J. Stat. Softw. 2015, 63, 1–18. [Google Scholar] [CrossRef]
- Tóth, G.; Hermann, T.; Da Silva, M.R.; Montanarella, L. Heavy Metals in Agricultural Soils of the European Union with Implications for Food Safety. Environ. Int. 2016, 88, 299–309. [Google Scholar] [CrossRef] [PubMed]
- Etim, E.U.; Onianwa, P.C. Lead Contamination of Soil in the Vicinity of a Military Shooting Range in Ibadan, Nigeria. Toxicol. Environ. Chem. 2012, 94, 895–905. [Google Scholar] [CrossRef]
- Zhang, C.; Hu, Q.; Su, W.; Xing, C.; Liu, C. Satellite Spectroscopy Reveals the Atmospheric Consequences of the 2022 Russia-Ukraine War. Sci. Total Environ. 2023, 869, 161759. [Google Scholar] [CrossRef] [PubMed]
- Schaffartzik, A.; Plank, C.; Brad, A. Ukraine and the Great Biofuel Potential? A Political Material Flow Analysis. Ecol. Econ. 2014, 104, 12–21. [Google Scholar] [CrossRef]
- Shen, S.; Chen, J.; Chang, J.; Xia, B. Using Bioenergy Crop Cassava (Manihot esculenta) for Reclamation of Heavily Metal-Contaminated Land. Int. J. Phytoremedia. 2020, 22, 1313–1320. [Google Scholar] [CrossRef] [PubMed]
- Blanco-Canqui, H. Energy Crops and Their Implications on Soil and Environment. Agron. J. 2010, 102, 403–419. [Google Scholar] [CrossRef]
- Ussiri, D.A.N.; Guzman, J.G.; Lal, R.; Somireddy, U. Bioenergy Crop Production on Reclaimed Mine Land in the North Appalachian Region, USA. Biomass Bioenergy 2019, 125, 188–195. [Google Scholar] [CrossRef]
- Silveira, M.L.; Comerford, N.B.; Reddy, K.R.; Prenger, J.; DeBusk, W.F. Influence of Military Land Uses on Soil Carbon Dynamics in Forest Ecosystems of Georgia, USA. Ecol. Indic. 2010, 10, 905–909. [Google Scholar] [CrossRef]
- Bastia, G.; Al Souki, K.S.; Pourrut, B. Evaluation of Miscanthus × Giganteus Tolerance to Trace Element Stress: Field Experiment with Soils Possessing Gradient Cd, Pb, and Zn Concentrations. Plants 2023, 12, 1560. [Google Scholar] [CrossRef] [PubMed]
- Luque-Espinar, J.A.; Pardo-Igúzquiza, E.; Grima-Olmedo, J.; Grima-Olmedo, C. Multiscale Analysis of the Spatial Variability of Heavy Metals and Organic Matter in Soils and Groundwater across Spain. J. Hydrol. 2018, 561, 348–371. [Google Scholar] [CrossRef]
- Stefanowicz, A.M.; Kapusta, P.; Zubek, S.; Stanek, M.; Woch, M.W. Soil Organic Matter Prevails over Heavy Metal Pollution and Vegetation as a Factor Shaping Soil Microbial Communities at Historical Zn–Pb Mining Sites. Chemosphere 2020, 240, 124922. [Google Scholar] [CrossRef] [PubMed]
- Falko, N.; Zhukov, O. Transition from Hierarchy to Adhocratic Organizational Culture in a Ukrainian University: From Survival to Successful Development in the Conditions of War. Probl. Perspect. Manag. 2023, 21, 15–22. [Google Scholar] [CrossRef]
- Shelford, V.E. Some Concepts of Bioecology. Ecology 1931, 12, 455–467. [Google Scholar] [CrossRef]
- Renčo, M.; Čerevková, A.; Hlava, J. Life in a Contaminated Environment: How Soil Nematodes Can Indicate Long-Term Heavy-Metal Pollution. J. Nematol. 2022, 54, 1–16. [Google Scholar] [CrossRef] [PubMed]
- Nagy, P. Effect of an Artificial Metal Pollution on Nematode Assemblage of a Calcareous Loamy Chernozem Soil. Plant Soil 1999, 212, 35–43. [Google Scholar] [CrossRef]
- Okada, H.; Harada, H.; Kadota, I. Fungal-Feeding Habits of Six Nematode Isolates in the Genus Filenchus. Soil Biol. Biochem. 2005, 37, 1113–1120. [Google Scholar] [CrossRef]
- Rodríguez Martín, J.A.; Gutiérrez, C.; Escuer, M.; García-González, M.T.; Campos-Herrera, R.; Águila, N. Effect of Mine Tailing on the Spatial Variability of Soil Nematodes from Lead Pollution in La Union (Spain). Sci. Total Environ. 2014, 473–474, 518–529. [Google Scholar] [CrossRef]
- Chauvin, C.; Trambolho, M.; Hedde, M.; Makowski, D.; Cérémonie, H.; Jimenez, A.; Villenave, C. Soil Nematodes as Sndicators of Heavy Metal Pollution: A Meta-Analysis. Open J. Soil Sci. 2020, 10, 579–601. [Google Scholar] [CrossRef]
- El Baz, S.; Baz, M.; Barakate, M.; Hassani, L.; El Gharmali, A.; Imziln, B. Resistance to and Accumulation of Heavy Metals by Actinobacteria Isolated from Abandoned Mining Areas. Sci. World J. 2015, 2015, 1–14. [Google Scholar] [CrossRef]
- Mitra, S.; Chakraborty, A.J.; Tareq, A.M.; Emran, T.B.; Nainu, F.; Khusro, A.; Idris, A.M.; Khandaker, M.U.; Osman, H.; Alhumaydhi, F.A.; et al. Impact of Heavy Metals on the Environment and Human Health: Novel Therapeutic Insights to Counter the Toxicity. J. King Saud Univ. Sci. 2022, 34, 101865. [Google Scholar] [CrossRef]
- Boshoff, M.; De Jonge, M.; Dardenne, F.; Blust, R.; Bervoets, L. The Impact of Metal Pollution on Soil Faunal and Microbial Activity in Two Grassland Ecosystems. Environ. Res. 2014, 134, 169–180. [Google Scholar] [CrossRef] [PubMed]
- Gutiérrez, C.; Fernández, C.; Escuer, M.; Campos-Herrera, R.; Beltrán Rodríguez, M.E.; Carbonell, G.; Rodríguez Martín, J.A. Effect of Soil Properties, Heavy Metals and Emerging Contaminants in the Soil Nematodes Diversity. Environ. Pollut. 2016, 213, 184–194. [Google Scholar] [CrossRef]
- Hol, W.H.G.; de Boer, W.; Termorshuizen, A.J.; Meyer, K.M.; Schneider, J.H.M.; van Dam, N.M.; van Veen, J.A.; van der Putten, W.H. Reduction of Rare Soil Microbes Modifies Plant-Herbivore Interactions. Ecol. Lett. 2010, 13, 292–301. [Google Scholar] [CrossRef]
- Gall, J.E.; Boyd, R.S.; Rajakaruna, N. Transfer of Heavy Metals through Terrestrial Food Webs: A Review. Environ. Monit. Assess. 2015, 187, 201. [Google Scholar] [CrossRef]
- Ruess, L.; Ferris, H. Decomposition Pathways and Successional Changes. In Proceedings of the Fourth International Congress of Nematology, Tenerife, Spain, 8–13 June 2002; Cook, R., Hunt, D., Eds.; BRILL: Tenerife, Spain, 2004; pp. 547–556. [Google Scholar]
- Ferris, H.; Bongers, T.; De Goede, R.G.M. A Framework for Soil Food Web Diagnostics: Extension of the Nematode Faunal Analysis Concept. Appl. Soil Ecol. 2001, 18, 13–29. [Google Scholar] [CrossRef]
- Tsiafouli, M.A.; Bhusal, D.R.; Sgardelis, S.P. Nematode Community Indices for Microhabitat Type and Large Scale Landscape Properties. Ecol. Indic. 2017, 73, 472–479. [Google Scholar] [CrossRef]
- Wardle, D.A.; Yeates, G.W.; Watson, R.N.; Nicholson, K.S. The Detritus Food-Web and the Diversity of Soil Fauna as Indicators of Disturbance Regimes in Agro-Ecosystems. Plant Soil 1995, 170, 35–43. [Google Scholar] [CrossRef]
- Park, B.Y.; Lee, J.K.; Ro, H.M.; Kim, Y.H. Short-Term Effects of Low-Level Heavy Metal Contamination on Soil Health Analyzed by Nematode Community Structure. Plant Pathol. J. 2016, 32, 329–339. [Google Scholar] [CrossRef] [PubMed]
- Martinez, J.G.; Torres, M.A.; dos Santos, G.; Moens, T. Influence of Heavy Metals on Nematode Community Structure in Deteriorated Soil by Gold Mining Activities in Sibutad, Southern Philippines. Ecol. Indic. 2018, 91, 712–721. [Google Scholar] [CrossRef]
Disclaimer/Publisher’s Note: The statements, opinions and data contained in all publications are solely those of the individual author(s) and contributor(s) and not of MDPI and/or the editor(s). MDPI and/or the editor(s) disclaim responsibility for any injury to people or property resulting from any ideas, methods, instructions or products referred to in the content. |
© 2023 by the authors. Licensee MDPI, Basel, Switzerland. This article is an open access article distributed under the terms and conditions of the Creative Commons Attribution (CC BY) license (https://creativecommons.org/licenses/by/4.0/).