Article

Exploiting the Genetic Potential of Cowpea in An Intercropping Complex

1
International Institute of Tropical Agriculture (IITA), PMB 3112, Kano 700223, Nigeria
2
International Institute of Tropical Agriculture (IITA), PMB 5320, Ibadan 200284, Nigeria
*
Author to whom correspondence should be addressed.
Agronomy 2023, 13(6), 1594; https://doi.org/10.3390/agronomy13061594
Submission received: 15 April 2023 / Revised: 17 May 2023 / Accepted: 11 June 2023 / Published: 13 June 2023
(This article belongs to the Section Crop Breeding and Genetics)

Abstract

:
In the West African sub-region, intercropping is a critical element in cowpea product profiles. This study aimed to investigate the impact of intercropping cowpea with pearl millet on genetic correlations, heritability, and response to selection. Thirty-five cowpea genotypes and one pearl millet variety were used to create three cropping patterns: sole cowpea, 1:1 (one row of millet to one row of cowpea), and 2:4 (two rows of millet to four rows of cowpea). Split-plot experiments were conducted for two years with cropping patterns considered as the main plots and genotypes as sub-plots. Data were captured on grain yield (GY), 100 seed weight (Hsdwt), pod weight (Pdwt), fodder weight (Fdwt), and harvest index (HI). Genotype, cropping pattern, year, and genotype-by-cropping pattern interactions were significant for most of the traits. Higher heritability and predicted genetic advance were depicted under sole cropping rather than in the intercropped systems. High positive genetic correlations (rg ≥ 0.9) were obtained between cropping patterns. Genetic correlations among traits were higher under sole cropping than in the intercropping. Path analysis portrayed the HI as having the highest significant and positive direct effect on GY. This study identified short duration cowpea genotypes that are stable and adapted to unique cropping systems.

1. Introduction

Cowpea (Vigna unguiculata) has gained substantial global attention as a key food security source and nutritional crop due to its inherent resilience to harsh conditions. It is a major staple legume, feeding millions of people in sub-Saharan Africa and parts of Asia and America [1,2,3,4]. The crop is rich in protein and carbohydrate content, with a relatively low fat content and a similar amino acid pattern to that of cereal grains, making it an important nutritional food in the human diet [5]. Cowpea supplies sufficient micronutrients, especially zinc and iron, that are often lacking in other legumes [5,6]. It is truly a multipurpose crop, providing food and feed and serving as a precious and reliable revenue-making product for farmers and grain traders in SSA [4]. In cropping systems, cowpea compensates for the loss of nitrogen absorbed by cereals because of its symbiotic nitrogen fixing ability [7]. The production and consumption of cowpeas are the highest in several growing regions, and particularly in Western Africa, where the crop is grown in intercrop with cereals and other crops [8]. It has been reported that in Africa, over 89% of cowpeas are grown in mixed stands given that most farmers are small-scale [9]. Sole cropping, or mono-cropping, is more appropriate for big-scale farmers whose farming operations are fully mechanized.
Intercropping has been defined as the practice of growing two or more crops together in the same row or in adjacent rows close enough for biological interactions [9,10,11]. The cowpea intercropping system displays significant diversity, with more than 15 types identified in countries across West and Central Africa [12]. The practice is followed by many farmers around the world to increase overall crop productivity and profitability, improve pest and disease management, and gain better use efficiency of nutrient, water, and light resources [9,13]. It has been observed that cereal and cowpea intercropping persist as a dominant farming practice in the savannahs of West Africa [13]. This practice has continued despite the knowledge that sole cowpea is profitable, partially because farmers have long realized the multiple benefits of intercropping, including providing a buffer against total crop failure that can be realized in a sole cropping system [9]. Frequently, the practice involves intercropping cowpea with pearl millet (Pennisetum glaucum L.), sorghum (Sorghum bicolor L. Moench), and maize (Zea mays L.) [13]. The root system of intercropped legumes and cereals have different explored soil layers, which allow complementarity for soil resources (P, Fe, Zn) while avoiding root–root competitiveness [14]. In addition, legume crops can increase acid phosphatase activity in the soil by secreting organic acids and enzymes that can help to release bound phosphorus in the soil, making it available for uptake by intercropped plants [15]. Different types of intercropping are practiced across the globe, and these have been grouped as row intercropping (growing two or more crops in regular rows at the same time), mixed intercropping (two or more crops grown together without any definite row proportion), strip-intercropping (two or more crops cultivated together in strips, especially on slopes), and relay intercropping (two or more crops raised at a time during a portion of the growing period of each) [9].
Although intercropping has advantages, it has been reported that low productivity can occur due to competition for light and nutrients within the intercropping system. For example, it has been established that cowpea experiences a decrease in yield when planted together with cereals, such as pearl millet and maize, which is attributed to the shading effect caused by these latter crops [16,17]. In addition, it has been reported that the average grain productivity of the traditional intercropping system involving cowpea with sorghum and millet is about 1.5 t ha−1, yet up to 3 is attainable under sole cropping with optimum management [12,13]. The low productivity of cowpea in intercropping systems, especially involving cereals, has been attributed to the effect of shading [9,13,17]. This is because cowpea, a morphologically shorter component of the system, cannot compete for light interception and thereby suffers greater yield reduction compared to the taller cereal plants. It is therefore evident that intercropping would become more productive if the effect of shading could be diminished. The use of genotypes that can better tolerate the shading effect and produce an appreciable grain yield is a potential means of increasing cowpea productivity under the intercropping system. Studies have shown that cowpea displays genetic differences regarding adaptation to intercropping [9,13,16,17]. Positive linear correlations between the yield of cowpea in sole cropping and in intercropping with pearl millet have also been reported [18,19]. Some studies have reported significant genotype-by-cropping system interactions for grain yield, with implications seeming to indicate that cowpea genotypes respond differently to intercropping systems [18,19,20,21], yet other reports have also reflected no significant interaction effects [22,23,24]. Past breeding efforts have led to the identification of some cowpea genotypes with better adaptation to intercropping systems by producing appreciable grain and fodder yields [25,26]. These varieties, however, were majorly late duration and had spreading growth habits [17,26]. To the disadvantage of farmers who would wish to benefit from both crops in the intercrop, late duration and spreading-type varieties tended to be highly competitive and drastically reduced millet yield [17] (Terao et al., 1997). To meet the growing demands on cowpea and to better position the crop to avert the effects of climate change, there is a need to develop short duration and erect cowpea varieties that have good performance in both sole cropping and some form of mixed cropping system, given that both systems are often practiced in the same geographic area. To develop appropriate selection criteria for cowpea improvement in these circumstances, information is needed on the heritability of grain yield in intercrop and sole crop products and the genetic correlations between these cropping systems. Information on the correlations between grain yield and other traits is also important, as little is known about the effects of intercropping on these correlations.
Recently, the quest to redefine breeding objectives to move away from a trait-based to a demand-driven approach has led to the creation of product profiles. A product profile describes the package of key traits required to meet a grower’s and consumer’s needs in a distinct market segment. Intercropping has been labeled as one of the key components of the product profiles for cowpea in the West African sub-region. In this study, advanced cowpea lines from a short duration breeding pipeline of the International Institute of Tropical Agriculture (IITA) were assessed for suitability to different intercropping systems. The objectives of this investigation were to (a) assess the effects of intercropping on genetic variances and, hence, genetic advance for different traits among advanced short duration cowpea genotypes, (b) determine genetic correlations between cropping systems and how cropping systems affect genetic correlations and associations among traits, and (c) harness genotype-by-cropping system interactions to determine adaptation and stability of short duration cowpea genotypes to cropping systems.

2. Materials and Methods

2.1. Study Site

This study was conducted for two years during the wet seasons of 2020 and 2021 on the research farm of IITA at Minjibir, which is found 45 Km north of Kano, Nigeria (12°08.997′ N, 08°39.733′ E, elevation 500 m above sea level), lying in the Sudan savannah agroecology. The area has one wet season, which commences in May/June and ends in October, with a mean annual rainfall of about 690 mm, a growing period of about 120 days, and a temperature range of 26 °C to 32 °C during the wet season. The monthly precipitations and average monthly temperatures during the experimental period have been provided in Supplementary Figure S1. The soil is classified as typic udipsamments and it is sandy loam [27]. The soil physical and chemical properties of the study site, as reported in 2015 [28], indicated 84% sand, 8% silt, 8% clay, 0.3% organic carbon, 5.8 pH (H2O 1:1), 0.019 total N, 1.29 Ca (cmol/kg), 0.22 Mg (cmol/kg), 0.2 K (cmol/kg), 20.76 available P (mg/kg), 0.86 Na (cmol/kg), 0.08 Exch. acidity (cmol/kg), 2.66 ECEC (cmol/kg), 0.83 Zn (ppm), 0.25 Cu (ppm), 41.45 Mn (ppm), and 60.65 Fe (ppm).

2.2. Genetic Materials

The genetic materials used in the present study stemmed from our short duration breeding pipeline, schematized in Figure 1. Initially, crosses were made to combine major cowpea product profile traits, including tolerance to shading, which is a key determinant for adaptation to intercropping. Line derivation followed the single seed descent (SSD) breeding method until fixed lines were obtained at the F6 generation. Lines went through initial and preliminary yield testing, leading to the identification of candidates for advanced yield trials, where evaluation for suitability to intercropping was conducted. A total of 35 genotypes were evaluated for adaptation to different cropping systems. Of the 35 genotypes, 4 were checks, and they comprised 2 early maturing local varieties (Achishuru and Alokalocal), commonly used as standard checks in IITA short duration breeding pipelines, and the other two were other released varieties, IT07K-297-13 and IT08K-150-12. The genotypes used in this study were fixed lines that had reached the advanced yield trial (AYT) stage in the breeding program. These lines combine early maturity with key traits, such as high yield potential, striga resistance, and drought tolerance. A commercial millet variety (SOSAT-C88), popularly grown by farmers due to its known compatibility with legumes in intercropping systems [29], was included in the trial to create unique intercropping patterns.

2.3. Design, Layout, and Data Collection

Trials in both 2020 and 2021 were established in a split-plot design and replicated two times. In both years, pearl millet and cowpea were planted in a staggered plan, with millet planted first and cowpea planted four weeks later. This was to ensure that the reproductive phase of cowpea coincided with the maximum shading effect from the millet. The main plot consisted of 3 cropping patterns: sole (cowpea only), 1:1 (1 row of millet and 1 row of cowpea), and 2:4 (2 rows of millet and 4 rows of cowpea). The 35 genotypes constituted the sub-plot. Each cropping pattern was represented by 10 ranges (5 ranges per replication), with 7 plots wide, making a total of 70 plots per pattern. A plot consisted of 6 rows that were each 4 m long. Cowpea genotypes were planted at a spacing of 0.75 m between rows and 0.2 m within a row. The millet variety was planted at a spacing of 0.75 m between the row and 0.5 m within rows. The sowing rates were 20–25 kg/ha of seeds for cowpea and 5–6 kg/ha for pearl millet. All agronomic management practices were conducted, including manual weeding 3 times during the growing period, fertilizer (NPK) application at a standard monocrop rate of 100 kg of NPK (15-15-15) per ha on both cowpea and pearl millet, and insecticide (Belt® Expert, active ingredients: Flubendiamide 19.92% + Thiacloprid 19.92% w/w SC (480 SC) applied 3 times using a 20 L Knapsack during the growing period at a rate of 100 cc per Knapsack (10 Knapsacks per ha).
At maturity, two middle rows of cowpea were harvested from each plot and threshed, and grain weight was measured using a digital scale (Ohaus® corporation NJ 07054, USA, model SKX2202). Additional data captured from the 2 middle rows included fodder weight (weight of above ground biomass excluding pods), pod weight (total weight of harvested pods per plot), and 100 seed weight (weight of 100 seeds in grams). The harvest index was computed as the percentage of economic yield (grain yield per plot) to biological yield (total plant dry weight) [30].

2.4. Statistical Analysis

Analysis of variance (ANOVA) was performed using R software based on a split-plot design, with genotype factor as sub-plots and cropping patterns as main plots. The split-plot ANOVA was conducted on plot values of the cropping patterns for each year and across the two years. To assess variations and performances at the main-plot level, independent ANOVAs were further conducted for each of the three cropping patterns in META-R [31], utilizing the two years’ data, and using the randomized complete block design (RCBD) model. The following statistical models were used for the analyses:
Split - plot   model :   Y l i j k = μ + y l + y ( r ) i l + p j + p y j l + ε , l i j   [ p o o l e d   e r r o r ( a ) ] + g k + g y k l + g p y k j l + ε , l i j k   [ p o o l e d   e r r o r ( b ) ]
RCBD   model :   Y l i k = μ + y l + y ( r ) i l + g k + g y k l + ε , l i k
where:
  • Y l i j k represents the average response of the kth genotype in the jth intercropping pattern in the ith replication and lth year, and Y l i k is the response of kth genotype in the ith replication and lth year.
  • i = 1…r replications and r i is the replication factor.
  • k = 1…g genotypes and g k is the genotype factor.
  • j = 1…p cropping patterns and p j is the cropping pattern factor.
  • l = 1…y years and y l is the year factor.
  • Total plots (N) = 2 replications × 35 genotypes × 3 patterns = 210 plots per year.
  • μ is the population mean.
  • y ( r ) i l is a term for replication that is nested within the year.
  • g p i k is a two-way interaction term for genotype and intercropping pattern.
  • g y k l is a two-way interaction term for genotype and year.
  • p y j l is a two-way interaction term for intercropping pattern and year.
  • g p y k j l is a three-way interaction term for genotype, intercropping pattern, and year.
  • ε , l i k is residual or error variance for the RCBD model.
  • [ p o o l e d   e r r o r ( a ) ] and [ p o o l e d   e r r o r ( b ) ] are the main-plot and sub-plot error terms, respectively.
The mean comparison was performed based on the least significant difference (LSD) test from the agricolae R package [32]. The LSD.test () function was used to test differences among the means of the three intercropping patterns. Graphical visualization of mean comparison among cropping patterns was generated by plotting the results of the LSD.
Variance components and Best Linear Unbiased Predictors (BLUPs) were computed based on a linear mixed model using the lme4 R package [33]. In this analysis, genotype, replication, and year were considered random while the cropping pattern was fixed. BLUPs of genotypes were compared under each main-plot term to isolate the best-performing individual for a specific cropping system. Variance components were computed by first fitting a complex model for all the terms in the combined years’ data, followed by a simplified model that accounts for variations under specific cropping patterns (the main-plot factor). These variance components were used to estimate experiment-wide and main-plot-based broad-sense heritabilities, as follows:
Experiment - wide   heritability :   H = σ G 2 σ G 2 + σ G P 2 p + σ G Y 2 y + σ G P Y 2 p y + σ e 2 p y r
Main - plot - based   heritability :   H = σ G 2 σ G 2 + σ G y 2 y + σ e 2 y r
where σ G 2 , σ G P 2 , σ G Y 2 , and σ G P Y 2 are variance components for genotype, genotype-by-pattern interaction, genotype-by-year interaction, and genotype-by-pattern-by-year interactions.
The predicted genetic gain was also computed to assess the expected genetic advance under different cropping patterns assuming 10% selection intensity. Expected genetic advance (GA) was computed based on the breeder’s equation [34]:
G A = k i σ P H = k i σ G 2   H
where G A is the expected genetic advance, k i is a standardized selection differential ( k i = 1.755, assuming 10% selection intensity), σ P is the phenotypic standard deviations, σ G 2 is the genotypic variance component, and H is the broad-sense heritability.
Phenotypic and genetic correlations among cropping systems for a given trait and among traits across years were also computed from META-R software [31]. In this analysis, the phenotypic correlations are simple Pearson correlations between different pairs of environments or traits. The genetic correlations among cropping systems and among traits were calculated using equations modified from [35,36] as:
r g ( x , y ) = C o v g ( x , y ) σ g ( x ) 2   . σ g ( y ) 2  
where r g ( x , y ) is the genetic correlation coefficient between pairs of cropping systems or pairs of traits, C o v g ( x , y ) is the genetic covariance between pairs of cropping systems or pairs of traits, and σ g ( x ) 2 and σ g ( y ) 2 are the genetic variances of the first (x) and second (y) cropping patterns or traits, respectively.
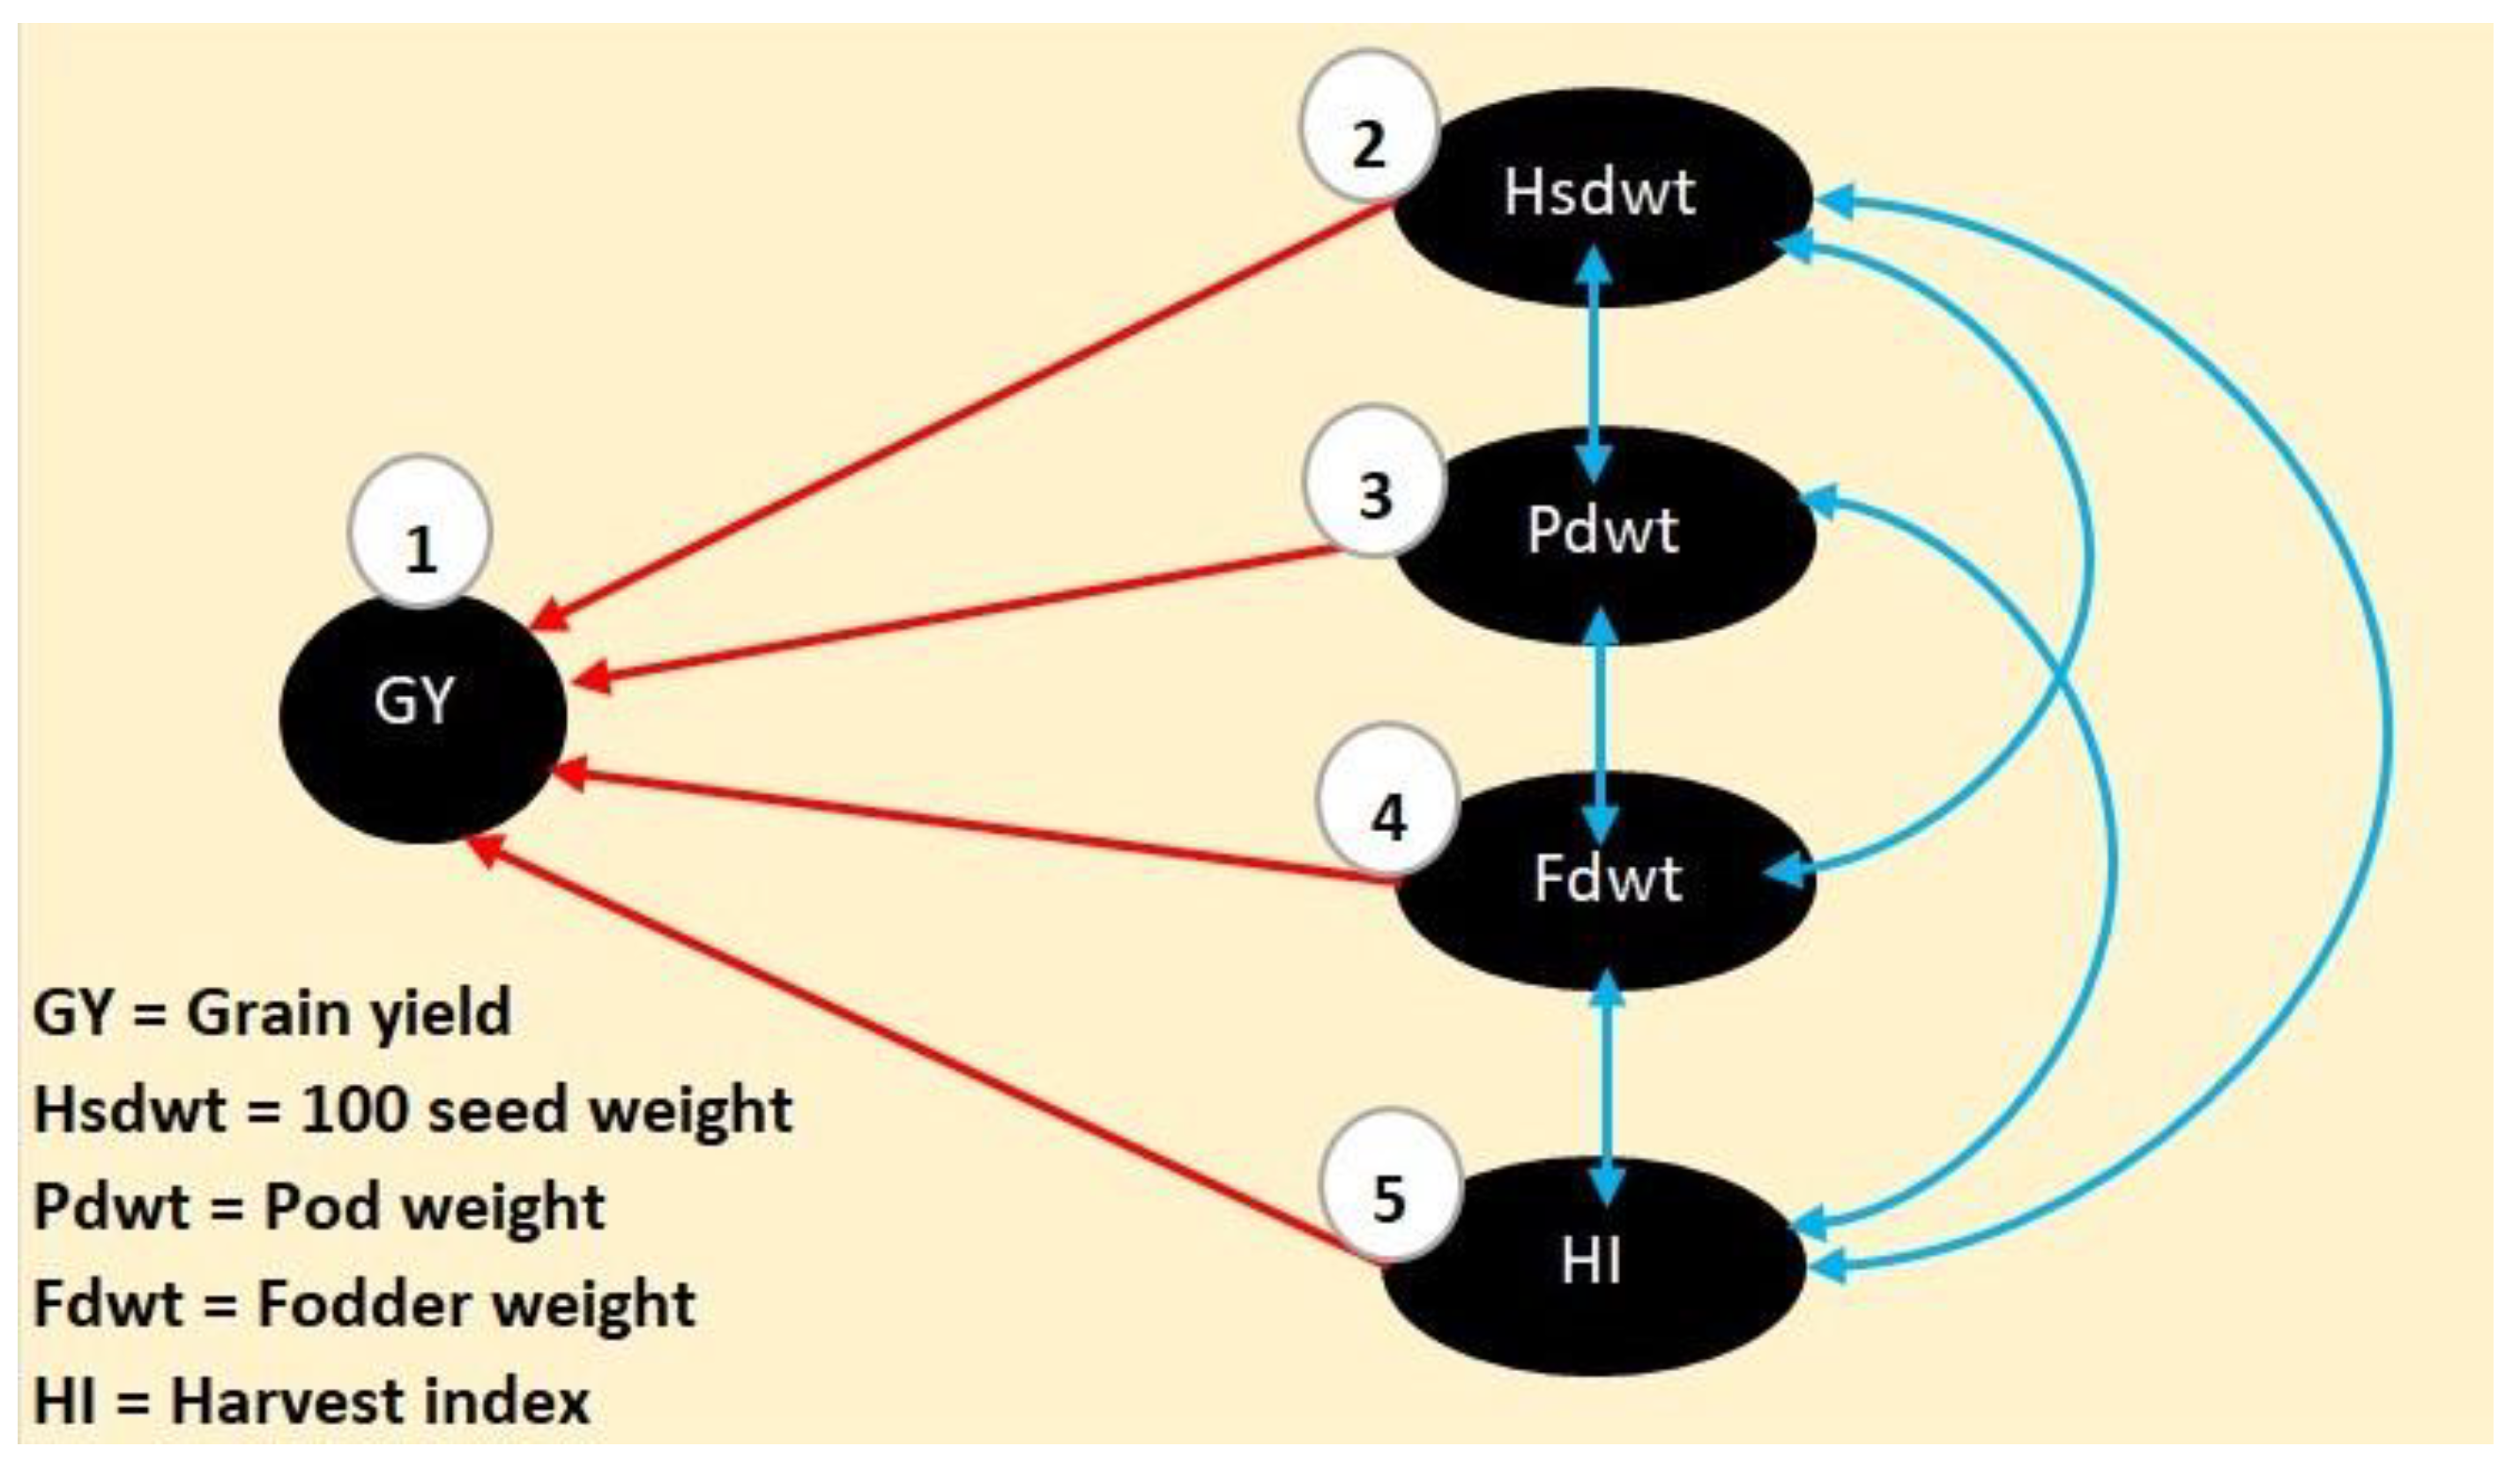
Path analysis was conducted using lavaan R package [37] for four traits related to yield; namely, 100 seed weight, pod weight, fodder weight, and harvest index (Figure 2). Grain yield was considered as the response variable in the path model. Phenotypic linear correlation coefficients were partitioned into components of direct and indirect effects, as follows [38,39]:
r 1 , 2 =   y 1 , 2 + r 2 , 3 y 1 , 3 + r 2 , 4 y 1 , 4 + r 2 , 5 y 1 , 5 ;   r 1 , 3 =   y 1 , 3 + r 2 , 3 y 1 , 2 + r 3 , 4 y 1 , 4 + r 3 , 5 y 1 , 5 ;
r 1 , 4 =   y 1 , 4 + r 2 , 4 y 1 , 2 + r 3 , 4 y 1 , 3 + r 4 , 5 y 1 , 5 ;   r 1 , 5 =   y 1 , 5 + r 2 , 5 y 1 , 2 + r 3 , 5 y 1 , 3 + r 4 , 5 y 1 , 4
where r i , j is the observed phenotypic correlation coefficient between traits i and j and y i , j is the path coefficient between traits i and j . The subscripts 1, 2, 3, 4, and 5 refer to grain yield, 100 seed weight, pod weight, fodder weight, and harvest index, respectively. The direct effect that each trait has on grain yield is measured by y , while the indirect effect of a trait on grain yield, which occurs through that trait with another trait, is measured by the product r y .
The adaptation of cowpea genotypes to specific intercropping systems was assessed using a GGE (genotype plus genotype-by-environment interaction) model. Cropping patterns were treated as unique environments in this analysis; hence, it was possible to assess specific adaptations as well as stability across cropping systems. The GGE analysis and graphic visualizations were performed using metan R package [40] based on the following model [41]:
i j = y ^ i j μ β j = k = 1 p ε i k * ŋ j k *
where i j is the interaction effect between genotype i in cropping pattern (environment) j , y ^ i j is the average yield of genotype i in cropping pattern (environment) j , μ is the grand mean, β j is the main effect of cropping pattern (environment) j , and ε i k *   and   ŋ j k * are principal component (PC) scores for genotype i and cropping pattern j , respectively.

3. Results

3.1. Effects of Genotypes, Cropping Patterns, and Years

The split-plot analysis of variance across two years revealed that the effects of genotype, cropping pattern, and year were significant for all traits except for the 100 seed weight, which was not significantly influenced by the cropping pattern (Table 1). The cropping pattern-by-year interaction was significant for the pod weight (p ≤ 0.01), grain yield (p ≤ 0.01), and fodder weight (p ≤ 0.05), but insignificant for the 100 seed weight and harvest index. On the other hand, the genotype-by-year interaction effect was significant (p ≤ 0.001) for all the traits measured. Likewise, cropping patterns significantly influenced genotype performance, as depicted by significant interactions between the genotype-by-cropping pattern for all traits except the harvest index. Results for the single year analysis are presented in Supplementary Table S1, where we observed similar outcomes for genotype main effects, with the cropping pattern and the interaction terms also being significant for most traits.

3.2. Mean Comparison of Cropping Patterns

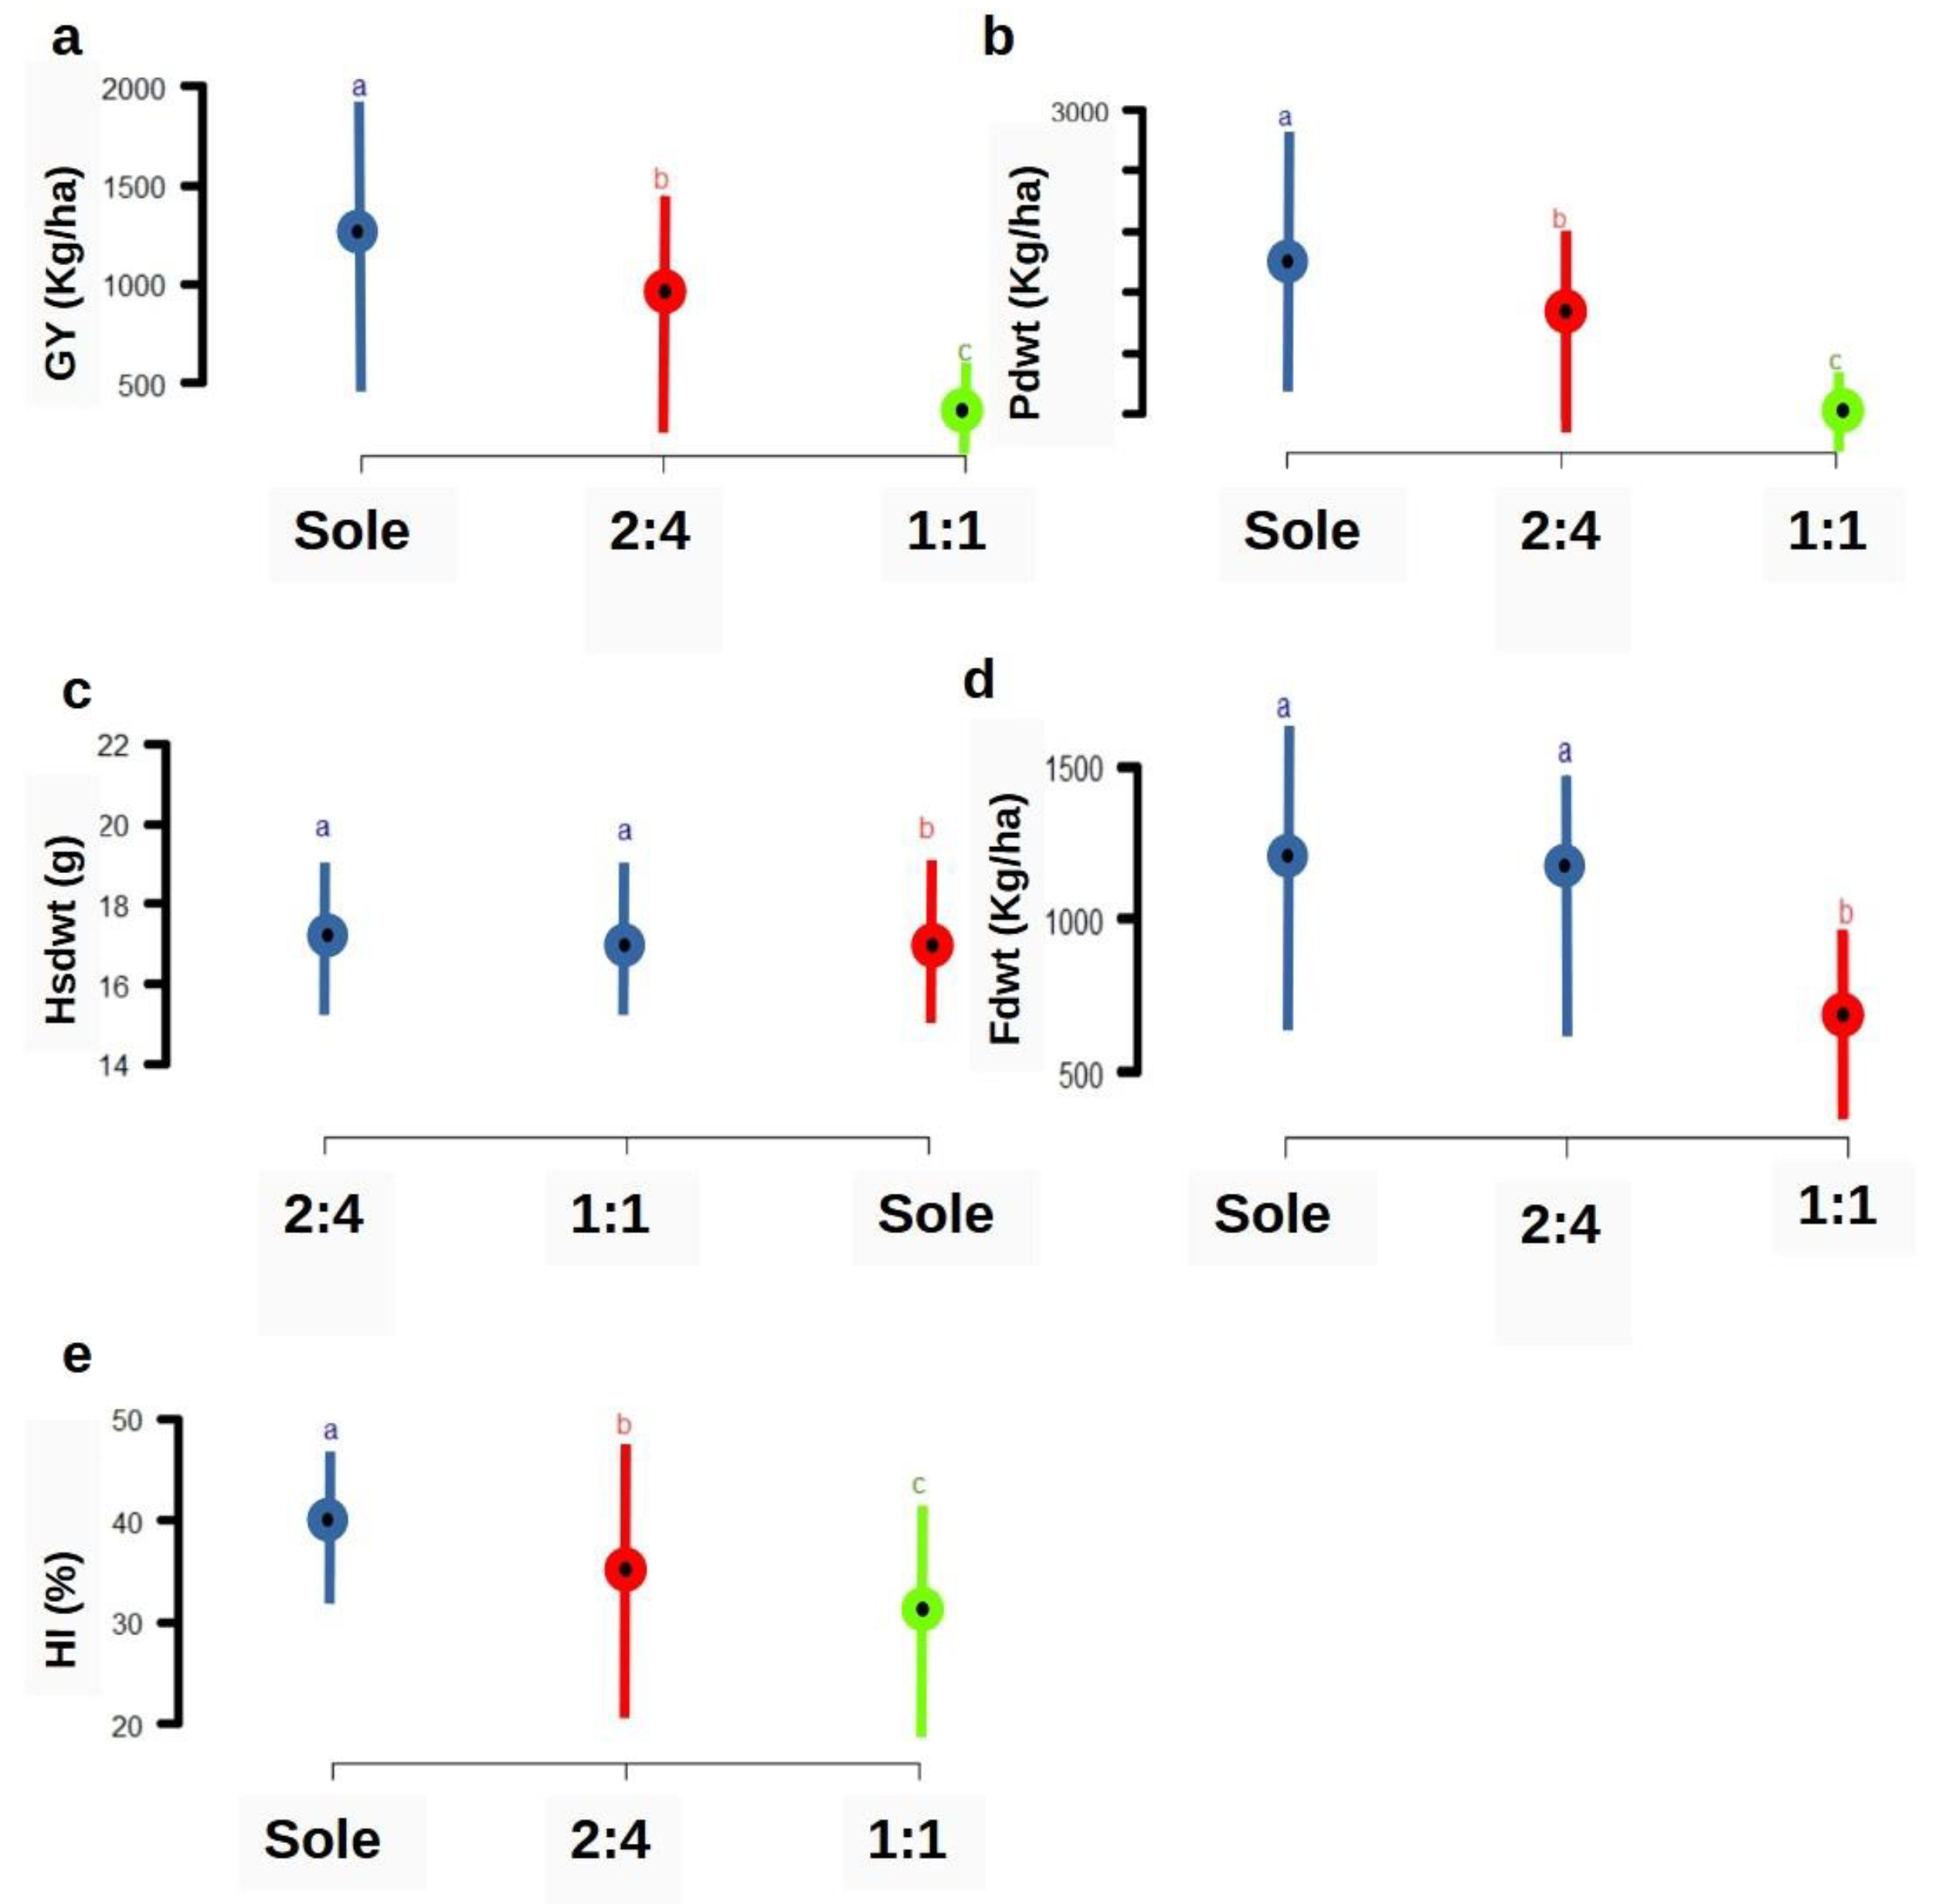
The mean comparison based on the LSD revealed significant differences among cropping patterns for all the cowpea traits measured (Figure 3). It was evident that sole cropping had the highest mean values and hence was the most productive for all traits except the 100 seed weight, while a 1:1 cropping pattern had the lowest productivity for most of the traits except the 100 seed weight. The mean grain yield under sole cropping was about 1250 kg/ha compared to 400 kg/ha under a 1:1 cropping pattern (Figure 3a). This corresponded to an approximately 67.91% grain yield reduction. The mean grain yield under a 2:4 cropping pattern was about 948 kg/ha, corresponding to an approximate yield reduction of 24.17% relative to sole cropping (Figure 3a, Supplementary Table S1). For the pod weight, a reduction of 67.76% and 23.07% in 1:1 and 2:4 cropping patterns, respectively, were realized (Figure 3b, Supplementary Table S2). Interestingly, 100 seed weight gains of 2.16% and 2.25% were observed under 1:1 and 2:4 cropping patterns, respectively, relative to sole cropping (Figure 3c, Supplementary Table S2). On the other hand, fodder weight reductions of 45% and 5% were recorded under the 1:1 and 2:4 cropping patterns, respectively (Figure 3d, Supplementary Table S1), while the harvest index registered 23% and 11% reductions, respectively (Figure 3e, Supplementary Table S2).

3.3. Performance of Genotypes

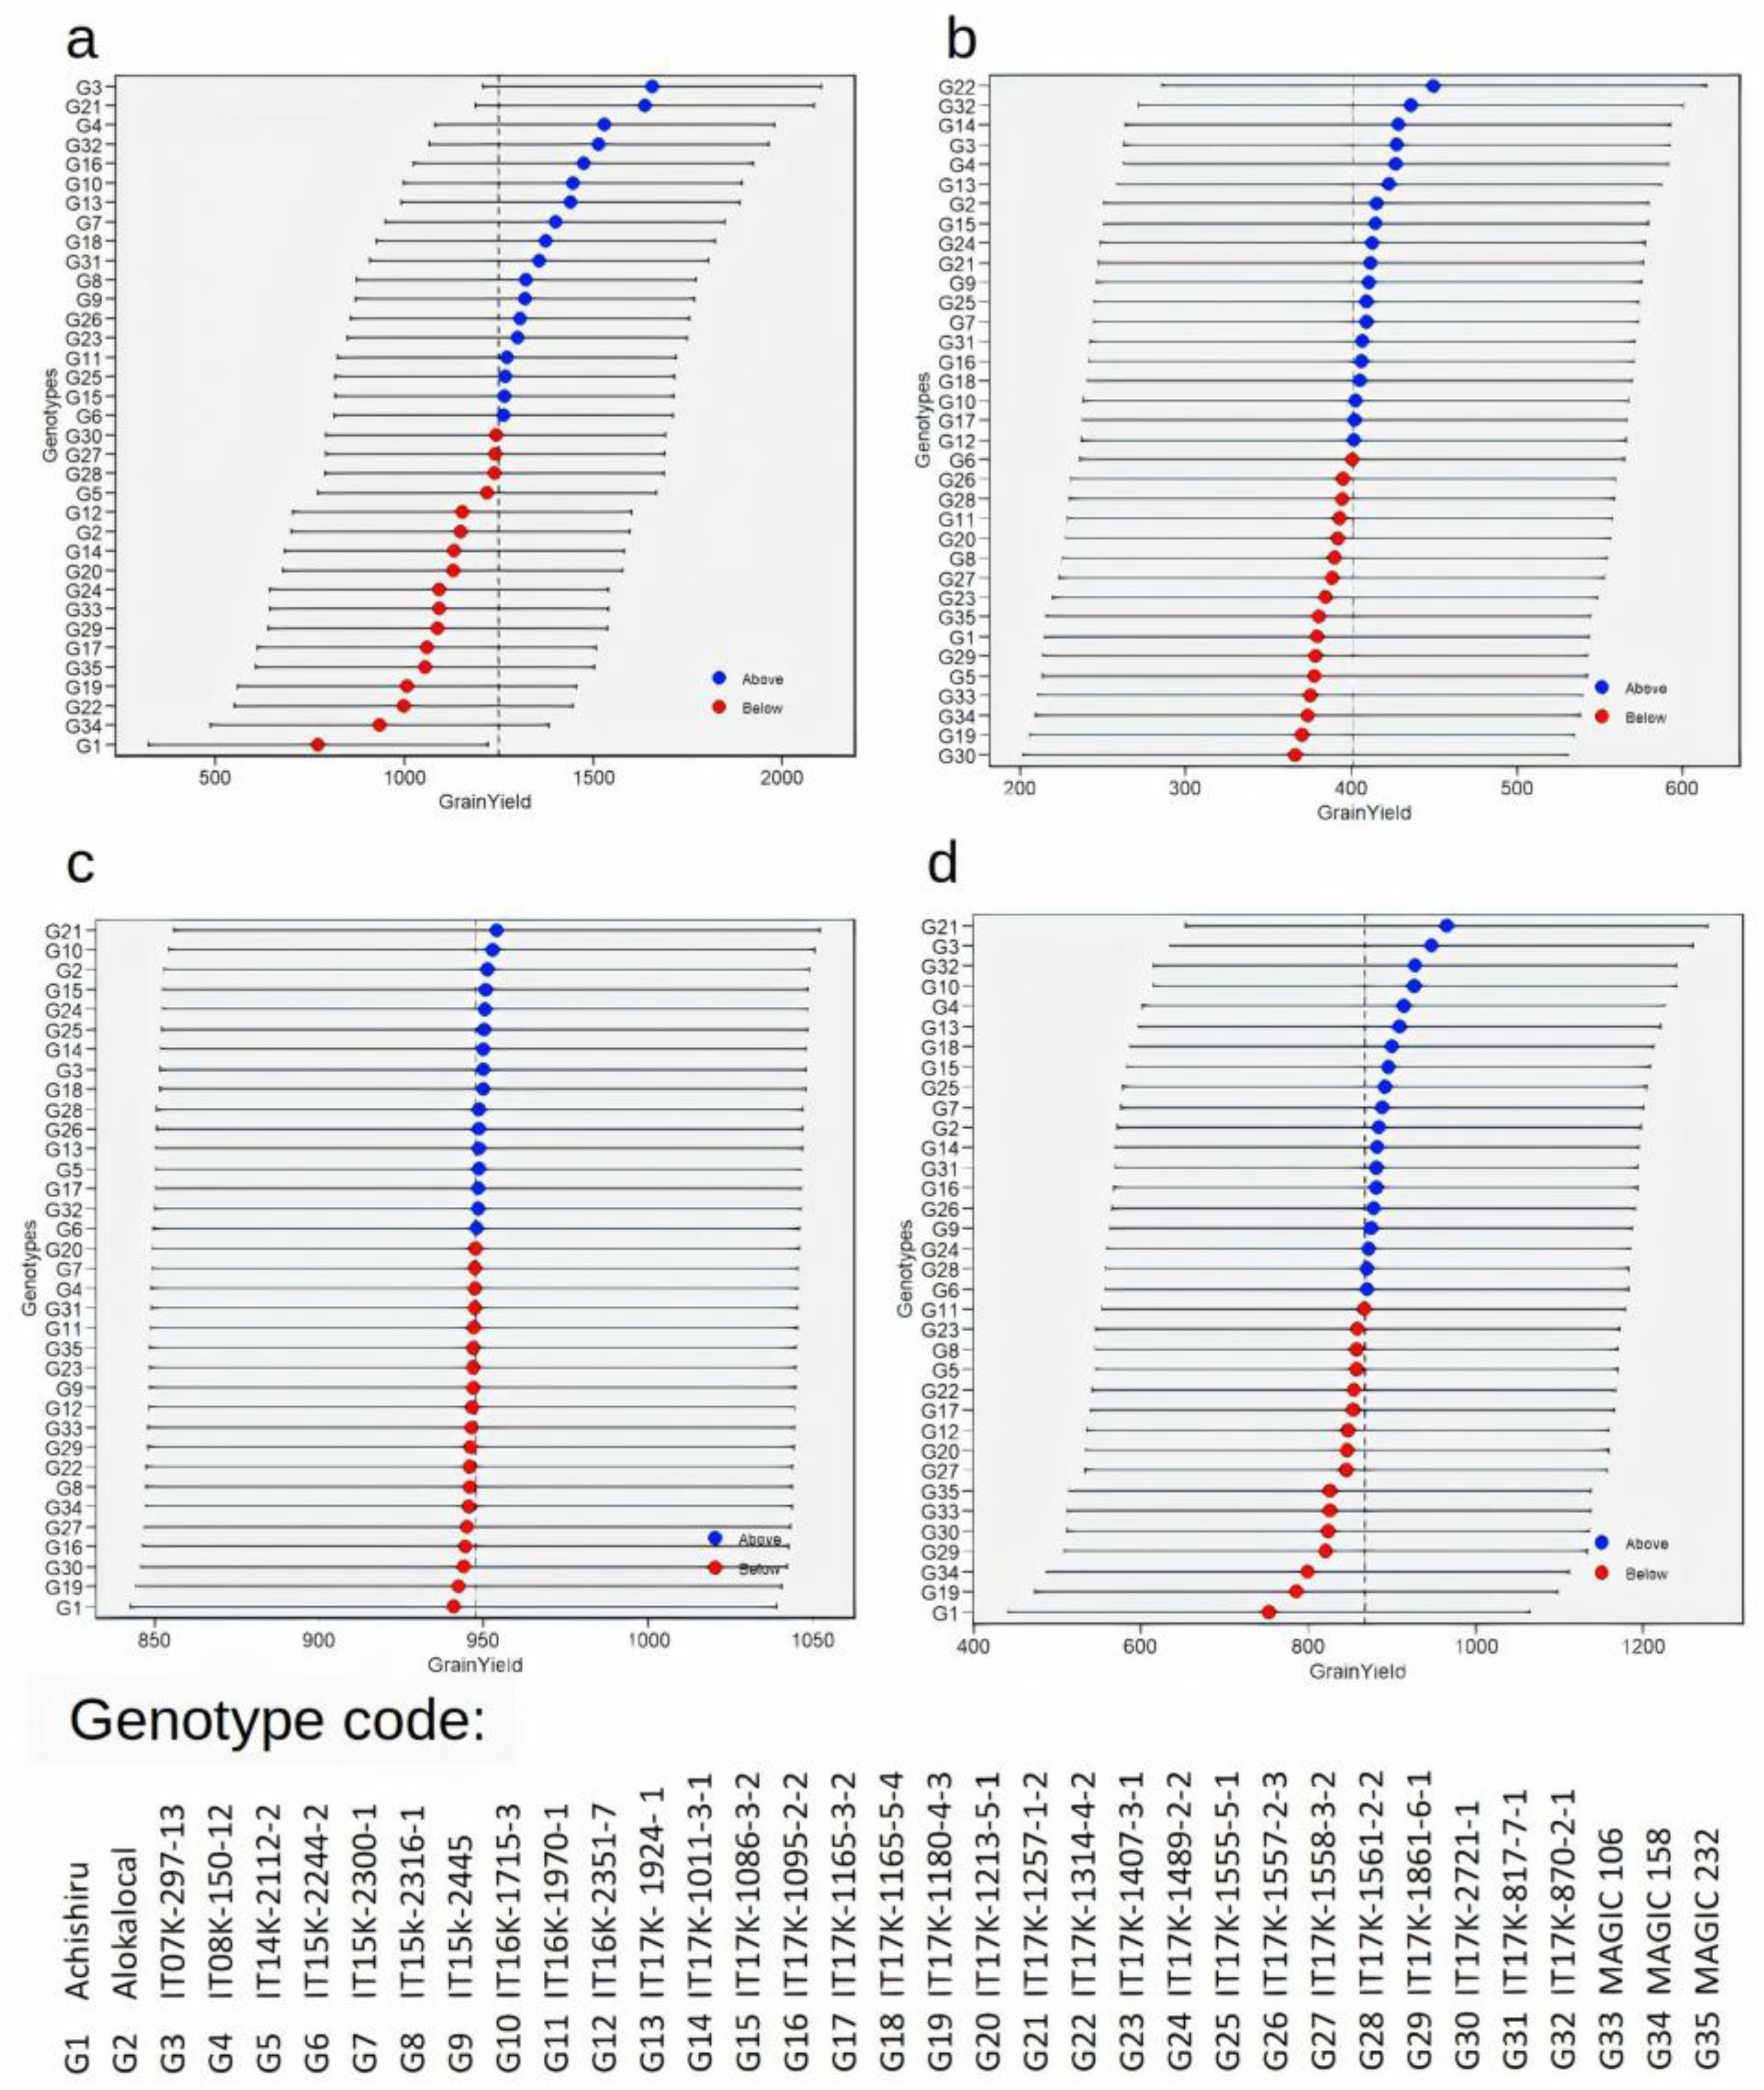
Grain yield performance of genotypes under each cropping pattern and overall performance across patterns and years were examined based on the BLUPs model (Figure 4). Superior lines that yielded above the means were detectable under each cropping pattern. In total, 18 genotypes had a grain yield above the mean under sole cropping (Figure 4a), while 19 and 16 best-yielding genotypes were identified under 1:1 (Figure 4b) and 2:4 (Figure 4c) cropping patterns, respectively. Overall, genotypes IT17K-1257-1-2 (G21), IT07K-297-13 (G3), IT17K-870-2-1 (G32), IT16K-1715-3 (G10), and IT08K-150-12 (G4) were ranked as the top five highest-yielding lines across cropping patterns and years (Figure 4d). Best Linear Unbiased Estimates (BLUEs) and BLUPs portraying genotype performance based on other traits, such as pod weight, 100 seed weight, fodder weight, and harvest index, have been presented in Supplementary Table S3. Genotypes IT17K-2721-1 (G30), IT17K-1257-1-2 (G21), and IT16K-1715-3 (G10) had the best fodder yield under sole, 1:1, and 2:4 patterns, respectively. Similarly, genotypes IT17K-1257-1-2 (G21), IT17K-1314-4-2 (G22), and IT17K-1561-2-2 (G28) had the highest pod weights under sole, 1:1, and 2:4 patterns, respectively. It was further observed that IT17K-2721-1 (G30) had the highest 100 seed weight under both sole and 2:4 patterns, while IT17K-1257-1-2 (G21) ranked on top in terms of 100 seed weight under a 1:1 cropping pattern. For the harvest index, genotypes IT15K-2300-1 (G7), IT15k-2445 (G9), and IT17K-1924-1 (G13) were the best under sole, 1:1, and 2:4 patterns, respectively (Supplementary Table S3).

3.4. Heritability and Genetic Advance

We examined variances, heritabilities, and expected genetic advances under the three cropping patterns to forecast the influence of cropping systems on selection response. Genotypic variances under sole cropping were large and significant for all traits except for the harvest index (Table 2, Supplementary Table S4). Under a 1:1 cropping pattern, genetic variances were significant for 100 seed weight, fodder weight, and harvest index. However, the 2:4 cropping pattern registered significant variance due to genotype only for 100 seed weight and fodder weight. Consequently, heritability estimates varied under the three cropping patterns for each trait. Heritability tended to be high under sole cropping, ranging from 0.27 for harvest index to 0.94 for 100 seed weight. Under a 1:1 cropping pattern, heritability ranged from 0.18 for grain yield to 0.89 for 100 seed weight. The lowest estimates were recorded under a 2:4 pattern, especially for grain yield and pod weight (Table 2).
Responses to selection under each cropping pattern were predicted based on the breeder’s equation, presented here as the expected genetic advance (Table 2). The expected genetic advance remained higher under sole cropping compared to the other cropping patterns for all traits, excluding fodder weight and harvest index, where 2:4 and 1:1 cropping patterns, respectively, had higher expected genetic advances. Genetic advance as a percentage of the mean ranged among traits from 5.59% to 36% (sole cropping), 9.61% to 47.57% (1:1 cropping pattern), and 0.01% to 57.33% (2:4 cropping pattern). When pooled data across years and cropping patterns were considered, fodder weight depicted the highest percentage of genetic advance (GA = 470.27 kg/ha; GAM = 45.92%), while pod weight had the least value (GA = 193.07 kg/ha; GAM = 15.86%).

3.5. Genetic and Phenotypic Correlations

Genetic and phenotypic correlations among cropping patterns and traits were assessed to decode the possibility of correlated responses to selection (Table 3). Genetic correlations among cropping patterns tended to be higher than phenotypic correlations. Genetic correlations among cropping patterns were high and positive for all traits, with the correlation coefficients being ≥0.9 (Table 3). Phenotypic correlations ranged from 0.29 to 0.88 between sole and 1:1 patterns, 0.4 to 0.94 for sole and 2:4 patterns, and 0.34 to 0.91 for 1:1 and 2:4 patterns.
Among the traits, genetic and phenotypic correlations were computed within each of the three cropping patterns. Genetic correlations between grain yield and all other traits except harvest index were positive, high, and significant under both sole and 2:4 cropping patterns, while under a 1:1 cropping pattern, they were significant only for GY vs. Podwt and GY vs. HI (Table 4). Similarly, genetic correlations between 100 seed weight and other traits (apart from HI) tended to be high and positive under sole cropping, intermediate under the 2:4 pattern, and low under the 1:1 cropping pattern. Genetic and phenotypic correlations of harvest index with 100 seed weight and fodder weight were negative in both sole and intercrop systems, while for pod weight vs. HI, the genetic correlation was positive under sole and 1:1 cropping patterns but negative under the 2:4 pattern (Table 4). The phenotypic correlations among traits under each of the three cropping patterns have also been graphically presented in Supplementary Figure S1.

3.6. Path Coefficient Analysis

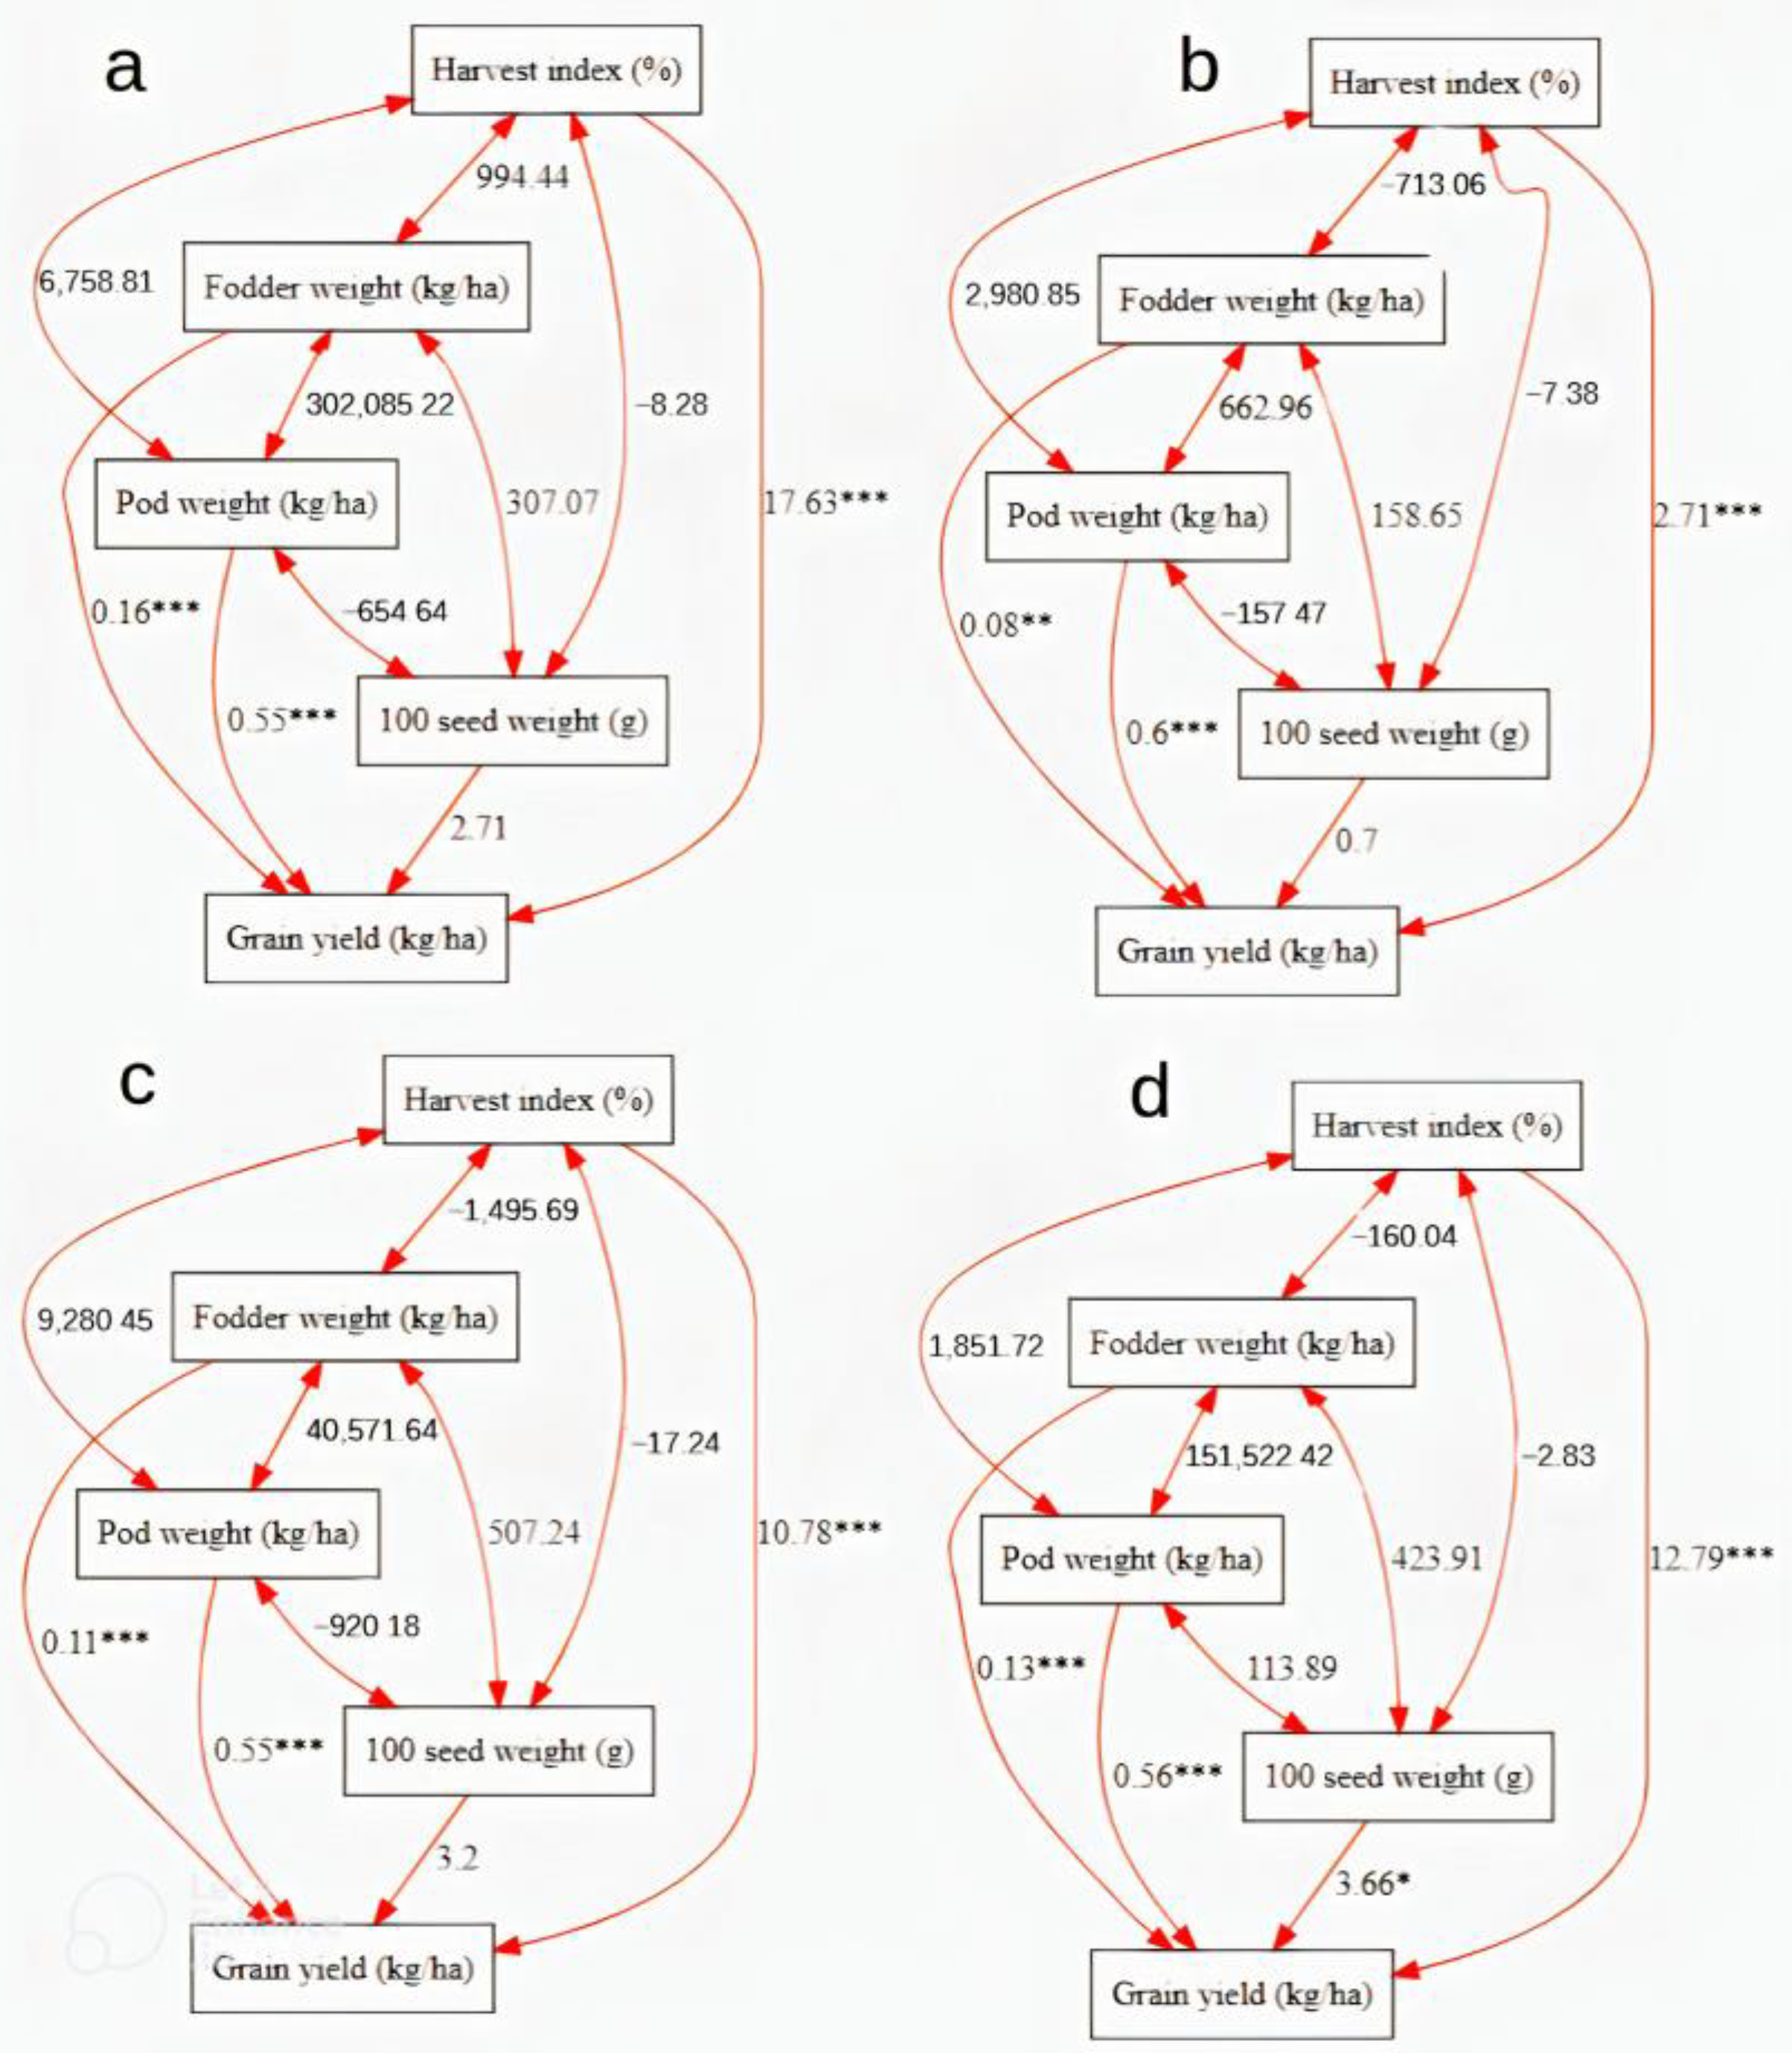
We further examined how the five traits relate causally under specific cropping patterns and across patterns. Path analysis revealed that pod weight, fodder weight, and harvest index had significant and direct effects on grain yield under all the three cropping patterns (Figure 5a–c). These relationships tended to be strong under sole cropping and low under the 1:1 cropping pattern, with the harvest index having higher and more significant coefficients than pod weight and fodder weight. A direct effect of 100 seed weight on grain yield was depicted by low and non-significant path coefficients in all three cropping patterns. When data were pooled across cropping patterns, 100 seed weight, pod weight, fodder weight, and harvest index all depicted positive and significant effects on grain yield, with harvest index and fodder weight having the strongest and the least effects, respectively (Figure 5d). The coefficients for all indirect relationships were not significant in all the cropping patterns or in the combined analysis.

3.7. Adaptation and Stability of Genotypes

The effects of cropping patterns on genotype performance and stability were assessed based on the GGE model. The GGE biplot analysis classified the cropping patterns, revealing the closer relationship between 1:1 and 2:4 cropping patterns compared to sole cropping, as depicted by a smaller vector angle between these two cropping patterns (Figure 6). The biplot vectors for cropping patterns were all projected on principal component 1 (PC1); therefore, all three cropping patterns contributed to PC1, which accounted for 66.59% of the total variation. However, based on the length of the vectors, it was evident that sole cropping accounted for most of this variation, while the 1:1 cropping pattern represented the least variability.
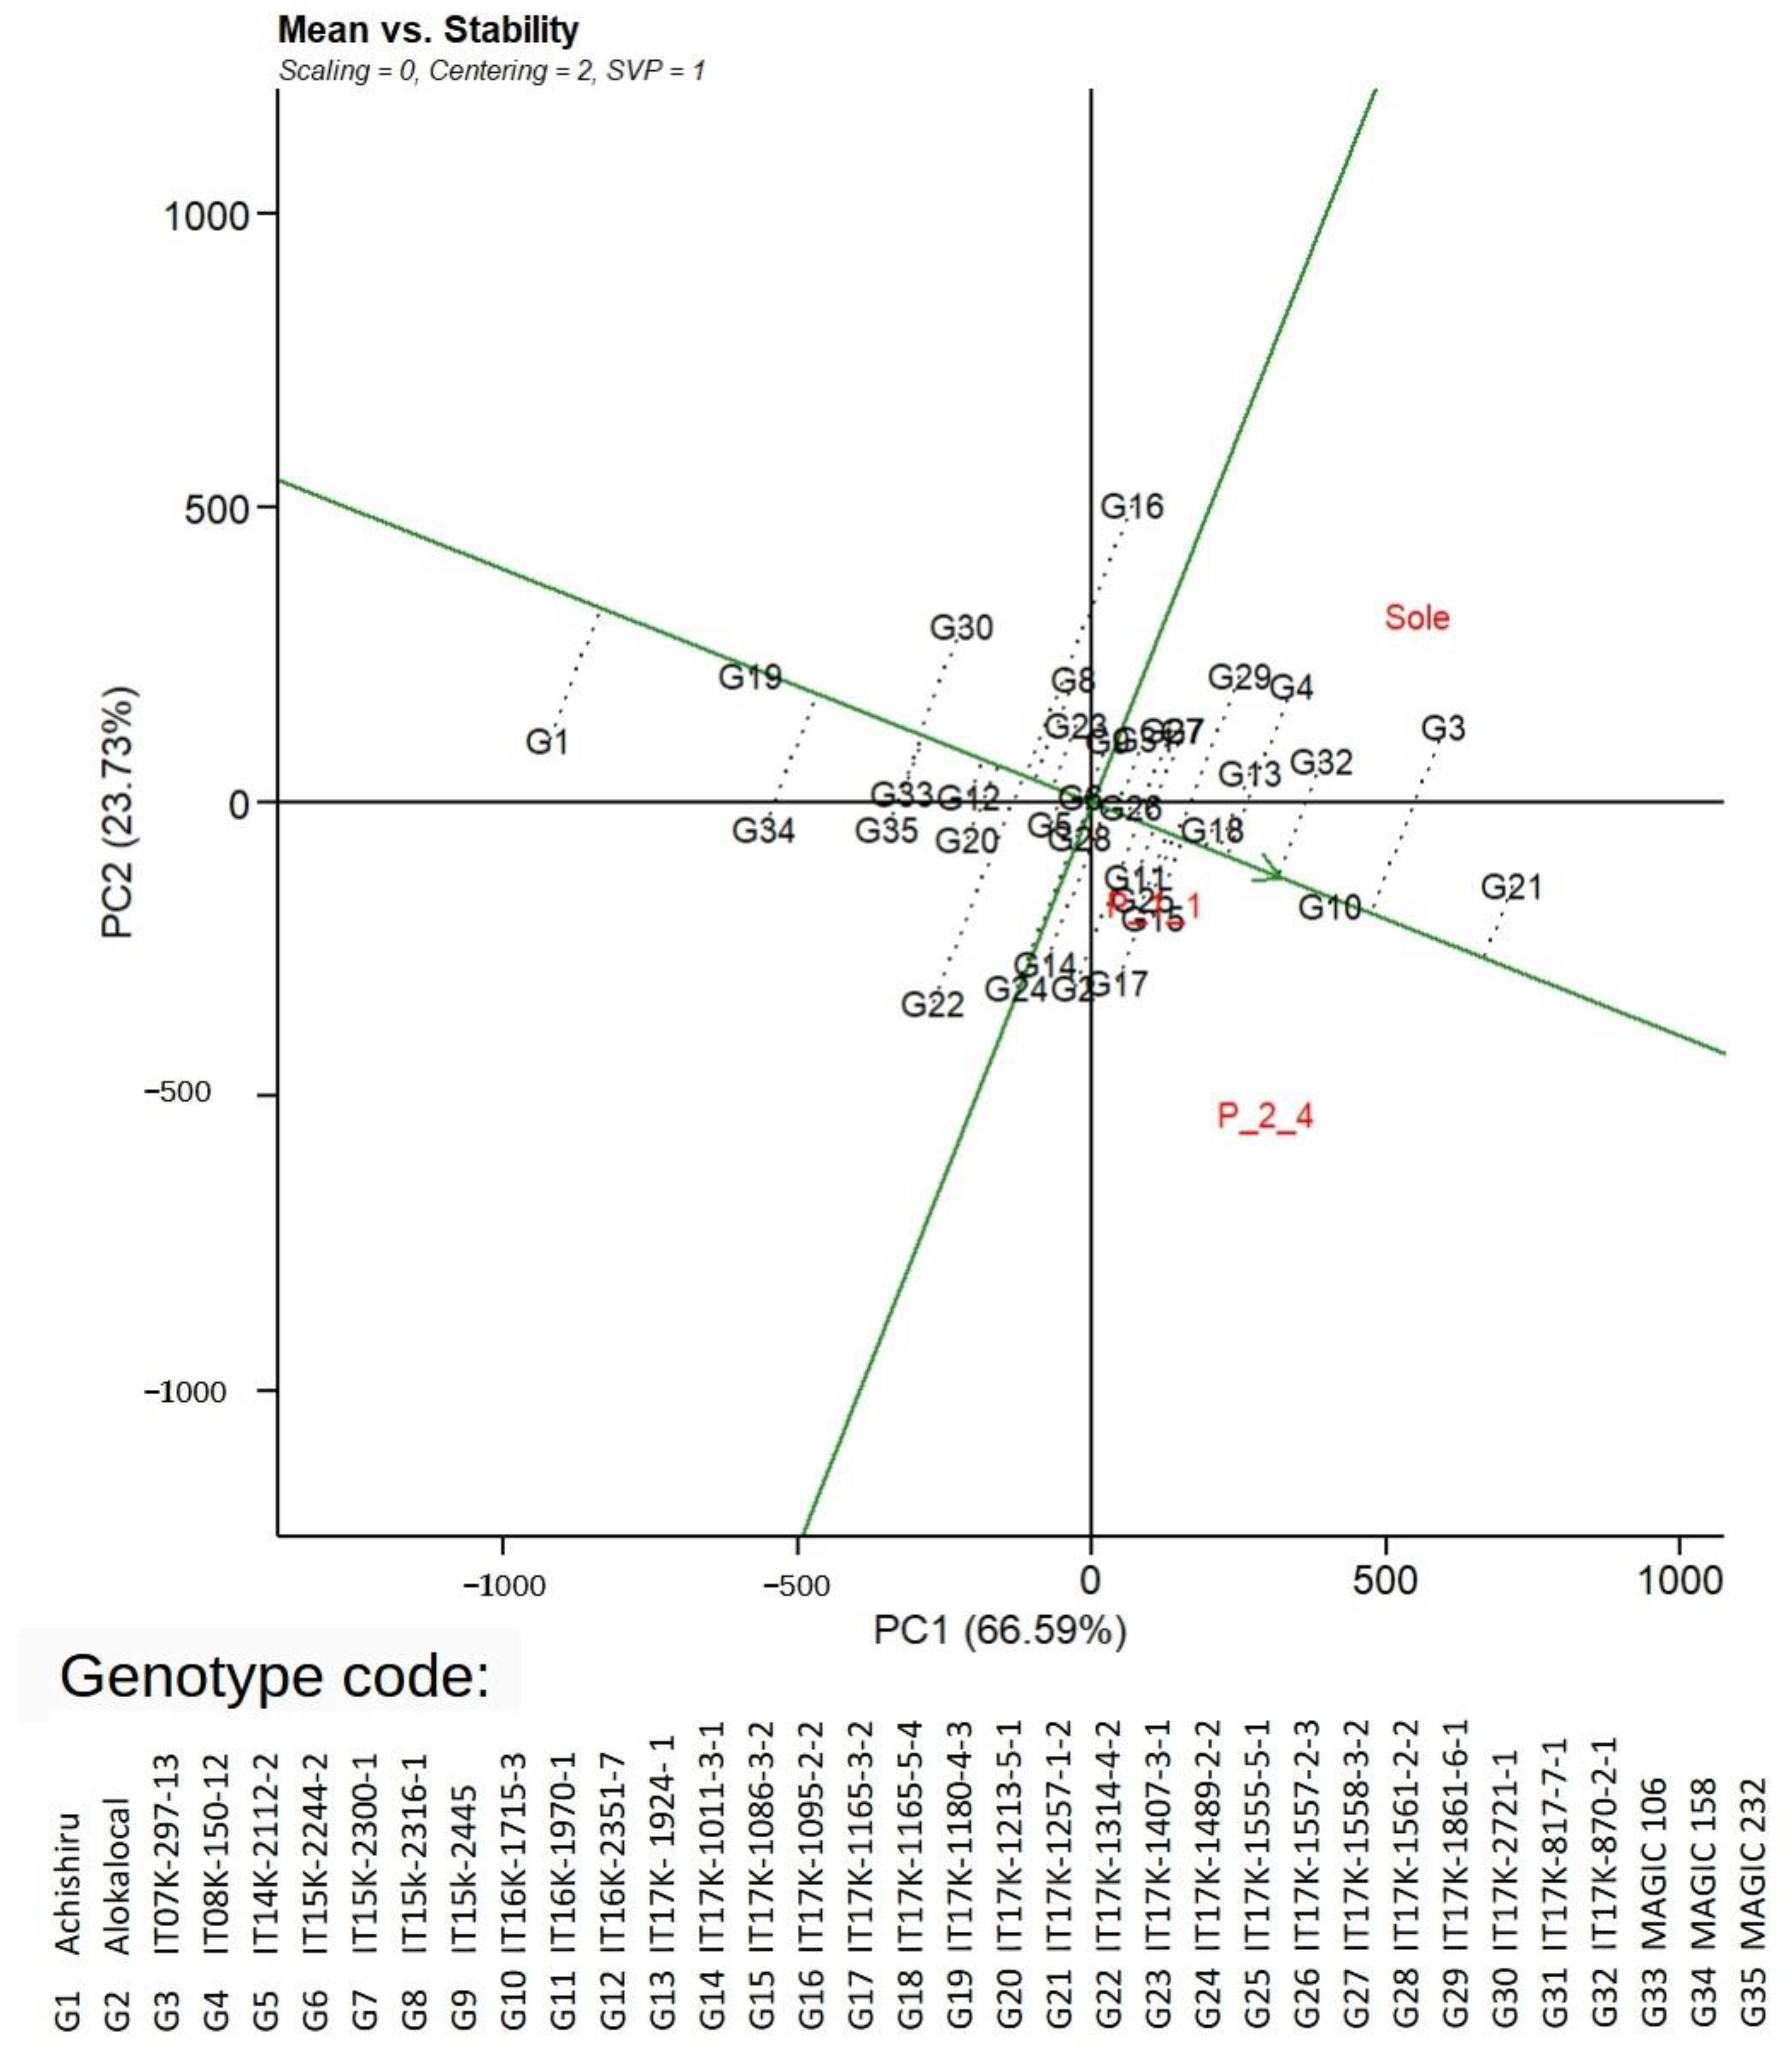
Further analyses dissected the stability of genotypes across and within each cropping pattern (Figure 7). Stability analysis based on grain yield alone revealed that genotype IT17K-1257-1-2 (G21) was the highest-yielding on average and quite stable across the three cropping patterns given that it was projected the furthest on the average environment axis (AEA) with a short perpendicular mark on this axis (Figure 7). Generally, in order of productivity, IT17K-1257-1-2 (G21) was the most productive, followed by IT07K-297-13 (G3), IT16K-1715-3 (G10), and IT17K-870-2-1 (G32), yet IT16K-1715-3 (G10) was the most stable genotype given that it had the shortest perpendicular mark to the AEA. On the other hand, Achishiru (G1), IT17K-1180-4-3 (G19), and MAGIC 158 (G34) were the least productive genotypes in terms of grain yield performance across the three intercropping patterns.
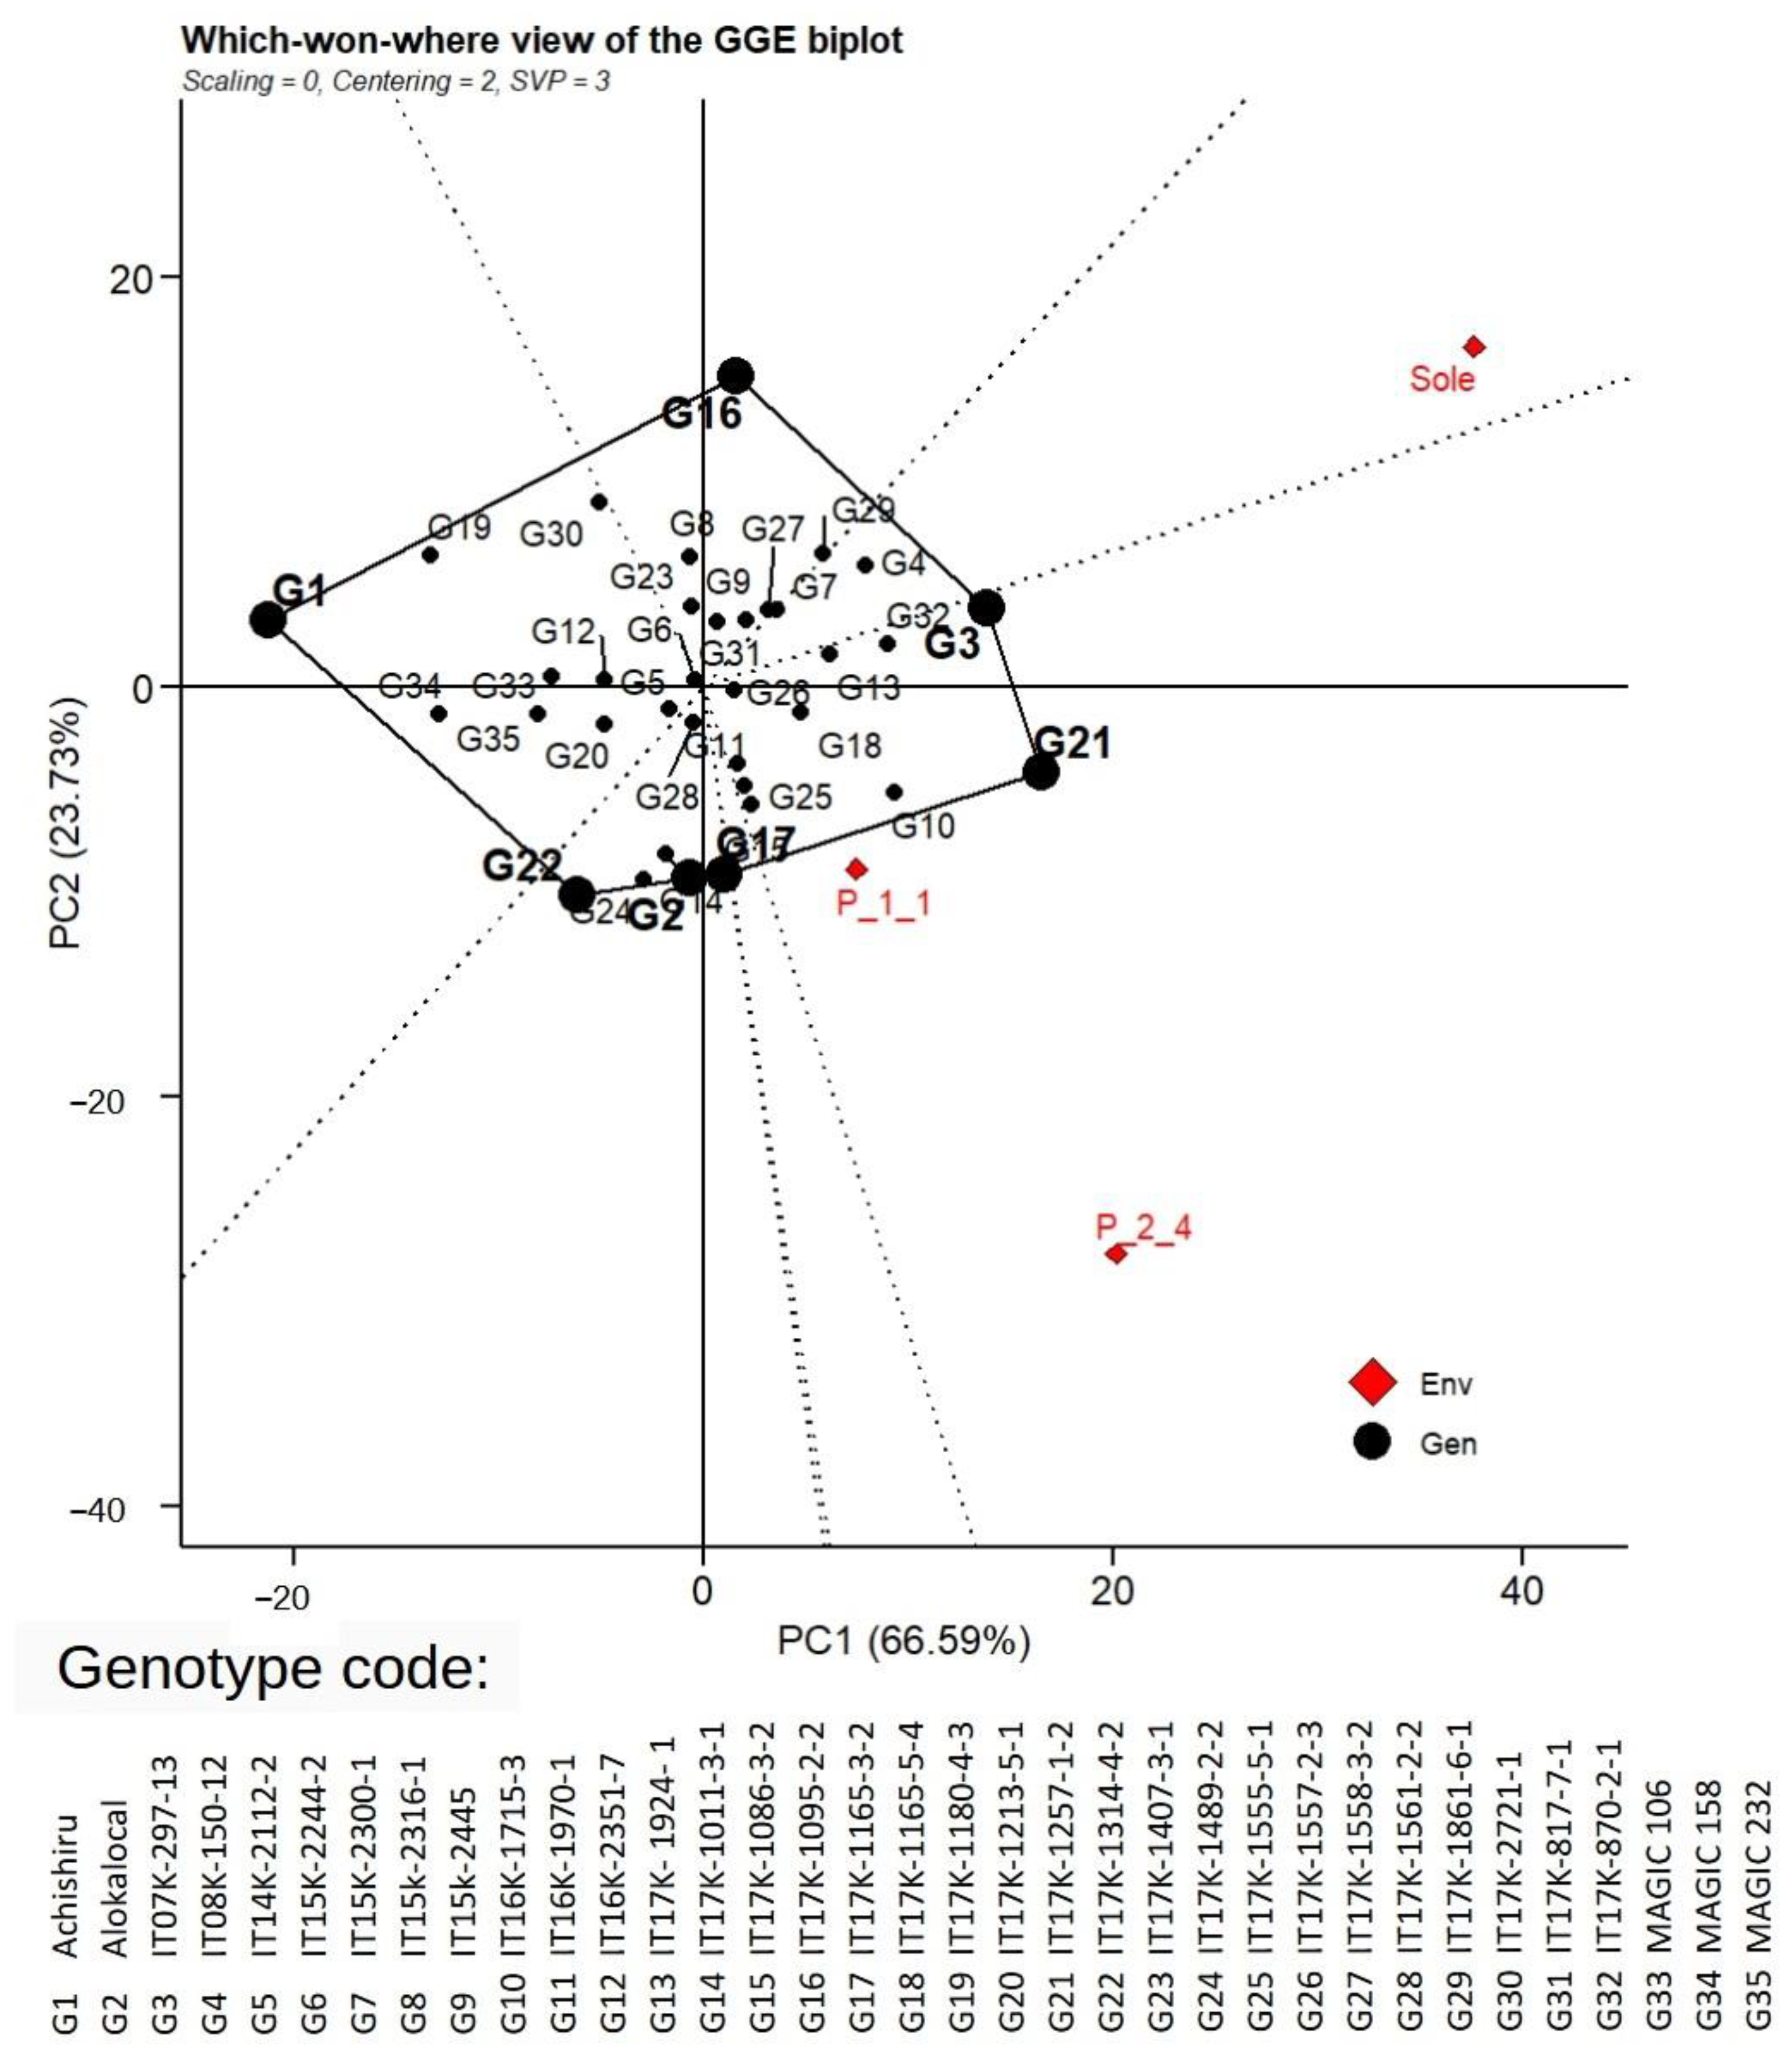
Finally, an examination of the adaptability of genotypes to specific cropping patterns was conducted using the “which-won-where” view of the GGE biplot (Figure 8). Genotype IT07K-297-13 (G3) was positioned at the vertex of the GGE polygon, closest to sole cropping, and it was therefore depicted as the best-performing line under this cropping system. IT17K-1257-1-2 (G21), on the other hand, was positioned at the vertex that projected toward 1:1 and 2:4 cropping patterns and was, therefore, portrayed as the most adapted to the two cropping patterns. Genotypes Achishiru (G1), IT17K-1095-2-2 (G16), and IT17K-1314-4-2 (G22) were clearly projected in the opposite direction to all the three cropping systems and were therefore regarded as less productive under all these cropping systems (Figure 8).

4. Discussion

It is predicted that climate change, such as rising global temperatures and fluctuation in rainfall patterns, will threaten future agricultural productivity [42]. Farming systems and technologies that promote high and stable yields while maintaining biodiversity and minimizing environmental impact need to be promoted [43]. Mixed cropping, especially legume with non-legume species mixtures, has been proposed to achieve higher per area production, profitability, and higher yield stability with fewer external inputs [13,43,44]. It is, however, critical that genotypes that suit specific mixed cropping systems be identified. This has always been a daunting task for breeders given the breeding design complexity for intercropping. In the present study, we evaluated short duration cowpea lines that had reached the advanced yield testing stage under three unique cropping systems, with pearl millet providing the crop mixing complex.
The main effects of genotype, cropping pattern, and year were all significant for the traits tested, yet the interactions among these factors were also highly significant. This suggested that overall, there were sufficient genetic differences among the cowpea lines to warrant selection under these cropping systems. However, the genotype performances were significantly influenced by the cropping patterns and years, revealing the fact that certain genotypes may be suited to specific cropping systems and environments. These results agree with those obtained by [45] in cowpea and [39] in common bean (Phaseolus vulgaris). The primary focus of breeders when searching for genotypes that perform well in the intercropping system is the existence of genotype-by-cropping system interactions [25]. A few earlier studies have indicated the non-existence of such interactions in legume–cereal intercropping [24,46]. However, several other studies have detected significant interactions. For instance, highly significant bean genotype x cropping system interactions have been reported [23,47]. Significant genotype-by-cropping system interactions have been reported to occur in cowpea–cereal cropping systems [20,21,45,48].
The present study further observed that cropping systems significantly affected the mean performance of cowpea genotypes for most of the traits, with 68% and 24% yield reductions under 1:1 and 2:4 cropping patterns, respectively, relative to sole cropping. Overall, productivity was lower under millet–cowpea intercrop than sole cropping for all traits except 100 seed weight. There was, however, a 2% seed weight gain under the two intercropping patterns relative to sole cropping. This could be attributed to the physiological responses to competition in which the cowpea crop would maintain fewer pods and accumulate all the assimilates in the seeds. This would result in increased seed weight per plant, which is reflected in the 100 seed weight trait measurement. Similar results have been reported by different authors [13,45,49,50]. This reduction in traits’ performance under intercropping is attributed to the shading effect, given the morphology of cowpea as a shorter component when intercropped with cereals [12,17]. For instance, in a maize–cowpea intercrop experiment, it was reported that intercropping cowpea with maize reduced the intercepted radiation, fodder yield, and grain yield of cowpea by 59–70%, 39–51%, and 45–62%, respectively [13]. In a wheat–chickpea intercropping experiment, [50] reported an increase in 100 seed weight of chickpea and wheat under intercropping compared to sole cropping. In another study, [51] found that 100 seed weight was significantly increased when wheat was intercropped with a legume. Another report by [52] indicated that the thousand seed weights in mungbean, blackgram, and pigeon pea increased when intercropped with rice.
When we examined genetic variances, heritabilities, and expected genetic advances, it was evident that cropping systems affected responses to selection. This was depicted by the observed tendency for genetic variances and heritabilities of traits to be higher under sole cropping than in the intercropping systems, particularly for grain yield, pod weight, and 100 seed weight, yet the reverse was true for fodder weight and harvest index. These results suggested that selection for grain yield, pod weight, and 100 seed weight was more effective under sole cropping than under intercropping, while fodder weight and harvest index were amenable to selection under intercropping. Similar results were reported by [39] in common bean.
Furthermore, the present study revealed high and positive genetic correlations among cropping patterns, which suggested that genetic improvement under one cropping system would lead to an indirect positive response under another. It has been argued that the genetic correlation between environments can be used to quantify the importance of genotype-by-environment (G × E) interactions [35,53]. That is, as the genetic correlation decreases, the G × E interaction has a stronger influence; hence, different genetic systems become more important for adaptation in the two environments. In the present case, our results on genetic correlations between cropping systems offer an opportunity for indirect selection by making inferences from a single cropping system. This outcome suits the breeding approach at IITA, where line development and initial testing are performed under sole cropping before evaluating them in intercropping. In a review article by [54], it was argued that if traits can be identified that are observable under monoculture, which has a strong genetic correlation, indirect selection for intercropping performance based on monoculture data may be efficient. Furthermore, when the heritability of the trait is larger in a sole cropping system than in an intercropped system, indirect selection can be more effective than direct selection [54,55,56,57].
Regarding relationships among traits, this study found that cropping patterns affected genetic correlations among traits, with correlations being stronger and positive under sole cropping compared to the intercrops, especially under a 1:1 cropping pattern. These results are consistent with the observed higher magnitude of variances under the sole than in the intercrops (Table 2). This is because genetic correlations are computed from genetic variances (i.e., the ratio of genetic covariance between two traits to the product of their genetic variances). In common bean, [39] reported a positive genetic correlation between the number of pods and grain yield in the sole crop but observed a negative correlation in the intercrop; they attributed this outcome to competition. In the present study, a significant genetic correlation was obtained between grain yield and harvest index in a 1:1 cropping pattern, while low and negative correlations were registered in sole and 2:4 cropping patterns (Table 4). This outcome agrees with that of [39] in common bean. The positive correlation between grain yield and harvest index under a 1:1 cropping pattern suggests that HI may be of value as a selection criterion for improving yield in this type of cropping system. Genetic correlations are a measure of genetic factors shared between two traits [36]. According to [58], when two traits are highly genetically correlated, the genes that contribute to the traits are usually co-inherited; as such, genetic correlations contribute to understanding the development and pathways of traits, population-level gene flow, and the co-occurrences of traits.
Results of a path analysis revealed that the harvest index had the strongest positive and significant direct effect on grain yield in all three cropping systems investigated. The effect was, however, lower under the 1:1 cropping pattern compared to 2:4 and sole cropping systems. Based on pooled data, seed weight had the second largest direct effect on grain yield, followed by pod weight and, lastly, fodder weight. Our result is similar to that of [39], although, in their study, seed weight appeared to be the major trait that contributed to yield component compensation, followed by the number of pods per plant.
This study further elucidated the genotype discrimination power of the cropping systems and adaptations using grain yield data alone. According to [59], a GGE biplot based on environment-centered data can be used for test environment evaluation. In this study, the GGE concept was exploited to evaluate the cropping systems. Although the cropping systems appeared to be positively correlated, they differed in their ability to discriminate among genotypes. A 1:1 cropping pattern had the shortest vector length, meaning that it had a small standard deviation (SD), and, therefore, it was less discriminating of the genotypes. In contrast, sole and 2:4 cropping patterns have longer vectors and larger SD; hence, they were more discriminating of the genotypes. The reduction in discrimination power of the 1:1 cropping system must have been a result of more severe stress generated by intense shading and competition with the pearl millet. It has been observed that expression of traits in stressful environments often exhibits low genetic variation [60,61]. In such scenarios, it is advised that selection be based on alternative traits with high heritability and strong correlation with main traits in stressed environments. In the present study, harvest index would be the trait of choice because it displayed high heritability and significant genetic correlation with grain yield in the 1:1 cropping system (Table 2 and Table 4).
In terms of stability, this study used the Mean vs. Instability form of the GGE biplot [59] to extract genotypes combining high-yield performance with broad adaptation to cropping systems. Genotypes IT17K-1257-1-2, IT07K-297-13, IT16K-1715-3, and IT17K-870-2-1, in that order, had yield performances above the average environment, implying that they were the most productive. Expectedly, the least productive genotype was Achishiru, an extra early maturing landrace with a very small seed size. By examining the perpendicular projections of genotypes away from the AEA, IT16K-1715-3 and IT17K-1257-1-2 were the most stable because they were closer to the AEA. These genotypes, therefore, contributed the least to genotype–cropping pattern interaction. On the other hand, IT17K-1095-2-2 and IT17K-1314-4-2 were projected the furthest away from AEA; hence, they contributed more to genotype-by-cropping pattern interaction and were therefore the most unstable genotypes. Interestingly, while dissecting the “which-won-where” view of the GGE biplot, the same genotypes (IT17K-1095-2-2 and IT17K-1314-4-2), including Achishiru, were found on the polygon vertices in sectors that excluded all three cropping patterns. This implied that these genotypes were inferior in yield performance under these cropping systems. On the other hand, IT07K-297-13, a released variety that was included as a check in this study, was the winning genotype in sole cropping, while one test genotype, IT17K-1257-1-2, was the winner in both 1:1 and 2:4 cropping systems. Previous reports have indicated that the types of cowpea varieties that are suitable for intercropping are late maturing and spreading [17,26]. These authors identified IITA cowpea varieties, such as IT86KD-715 and IT89KD-374, which have spreading growth habits, as having high intercropped yields. A local landrace Dan’Ila, with spreading growth habit, was identified as having high intercrop adaptability but poor yield potential; in the present study, it gave poor yield in both sole and intercrop systems.

5. Conclusions

The primary focus of breeders seeking genotypes suitable for intercropping is to identify those that exhibit interactions between the genotype and the cropping system. Our study demonstrated that short duration cowpea genotypes displayed significant interactions with cropping systems in terms of grain yield and other traits assessed. In addition, we found strong positive genetic correlations among cropping systems and traits within cropping systems, indicating that indirect selection may be feasible. However, cropping systems had a substantial impact on genetic variances, heritability, and response to selection. Selection was more effective under sole cropping than in the intercrop for all traits except harvest index, which had a high expected genetic gain in the intercrop. The harvest index could potentially be employed for indirect selection for grain yield under the intercropping system, as it was positively correlated with grain yield in this system. Lastly, this study utilized genotype-by-cropping system interactions to identify cowpea genotypes that were specifically adapted to a specific cropping system, as well as those that were stable across all cropping systems. The genotypes IT17K-1257-1-2, IT16K-1715-3, and IT17K-870-2-1 were the most stable and would be recommended for cultivation in different cropping systems.

Supplementary Materials

The following supporting information can be downloaded at: https://www.mdpi.com/article/10.3390/agronomy13061594/s1, Figure S1 Weather data for Minjibir, Kano Nigeria, during the experimental period (May to October) in 2020 and 2021; Figure S2: (a) A cluster analysis depicting phenotypic correlation among traits under the 1:1 cropping pattern; (b) A cluster analysis depicting phenotypic correlation among traits under the 2:4 cropping pattern; (c): A cluster analysis depicting phenotypic correlation among traits under the sole cropping pattern; Table S1: Single year split-plot ANOVA for cropping system experiments conducted in year 2020 and 2022; Table S2: Mean comparison of productivity in three cropping systems for grain yield, 100 seed weight, pod weight, fodder wight and harvest index; Table S3: BLUPS and BLUES revealing performance of cowpea genotypes based on grain yield, 100 seed weight, pod weight, fodder weight and harvest index under three cropping systems: sole, 1:1 and 2:4 cropping patterns; Table S4: Individual year analysis depicting summary statistics from META-R for each cropping system based on RCBD model. Each cropping system was analyzed independently.

Author Contributions

Conceptualization, P.O.O. and O.B.; methodology, P.O.O., O.B. and C.F.; software, P.O.O.; validation, P.O.O., O.B. and C.F.; formal analysis, P.O.O.; investigation, P.O.O.; resources, O.B. and C.F.; data capture and curation, P.O.O., A.T., D.J.I., A.M., S.T., B.A., G.B., B.P. and M.I.; writing—original draft preparation, P.O.O.; writing—review and editing, P.O.O., A.T., S.B.M., B.P., O.B. and C.F.; visualization, P.O.O.; supervision, O.B. and C.F.; project administration, O.B.; funding acquisition, O.B. All authors have read and agreed to the published version of the manuscript.

Funding

This research was funded by the Bill & Melinda Gates Foundation through the Accelerated Varietal Improvement and Seed Delivery of Legumes and Cereals in Africa (AVISA) project, Grant# OPP1198373.d.

Data Availability Statement

All data reported in this study have been provided as Supplementary Materials.

Acknowledgments

The authors appreciate funding support from the Bill & Melinda Gates Foundation (BMGF) through the Accelerated Varietal Improvement and Seed Delivery of Legumes and Cereals in Africa (AVISA) project, and CRP funds from the International Institute of Tropical Agriculture (IITA).

Conflicts of Interest

The authors declare no conflict of interest.

References

  1. Timko, M.P.; Singh, B.B. Cowpea, a Multifunctional Legume. In Genomics of Tropical Crop Plants; Springer: Berlin/Heidelberg, Germany, 2008. [Google Scholar]
  2. Singh, B.B. Cowpea: The Food Legume of the 21st Century; Crop Science Society of America: Madison, WI, USA, 2014; ISBN 978-0-891-18621-2. [Google Scholar]
  3. Boukar, O.; Togola, A.; Chamarthi, S.; Belko, N.; Ishikawa, H.; Suzuki, K.; Fatokun, C. Cowpea [Vigna Unguiculata (L.) Walp.] Breeding. In Advances in Plant Breeding Strategies: Legumes; Springer International Publishing: Cham, Switzerland, 2019; Volume 7, pp. 201–243. ISBN 9783030234003. [Google Scholar]
  4. da Silva, A.C.; da Costa Santos, D.; Junior, D.L.T.; da Silva, P.B.; dos Santos, R.C.; Siviero, A. Cowpea: A Strategic Legume Species for Food Security and Health. In Legume Seed Nutraceutical Research; IntechOpen: London, UK, 2018; ISBN 978-1-78985-398-8. [Google Scholar]
  5. Jayathilake, C.; Visvanathan, R.; Deen, A.; Bangamuwage, R.; Jayawardana, B.C.; Nammi, S.; Liyanage, R. Cowpea: An Overview on Its Nutritional Facts and Health Benefits. J. Sci. Food Agric. 2018, 98, 4793–4806. [Google Scholar] [CrossRef] [PubMed]
  6. Shivay, Y.S.; Singh, U.; Prasad, R.; Kaur, R. Agronomic Interventions for Micronutrient Biofortification of Pulses. Indian J. Agron. 2016, 4, 61–72. [Google Scholar]
  7. Kebede, E.; Bekeko, Z. Expounding the Production and Importance of Cowpea (Vigna Unguiculata (L.) Walp.) in Ethiopia. Cogent Food Agric. 2020, 6, 1769805. [Google Scholar] [CrossRef]
  8. Mohammed, S.B.; Dzidzienyo, D.K.; Umar, M.L.; Ishiyaku, M.F.; Tongoona, P.B.; Gracen, V. Appraisal of Cowpea Cropping Systems and Farmers’ Perceptions of Production Constraints and Preferences in the Dry Savannah Areas of Nigeria. CABI Agric. Biosci. 2021, 2, 25. [Google Scholar] [CrossRef]
  9. Maitra, S.; Hossain, A.; Brestic, M.; Skalicky, M.; Ondrisik, P.; Gitari, H.; Brahmachari, K.; Shankar, T.; Bhadra, P.; Palai, J.B.; et al. Intercropping—A Low Input Agricultural Strategy for Food and Environmental Security. Agronomy 2021, 11, 343. [Google Scholar] [CrossRef]
  10. Kremer, R.J. Soil Health Benefits of the Solar Corridor Crop System. In The Solar Corridor Crop System: Implementation and Impacts; Deichman, C.L., Robert, J.K., Eds.; Academic Press: Cambridge, MA, USA, 2019; pp. 79–101. ISBN 9780128147931. [Google Scholar]
  11. Asseng, S.; Zhu, Y.; Basso, B.; Wilson, T.; Cammarano, D. Simulation Modeling: Applications in Cropping Systems. In Encyclopedia of Agriculture and Food Systems; Neal, K.V.A., Ed.; Academic Press: Cambridge, MA, USA, 2014; pp. 102–112. ISBN 9780080931395. [Google Scholar]
  12. Mortimore, M.; Singh, B.; Harris, F.; Blade, S. Cowpea in Traditional Cropping Systems. In Advances in Cowpea Research; Singh, B., Mohan, R.D., Dashiel, K., Jackai, L., Eds.; Co-publication of International Institute of Tropical Agriculture (IITA) and Japan International Research Center for Agricultural Sciences (JIRCAS): Ibadan, Nigeria, 1997; pp. 99–113. [Google Scholar]
  13. Ewansiha, S.U.; Kamara, A.Y.; Onyibe, J.E. Performance of Cowpea Cultivars When Grown as an Intercrop with Maize of Contrasting Maturities. Arch. Agron. Soil Sci. 2013, 60, 597–608. [Google Scholar] [CrossRef]
  14. Chamkhi, I.; Cheto, S.; Geistlinger, J.; Zeroual, Y.; Kouisni, L.; Bargaz, A.; Ghoulam, C. Legume-Based Intercropping Systems Promote Beneficial Rhizobacterial Community and Crop Yield under Stressing Conditions. Ind. Crops Prod. 2022, 183, 114958. [Google Scholar] [CrossRef]
  15. Lo Presti, E.; Badagliacca, G.; Romeo, M.; Monti, M. Does Legume Root Exudation Facilitate Itself P Uptake in Intercropped Wheat? J. Soil Sci. Plant Nutr. 2021, 21, 3269–3283. [Google Scholar] [CrossRef]
  16. Reddy, K.C.; Van Der Ploeg, J.; Maga, I. Genotype Effects in Millet/Cowpea Intercropping in the Semi-Arid Tropics of Niger. Exp. Agric. 1990, 26, 387–396. [Google Scholar] [CrossRef]
  17. Terao, T.; Watanabe, I.; Matsunaga, R.; Hakoyama, S.; Singh, B.B. Agro-Physiological Constraints in Intercropped Cowpea: An Analysis. In Advances in Cowpea Research; Singh, B.B., Mohan, R.D.R., Dashiel, K.E., Jackai, L.E.N., Eds.; Co-publication of International Institute of Tropical Agriculture (IITA) and Japan International Research Center for Agricultural Sciences (JIRCAS): Ibadan, Nigeria, 1997; pp. 129–140. [Google Scholar]
  18. Ehlers, J.D. Correlation of Performance of Sole-Crop and Intercrop Cowpeas with and without Protection from Insect Pests. Field Crops Res. 1994, 36, 133–143. [Google Scholar] [CrossRef]
  19. Ntare, B.R. Evaluation of Cowpea Cultivars for Intercropping with Pearl Millet in the Sahelian Zone of West Africa. Field Crops Res. 1989, 20, 31–40. [Google Scholar] [CrossRef] [Green Version]
  20. Smith, M.E.; Zobel, R.W. Plant Genetic Interactions in Alternative Cropping Systems: Considerations for Breeding Methods. In Plant Breeding and Sustainable Agriculture: Considerations for Objectives and Methods; Sleper chair, D.A., Barker, T.C., Bramel-Cox, P.J., Eds.; John Wiley & Sons, Ltd.: Madison, WI, USA, 1991; pp. 57–81. ISBN 9780891185970. [Google Scholar]
  21. Blade, S.F.; Mather, D.E.; Singh, B.B.; Smith, D.L. Evaluation of Yield Stability of Cowpea under Sole and Intercrop Management in Nigeria. Euphytica 1991, 61, 193–201. [Google Scholar] [CrossRef]
  22. Padi, F.K. Genotype × Environment Interaction and Yield Stability in a Cowpea-Based Cropping System. Euphytica 2007, 158, 11–25. [Google Scholar] [CrossRef]
  23. Davis, J.H.C.; Garcia, S. Competitive Ability and Growth Habit of Indeterminate Beans and Maize for Intercropping. Field Crops Res. 1983, 6, 59–75. [Google Scholar] [CrossRef]
  24. Francis, C.A.; Prager, M.; Tejada, G.; Laing, D.R. Maize Genotype by Cropping Pattern Interactions: Monoculture vs. Intercropping1. Crop Sci. 1983, 23, 302–306. [Google Scholar] [CrossRef]
  25. Blade, S.F.; Shetty, S.V.R.; Terao, T.; Singh, B.B. Recent Developments in Cowpea Cropping Systems Research. In Advances in Cowpea Research; Singh, B.B., Raj, M., Dashiell, K.E., Jackai, L.E.N., Eds.; Co-publication of International Institute of Tropical Agriculture (IITA) and Japan International Research Center for Agricultural Sciences (JIRCAS): Ibadan, Nigeria, 1997; pp. 114–128. ISBN 978131110X. [Google Scholar]
  26. Singh, B.B.; Chambliss, O.L.; Sharma, B. Recent Advances in Cowpea Breeding. In Advances in Cowpea Research; International Institute of Tropical Agriculture (IITA)]: Ibadan, Nigeria, 1997; pp. 30–49. [Google Scholar]
  27. Craufurd, P.Q. Effect of Plant Density on the Yield of Sorghum-Cowpea and Pearl Millet-Cowpea Intercrops in Northern Nigeria. Exp. Agric. 2000, 36, 379–395. [Google Scholar] [CrossRef]
  28. Ewansiha, S.U.; Udensi, U.E.; Kamara, A.Y.; Meena, V.S. Effect of Tillage on the Growth and Yield of Cowpea Varieties in Sudan Savanna Agroecology of Northern Nigeria. Annu. Res. Rev. Biol. 2015, 5, 275–284. [Google Scholar] [CrossRef] [Green Version]
  29. Bassi, J.A.; Dugje, I.Y.; Aminu, D. Agronomic Performances of Pearl Millet (Pennisetum Glaucum L.) R. Br.) Varieties Intercropped with Legumes in Sahelian Savanna of Nigeria. J. Agric. Crop Res. 2019, 7, 194–203. [Google Scholar] [CrossRef]
  30. Adeyanju, A.O. Genetics of Harvest and Leaf-Yield Indices in Cowpea. J. Crop Improv. 2009, 23, 266–274. [Google Scholar] [CrossRef]
  31. Alvarado, G.; Rodríguez, F.M.; Pacheco, A.; Burgueño, J.; Crossa, J.; Vargas, M.; Pérez-Rodríguez, P.; Lopez-Cruz, M.A. META-R: A Software to Analyze Data from Multi-Environment Plant Breeding Trials. Crop J. 2020, 8, 745–756. [Google Scholar] [CrossRef]
  32. de Mendiburu, F. Agricolae: Statistical Procedures for Agricultural Research. R Package 2021.
  33. Bates, D.; Mächler, M.; Bolker, B.M.; Walker, S.C. Fitting Linear Mixed-Effects Models Using Lme4. J. Stat. Softw. 2015, 67, 1–48. [Google Scholar] [CrossRef]
  34. Allard, R.W. Principles of Plant Breeding, 2nd ed.; John Wiley & Sons, Inc.: New York, NY, USA, 1960; ISBN 978-0-471-02309-8. [Google Scholar]
  35. Cooper, M.; DeLacy, I.H. Relationships among Analytical Methods Used to Study Genotypic Variation and Genotype-by-Environment Interaction in Plant Breeding Multi-Environment Experiments. Theor. Appl. Genet. 1994, 88, 561–572. [Google Scholar] [CrossRef] [PubMed]
  36. Sodini, S.M.; Kemper, K.E.; Wray, N.R.; Trzaskowski, M. Comparison of Genotypic and Phenotypic Correlations: Cheverud’s Conjecture in Humans. Genetics 2018, 209, 941–948. [Google Scholar] [CrossRef] [PubMed] [Green Version]
  37. Rosseel, Y. Lavaan: An R Package for Structural Equation Modeling. J. Stat. Softw. 2012, 48, 1–36. [Google Scholar] [CrossRef] [Green Version]
  38. Wright, S. Correlation and Causation. J. Agric. Res. 1921, 20, 557–585. [Google Scholar]
  39. Zimmermann, M.J.O.; Rosielle, A.A.; Waines, J.G.; Foster, K.W. A Heritability and Correlation Study of Grain Yield, Yield Components, and Harvest Index of Common Bean in Sole Crop and Intercrop. Field Crops Res. 1984, 9, 109–118. [Google Scholar] [CrossRef]
  40. Olivoto, T.; Lúcio, A.D.C. Metan: An R Package for Multi-Environment Trial Analysis. Methods Ecol. Evol. 2020, 11, 783–789. [Google Scholar] [CrossRef] [Green Version]
  41. Yan, W.; Kang, M.S. GGE Biplot Analysis: A Graphical Tool for Breeders, Geneticists, and Agronomists, 1st ed.; CRC Press: Boca Raton, FL, USA, 2002; ISBN 9780429122729. [Google Scholar]
  42. Rahmstorf, S.; Coumou, D. Increase of Extreme Events in a Warming World. Proc. Natl. Acad. Sci. USA 2011, 108, 17905. [Google Scholar] [CrossRef] [Green Version]
  43. Haug, B.; Messmer, M.M.; Enjalbert, J.; Goldringer, I.; Forst, E.; Flutre, T.; Mary-Huard, T.; Hohmann, P. Advances in Breeding for Mixed Cropping—Incomplete Factorials and the Producer/Associate Concept. Front. Plant Sci. 2021, 11, 2176. [Google Scholar] [CrossRef]
  44. Bedoussac, L.; Journet, E.P.; Hauggaard-Nielsen, H.; Naudin, C.; Corre-Hellou, G.; Jensen, E.S.; Prieur, L.; Justes, E. Ecological Principles Underlying the Increase of Productivity Achieved by Cereal-Grain Legume Intercrops in Organic Farming. A Review. Agron. Sustain. Dev. 2015, 35, 911–935. [Google Scholar] [CrossRef]
  45. Islam, N.; Zamir, M.S.I.; Din, S.M.U.; Farooq, U.; Arshad, H.; Bilal, A.; Sajjad, M.T.; Islam, N.; Zamir, M.S.I.; Din, S.M.U.; et al. Evaluating the Intercropping of Millet with Cowpea for Forage Yield and Quality. Am. J. Plant Sci. 2018, 9, 1781–1793. [Google Scholar] [CrossRef] [Green Version]
  46. Davis, J.H.C.; Woolley, J.N. Genotypic Requirement for Intercropping. Field Crops Res. 1993, 34, 407–430. [Google Scholar] [CrossRef]
  47. Woolley, J.N.; Rodríguez, W. Cultivar X Cropping System Interactions in Relay and Row Intercropping of Bush Beans with Different Maize Plant Types. Exp. Agric. 1987, 23, 181–192. [Google Scholar] [CrossRef]
  48. Kouyaté, Z.; Krasova-Wade, T.; Yattara, I.I.; Neyra, M. Effects of Cropping System and Cowpea Variety on Symbiotic Potential and Yields of Cowpea (Vigna Unguiculata L. Walp) and Pearl Millet (Pennisetum Glaucum L.) in the Sudano-Sahelian Zone of Mali. Int. J. Agron. 2012, 2012, 761391. [Google Scholar] [CrossRef] [Green Version]
  49. Nelson, W.C.D.; Hoffmann, M.P.; Vadez, V.; Roetter, R.P.; Whitbread, A.M. Testing Pearl Millet and Cowpea Intercropping Systems under High Temperatures. Field Crop. Res. 2018, 217, 150–166. [Google Scholar] [CrossRef] [Green Version]
  50. Haider, M.; Sheikh, B.; Rahman, M. Effect of Intercropping on Growth and Yield in Wheat-Lentil and Wheat-Chickpea Intercropping System at Different Planting Configurations. J. Innov. Dev. Strategy 2011, 5, 125–137. [Google Scholar]
  51. Habib, A.; Mohammad, S.; Jahan, B.; Bashir, A.; Hamayoon, K. Yield and Yield Components of Wheat and Gram Planted in Monoculture and in Combination at Different Row Directions and Crop Geometry. Sarhad J. Agric. 2000, 16, 237–246. [Google Scholar]
  52. Mandal, B.K.; Saha, S.; Jana, T.K. Yield Performance and Complementarity of Rice (Oryza Sativa) with Greengram (Phaseolus Radiatus), Blackgram (Phaseolus Mungo) and Pigeonpea (Cajanus Cajan) under Different Rice-Legume Associations. Indian J. Agron. 2000, 45, 41–47. [Google Scholar]
  53. Falconer, D.S. The Problem of Environment and Selection. Am. Nat. 1952, 86, 293–298. [Google Scholar] [CrossRef]
  54. Moore, V.M.; Schlautman, B.; Fei, S.Z.; Roberts, L.M.; Wolfe, M.; Ryan, M.R.; Wells, S.; Lorenz, A.J. Plant Breeding for Intercropping in Temperate Field Crop Systems: A Review. Front Plant Sci. 2022, 13, 862. [Google Scholar] [CrossRef]
  55. Brummer, E.C.; Baker, R.F. Breeding for Cropping Systems. In Plant Breeding: The Arnel R. Hallauer International Symposium; Lamkey, K.R., Michael, L., Eds.; John Wiley & Sons, Ltd.: Hoboken, NJ, USA, 2008; pp. 97–106. ISBN 9780813828244. [Google Scholar]
  56. Bänziger, M.; Cooper, M. Breeding for Low Input Conditions and Consequences for Participatory Plant Breeding: Examples from Tropical Maize and Wheat. Euphytica 2001, 122, 503–519. [Google Scholar] [CrossRef]
  57. Holland, J.B.; Brummer, E.C. Cultivar Effects on Oat–Berseem Clover Intercrops. Agron. J. 1999, 91, 321–329. [Google Scholar] [CrossRef] [Green Version]
  58. Lynch, M.; Walsh, B. Genetics and Analysis of Quantitative Traits, 1st ed.; Sinauer Associates: Sunderland, MA, USA, 1998; ISBN 9780878934812. [Google Scholar]
  59. Yan, W. Crop Variety Trials: Data Management and Analysis, 1st ed.; John Willey & Sons, Inc.: New Delhi, India, 2014; ISBN 978-1-118-68864-9. [Google Scholar]
  60. Bidinger, F.R.; Weltzien, E.; Mahalakshmi, R.V.; Singh, S.D.; Rao, K.P. Evaluation of Landrace Topcross Hybrids of Pearl Millet for Arid Zone Environments. Euphytica 1994, 76, 215–226. [Google Scholar] [CrossRef] [Green Version]
  61. Singh, S.; Molina, A.; Gepts, P. Potential of Wild Common Bean for Seed Yield Improvement of Cultivars in the Tropics. Can. J. Plant Sci. 1995, 75, 807–813. [Google Scholar] [CrossRef] [Green Version]
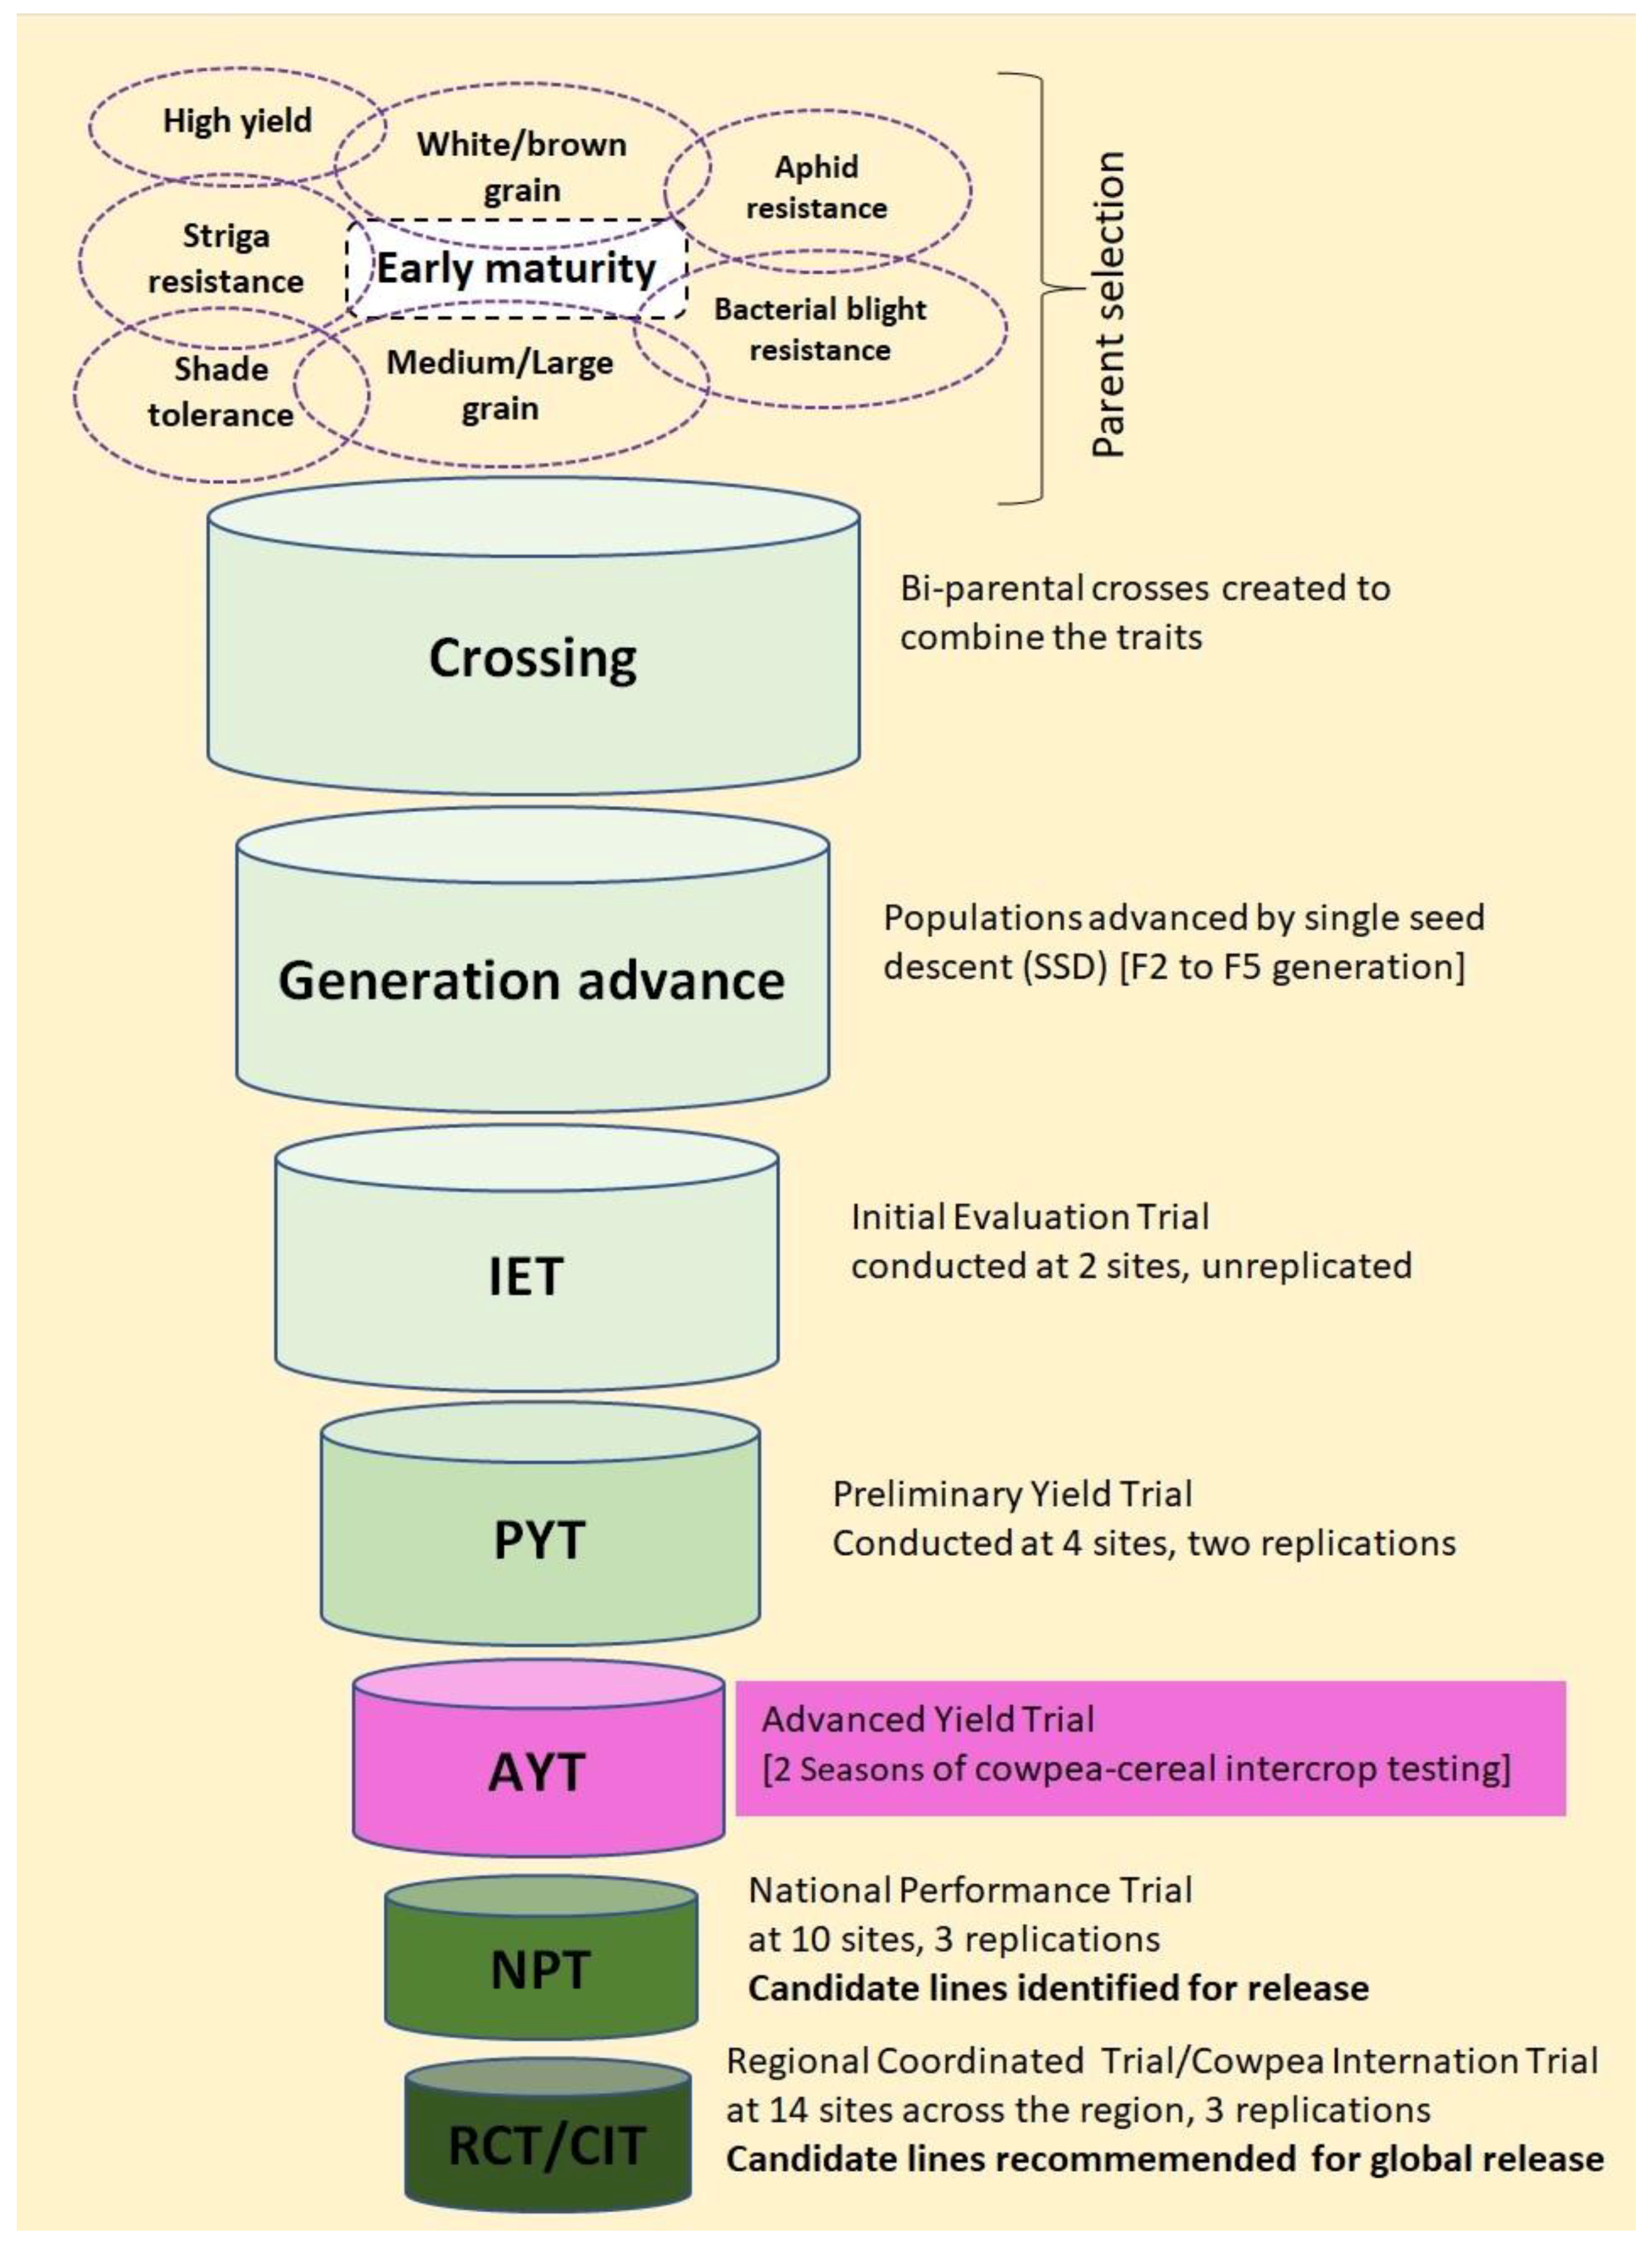
Figure 1. The breeding scheme depicting a cowpea short duration pipeline and highlighting the phase at which intercrop testing is integrated.
Agronomy 13 01594 g001
Figure 2. Hypothetical path diagram for the direct effects and association of yield and related traits in cowpea (Vignaunguiculata).
Agronomy 13 01594 g002
Figure 3. Mean comparisons among the three cropping patterns for five cowpea traits: (a) grain yield (GY), (b) pod weight (Pdwt), (c) 100 seed weight (Hsdwt), (d) fodder weight (Fdwt), and (e) harvest index (HI). On the x-axes, “Sole” refers to sole cropping; “1:1” refers to 1 row of millet to 1 row of cowpea; “2:4” refers to 2 rows of millet to 4 rows of cowpea. In each plot, lines with the same color or the same letter are not significantly different from each other. The circles on the lines indicate the mean of each cropping pattern. The alignments of cropping patterns on the graph are in descending order, starting with the cropping patterns that have the highest mean.
Agronomy 13 01594 g003
Figure 4. Yield performance of genotypes under specific cropping patterns based on the BLUPs model: (a) sole cropping, (b) 1:1 cropping pattern, (c) 2:4 cropping pattern, and (d) overall performance across patterns and years. Vertical dashed lines indicate the mean values; the red and blue dots represent genotype performance above and below the means, respectively.
Agronomy 13 01594 g004
Figure 5. Output path diagram illustrating the relationships among traits under specific cropping patterns: (a) sole cropping, (b) 1:1 cropping pattern, (c) 2:4 cropping pattern, and (d) pooled data across patterns. ***, ** and * refer to statistical significance at the probability levels of 0.001, 0.01 and 0.05, respectively.
Agronomy 13 01594 g005
Figure 6. GGE biplot depicting the relationships between the three cropping patterns (sole, 1:1 (P_1_1), and 2:4 (P_2_4)) and their contributions to observed variations, with components 1 and 2 explaining 90.32% of the total variation using Column Metric Preserving SVP and environment-centred (G + GE) and no scaling. The legend “Env” represents the cropping patterns that were considered as environments in this analysis, while “Gen” refers to genotypes.
Agronomy 13 01594 g006
Figure 7. GGE biplot showing grain yield stability of genotypes across three cropping patterns (sole, 1:1 (P_1_1), and 2:4 (P_2_4)), with components 1 and 2 explaining 90.32% of the total variation using Column Metric Preserving SVP and environment-centred (G + GE) and no scaling. The green line with an arrow mark on it is the average environment coordinate (AEC). Genotypes extending beyond the arrow mark on AEC are the most productive. The length of the dotted lines that are perpendicular to the AEC and projecting to each genotype daepicts the instability of the genotypes (short = stable, long = unstable).
Agronomy 13 01594 g007
Figure 8. GGE biplot portraying adaptation of cowpea genotypes to each of the three cropping patterns (sole, 1:1 (P_1_1), and 2:4 (P_2_4)), with components 1 and 2 explaining 90.32% of the total variation using Column Metric Preserving SVP and environment-centred (G + GE) and no scaling. Black dots at the vertex of the polygon depict genotypes that are adapted to the closest cropping pattern in that quadrant. The legend “Env” represents the cropping patterns that were considered as environments in this analysis, while “Gen” refers to genotypes.
Agronomy 13 01594 g008
Table 1. Mean squares from split-plot analysis of variance for thirty-five cowpea genotypes planted under three cropping patterns across two years.
Source of VariationDfMSDen.df
Pdwt aGY bFdwt cHsdwt dHI e
Year (Y)1187,976,331 ***94,495,477 **2,576,623 **341.89 *36143 **Y/Rep
Y/Rep292,604188,380 ns19,411 ns10.90159Pooled error (a)
Pattern (P)248,892,462 ***24,942,335 ***12437044 **6.292717 *Pooled error (a)
P × Y215,375,111 **8,003,522 **2,911,634 *23.72852Pooled error (a)
Pooled error (a)4461,656272,015258,3844.38278
Genotype (G)34718,325 ***345,532 ***1,676,127 ***81.96 ***301 ***Pooled error (b)
G × Y34383,060 ***169,757 ***422,733 ***3.52 ***117 ***Pooled error (b)
G × P68245,121 **110,555 **281,291 **1.74 *42Pooled error (b)
G × P × Y67199,05482,951203,4591.5449Pooled error (b)
Pooled error (b)191157,88465,430172,7841.1837
***, **, and * refer to significance levels at the probability of 0.001, 0.01, and 0.05, respectively; ns = not significant; a, b, c, d, and e refer to pod weight, grain yield, fodder weight, the weight of 100 seeds, and harvest index, respectively; Df = degrees of freedom; Den.df = denominator degree of freedom for the F-test.
Table 2. Variance components, heritability, and expected genetic advance for five traits under three different cropping systems.
TraitPatternHσ2Gσ2GPσ2GYσ2GPYσ2eµLSDCV (%)GAGAM (%)
GYSole0.6658,504.85 *** 17,940.35 83,116.711222.51419.0723.58345.6228.27
1:10.182626.50 6295.46 36,664.47392.51134.5948.7837.719.61
2:40.01573.07 55,105.39 72,908.14920.34628.3529.344.200.46
Combined0.4714,513.00 ***6163.0015,249.008489.0065,430.00867.9859.4629.47144.5216.65
PodwtSole0.63108,953.86 *** 46,326.12 159,507.301707.60593.9623.39461.0727.00
1:10.225985.10 5663.44 71,222.39555.37197.3148.0564.3811.59
2:40.0029.66 121,183.25 235,012.001302.571004.7536.940.150.01
Combined0.4427,785.00 ***9994.0031,345.0023,078.00157,884.001217.5992.3732.63193.0715.86
HsdwtSole0.946.85 *** 0.58 0.7416.862.235.104.4426.35
1:10.896.44 *** 0.69 1.7617.172.567.734.2124.50
2:40.947.14 *** 0.30 1.0817.301.896.014.5526.28
Combined0.966.80 ***0.060.360.081.2017.100.256.354.4826.17
FdwtSole0.58105,716.36 ** 84,650.55 135,843.931207.86619.1630.51434.8936.01
1:10.6550,873.04 *** 0.00 109,030.39671.41389.9449.18319.4147.57
2:40.68213,137.43 *** 70,804.09 260,766.841165.40919.5843.82668.1357.33
Combined0.71101,500.00 ***19,490.0036,220.0017,840.00172,784.001024.1196.6240.59470.2745.92
HISole0.275.93 17.13 30.4739.576.0413.952.215.59
1:10.7130.75 *** 5.20 40.6930.659.1120.828.1826.70
2:40.3613.79 28.35 40.7434.9714.5418.253.9111.18
Combined0.6618.31 ***0.0012.271.2537.0035.501.4117.046.1017.19
GY = grain yield (Kg/ha); podwt = pod weight (Kg/ha); Hsdwt = the weight of 100 seeds (g); Fdwt = fodder weight (Kg/ha); HI = harvest index (%); H = broad-sense heritability; σ2G = genetic variance component; σ2GP = variance component due to genotype x cropping pattern interaction; σ2GY = variance component due to genotype x year interaction; σ2GPY = variance component due to genotype-by-cropping pattern-by-year interactions; σ2e = error variance component; µ = grand mean; LSD = least significant difference; CV = coefficient of variation; GA = expected genetic advance; GAM = expected genetic advance as a percentage of mean. ***, and ** refer to statistical significance at the probability levels of 0.001 and 0.01respec-tively.
Table 3. Genetic and phenotypic correlations among cropping patterns based on grain yield (GY), pod weight (Pdwt), 100 seed weight (Hsdwt), fodder weight (Fdwt), and harvest index (HI).
Trait Sole vs. 1:1Sole vs. 2:41:1 vs. 2:4
GYrg1.00 **1.00 **1.00 **
rp0.37 *0.40 *0.42 **
Podwtrg0.901.00 **1.00 **
rp0.290.47 **0.34 *
Hsdwtrg0.991.00 **1.00 **
rp0.88 ***0.94 ***0.91 ***
Fdwtrg1.00 **1.00 **1.00 **
rp0.62 ***0.70 ***0.66 ***
HIrg1.00 **1.00 **1.00 **
rp0.69 ***0.69 ***0.65 ***
rg = genetic correlation; rp = phenotypic correlation; GY = grain yield; podwt = pod weight; Hsdwt = 100 seed weight; Fdwt = fodder weight; HI = harvest index; Sole = sole cowpea; 1:1 = 1 row of millet to 1 row of cowpea; 2:4 = 2 rows of millet to 4 rows of cowpea; ***, **, and * refer to statistical significance at the probability levels of 0.001, 0.01, and 0.05, respectively.
Table 4. Genetic and phenotypic correlations among five traits under sole, 1:1, and 2:4 cropping patterns.
Sole1:12:4
Traitrgrprgrprgrp
GY vs. Podwt1.00 ***0.95 ***0.93 ***0.98 ***0.96 ***0.86 ***
GY vs. Fdwt0.72 ***0.63 ***0.180.36 *0.79 ***0.54 ***
GY vs. Hsdwt0.57 ***0.330.280.040.61 ***0.09
GY vs. HI0.320.150.5 **0.28−0.19−0.09
Hsdwt vs. Podwt0.5 **0.260.42 **0.010.42 **−0.02
Hsdwt vs. Fdwt0.67 ***0.62 ***0.42 **0.33 *0.53 ***0.42 **
Hsdwt vs. HI−0.21−0.41 **−0.25−0.17−0.18−0.44 **
Podwt vs. Fdwt0.78 ***0.65 ***0.33 *0.39 *0.84 ***0.54 ***
Podwt vs. HI0.230.030.41 *0.19−0.45 **−0.27
Fdwt vs. HI−0.49 **−0.59 ***−0.84 ***−0.70 ***−0.81 ***−0.77 ***
rg = genetic correlation; rp = phenotypic correlation; GY = grain yield; podwt = pod weight; Hsdwt = 100 seed weight; Fdwt = fodder weight; HI = harvest index; Sole = sole cowpea; 1:1 = 1 row of millet to 1 row of cowpea; 2:4 = 2 rows of millet to 4 rows of cowpea; ***, **, and * refer to statistical significance at the probability levels of 0.001, 0.01, and 0.05, respectively.
Disclaimer/Publisher’s Note: The statements, opinions and data contained in all publications are solely those of the individual author(s) and contributor(s) and not of MDPI and/or the editor(s). MDPI and/or the editor(s) disclaim responsibility for any injury to people or property resulting from any ideas, methods, instructions or products referred to in the content.