Article

Molecular Mechanism of Exogenous Selenium Affecting the Nutritional Quality, Species and Content of Organic Selenium in Mustard

1
School of Modern Industry for Selenium Science and Engineering, Wuhan Polytechnic University, Wuhan 430048, China
2
National R&D Center for Se-Rich Agricultural Products Processing, Wuhan Polytechnic University, Wuhan 430023, China
*
Author to whom correspondence should be addressed.
Agronomy 2023, 13(5), 1425; https://doi.org/10.3390/agronomy13051425
Submission received: 11 April 2023 / Revised: 11 May 2023 / Accepted: 19 May 2023 / Published: 21 May 2023
(This article belongs to the Section Crop Breeding and Genetics)

Abstract

:
It is an essential method for healthy Selenium (Se) supplementation to convert exogenous Se into organic Se via crops. Brassica juncea (L.) Czern (leaf mustard) was employed as plant material in this investigation and was treated with sodium selenite (Na2SeO3). Its physiological indicators, nutritional quality, antioxidant enzyme activity, total Se content, and Se morphology were all evaluated. The absorption, transportation, and transformation mechanisms of Se in mustard were studied using transcriptome data. The results revealed that low concentration of Se treatment promoted the growth of mustard, while high concentration Se treatment inhibited it. The concentration of 10 mg/L Na2SeO3 treatment had the best growth parameters for mustard. Compared to the control group, the content of vitamin C (Vc) and anthocyanins in the treatment group increased to varying degrees, while the content of flavonoids, total phenols, soluble sugar, and soluble protein increased first and then decreased. Five Se forms, Se (IV), Se (VI), selenocystine(SeCys2), selenomethionine (SeMet), and methylselenocysteine (MeSeCys), were detected in the Na2SeO3 treatment group, with organic Se accounting for over 95%. Na2SeO3 treatment can significantly reduce the accumulation of ROS in mustard plants and enhance their stress resistance. Transcriptome data and metabolite association analysis showed that PHO1-H8 promoted the absorption of Na2SeO3 by mustard roots, while SULTR3;3 and SULTR4;1 promoted the transport of Se from roots to the aboveground portion and chloroplasts. Se in mustard was transformed into SeMet, SeCys, MeSeCys, and selenoprotein through the action of genes such as APS, APR, and SEP1, and stored in plant leaves.

1. Introduction

Se, a chemical analogue of sulfur (S), has been widely recognized as an essential micronutrient. Its lack will lead to more than 40 different types of human diseases [1,2]. Rotruck found that Se was an important component of glutathione peroxidase (GSH-Px), played a vital role in protecting cell membrane structure and reducing oxidative damage, and was an essential key substance in the growth and development of animals and plants [3]. More than 25 selenoproteins have been identified in mammals and distributed in different tissues and cells. They play an important role in redox metabolism [4]. According to the data of the Institute of Medicine of the National Academy of Sciences, the recommended dietary Se intake for adults was 55 µg/day, while the upper limit of the tolerable intake for adults was 400 µg/day [5]. People in the USA and Canada generally have adequate Se intake and do not face problems related to Se deficiency. Conversely, residents of China, New Zealand, certain parts of Europe, and Russia may experience insufficient intake of micronutrients due to inadequate soil and food Se content [6]. Plants that grow under acidic and weathered conditions (such as tropical soils) typically exhibit low Se concentrations. It is estimated that over one billion individuals worldwide currently experience Se deficiency [7,8]. In addition, the bioavailability of Se largely depends on its species: the bioavailability of selenomethionine (SeMet), selenocysteine (SeCys), selenate and selenite gradually decrease [9,10]. The research found that crop Se biofortification is safer and more effective with organic Se than inorganic Se, and the danger level of inorganic Se is 40 times higher than that of organic Se. Moreover, studies have indicated that a daily dosage of up to 800 µg Se provided by yeast will not cause any harmful effects on the human body [11].
Therefore, supplementing Se through crops may be an important strategy to increase the daily Se intake of humans and animals [12]. In plants, moderate and low concentrations of Se help promote growth and development. At the same time, plants are also important carriers of organic Se transformation [13,14]. Some studies have pointed out that Se can detect the production of ROS and participate in its quenching through direct and indirect mechanisms, thus improving the stress resistance of plants [2]. Therefore, in recent years, more and more attention has been paid to research on improving the organic Se content in crops through biofortification [9,10]. Although Se has important nutritional value and is beneficial to plant growth, the range between Se deficiency and poisoning is very narrow [8]. High concentration of Se will affect the normal growth of crops [15]. High doses of Se in plants will cause a stress response and an increase in reactive oxygen species, eventually leading to crop damage. The response of antioxidant enzymes (such as peroxidase (POD), superoxide dismutase (SOD) and catalase (CAT)) to high levels of heavy metal exposure also indicates that plants suffer from abiotic stress [7,12].
B. juncea is an important oil crop and vegetable in China, India, Bangladesh, and Ukraine, and has recently been extensively cultivated in Canada and Australia [16,17]. According to the use and morphology of mustard, four subspecies are proposed: integrifolia (leaf mustard), juncea (seed mustard), tumida (stem mustard) and napiformis (root mustard) [18]. Leaf mustard is rich in ascorbic acid, chlorophyll, ß-carotene, potassium, calcium and other minerals, and is widely used as a vegetable [19]. Mustard seeds are abundant in fat, carbohydrates, protein, and dietary fiber. Additionally, they contain a variety of vitamins, trace minerals (such as Fe, Ca, Zn, Cu, Mn, Se, and Mg), as well as electrolytes (such as Na and K) [20]. B. juncea has been widely studied for Se phytoremediation and Se- biofortification due to its high Se accumulation capacity, rapid growth and high biomass [21,22].
In the present study, leaf mustard seedlings were treated with different concentrations of Na2SeO3 to evaluate their effects on the biomass and physiological indicators of mustard seedlings. This study further analyzed the effects of Na2SeO3 treatment at different concentrations on the photosynthetic pigments, nutritional components, antioxidant enzyme activities, etc. of mustard seedling. Through the correlation analysis between the transcriptome data of mustard seedling and the content of different forms of Se (SeMet, SeCys2, MeSeCys, Se (IV) and Se (VI)), the mechanism of Na2SeO3 conversion into organic Se in mustard seedling was preliminarily summarized. These data are expected to provide new insights for Se biofortification in vegetable crop production, including Se concentration screening, nutritional value evaluation, growth-specific effects, and organic Se content.

2. Materials and Methods

2.1. Plant Material Treatment

Brassica juncea (L.) Czern, a leaf mustard variety, was used as the research material, and Na2SeO3 was used as exogenous Se to prepare nutrient solution for water culture of mustard. B. juncea was hydroponic cultured in a greenhouse at 25/20 °C (day/night) for 11 h under light and 13 h under dark conditions, with a relative humidity of 70% and a light intensity of 300–380 μmol∙(m−2s−1). The hydroponics site is the light culture room of Wuhan Polytechnic University. The Na2SeO3 used in the experiment was purchased from Hubei Jingcheng Chemical Co., Ltd. (Wuhan, China).
The experiment started on 2 July 2022. The 1/2 Hoagland nutrient solution was used as the basic medium, and Na2SeO3 with different concentrations (0, 5, 10, 20, 40 mg/L) was used as the mustard nutrient solution. Five breeding pots with the same specifications were chosen, an equal amount of nutrient solution was added to each pot, and 100 plump mustard seeds were selected and evenly distributed onto the gauze surface of each breeding pot. Mustard was collected on 1 August 2022. For each treatment, mustard with the same growth trend was selected, washed with ultra-pure water for three times, and divided into two parts after drying the water. One part was used for the determination of physiological indicators, and the other part was stored in a hermetic bag in a refrigerator at −80 °C for transcriptome sequencing and metabolite determination.

2.2. Determination of Growth Indicators

Mustard seedlings with relatively consistent growth were selected to measure their growth indicators. Five seedlings were taken from each group, and measurements were repeated three times to obtain an average value. Weight was measured using a precision balance (PX124ZH, Ohaus, Changzhou, China), while root and stem lengths were measured using a vernier caliper (DL92150, Deli, Ningbo, China). The germination rate was calculated as the ratio of sprouted seedlings to the number of seeds sown.
The determination of photosynthetic pigment, soluble sugar, soluble protein, Vc content, anthocyanin, total phenol content and flavonoid content was carried out. Photosynthetic pigment, soluble protein and soluble sugar were determined using the method described by Hou [23]. Chlorophyll and carotenoids were extracted by 95% ethanol and measured by UV-visible spectrophotometer at 665, 649, and 470 nm, separately. According to the records, the photosynthetic pigment values were calculated as follows: Ca = 13.95 A665 − 6.88 A649; Cb = 24.96 A649 − 7.32 A665; Cx = (1000 A470 − 2.05 Ca − 114.8 Cb)/245; Pc = (C × V × N)/(W × 1000). Ca, Cb, and Cx indicate the concentrations of chlorophyll a, chlorophyll b, and carotenoids (mg/L), respectively; A665, A649, and A470 represent the absorbance of the photosynthetic pigment extract at wavelengths of 665 nm, 649 nm, and 470 nm, respectively; C was the concentration of photosynthetic pigments (mg/L); V was the volume of the extraction solution (mL); N was the dilution ratio; W was the fresh weight of the sample (g). The determination of soluble sugar and protein content was carried out by Coomassie brilliant blue G-250 staining at 620 nm and 595 nm, respectively. The Vc content was determined using the kit (A009-1-1) from Nanjing Jiancheng Biotechnology Co., Ltd. (Nanjing, China). The contents of anthocyanins, total phenols and flavonoids were determined by the kit (AKPL017C, AKPL016C, AKPL015MD) of Beijing Box Biotechnology Co., Ltd. (Beijing, China).

2.3. Determination of Mustard Antioxidant System

The content of MDA was determined using the kit (A003-3-5) from Nanjing Jiancheng Bioengineering Co., Ltd. (Nanjing, China). The activities of glutathione peroxidase (GSH, EC 1.6.4.2), peroxidase (POD, EC 1.11.1.7), superoxide dismutase (SOD, EC 1.15.1.1) and catalase (CAT, EC 1.11.1.6) were determined using the kits (AKPR008M-120T, AKAO005C-60T, AKAO001C-60T, AKAO003-1M) from Beijing Box Biotechnology Co., Ltd. (Beijing, China).

2.4. Determination of Total Se and Se Speciation

The total Se content of mustard seedling was determined by hydride generation atomic fluorescence spectrometry (HG-AFS). The 0.5 g dry sample was digested with 10 mL nitric acid and 2 mL hydrogen peroxide in the microwave digestion system. Add 5 mL of hydrochloric acid to the digested solution and heat it until it is clear. Dilute the solution to 10 mL with water and perform sample loading testing on an HG-AFS instrument (AFS8510, Haiguang Instrument, Beijing, China). The working parameters of HG-AFS were set as follows: negative high voltage 340 V, lamp current 100 mA, atomization temperature of 800 °C, carrier gas flow of 500 mL/min injection 1 mL 3.5% KBH4. Se species were analyzed by liquid chromatography HG-AFS (LC-AFS8510, Haiguang Instrument, Beijing, China). SeO32−, SeO42−, SeCys2, SeMet, and MeSeCys purchased from the National Institute of Metrology (Beijing, China) were used as test standards to draw standard curves. Place 0.2 g of dry sample in a centrifuge tube, soak it in an ultrasonic water bath at 70 °C for 1 h, cool it, and centrifuge it at 5000 rpm for 10 min. LC-HG-AFS determination conditions were set according to Li et al.’s method [14]. Each treatment includes 3 biological replicates and 2 technical replicates.

2.5. Transcriptome Sequencing and Data Analysis

The Trizol Kit (Promega, Beijing, China) was used to extract total RNA from the various processed samples. DNase I (TaKaRa, Beijing, China) was utilized for removing DNA from the total RNA. Agarose gel electrophoresis and NanoDrop 2000 (IMPLEN, Westlake Village, CA, USA) were employed to determine the integrity and quality of the RNA.
Total RNA was utilized as input material for the RNA sample preparations, followed by clustering of the index-coded samples on a cBot Cluster Generation System using TruSeq PE Cluster Kit v3-cBot-HS (Illumina) in accordance with the manufacturer’s instructions. After cluster generation, the library preparations underwent sequencing on an Illumina Novaseq platform, generating 150 bp paired-end reads. The raw reads in fastq format were processed through in-house perl scripts to calculate Q20, Q30, and GC content for the clean data. All downstream analyses were based on the high-quality clean data. The reference genome and gene model annotation files were downloaded directly from the genome website. In a reference-based approach, StringTie (v1.3.3b) assembled the mapped reads of each sample.
Trinity software was used to perform transcriptome assembly. Gene function was then annotated based on the following databases: National Center for Biotechnology Information non-redundant protein sequences (Nr), Kyoto Encyclopedia of Genes and Genomes (KEGG, http://www.kegg.jp/kegg/pathway.html, accessed on 5 September 2022), Protein family (Pfam). Evolutionary genealogy of genes: Non-supervised Orthologous Groups (egg-NOG, http://eggnog5.embl.de/#/app/home, accessed on 5 September 2022), Swiss-Prot, and Gene Ontology (GO, http://geneontology.org/, accessed on 5 September 2022). The expression level of unigenes was represented using Fragments per Kilobase of transcript per Million fragments (FPKM) [24].
A weighted gene co-expression network analysis (WGCNA) was conducted through Novogene online tools (https://magic.novogene.com/customer/, accessed on 27 September 2022) to identify the key regulatory genes in the Se-amino acid biosynthesis pathway that responded to Na2SeO3 treatments. The module eigengene, which represented the expression profile of module genes in every sample, was defined as the first principal component of each module. Pearson correlations between the eigengenes of each module and the abundance of Se species were performed using the R package ggplot2.

2.6. Statistical Analysis

Excel 2021 v2212 (Microsoft, Raymond, WA, USA) and SPSS v22.0 (IBM, Amonk, NY, USA) were used for the processing and analysis of all data. The data between treatment groups were compared using Duncan’s test, with p < 0.05 indicating statistical significance. Three biological replicates were measured for each group of processed data. The OmicStudio (https://www.omicstudio.cn/tool) was carried out for correlation analysis, with positive and negative correlation thresholds set at ≥0.5 and ≤−0.5, respectively (p < 0.05).

3. Results

3.1. Effect of Na2SeO3 on the Biomass and Germination Rate of Mustard

Compared to the control group, there was no significant difference in the moisture content of mustard treated with different concentrations of Na2SeO3, ranging from 91.3% to 92.6% (Figure S1). Figure 1a shows that, compared to the control group, the seedling height of mustard treated with 5–40 mg/L Na2SeO3 solution increased by 18.7%, 73.4%, 29.9% and 21.0%, respectively. Only the 10 and 20 mg/L concentration treatments had significant differences compared to the control group, while other treatment groups showed no significant differences. The root length of mustard treated with 5 mg/L Na2SeO3 solution increased by 43.5% compared to the control group. However, the root length of mustard treated with 10–40 mg/L Na2SeO3 solution decreased by 6.5%, 25.1% and 49.8% compared to the control group. Figure 1b shows that, after treatment with Na2SeO3 solution of different concentrations, the biomass of mustard has increased by 9.3%, 78.3%, 19.1% and 18.3%, respectively, compared to the control group. Among them, the concentration of 10 mg/L treatment showed the highest degree of improvement and had a significant difference compared to the control group, while the biomass of other treatment groups increased without significant difference. Figure 1c shows that, compared to the control group, the germination rate of mustard seeds treated with 5–10 mg/L Na2SeO3 increased by 9.3% and 7.5%, respectively, while the germination rate of mustard seeds treated with 20 mg/L and 40 mg/L Na2SeO3 solution significantly decreased by 15.6% and 35.9%, respectively.

3.2. Effect of Na2SeO3 on Photosynthetic Pigment Content of Mustard

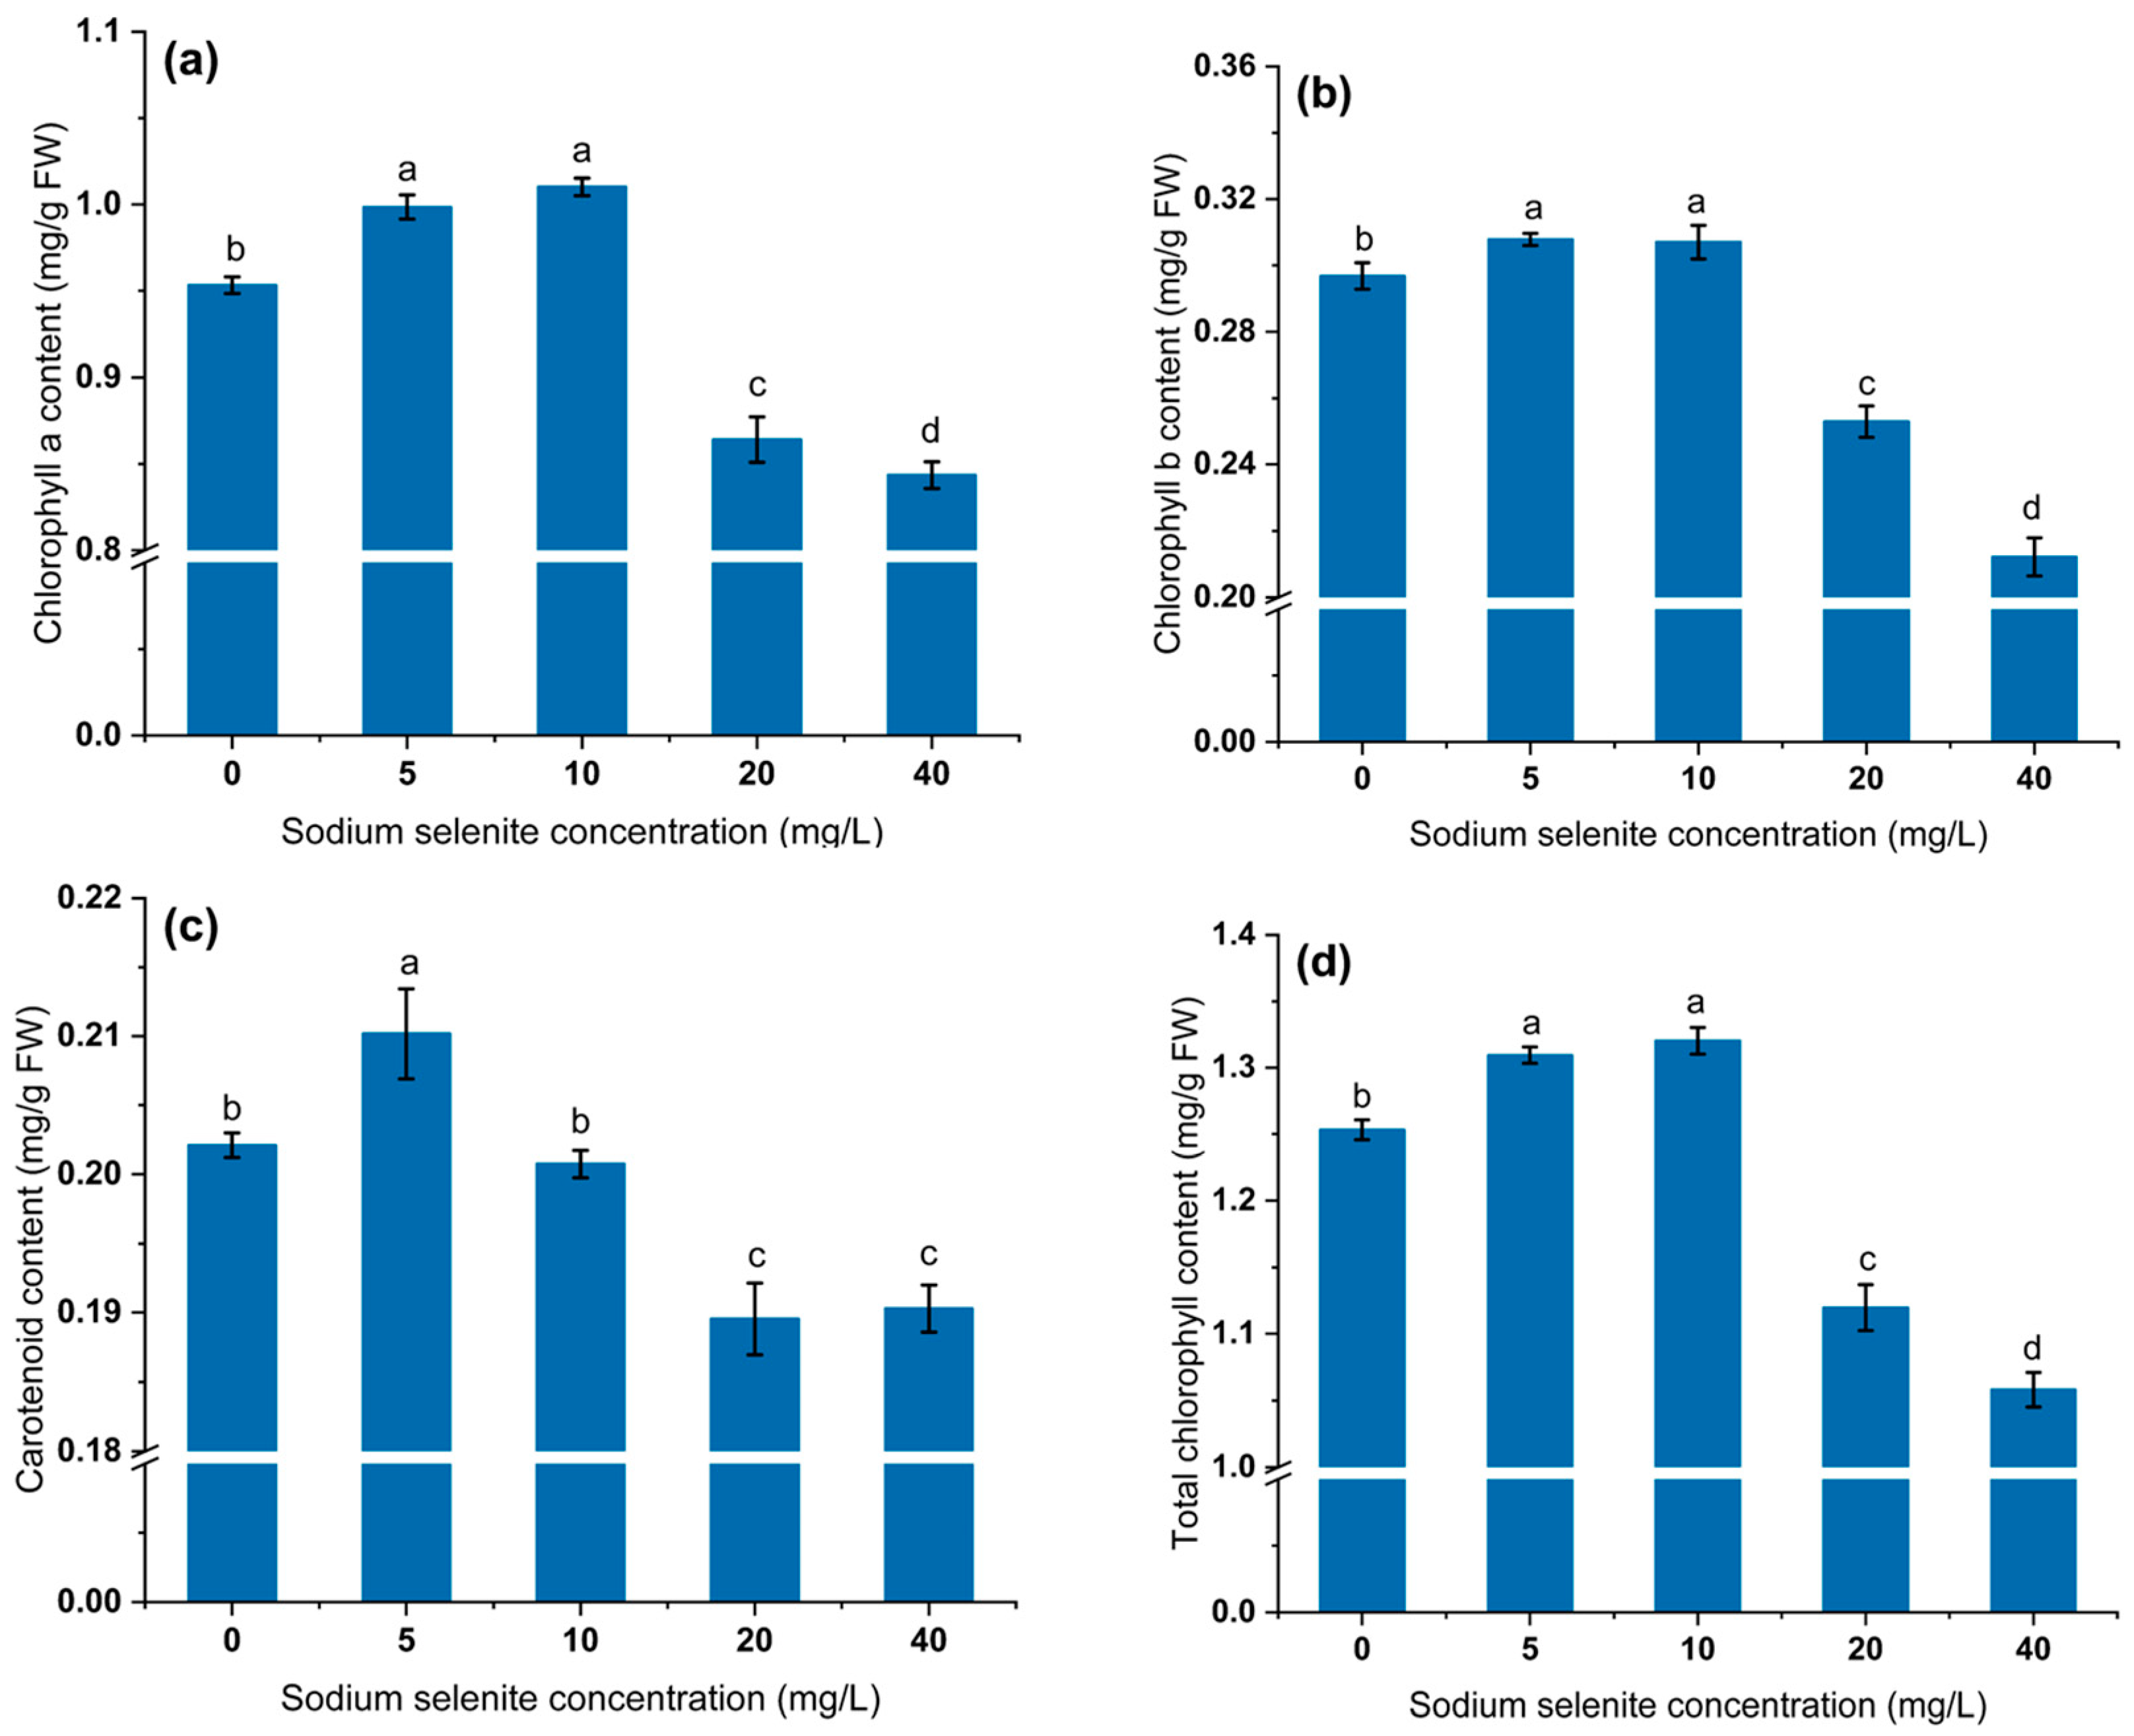
The content of chlorophyll a and b in mustard treated with different concentrations of Na2SeO3 was significantly different from the control. Compared to the control group, the 5–10 mg/L increased significantly by 4.7% and 5.9%, respectively. However, the content of chlorophyll a in the 20–40 mg/L treatment group decreased significantly by 10.3% and 13.0%, respectively (Figure 2a). Compared to the control group, the chlorophyll b of mustard treated with 5–10 mg/L Na2SeO3 increased by 3.7% and 3.4%, respectively. The 20–40 mg/L treatment group decreased by 14.8% and 28.5%, respectively (Figure 2b). Compared to the control group, the carotenoid content of mustard treated with 5 mg/L Na2SeO3 increased by 4.0%, and that of mustard treated with 10 mg/L Na2SeO3 decreased by 0.6%, while that of mustard treated with 20 and 40 mg/L significantly decreased by 6.2% and 5.8% (Figure 2c). Compared to the control group, the total chlorophyll content of the 5 mg/L and 10 mg/L Na2SeO3 treatment groups increased by 4.5% and 5.4%, respectively. However, the 20 mg/L and 40 mg/L Na2SeO3 treatment groups decreased by 10.7% and 15.6%, respectively (Figure 2d).

3.3. Effect of Na2SeO3 on Total Se and Se Speciation in Mustard

Compared to the control group, the total Se content in mustard seedlings increased significantly after treatment with different concentrations of Na2SeO3, and the higher the concentration, the higher the total Se content in mustard seedlings. As the concentration of Na2SeO3 treatment increased from 5 mg/L to 40 mg/L, the total Se content increased by 8.4 times, 30.3 times, 40.7 times, and 113.4 times, respectively(Table 1, Figure 3a).
After Na2SeO3 treatment, SeMet is the main Se species in mustard (Table 1, Figure 3b). In the 5 mg/L Na2SeO3 treatment group, the contents of SeCys2, MeSeCys, Se (IV), SeMet and Se (VI) were 0.48%, 0.82%, 0.07%, 1.85% and 0.54%, respectively, with the proportion of organic Se being 99.39%. In the 10 mg/L treatment group, the contents of the above Se species were 4.32%, 1.20%, 0.02%, 15.64% and 0.23%, respectively, and the proportion of organic Se being 99.75%. In the 20 mg/L treatment group, the proportion of Se forms were 4.81%, 1.53%, 0.03%, 5.79% and 0.34%, respectively, with the proportion of organic Se being 99.63%. In the 40 mg/L treatment group, the proportions of Se forms were 0.80%, 2.33%, 0.02%, 6.53% and 0.67%, respectively, with the proportion of organic Se being 99.31%. In general, the content of the five Se forms increased with the increase in Na2SeO3 treatment concentration, and the proportion of SeMet changed significantly. The proportion of SeMet in the 5–40 mg/L Na2SeO3 treatment group was 1.63 times, 6.47 times, 43.43 times and 112.25 times that of the control group.

3.4. Effect of Na2SeO3 Treatment on Nutritional Quality of Mustard

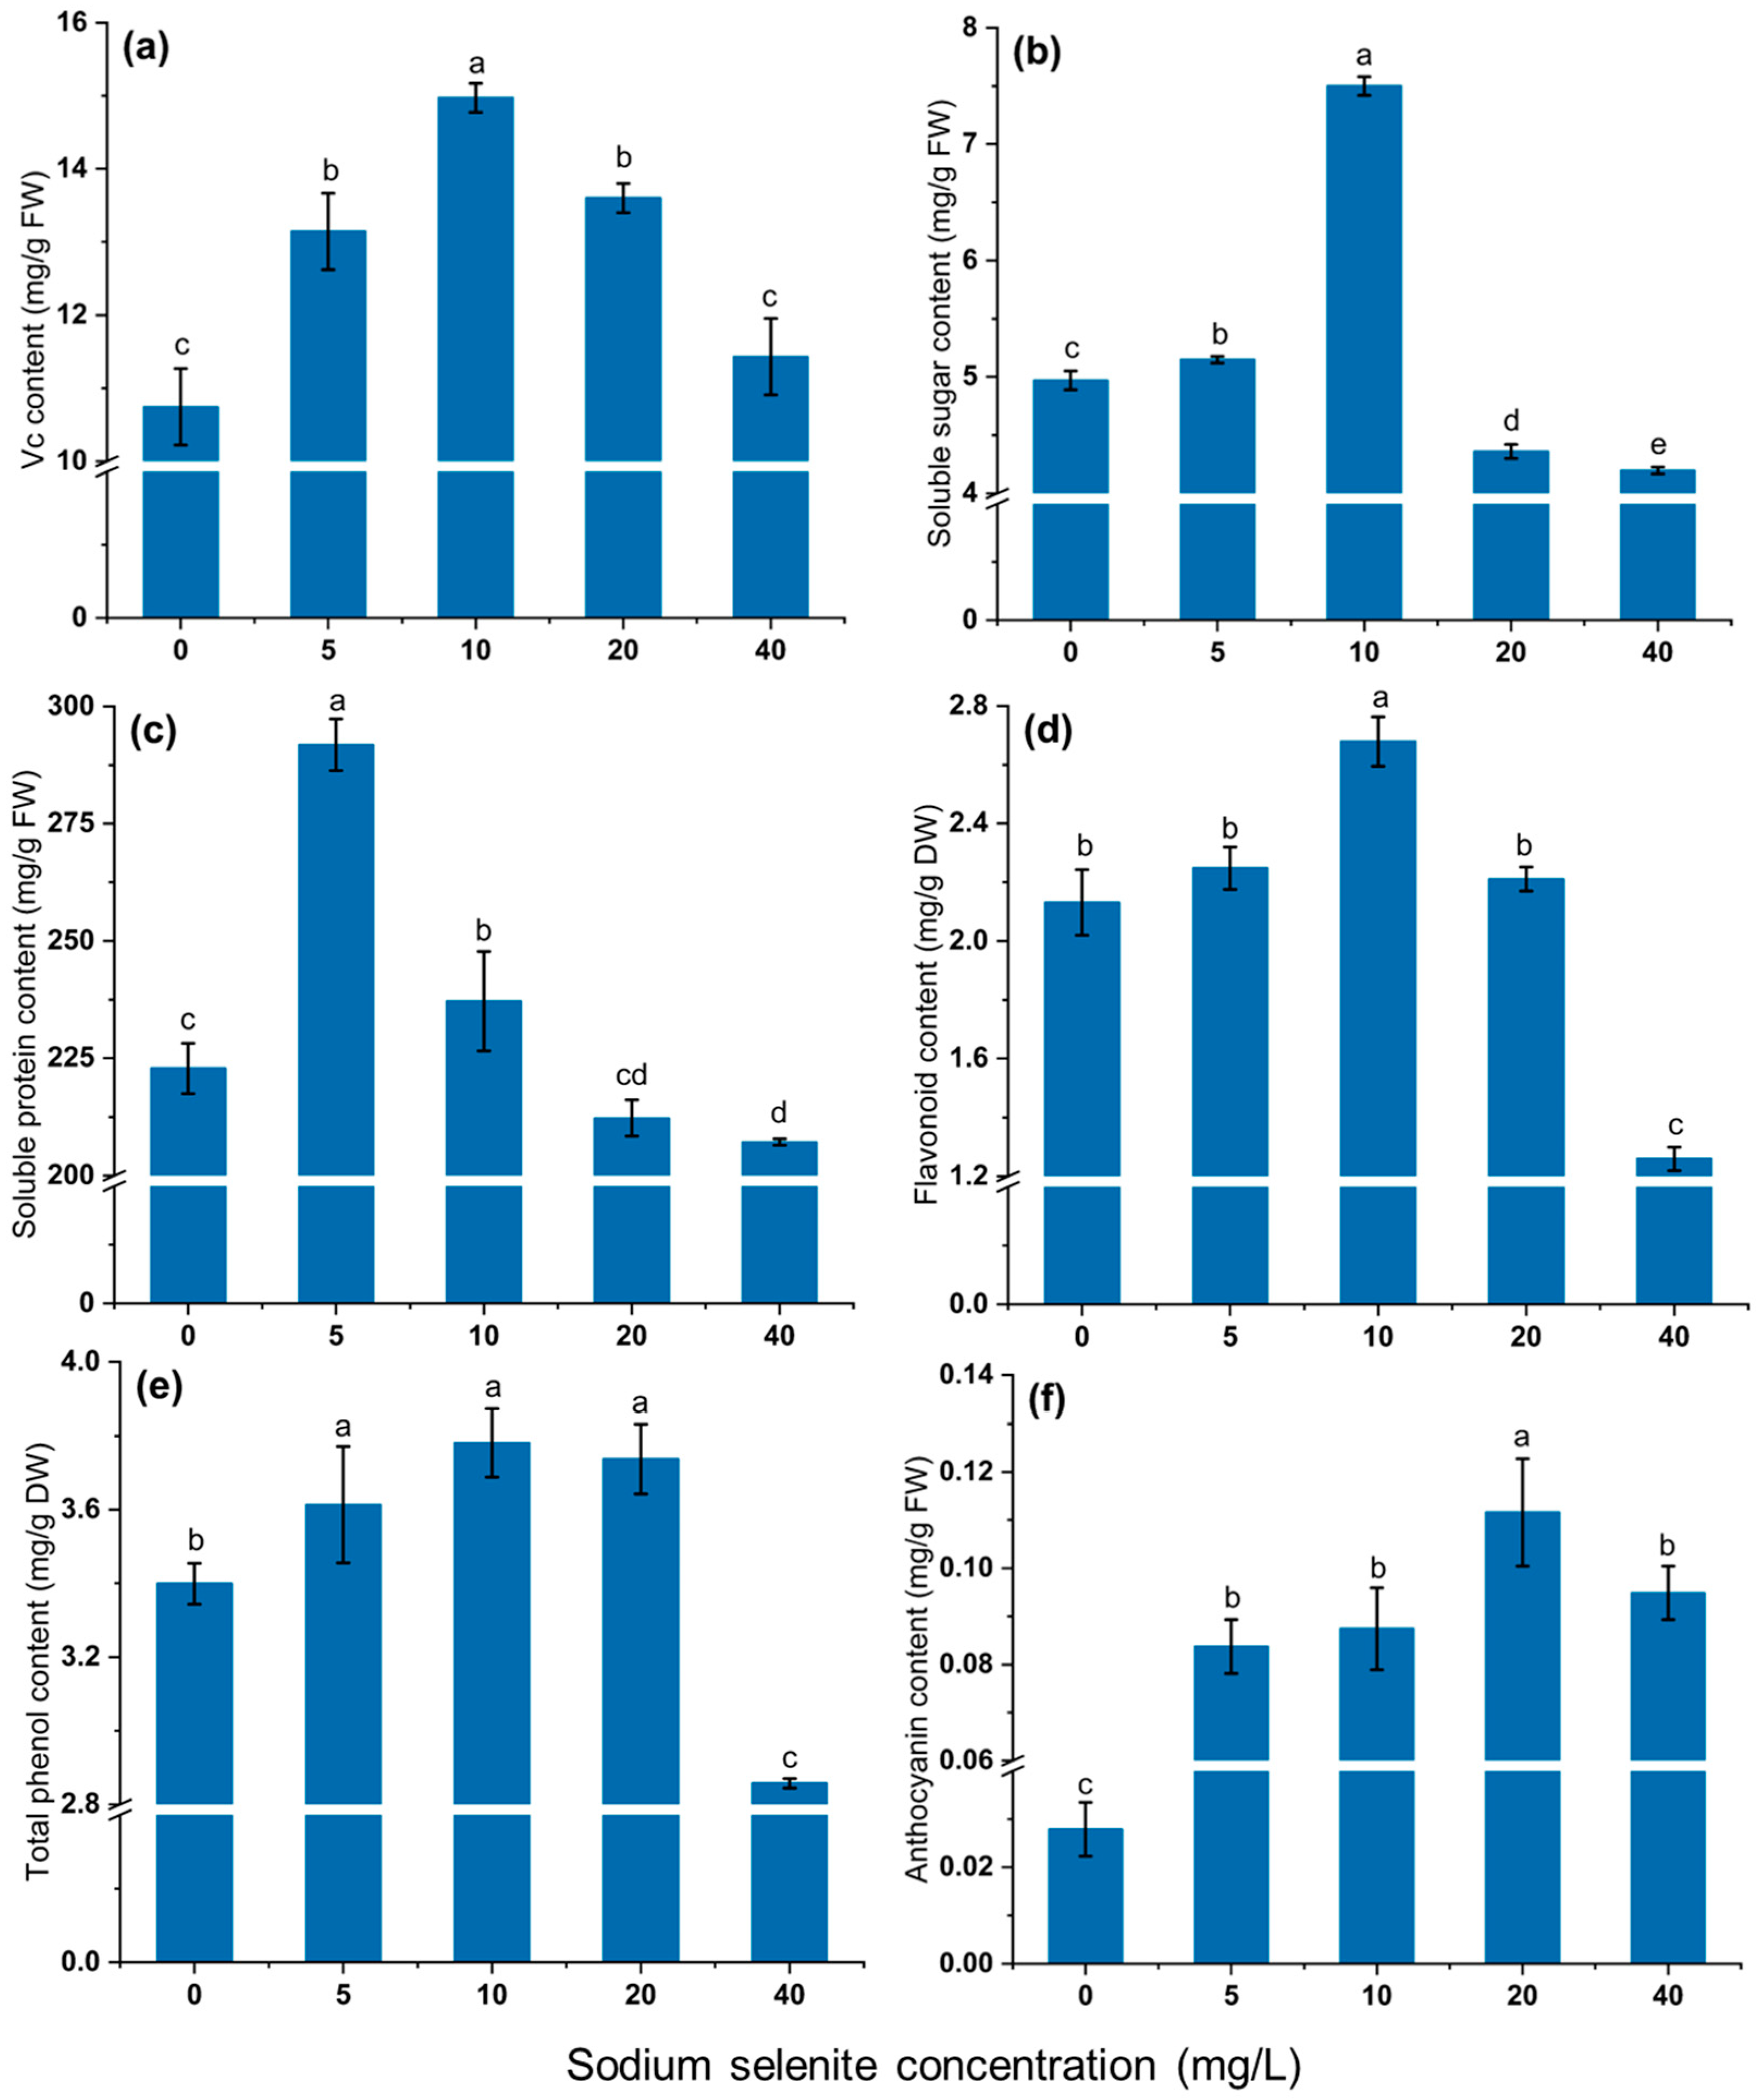
Figure 4 shows that 5–40 mg/L Na2SeO3 treatment group increased mustard Vc content by 22.3%, 39.4%, 26.6% and 6.4%, respectively. Except for 40 mg/L treatment group, all other concentrations were significantly increased compared to the control group (Figure 4a). The soluble sugar content of mustard seedlings was improved by 5 and 10 mg/L Na2SeO3 treatments, with an increased of 51.5% at 10 mg/L, which was significantly higher than the control group. However, the 20 and 40 mg/L Na2SeO3 treatments reduced the soluble sugar content of mustard seedlings, which decreased by 12.1% and 15.0%, respectively compared to the control group (Figure 4b).
The treatment groups with 5–10 mg/L Na2SeO3 exhibited a significant increase in soluble protein content compared to the control group, increasing by 30.9% and 6.4%, respectively. Conversely, the 20 and 40 mg/L treatment groups showed a decrease in soluble protein content by 7.1% relative to the control group (Figure 4c). The flavonoid content of mustard seedlings was significantly affected in the 10 and 40 mg/L Na2SeO3 treatment groups compared to the control group. Specifically, the 10 mg/L treatment group showed a significant 25.7% increase while the 40 mg/L treatment group exhibited a significant 40.9% decrease. However, the 5 and 20 mg/L increased by 5.5% and 3.7%, respectively, but the differences were not significant (Figure 4d). Compared to the control group, the total phenol content of the 5–20 mg/Na2SeO3 treatment group increased significantly by 6.3%, 11.2% and 6.0%, respectively, while the 40 mg/L treatment group decreased by 16.0% compared to the control group (Figure 4e). The content of anthocyanins in mustard increased significantly by 2 times, 2.13 times, 3 times, and 2.4 times, respectively, for the 0–40 mg/L treatments (Figure 4f).

3.5. Effect of Na2SeO3 Treatment on MDA Content of Mustard

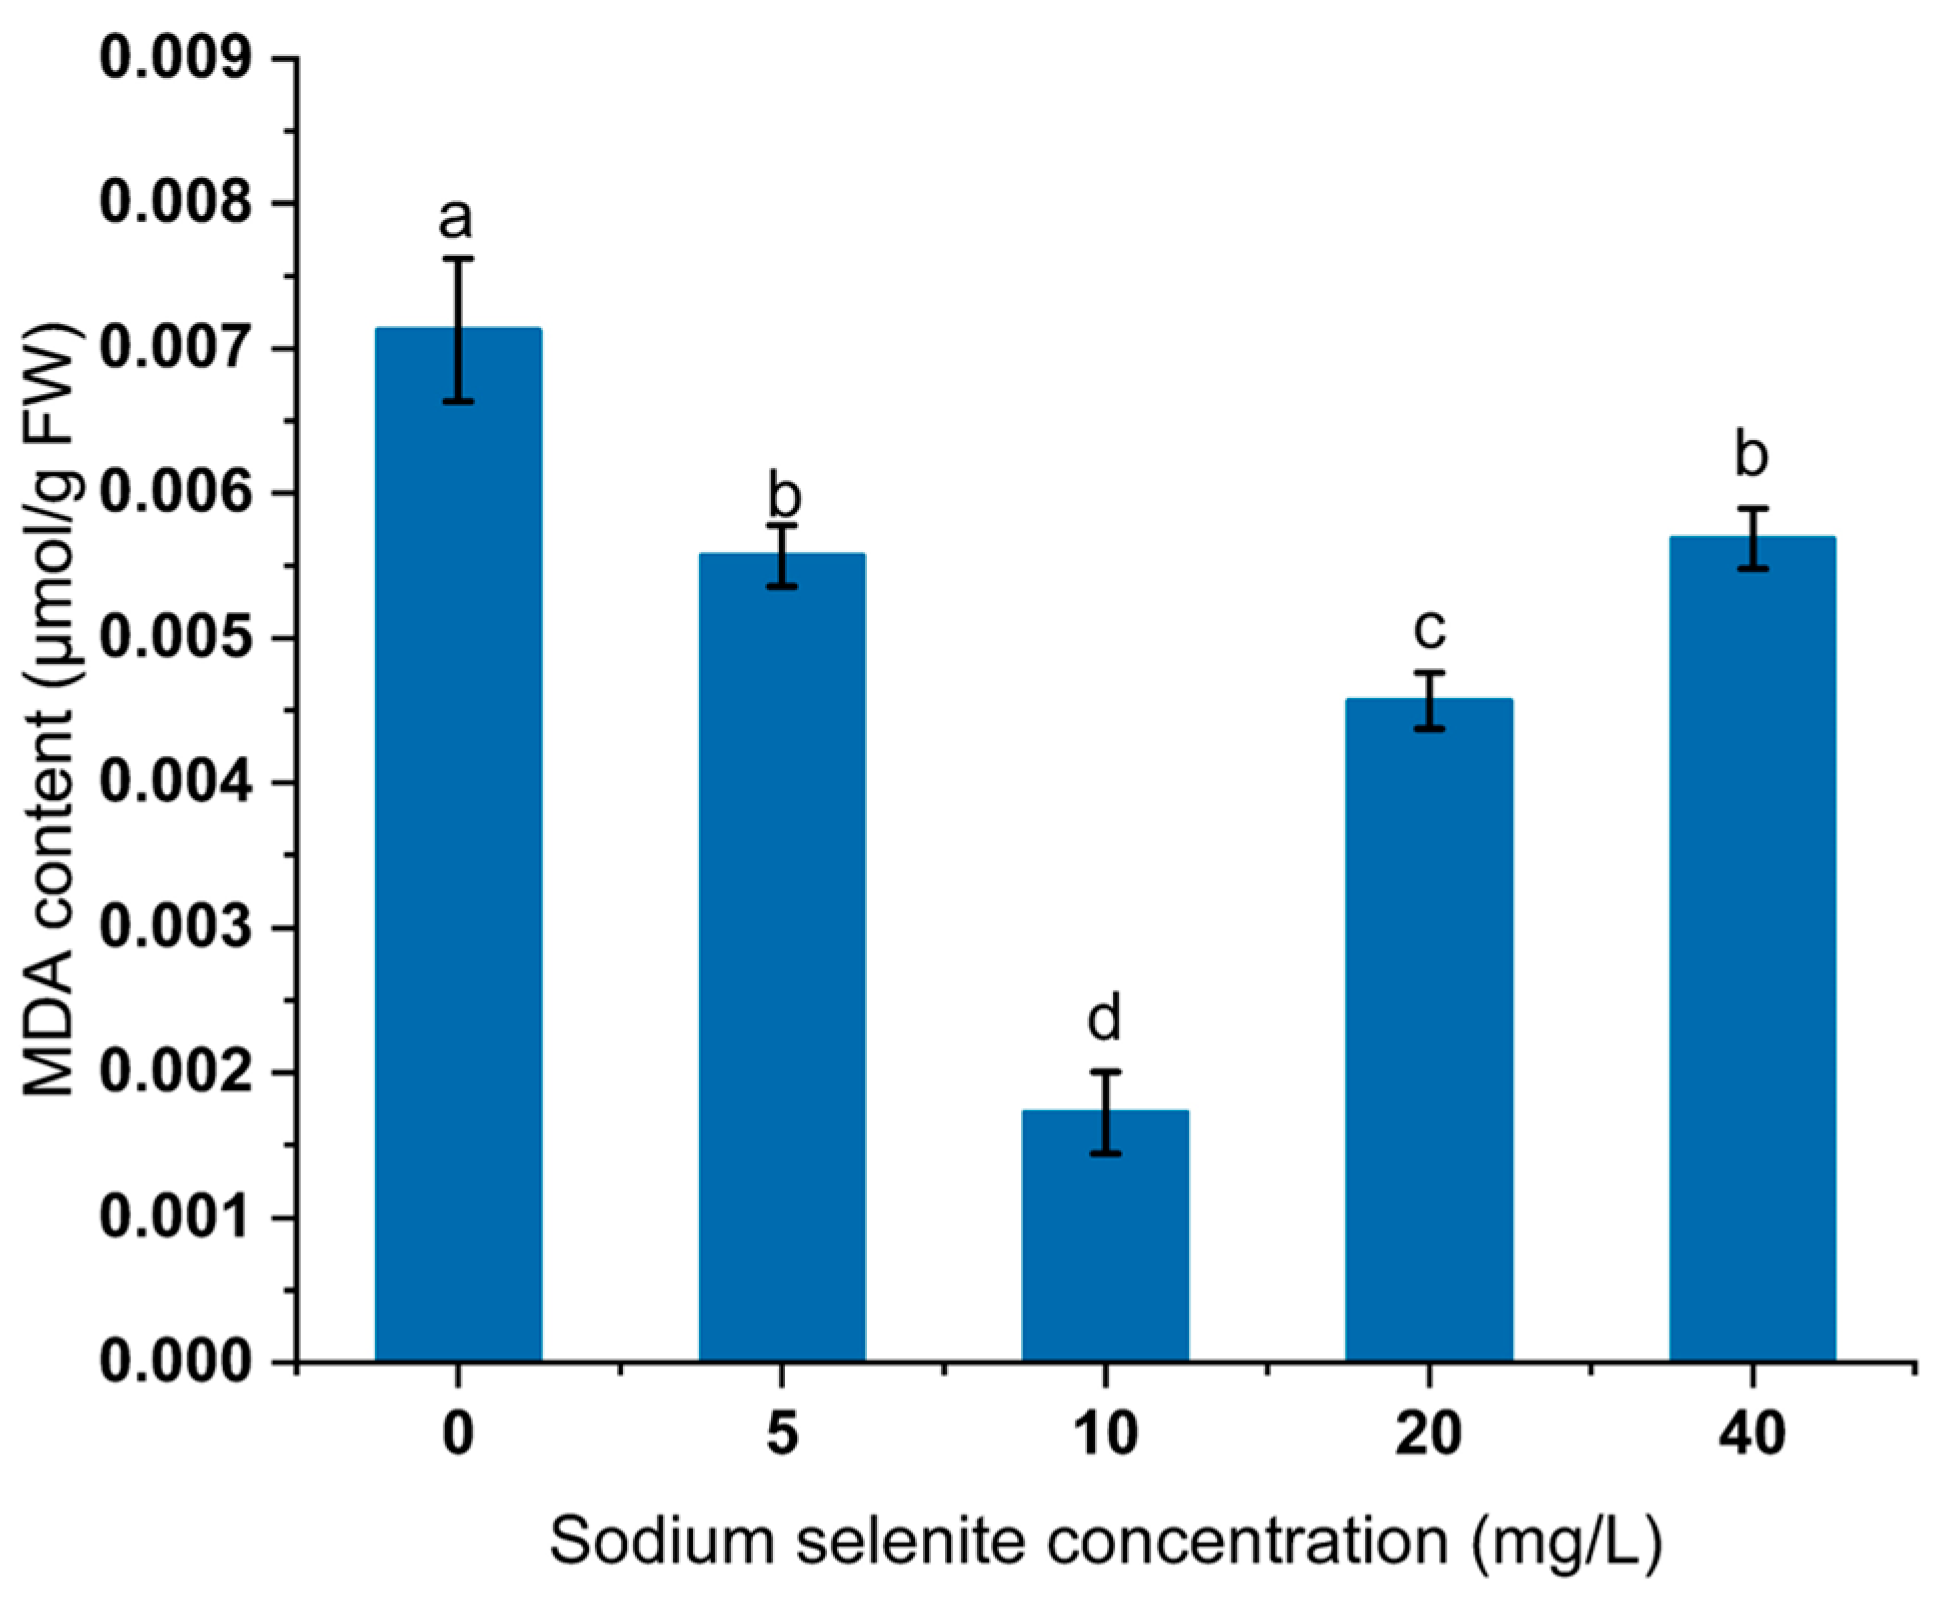
As presented in Figure 5, the MDA content was significantly lower after the Na2SeO3 treatment than in the control group, decreasing by 21.9%, 75.8%, 35.9%, and 20.2%, respectively. This trend demonstrated an overall decrease followed by an increase.

3.6. Effect of Na2SeO3 Treatment on Antioxidant System of Mustard

Na2SeO3 treatment can significantly affect GSH and antioxidant enzyme activities in mustard seedlings. The content of GSH in the 5–20 mg/L Na2SeO3 treatment group was significantly higher than that in the control group, with increases of 13.7%, 35.1% and 5.5%, respectively. However, when the concentration of Na2SeO3 was 40 mg/L, the content of GSH in the treatment group was significantly lower than that in the control group, with a decrease of 11.2% (Figure 6a). Following Na2SeO3 treatment, the SOD activity in mustard seedlings significantly surpassed that of the control group, exhibiting increases of 17.3%, 30.5%, 28.9%, and 26.1%, respectively (Figure 6b). The application of 10–40 mg/L Na2SeO3 significantly increased the POD activity in mustard seedlings by 1.63, 2.01, and 1.67 times, respectively. The POD activity of the 5 mg/L treatment group increased, but the difference was not significant (Figure 6c). The CAT activity of mustard seedlings treated with 5–20 mg/L Na2SeO3 increased significantly by 61.9%, 1.42 times and 2.41 times, respectively. However, the CAT activity of mustard seedlings treated with 40 mg/L Na2SeO3 increased, but not significantly (Figure 6d).

3.7. Analysis of Transcriptome Data of Mustard Treated with Na2SeO3

The processing results of mustard sequencing data with different concentrations of Na2SeO3 are presented in Table S1. After filtration, the Q20 base ratio (i.e., the proportion of bases with a quality score above 20) was between 97–98%, and the Q30 base ratio (i.e., the proportion of bases with a quality score above 30) was between 91–94%. The overall sequencing error rate of the filtered data was less than 0.03% and the proportion of filtered G and C bases was between 44–46%. The Pearson correlation coefficient of the three repeated sample data was above 0.8, and the correlation coefficient of the repeated sample was higher than that of the non-repeated sample. This indicates that the sample has good repeatability, and the sequence result of the green group is considered reliable (Figure S2).
A total of 10 differentially expressed gene (DEGs) comparison groups were established to identify DEGs in mustard treated with different concentrations of Na2SeO3. The screening criteria for DEGs were significance p-value ≤ 0.05 and |log2FoldChange| ≥ 0.0. After treatment with Na2SeO3 at concentrations ranging from 5 to 40 mg/L, the number of upregulated DEGs were 5212, 3979, 7920, and 7133, while the number of downregulated genes were 24,369, 10,779, 5504, and 4036, respectively (Figure S3).

3.8. WGCNA Analysis of Transcriptome Data

To identify the gene co-expression module responsible for organic Se metabolism and Se treatment concentration in mustard, WGCNA was performed on all DEGs. The analysis filtered out low expression genes, leaving 38,502 genes for network construction. The fitting index and average connectivity under different soft thresholds are shown in Figure 7a,b. The weighted coefficient was determined when the fitting index R2 = 0.9, defining β as the value. A value of 10 was used for scale-free network construction.
The co-expression gene clustering results were dynamically cut, resulting in 29 modules after merging similar clusters. The Gray module genes exhibited a chaotic expression pattern that was not taken into consideration in the subsequent co-expression analysis. Consequently, 28 co-expression modules were ultimately determined. Based on the gene module cluster tree (Figure 7c), all co-expression modules were classified into two categories with varying degrees of correlation between them. In the module correlation heat map, blue indicates negative correlation with a correlation coefficient ranging from 0 to 0.5. A value closer to 0 indicates greater negative correlation. On the other hand, red represents positive correlation with a correlation coefficient ranging from 0.5 to 1. A value closer to 1 indicates greater positive correlation (Figure 7d).

3.9. WGCNA Analysis of Transcriptome Data and Different Se Species

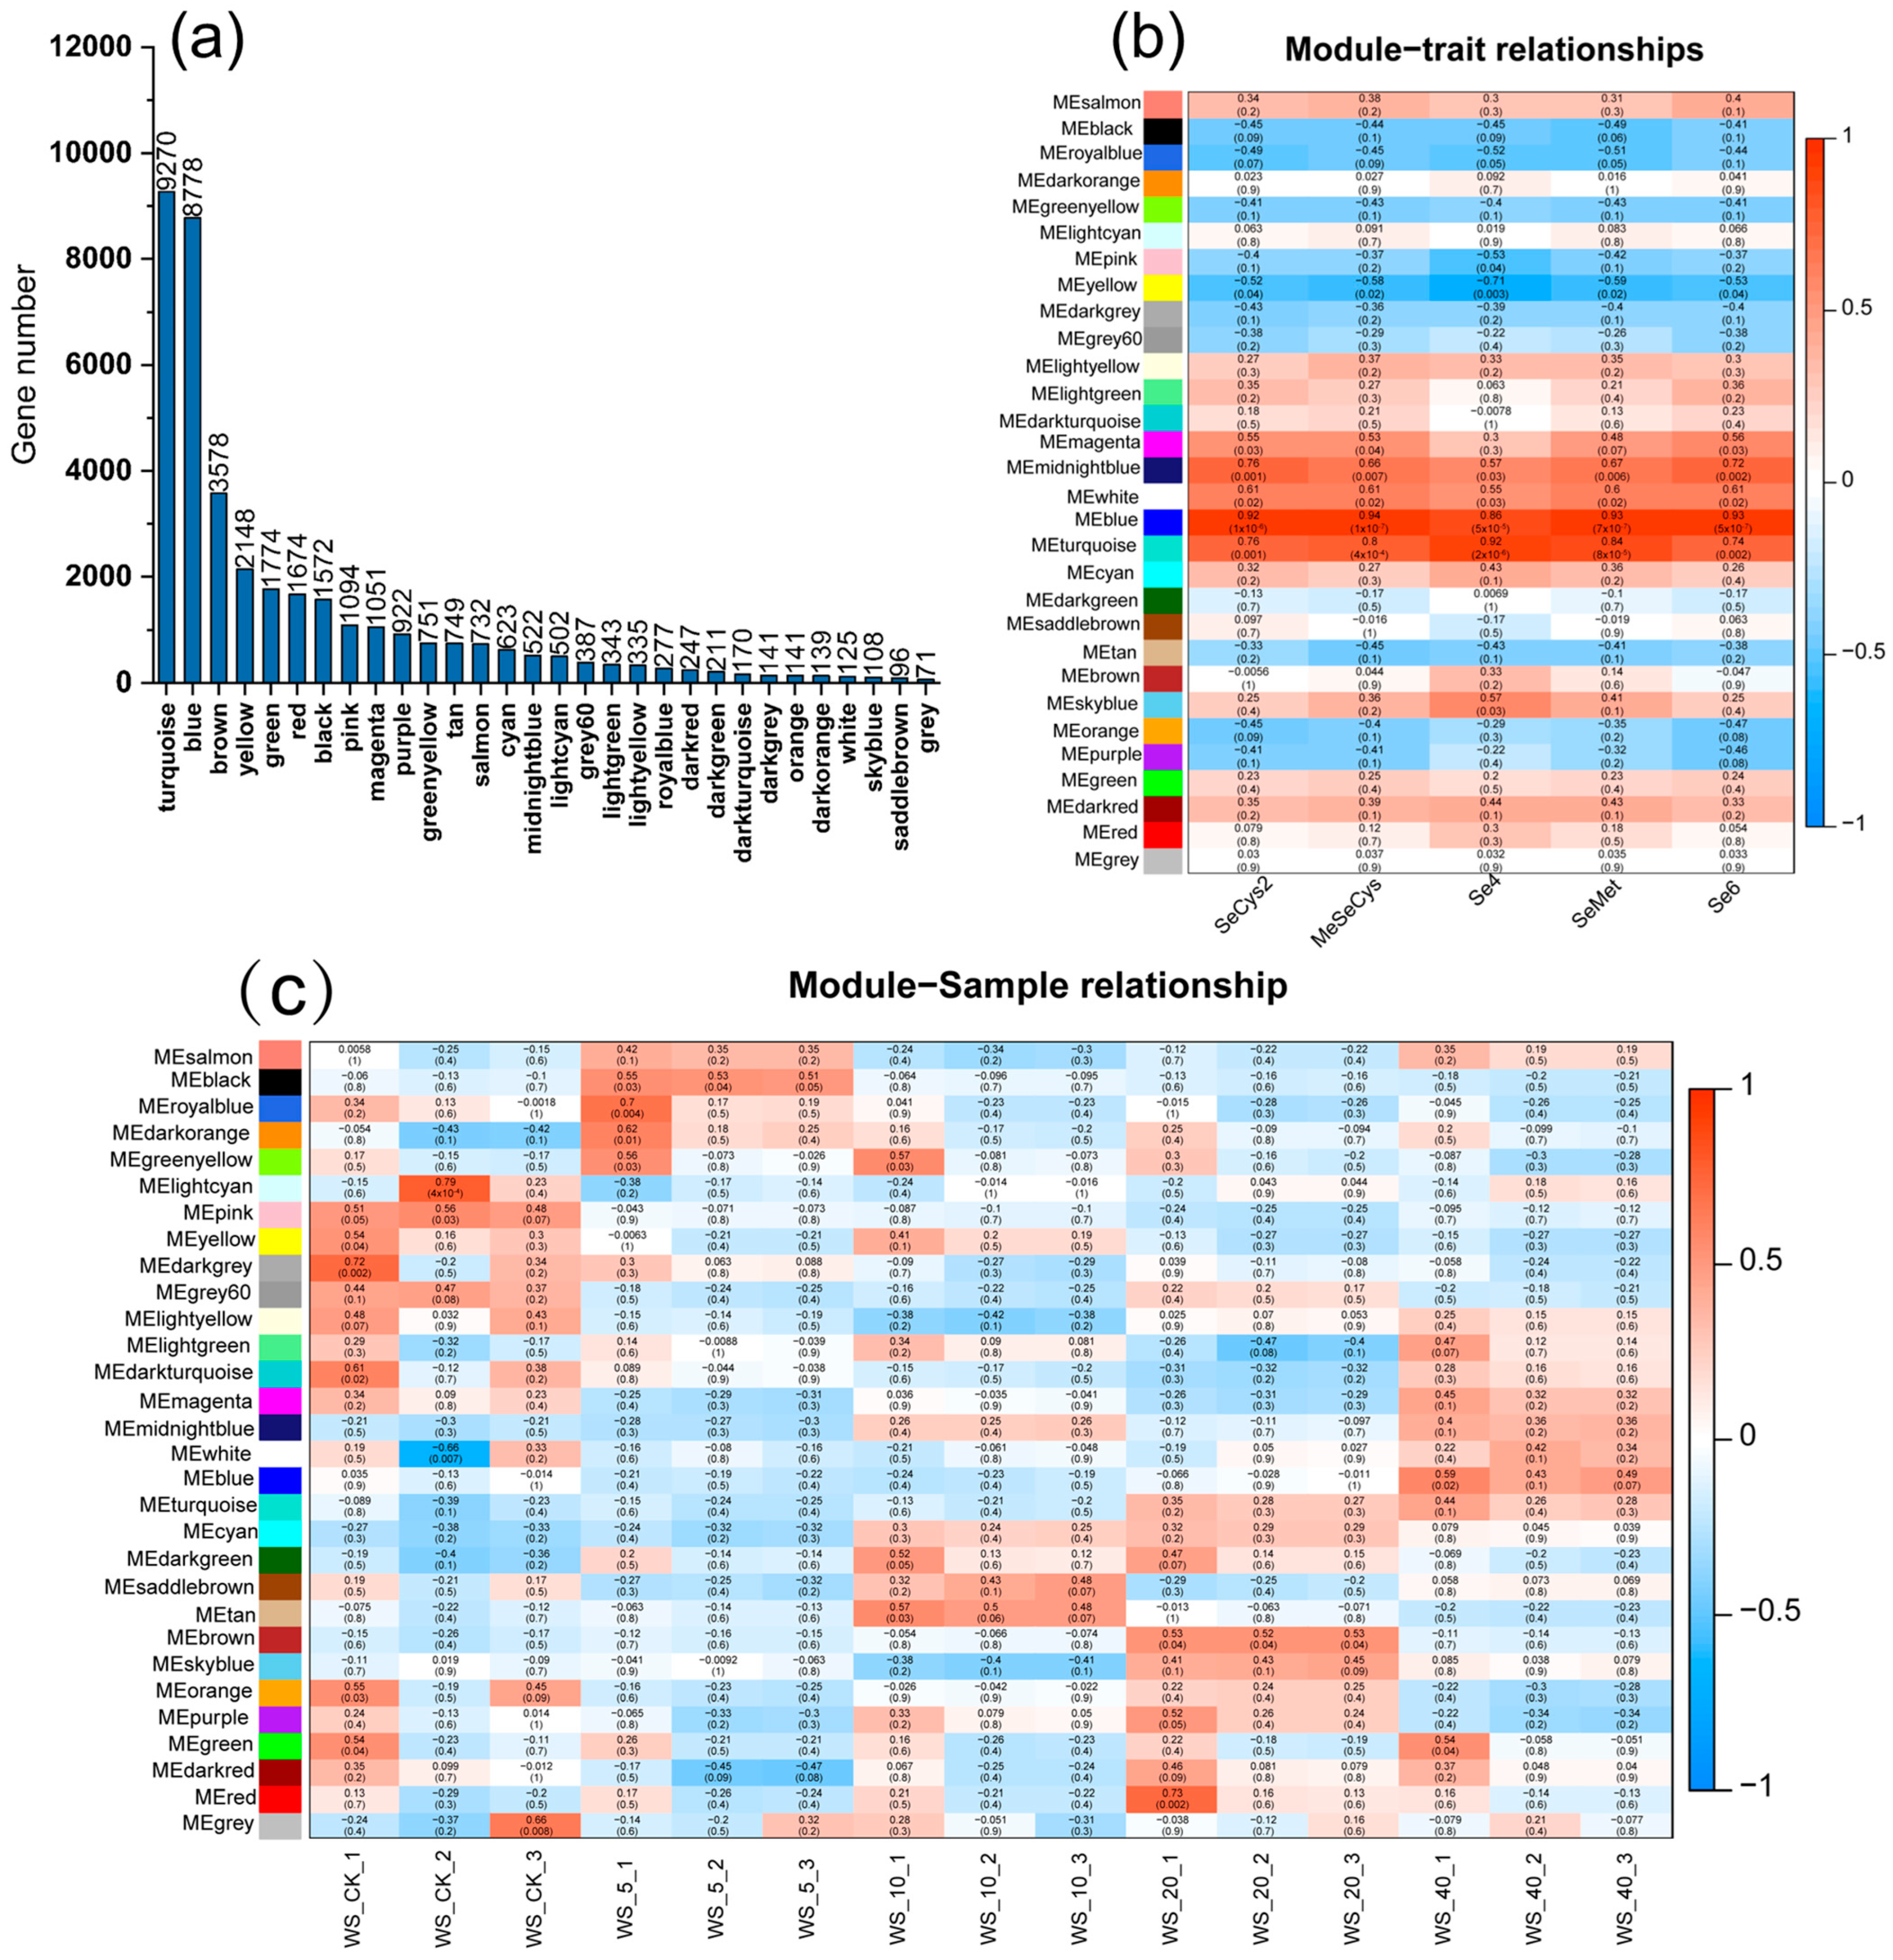
The WGCNA analysis results obtained 28 modules with similar gene expression patterns, each containing 70 to 9269 genes (Figure 8a). Figure 8b showed the correlation analysis between the module characteristic genes and the five forms of Se (SeCys2, MeSeCys, Se (IV), SeMet, and Se (VI)). It can be seen from the figure that the blue and turquoise modules are positively correlated with the Se species content, and the characteristic genes of these two modules are highly correlated with the Se accumulation of mustard. Figure 8c shows the correlation analysis of the module characteristic gene in mustard after being treated with different concentrations of Na2SeO3. The figure shows that the tan module has a high correlation in each treatment sample.
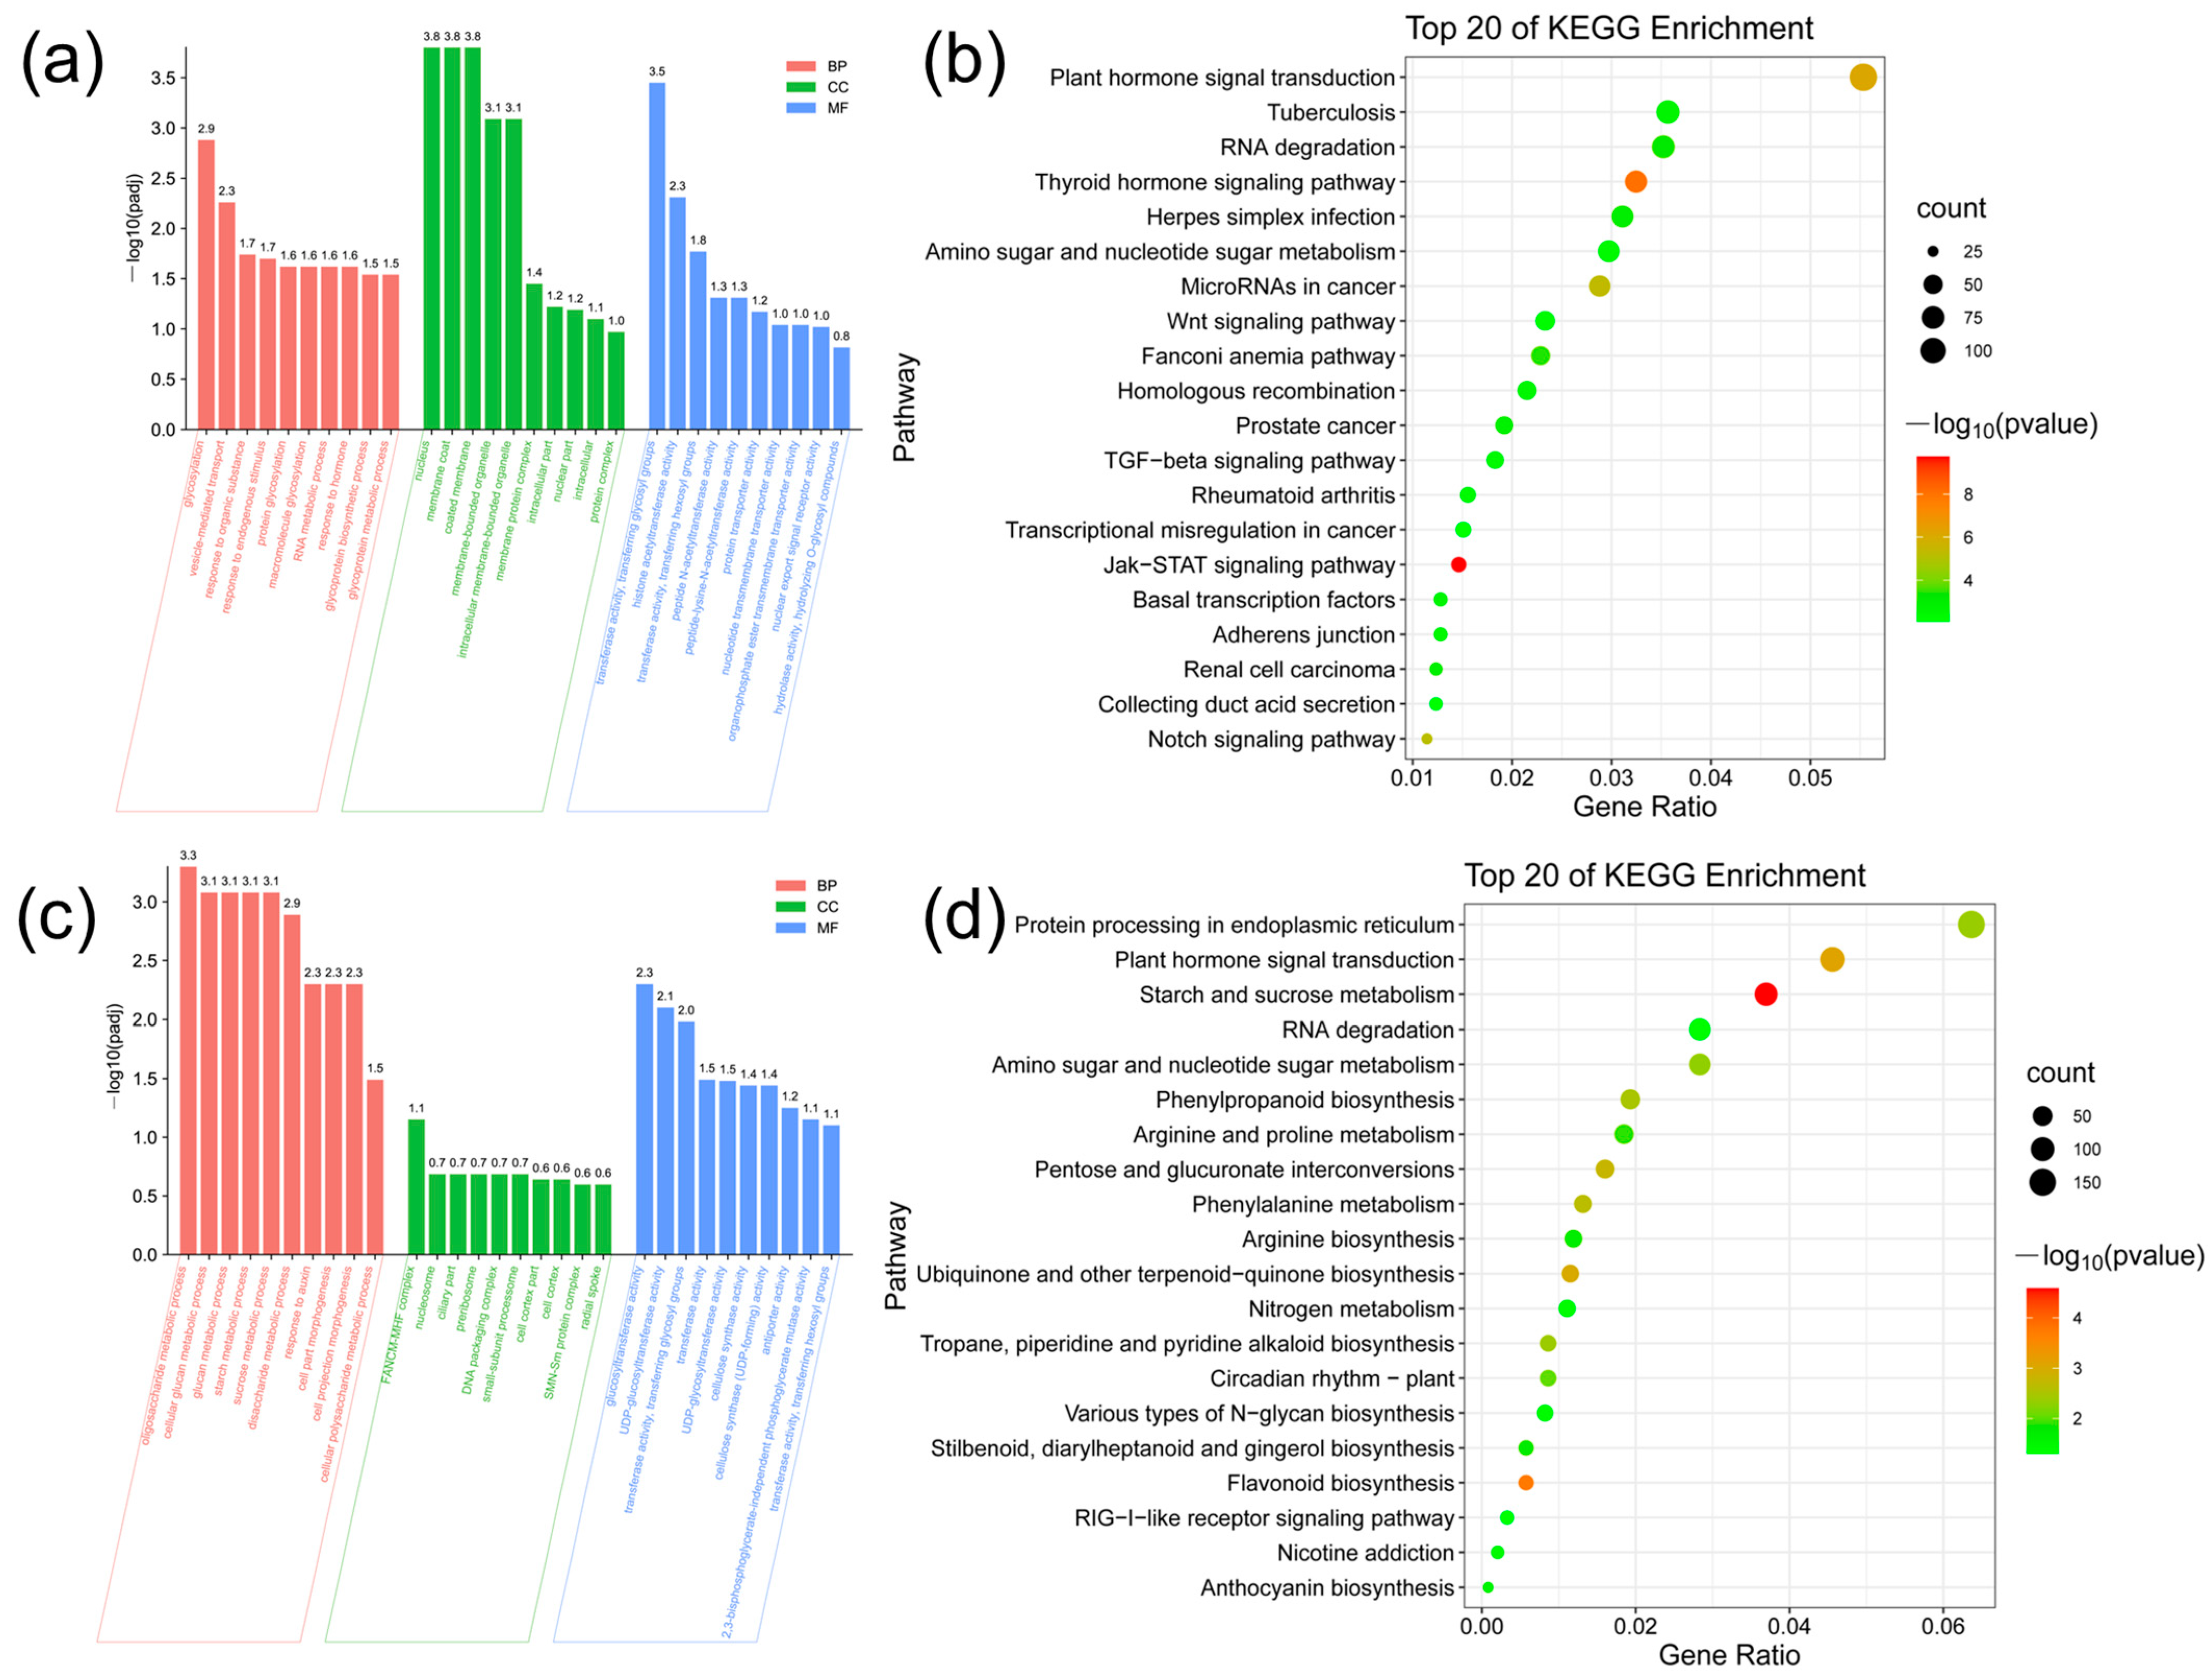
GO and KEGG enrichment analysis was performed on the genes of blue and turquoise, two important modules (Figure 9). Figure 9 shows that the GO entries in the blue module are mainly concentrated in the processes of glycosylation, nucleus, transferase activity, and transferring glycosyl groups in the biological process (BP). Blue module gene KEGG enrichment analysis was mainly concentrated in Jak-STAT signaling pathway, thyroid hormone signaling pathway, plant hormone signal transduction, and other signal pathways (Figure 9b).
The GO entries of turquoise module are mainly concentrated in oligosaccharide metabolic process, FANCM-MHF complex, glucose transfer activity, and other processes (Figure 9c). KEGG enrichment analysis showed that turquoise module genes were mainly enriched in starch and sucrose metabolism, flavonoid biosynthesis, plant hormone signal transduction, and other metabolic pathways (Figure 9d).

3.10. Analysis of Gene Expression Regulation of Key Modules

Figure 10 shows the gene expression patterns in the blue and turquoise modules. The gene expression in the blue module was only higher in the 40 mg/L treatment group, and other treatments were significantly downregulated. In addition to the high expression of turquoise module gene in the 40 mg/L treatment group, the expression of turquoise module gene in the 20 mg/L treatment group was also significantly increased.
Through comparison with NCBI database, multiple genes related to Se metabolism were found in the two modules, such as Sulfate transporters (SULTR3;3 and SULTR4;1), thioredoxin (AAED1, TRXM2, TXNRD2, etc.), glutathione S-transferase (GSTL2, GSTF8, GSTT2, GSTU16, etc.), Se-binding proteins (SBP1 and SBP2), 5′-adenylate sulfate reductase (APR1, APR2, APR3, and APRL5), ATP sulfuridase (APS1), cysteine desulfuridase (NIFS1), etc. Finally, a total of 60 core genes were selected from the two modules, and the key genes were annotated by the NCBI database data (Table S2).
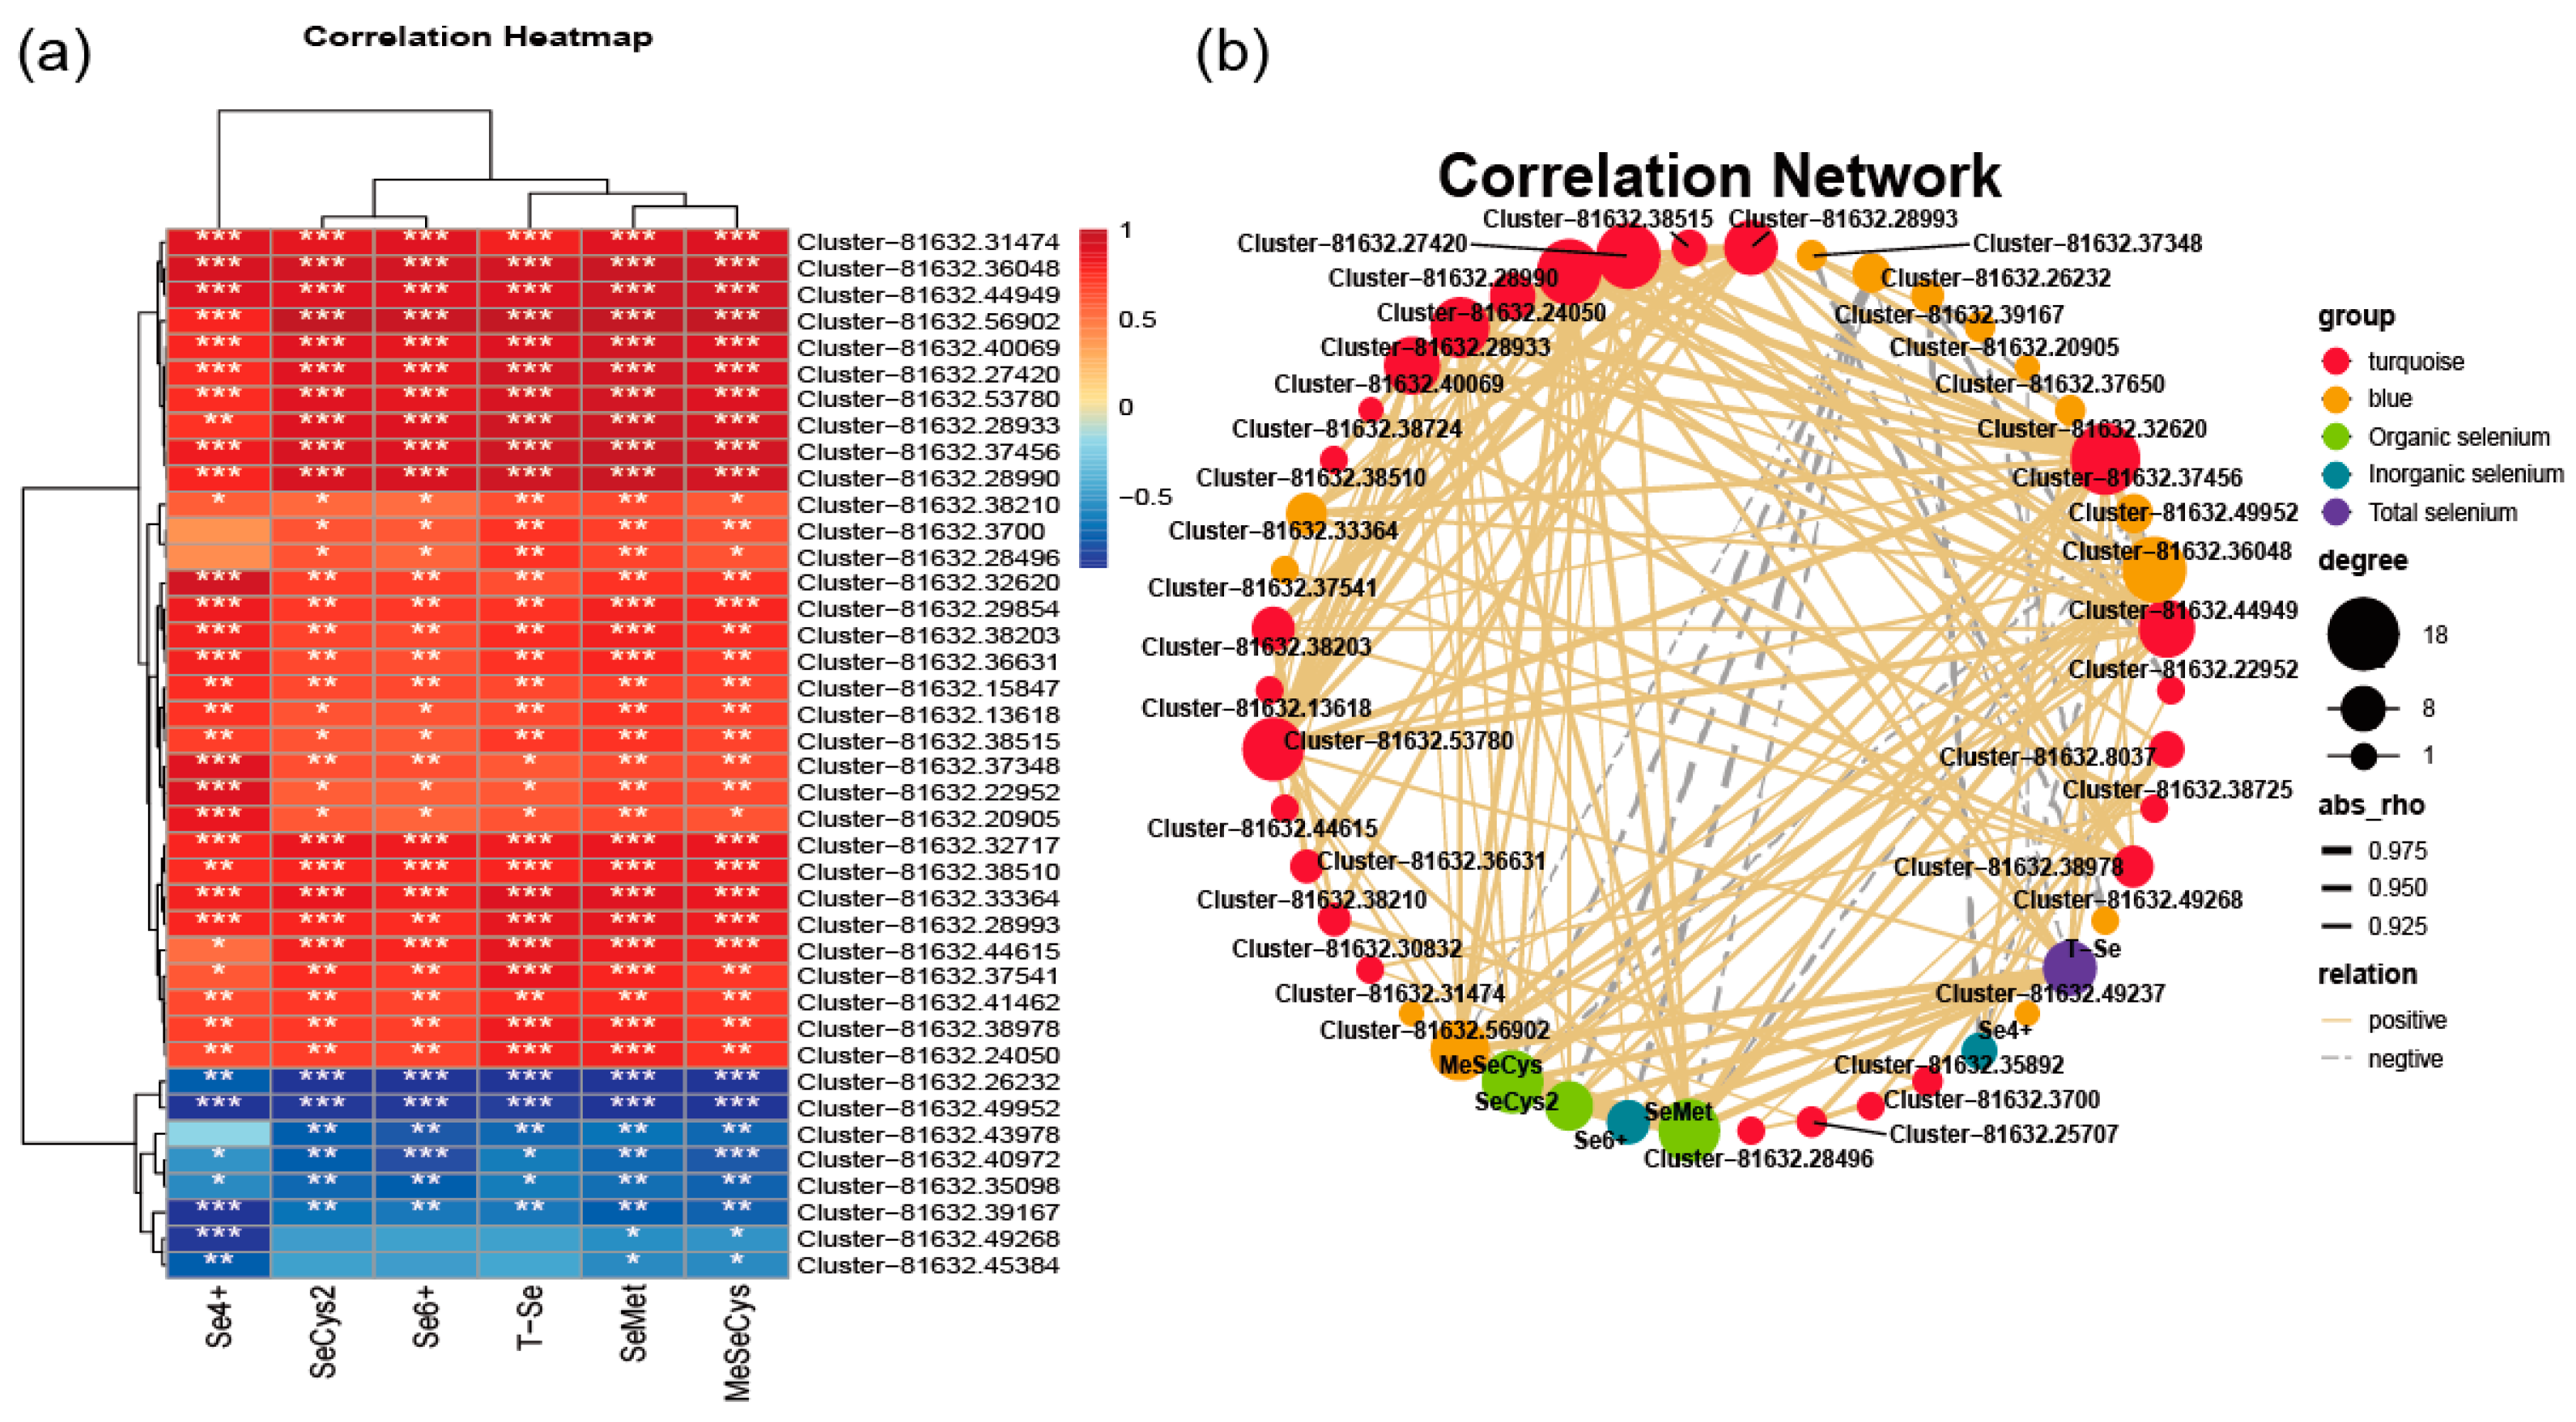
Correlation network analysis was carried out between the screened core genes and total Se and Se species content (Figure 11). Figure 11a shows the correlation heat map of key genes with total Se and Se species content (p < 0.05). Red represents positive correlation, blue represents negative correlation, and * number represents more significant correlation (* represents p < 0.05, ** represents p < 0.01, *** represents p < 0.001). Among them, Cluster-81632.36048 (GSTF8) has the strongest positive correlation with Se content, and Cluster-81632.49952 (TTL3) has the strongest negative correlation with Se content. Figure 11b shows the correlation network of genes with total Se and Se species content (absolute value of connectivity > 0.9), where the solid line represents positive correlation, the dotted line represents negative correlation, the size of the circle represents the number of related objects, and the thickness of the line represents the strength of the correlation. It can be seen from the figure that there is a positive correlation between Se forms and total Se. From the perspective of association objects, Cluster-81632.37456 (APR2) has the most association objects, with 18, followed by Cluster-81632.28990 (APR3), Cluster-81632.27420 (APR1) and Cluster-81632.36048 (GSTF8), with 16 association objects.
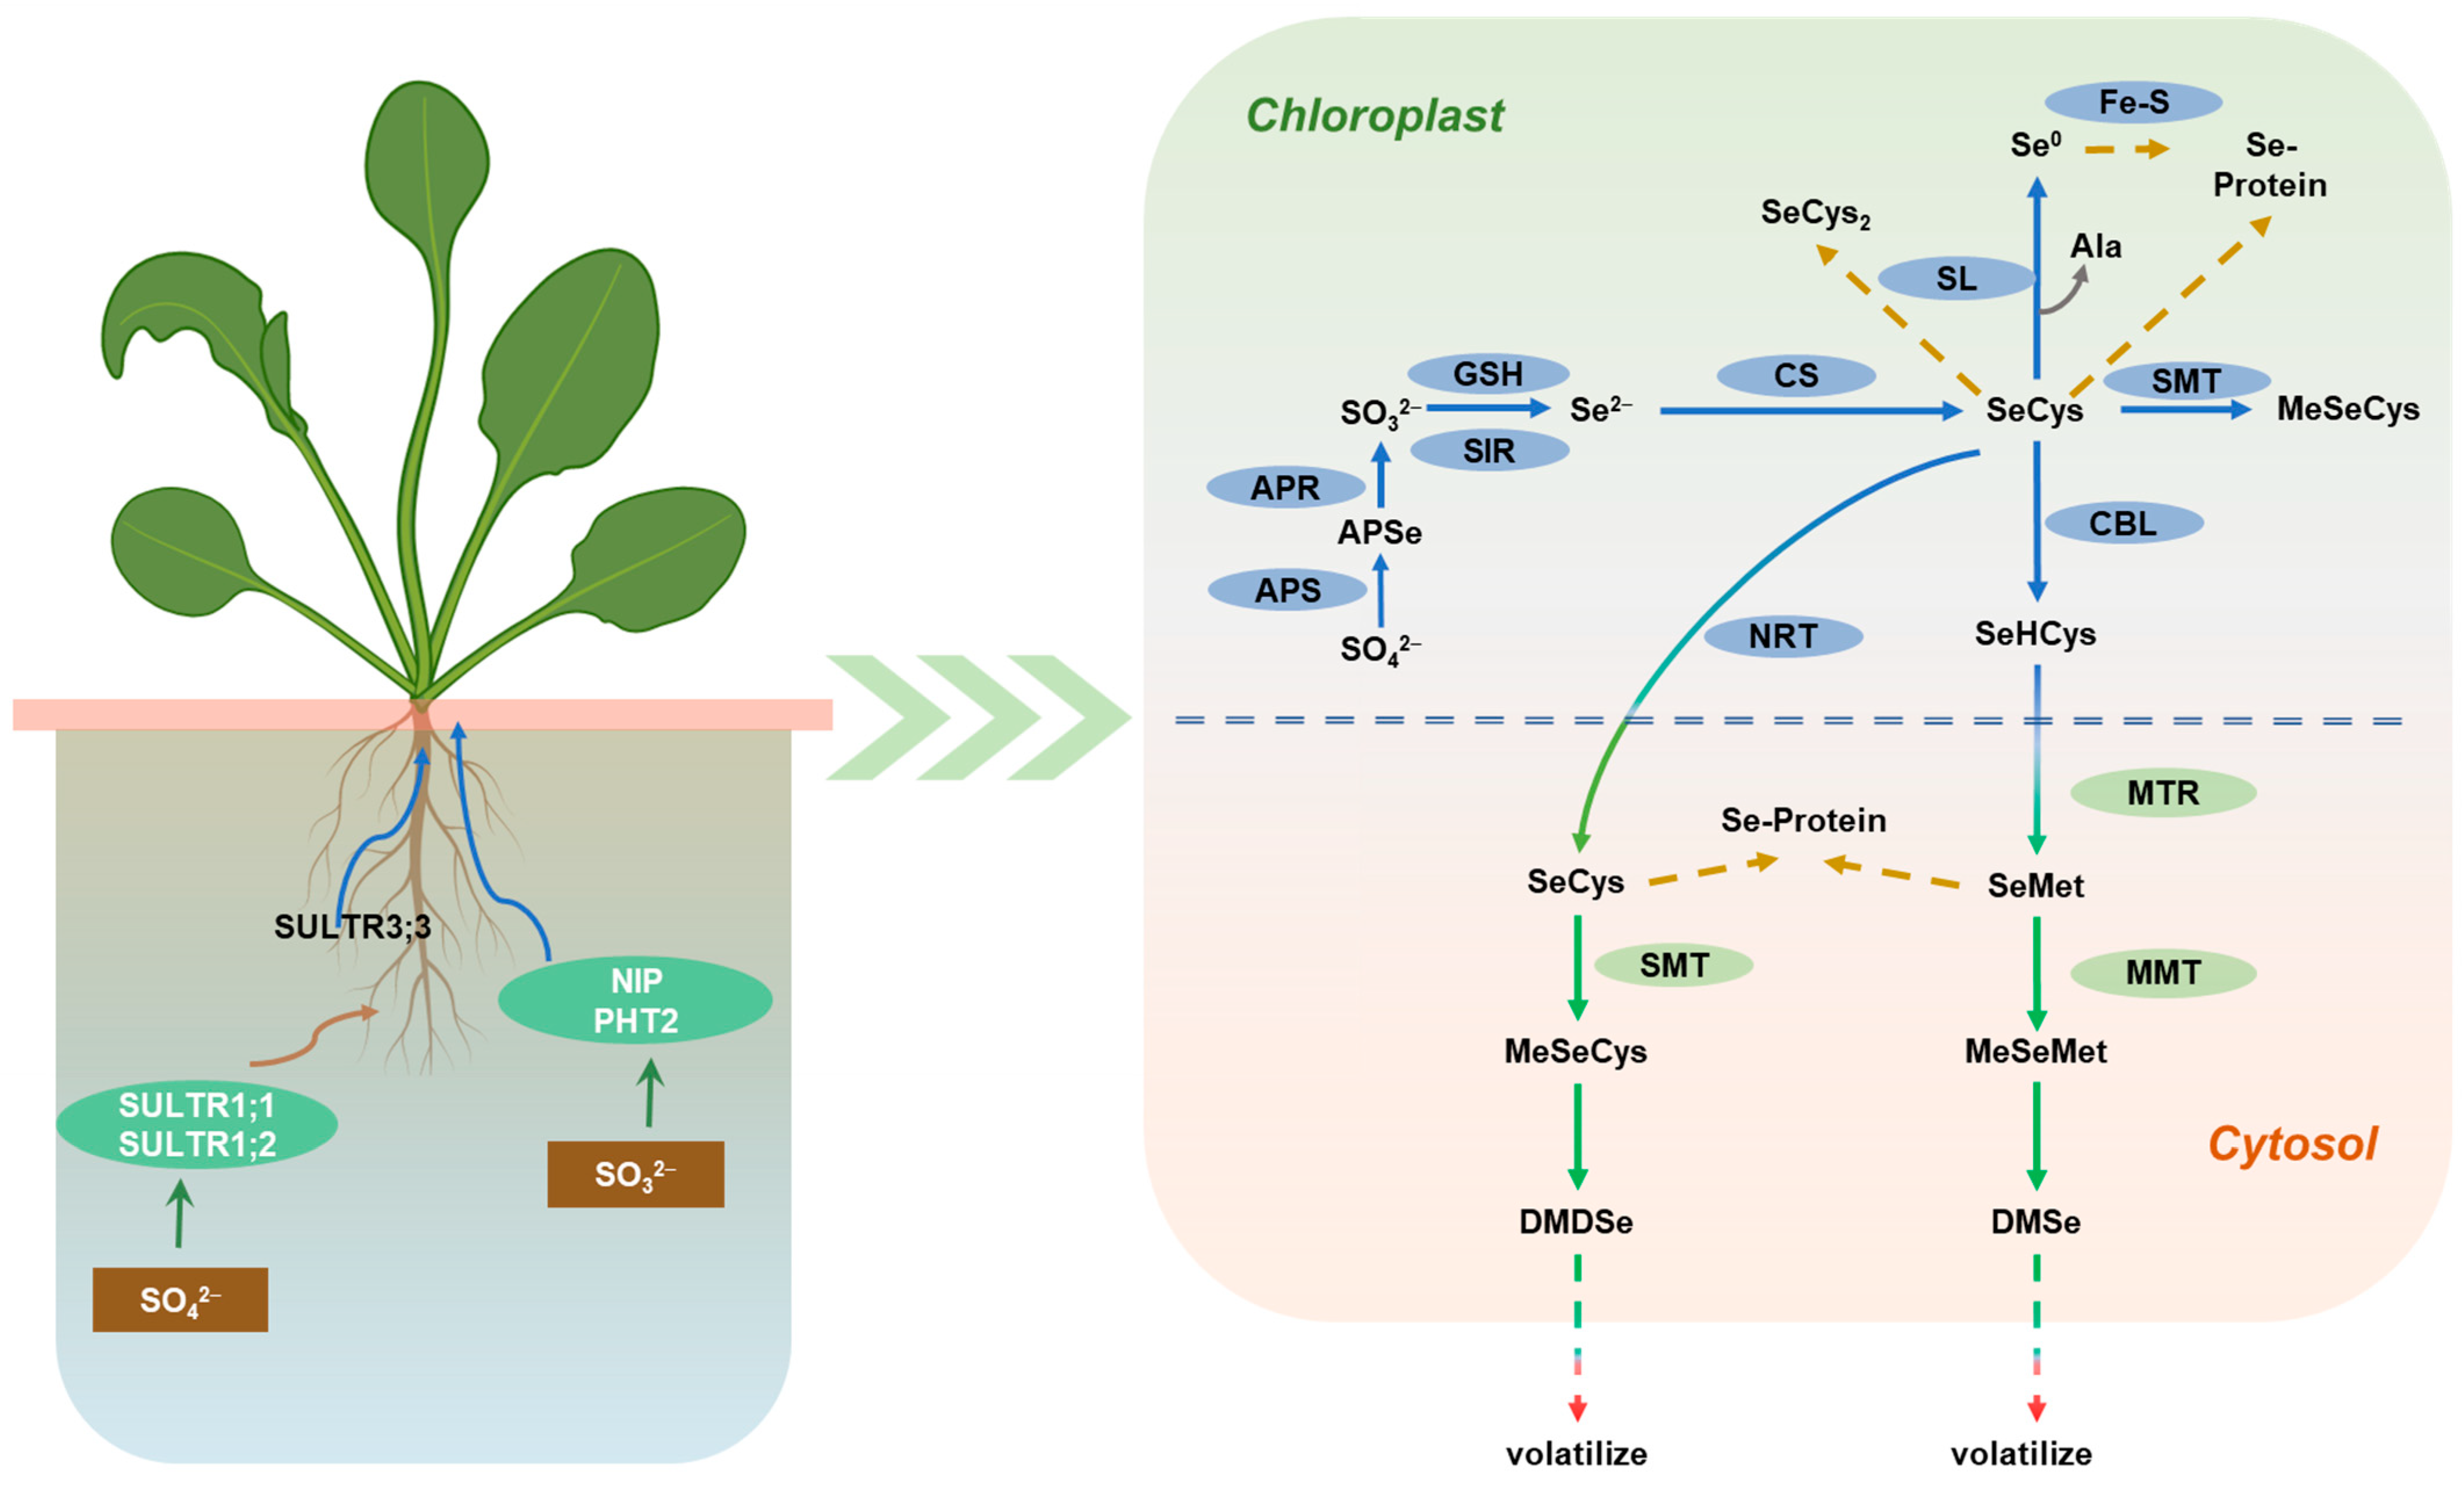
Among the core genes screened from two modules, multiple channel proteins such as SULTR 3;3, SULTR 4;1, PHO1-H8APS, APR, GR, NTRC, GST, and SBP genes related to organic Se transformation were highly expressed under Na2SeO3 treatment. Phosphate transporter PHO1-H8 promotes the absorption of Na2SeO3 in mustard roots, and sulfate transporter SULTR 3;3 and SULTR 4;1 transferring Se absorbed by roots to the aboveground and chloroplasts promotes the synthesis of selenoprotein. The high expression of APS and APR can catalyze key reactions in the plant sulfate assimilation pathway, promoting the synthesis of SeCys and GSH. Glutathione S-transferase (GST) is a key enzyme in the GSH binding reaction. Glutathione reductase GR combined with thioredoxin reductase NTRC catalyzes the reduction in oxidized glutathione GSSG to GSH in plants, and then catalyzes the GSH binding reaction in plants through GST. By activating the high expression of the Se binding protein SBP gene, plants promote the conversion of absorbed Se into SeMet, SeCys, MeSeCys, and other organic Se, which is stored in plant leaves (Figure 12).

4. Discussion

4.1. Effect of Se on the Growth of Mustard

The role of Se in plant growth and yield depends on the concentration. It can promote growth at appropriate Se concentration and inhibit growth at excessive Se concentration [25]. Low-dose selenate and selenite supplements can increase the biomass of aboveground parts [26]. Mateus found that spraying different concentrations of Na2SeO4 and SeNPs on leaves during the growth period of coffee (Coffea arabica) can improve the yield and nutritional quality of coffee while reducing the ROS content in coffee. When the concentration of Na2SeO4 sprayed on leaves is 20 mg/L, the coffee yield increases by 38%. When the concentration of SeNPs sprayed on leaves is 160 mg/L, the coffee yield increases by 42% [27]. In the experiment of soybean (Glycine max), by applying compound fertilizer of ammonium phosphate and Se, the yield of soybean was successfully increased, the grain weight ratio of soybean was significantly increased, and the quality of soybean was improved [28]. In the three growth stages of potato (Solanum tuberosum L.), Na2SeO3 and Na2SeO4 were sprayed to carry out bioaugmentation. It was found that the total Se content in potato increased with the increase in Se concentration on the leaf. The difference is that the total Se content of potato treated with Na2SeO4 is higher than that of potato treated with Na2SeO3 during tuber expansion, while potato treated with Na2SeO3 can accumulate more organic Se (including SeCys2, MeSeCys and SeMet) than that treated with Na2SeO4 during leaf expansion, accounting for 80% and 50% of the total Se content [29]. Wang’s research found that applying Se on the leaf and soil during the wheat growth period could increase the total Se content in wheat grains, and the concentration of Se application was significantly positively correlated with the total Se content in wheat grains [30]. Se can affect the photosynthetic efficiency (Fv/Fm) of chlorophyll in leafy plants, activate the antioxidant system, and improve the photosynthesis of stressed plants [31]. However, 10 mg/L selenate delays tobacco growth, resulting in a decrease in chlorophyll content while increasing the carotenoid chlorophyll ratio [32]. When selenite is slightly excessive, the plant exhibits symptoms of morphological responses: shortened main roots and early increase in lateral roots [33].
Therefore, it is necessary to know the optimal and maximum Se concentrations of different agricultural products at different growth stages in order to obtain safer Se-rich crop cultivation and improve yield. The treatment with 5–40 mg/L Na2SeO3 concentration can improve the plant height of mustard, and the treatment with 10 mg/L Na2SeO3 has the highest improvement. In terms of root length, only 5 mg/L Na2SeO3 concentration can significantly promote the root length of mustard, while other treatments can significantly reduce the root length. When mustard was treated with 5–10 mg/L Na2SeO3, its germination rate increased, while the germination rate decreased when treated with 20–40 mg/L Na2SeO3.

4.2. Effect of Se on Nutritional Quality of Mustard

Vc, soluble sugar, soluble protein, flavonoid content, total phenol content, and anthocyanin content are important nutritional indicators for leafy vegetables. Exogenous Se treatment at wheat seedling stage and seed filling stage can improve the soluble protein content and soluble sugar content in wheat, and increase the nutritional value of wheat [34]. Silva’ study showed that the treatment of cowpea (Vigna unguiculat L.) with Na2SeO3 and Na2SeO4 could increase the content of Vc, chlorophyll and carotenoid in leaves, increase its oxidative stress ability, and increase the concentration of sucrose and total sugar in cowpea [35].
Li’s study showed that both Na2SeO3 and SeNPs treatments can improve the soluble sugar content in cowpea pods. SeNPs treatment increased the cellulose content in cowpea pods, while Na2SeO3 treatment improved the Vc content in cowpea pods [14].
During the early and full flowering stages, when soybean plants were treated with selenite, the fat content in soybean seeds did not significantly change, but the protein content significantly increased [36]. Soaking seeds with 4 mg/L Na2SeO3 can significantly increase the content of soluble protein, soluble sugar, and Vc in cowpea by 38%, 28%, and 47%, respectively, compared to the control group [37]. This study shows that Na2SeO3 treatment can promote the content of main nutrients in mustard. Among them, 5–40 mg/L Na2SeO3 treatment can increase the content of Vc and anthocyanins in leaves; treatment with 5–10 mg/L Na2SeO3 can significantly increase the content of soluble sugar and soluble protein in mustard; treatment with 5–20 mg/L Na2SeO3 significantly increased the content of flavonoids and total phenols in mustard. Low concentration Se treatment increased the photosynthetic pigment content and enhanced photosynthesis in mustard, which may be related to the increase in soluble sugar and soluble protein content.
Organic Se forms (such as Se amino acids) have higher bioavailability than inorganic Se forms (such as selenite and selenate). For example, the human body can absorb more than 90% of Se from selenomethionine, while only about 50% of Se can be absorbed from selenite [1]. The form and content of Se accumulated in plants after Se application vary depending on plant species, genotype, and distribution of tissues and organs. After Na2SeO3 treatment, SeCys2 and SeMet are the main Se compounds in soybean seeds, accounting for about 74%. In addition, they also contain less MeSeCys (9%); inorganic Se and SeCys2 are the main species of Se in legumes, leaves, and roots. In roots and leaves, inorganic Se accounts for more than 90%, and only a small portion of Se is converted into organic Se forms [38]. After treatment with different concentrations of Na2SeO3, the main species of Se found in cowpea pods is SeMet, followed by MeSeCys. The proportions of these two forms of Se in cowpea pods are 63.47% to 74.64% and 15.2% to 36.53%, respectively. As the concentration of exogenous Se increases, the species of Se compounds detected in legumes gradually increase, but mainly organic Se (especially SeMet), and inorganic Se species can only be detected in the high concentration treatment group [14]. In rice, it was also found that when the concentration of nano Se treatment increased from 10 μmol/L to 30 μmol/L, the accumulation of Se in the shoot of seedlings increased from one (SeMet) to two species (SeMet and MeSeCys), with SeMet being the main species [39]. Therefore, the species and content of Se in plant tissues are linked to external Se sources and Se application dosages.
The research on the physiological and biochemical characteristics of mustard shows that Se application can improve the physiological quality of mustard to a certain extent, maintain and improve its antioxidant capacity, and maintain its nutritional quality, making it possible to produce high Se enriched foods from mustard. After applying Se, the total Se content of edible mustard was significantly increased compared to the control group, and the Se form was mainly organic Se, which could be better absorbed and utilized by the human body, further demonstrating the feasibility of Se enriched bioassay in mustard.

4.3. Effects of Se on the Antioxidant System of Mustard

Selenium can regulate the activity of antioxidant enzymes, and the main mechanisms include preventing plant peroxidation, restoring the integrity and function of cell membranes, modifying the activity of antioxidant enzymes, as well as repairing and rebuilding chloroplasts [40,41]. Mateus found that spraying Se fertilizer at an appropriate concentration on the leaves during coffee growth can enhance the oxidative stress capacity of coffee. When spraying Se fertilizer at a concentration of 20–80 mg/L on the leaves, the activities of SOD, APX, POD, GR, and GSH in coffee are significantly increased, stimulating oxidative metabolism in coffee, and significantly reducing the ROS content in coffee [27]. Dai found that applying Na2SeO3 at the heading stage of rice can increase the level of oxidative stress in rice, and treatment with a concentration of 2.5–20 mg/kg can significantly increase SOD activity and reduce MDA content in leaves. The concentration of 0.5–20 mg/kg can significantly increase the GSH content and POD activity in rice, and the GPX activity is significantly increased at the concentration of 0.5, 2.5–20 mg/kg [42]. Both Na2SeO3 and Na2SeO4 treatments can increase the oxidative stress capacity of cowpea and reduce the concentration of ROS, but their action pathways are different. Na2SeO3 can enhance CAT activity and enhance antioxidant capacity in cowpea, while Na2SeO4 mainly reduces ROS content in cowpea by stimulating the production of APX and GR [35]. It should be noted that, 3.0 mmol/L Na2SeO3 has a toxic impact on cowpea plants, resulting in a high number of irregular necrotic patches and chlorosis between leaf veins scattered along the leaf edges. It is speculated that the formation of reactive oxygen species (ROS) in cowpea mesophyll cells caused by high concentration of Na2SeO3 leaf spray treatment may be responsible for the destruction of cell membrane structure and the decrease in chlorophyll concentration [15].
In the present study, different concentrations of Na2SeO3 treatment can reduce the MDA content in mustard, but overall, it first decreased and then increased, with the lowest MDA content in the 10 mg/L treatment. It is speculated that low concentrations of Se can promote plant growth, reduce oxidative damage, and reduce MDA content, while high concentrations of Se can exceed the tolerance range of plants and cause damage to plants, resulting in an increase in MDA. Each concentration treatment can improve the antioxidant enzyme activity of mustard, with a general trend of increasing first and then decreasing. When the treatment concentration was 10 mg/L, mustard had the highest SOD activity and GSH content, while at 20 mg/L, mustard had the highest POD and CAT activities.

4.4. Molecular Mechanism of Organic Se Transformation in Mustard

Plants absorb and transfer inorganic Se (selenite, selenate, and nano Se) and organic Se (such as Se amino acids) through different mechanisms [43]. It is well known that selenate and selenite are absorbed through high affinity sulfate transporters (SULTR1;1 and SULTR1;2), phosphates transporters (PHT1;1, PHT1;2, PHT1;3 and PHT1;4), and silicon transporters (LSI1/NIP2;1), respectively, while SeMet is transported through NRT 1.1B [44]. Rao screened multiple genes highly related to Se metabolism using a combination of transcriptome, metabolome, and proteome analysis in Cardamine hirsuta L. Studies have found that sulfate transporters SULTR1;1, SULTR1;2, and SULTR2;1 were highly expressed in the roots of C. hirsuta, where SULTR1;1 and SULTR1;2 were the main channel proteins for roots to absorb selenate from the soil. SULTR2;1 mainly undertakes the task of transporting Se from the roots to the leaves, and then metabolizes Se in the leaves to SeCys through the synergy of multiple enzymes such as APS, APR1, and ARP3. In addition, it was also found that Se binding protein 1 (SBP1) and sulfur deficiency inducible protein 2 (SDI2) were significantly upregulated after selenate treatment, which is also the main reason for Se tolerance in C. hirsute [45].
Yang explored the effects of Se at different concentrations (0, 0.1, 0.2, 0.4, 0.8, and 1.6 mmol/L) on the growth and nutritional quality of cabbage (Brassica oleracea var. capitata L.) using a combined transcriptome and metabolomic analysis method. Studies have found that multiple genes, such as SULTR2;2, SULTR3;1, HMT, MMT, APS, APK2, and NTR2, play an important role in the absorption and transformation of Se in cabbage. SUR1, UGT74B1, ST5b, and CYP83A1, CYP79A2, and CYP79F1 in the cytochrome P450 family may be key genes in the biosynthesis and regulatory pathway of glucosinolates. The accumulation of flavonoids and phenolic acids under selenate treatment is related to the expression of PAL, 4CL, CHS3, CAD, FLS, and CYP73A5 genes [46]. Ren et al. treated Camellia sinensis with selenite and selenate for 48 h and analyzed the mechanism of Se absorption and transformation in C. sinensis through a combination of transcriptomics and proteomics analysis. The study found that the phosphate transporter (PHT3;1a, PHT1;3b, and PHT1;8) and aquaporin (NIP2;1) genes in the selenite treated group were significantly upregulated, promoting the absorption of Se by the roots of C. oleifera. In the selenate treatment group, the expression of sulfate transporters (SULTR1;1 and SULTR2;1) significantly increased, and the expression also increased with the increase in culture time [47].
In the present study, multiple channel proteins, including SULTR3;3, SULTR4;1, and PHO1-H8 relate to Se absorption and transport in mustard. Phosphate transporter PHO1-H8 promotes the absorption of Na2SeO3 by mustard roots. Sulfate transporters SULTR 3;1 and SULTR 4;1 facilitate Se transport from roots to the aboveground and chloroplasts, and under the action of multiple genes, such as APS, APR, and SEP1, convert the absorbed Se into SeMet, SeCys, MeSeCys, and other organic Se for storage in plant leaves.

5. Conclusions

Na2SeO3 has important effects on the growth, nutrient composition, and Se absorption and transformation in mustard. Low concentration Na2SeO3 treatment (5–10 mg/L) increased the plant height, root length, germination rate, biomass, and photosynthetic pigment content in mustard, promoting plant growth. High concentration Na2SeO3 (20–40 mg/L) treatment inhibited the growth of mustard. Based on the above factors, 10 mg/L Na2SeO3 treatment was the best concentration for Se application. After treatment with 5–20 mg/L Na2SeO3, the soluble sugar, soluble protein, flavonoid content, and total phenol content of mustard significantly increased. The content of Vc and anthocyanins in each treatment group increased compared to the control group. Five Se species, SeCys2, MeSeCys, Se (IV), SeMet, and Se (VI), can be detected in different concentrations of Na2SeO3 treatment groups, with organic Se content accounting for more than 95%. Na2SeO3 treatment can significantly decrease the accumulation of ROS in mustard plants and enhance their stress resistance. Transcriptome and metabolite data association analysis showed that PHO1-H8 promoted the absorption of Na2SeO3 in mustard roots, while SULTR3;3 and SULTR4;1 facilitated the transport of Se from roots to the aboveground and chloroplasts. Se absorbed by mustard was transformed into SeMet, SeCys, MeSeCys, and selenoprotein by the action of multiple genes, in such as APS, APR, and SEP1, and stored in plant leaves. The appropriate biofortification of Se in vegetable crops not only increases the organic Se content of crops, but also promotes yield and improves nutritional quality to some extent. The main form of Se is SeMet, which is more easily utilized and safer. Therefore, it is an important way for dietary Se supplementation.

Supplementary Materials

The following supporting information can be downloaded at: https://www.mdpi.com/article/10.3390/agronomy13051425/s1, Figure S1: Changes in water content of mustard treated with different concentrations of sodium selenite; Figure S2: Heat map of correlation of gene expression level in test samples; Figure S3: Statistics of DEGs in samples treated with different concentrations of Na2SeO3; Table S1: Transcriptome data statistics of different treatment groups; Table S2: Annotated information of 60 DEGs screened from two modules.

Author Contributions

Conceptualization and writing—original draft preparation, H.C.; methodology, software, S.W. (Shuai Wu); methodology, S.W. (Shiyan Wang); formal analysis, X.S.; validation, writing—review and editing, L.L.; project administration, supervision and project administration, S.C. All authors have read and agreed to the published version of the manuscript.

Funding

This research was funded by the Special Project of the Central Government for Local Science and Technology Development of Hubei Province (CN), Hubei Provincial Department of Science and Technology (No. 2019ABA113). The research was also supported by the Horizontal science and technology of Enshi Se-De Bioengineer-ing Co., Ltd., grant number se1-202102.

Data Availability Statement

Data will be made available upon request.

Conflicts of Interest

The authors declare no conflict of interest.

References

  1. D’Amato, R.; Regni, L.; Falcinelli, B.; Mattioli, S.; Benincasa, P.; Dal Bosco, A.; Pacheco, P.; Proietti, P.; Troni, E.; Santi, C. Current knowledge on selenium biofortification to improve the nutraceutical profile of food: A comprehensive review. J. Agric. Food Chem. 2020, 68, 4075–4097. [Google Scholar] [CrossRef]
  2. Feng, R.; Wei, C.; Tu, S. The roles of selenium in protecting plants against abiotic stresses. Environ. Exp. Bot. 2013, 87, 58–68. [Google Scholar] [CrossRef]
  3. Rayman, M.P. Food-chain selenium and human health: Emphasis on intake. Br. J. Nutr. 2008, 100, 254–268. [Google Scholar] [CrossRef] [PubMed]
  4. Ulrich, S.; Noelia, F.V. Why 21? The significance of selenoproteins for human health revealed by inborn errors of metabolism. FASEB J. 2016, 30, 3669–3681. [Google Scholar]
  5. Krinsky, N.I.; Beecher, G.R.; Burk, R.F.; Chan, A.C.; Erdman, J.J.; Jacob, R.A.; Jialal, I.; Kolonel, L.N.; Marshall, J.R.; Taylor Mayne, P.R. Dietary reference intakes for vitamin C, vitamin E, selenium, and carotenoids. Inst. Med. 2000, 19, 95–185. [Google Scholar]
  6. Kipp, A.P.; Strohm, D.; Brigelius-Flohé, R.; Schomburg, L.; Bechthold, A.E.; Leschik-Bonnet, E.; Heseker, H.; German Nutrition, S. Revised reference values for selenium intake. J. Trace Elem. Med. Biol. 2015, 32, 195–199. [Google Scholar] [CrossRef]
  7. Silva, V.M.; Boleta, E.H.M.; Lanza, M.G.D.B.; Lavres, J.; Martins, J.T.; Santos, E.F.; dos Santos, F.L.M.; Putti, F.F.; Junior, E.F.; White, P.J.; et al. Physiological, biochemical, and ultrastructural characterization of selenium toxicity in cowpea plants. Environ. Exp. Bot. 2018, 150, 172–182. [Google Scholar] [CrossRef]
  8. Schiavon, M.; Pilon-Smits, E.A.H. The fascinating facets of plant selenium accumulation–biochemistry, physiology, evolution and ecology. New Phytol. 2017, 213, 1582–1596. [Google Scholar] [CrossRef]
  9. Gong, R.; Ai, C.; Zhang, B.; Cheng, X. Effect of selenite on organic selenium speciation and selenium bioaccessibility in rice grains of two Se-enriched rice cultivars. Food Chem. 2018, 264, 443–448. [Google Scholar] [CrossRef]
  10. Nothstein, A.K.; Eiche, E.; Riemann, M.; Nick, P.; Winkel, L.H.E.; Göttlicher, J.; Steininger, R.; Brendel, R.; Von Brasch, M.; Konrad, G. Tracking se assimilation and speciation through the rice plant–nutrient competition, toxicity and distribution. PLoS ONE 2016, 11, e0152081. [Google Scholar] [CrossRef]
  11. Danso, O.P.; Asante-Badu, B.; Zhang, Z.; Song, J.; Wang, Z.; Yin, X.; Zhu, R. Selenium biofortification: Strategies, progress and challenges. Agriculture 2023, 13, 416. [Google Scholar] [CrossRef]
  12. Reis, A.R.D.; El-Ramady, H.; Santos, E.F.; Gratão, P.L.; Schomburg, L. Overview of selenium deficiency and toxicity worldwide: Affected areas, selenium-related health issues, and case studies. In Selenium in Plants; Springer: Berlin/Heidelberg, Germany, 2017; pp. 209–230. [Google Scholar]
  13. Hamilton, S.J. Review of selenium toxicity in the aquatic food chain. Sci. Total Environ. 2004, 326, 1–31. [Google Scholar] [CrossRef] [PubMed]
  14. Li, L.; Xiong, Y.; Wang, Y.; Wu, S.; Xiao, C.; Wang, S.; Cheng, S.; Cheng, H. Effect of nano-selenium on nutritional quality of cowpea and response of ABCC transporter family. Molecules 2023, 28, 1398. [Google Scholar] [CrossRef] [PubMed]
  15. Lanza, M.G.D.B.; Silva, V.M.; Montanha, G.S.; Lavres, J.; de Carvalho, H.W.P.; Dos Reis, A.R. Assessment of selenium spatial distribution using μ-XFR in cowpea (Vigna unguiculata (L.) Walp.) plants: Integration of physiological and biochemical responses. Ecotoxicol. Environ. Saf. 2021, 207, 111216. [Google Scholar] [CrossRef]
  16. Ahmad, P.; Abd Allah, E.F.; Hashem, A.; Sarwat, M.; Gucel, S. Exogenous application of selenium mitigates cadmium toxicity in Brassica juncea L. (Czern & Cross) by up-regulating antioxidative system and secondary metabolites. J. Plant Growth Regul. 2016, 35, 936–950. [Google Scholar]
  17. Dixon, G.R. Origins and diversity of Brassica and its relatives. In Vegetable Brassicas and Related Crucifers; CABI: Wallingford, UK, 2006; pp. 1–33. [Google Scholar]
  18. Kang, L.; Qian, L.; Zheng, M.; Chen, L.; Chen, H.; Yang, L.; You, L.; Yang, B.; Yan, M.; Gu, Y. Genomic insights into the origin, domestication and diversification of Brassica juncea. Nat. Genet. 2021, 53, 1392–1402. [Google Scholar] [CrossRef]
  19. Lim, H.-S.; Yoo, E.-J.; Choi, M.-R. Changes of physiological activity of mustard leaf during its fermentation period. J. Microbiol. Biotechnol. 2000, 10, 43–47. [Google Scholar]
  20. Campbell, B.; Han, D.; Triggs, C.M.; Fraser, A.G.; Ferguson, L.R. Brassicaceae: Nutrient analysis and investigation of tolerability in people with Crohn’s disease in a New Zealand study. Funct. Foods Health Dis. 2012, 2, 460–486. [Google Scholar] [CrossRef]
  21. Bañuelos, G.; Leduc, D.L.; Pilon-Smits, E.A.H.; Terry, N. Transgenic Indian mustard overexpressing selenocysteine lyase or selenocysteine methyltransferase exhibit enhanced potential for selenium phytoremediation under field conditions. Environ. Sci. Technol. 2007, 41, 599–605. [Google Scholar] [CrossRef]
  22. LeDuc, D.L.; AbdelSamie, M.; Móntes-Bayon, M.; Wu, C.P.; Reisinger, S.J.; Terry, N. Overexpressing both ATP sulfurylase and selenocysteine methyltransferase enhances selenium phytoremediation traits in Indian mustard. Environ. Pollut. 2006, 144, 70–76. [Google Scholar] [CrossRef]
  23. Hou, F. Experiments in Plant Physiology; Science Press: Beijing, China, 2022; pp. 23–28. [Google Scholar]
  24. Pertea, M.; Pertea, G.M.; Antonescu, C.M.; Chang, T.C.; Mendell, J.T.; Salzberg, S.L. StringTie enables improved reconstruction of a transcriptome from RNA-seq reads. Nat. Biotechnol. 2015, 33, 290–295. [Google Scholar] [CrossRef]
  25. Hossain, A.; Skalicky, M.; Brestic, M.; Maitra, S.; Sarkar, S.; Ahmad, Z.; Vemuri, H.; Garai, S.; Mondal, M.; Bhatt, R.; et al. Selenium biofortification: Roles, mechanisms, responses and prospects. Molecules 2021, 26, 881. [Google Scholar] [CrossRef] [PubMed]
  26. Boldrin, P.F.; de Figueiredo, M.A.; Yang, Y.; Luo, H.; Giri, S.; Hart, J.J.; Faquin, V.; Guilherme, L.R.; Thannhauser, T.W.; Li, L. Selenium promotes sulfur accumulation and plant growth in wheat (Triticum aestivum). Physiol. Plant. 2016, 158, 80–91. [Google Scholar] [CrossRef] [PubMed]
  27. de Brito Mateus, M.P.; Tavanti, R.F.R.; Tavanti, T.R.; Santos, E.F.; Jalal, A.; Dos Reis, A.R. Selenium biofortification enhances ROS scavenge system increasing yield of coffee plants. Ecotoxicol. Environ. Saf. 2021, 209, 111772. [Google Scholar] [CrossRef] [PubMed]
  28. Silva, M.A.; de Sousa, G.F.; Corguinha, A.P.B.; de Lima Lessa, J.H.; Dinali, G.S.; Oliveira, C.; Lopes, G.; Amaral, D.; Brown, P.; Guilherme, L.R.G. Selenium biofortification of soybean genotypes in a tropical soil via Se-enriched phosphate fertilizers. Front. Plant Sci. 2022, 13, 988140. [Google Scholar] [CrossRef]
  29. Zhang, H.; Zhao, Z.; Zhang, X.; Zhang, W.; Huang, L.; Zhang, Z.; Yuan, L.; Liu, X. Effects of foliar application of selenate and selenite at different growth stages on Selenium accumulation and speciation in potato (Solanum tuberosum L.). Food Chem. 2019, 286, 550–556. [Google Scholar] [CrossRef]
  30. Wang, M.; Li, B.; Li, S.; Song, Z.; Kong, F.; Zhang, X. Selenium in wheat from farming to food. J. Agric. Food Chem. 2021, 69, 15458–15467. [Google Scholar] [CrossRef]
  31. Taha, R.S.; Seleiman, M.F.; Shami, A.; Alhammad, B.A.; Mahdi, A.H.A. Integrated application of selenium and silicon enhances growth and anatomical structure, antioxidant defense system and yield of wheat grown in salt-stressed. Soil 2021, 10, 1040. [Google Scholar] [CrossRef]
  32. Zsiros, O.; Nagy, V.; Párducz, Á.; Nagy, G.; Ünnep, R.; El-Ramady, H.; Prokisch, J.; Lisztes-Szabó, Z.; Fári, M.; Csajbók, J.; et al. Effects of selenate and red Se-nanoparticles on the photosynthetic apparatus of Nicotiana tabacum. Photosynth. Res. 2019, 139, 449–460. [Google Scholar] [CrossRef]
  33. Lehotai, N.; Kolbert, Z.; Pető, A.; Feigl, G.; Ördög, A.; Kumar, D.; Tari, I.; Erdei, L. Selenite-induced hormonal and signalling mechanisms during root growth of Arabidopsis thaliana L. J. Exp. Bot. 2012, 63, 5677–5687. [Google Scholar] [CrossRef]
  34. Hu, T.; Li, H.; Li, J.; Zhao, G.; Wu, W.; Liu, L.; Wang, Q.; Guo, Y. Absorption and bio-transformation of selenium nanoparticles by wheat seedlings (Triticum aestivum L.). Front. Plant Sci. 2018, 9, 597. [Google Scholar] [CrossRef] [PubMed]
  35. Silva, V.M.; Tavanti, R.F.R.; Gratão, P.L.; Alcock, T.D.; Dos Reis, A.R. Selenate and selenite affect photosynthetic pigments and ROS scavenging through distinct mechanisms in cowpea (Vigna unguiculata (L.) walp) plants. Ecotoxicol. Environ. Saf. 2020, 201, 110777. [Google Scholar] [CrossRef] [PubMed]
  36. Ye, J.; Shan, W.; Zhu, G. Effect of foliar application selenium on the yield and quality of soybean. Xinjiang Agric. Sci. 2009, 46, 4. [Google Scholar]
  37. Liu, G.; Li, P.; Li, Y.; Ren, X.; Wang, J. Effects of sodium selenite treatment on quality and active oxygen of cowpea. J. Gansu Agric. Univ. 2020, 55, 8. [Google Scholar]
  38. Chan, Q.; Afton, S.E.; Caruso, J.A. Selenium speciation profiles in selenite-enriched soybean (Glycine Max) by HPLC-ICPMS and ESI-ITMS. Metallomics 2010, 2, 147–153. [Google Scholar] [CrossRef]
  39. Li, Y.; Zhu, N.; Liang, X.; Zheng, L.; Zhang, C.; Li, Y.-F.; Zhang, Z.; Gao, Y.; Zhao, J. A comparative study on the accumulation, translocation and transformation of selenite, selenate, and SeNPs in a hydroponic-plant system. Ecotoxicol. Environ. Saf. 2020, 189, 109955. [Google Scholar] [CrossRef]
  40. Rady, M.M.; Desoky, E.-S.M.; Ahmed, S.M.; Majrashi, A.; Ali, E.F.; Arnaout, S.M.A.I.; Selem, E. Foliar nourishment with nano-selenium dioxide promotes physiology, biochemistry, antioxidant defenses, and salt tolerance in phaseolus vulgaris. Plants 2021, 10, 1189. [Google Scholar] [CrossRef]
  41. Ashraf, M.A.; Akbar, A.; Parveen, A.; Rasheed, R.; Hussain, I.; Iqbal, M. Phenological application of selenium differentially improves growth, oxidative defense and ion homeostasis in maize under salinity stress. Plant Physiol. Biochem. 2018, 123, 268–280. [Google Scholar] [CrossRef]
  42. Dai, Z.; Imtiaz, M.; Rizwan, M.; Yuan, Y.; Huang, H.; Tu, S. Dynamics of selenium uptake, speciation, and antioxidant response in rice at different panicle initiation stages. Sci. Total Environ. 2019, 691, 827–834. [Google Scholar] [CrossRef]
  43. Wang, M.; Peng, Q.; Zhou, F.; Yang, W.; Dinh, Q.T.; Liang, D. Uptake kinetics and interaction of selenium species in tomato (Solanum lycopersicum L.) seedlings. Environ. Sci. Pollut. Res. 2019, 26, 9730–9738. [Google Scholar] [CrossRef]
  44. Trippe III, R.C.; Pilon-Smits, E.A. Selenium transport and metabolism in plants: Phytoremediation and biofortification implications. J. Hazard. Mater. 2021, 404, 124178. [Google Scholar] [CrossRef] [PubMed]
  45. Rao, S.; Yu, T.; Cong, X.; Lai, X.; Xiang, J.; Cao, J.; Liao, X.; Gou, Y.; Chao, W.; Xue, H. Transcriptome, proteome, and metabolome reveal the mechanism of tolerance to selenate toxicity in Cardamine violifolia. J. Hazard. Mater. 2021, 406, 124283. [Google Scholar] [CrossRef] [PubMed]
  46. Yang, X.; Liao, X.; Yu, L.; Rao, S.; Chen, Q.; Zhu, Z.; Cong, X.; Zhang, W.; Ye, J.; Cheng, S. Combined metabolome and transcriptome analysis reveal the mechanism of selenate influence on the growth and quality of cabbage (Brassica oleracea var. capitata L.). Food Res. Int. 2022, 156, 111135. [Google Scholar] [CrossRef] [PubMed]
  47. Ren, H.; Li, X.; Guo, L.; Wang, L.; Hao, X.; Zeng, J. Integrative transcriptome and proteome analysis reveals the absorption and metabolism of selenium in tea plants [Camellia sinensis (L.) Kuntze]. Front. Plant Sci. 2022, 13, 848349. [Google Scholar] [CrossRef] [PubMed]
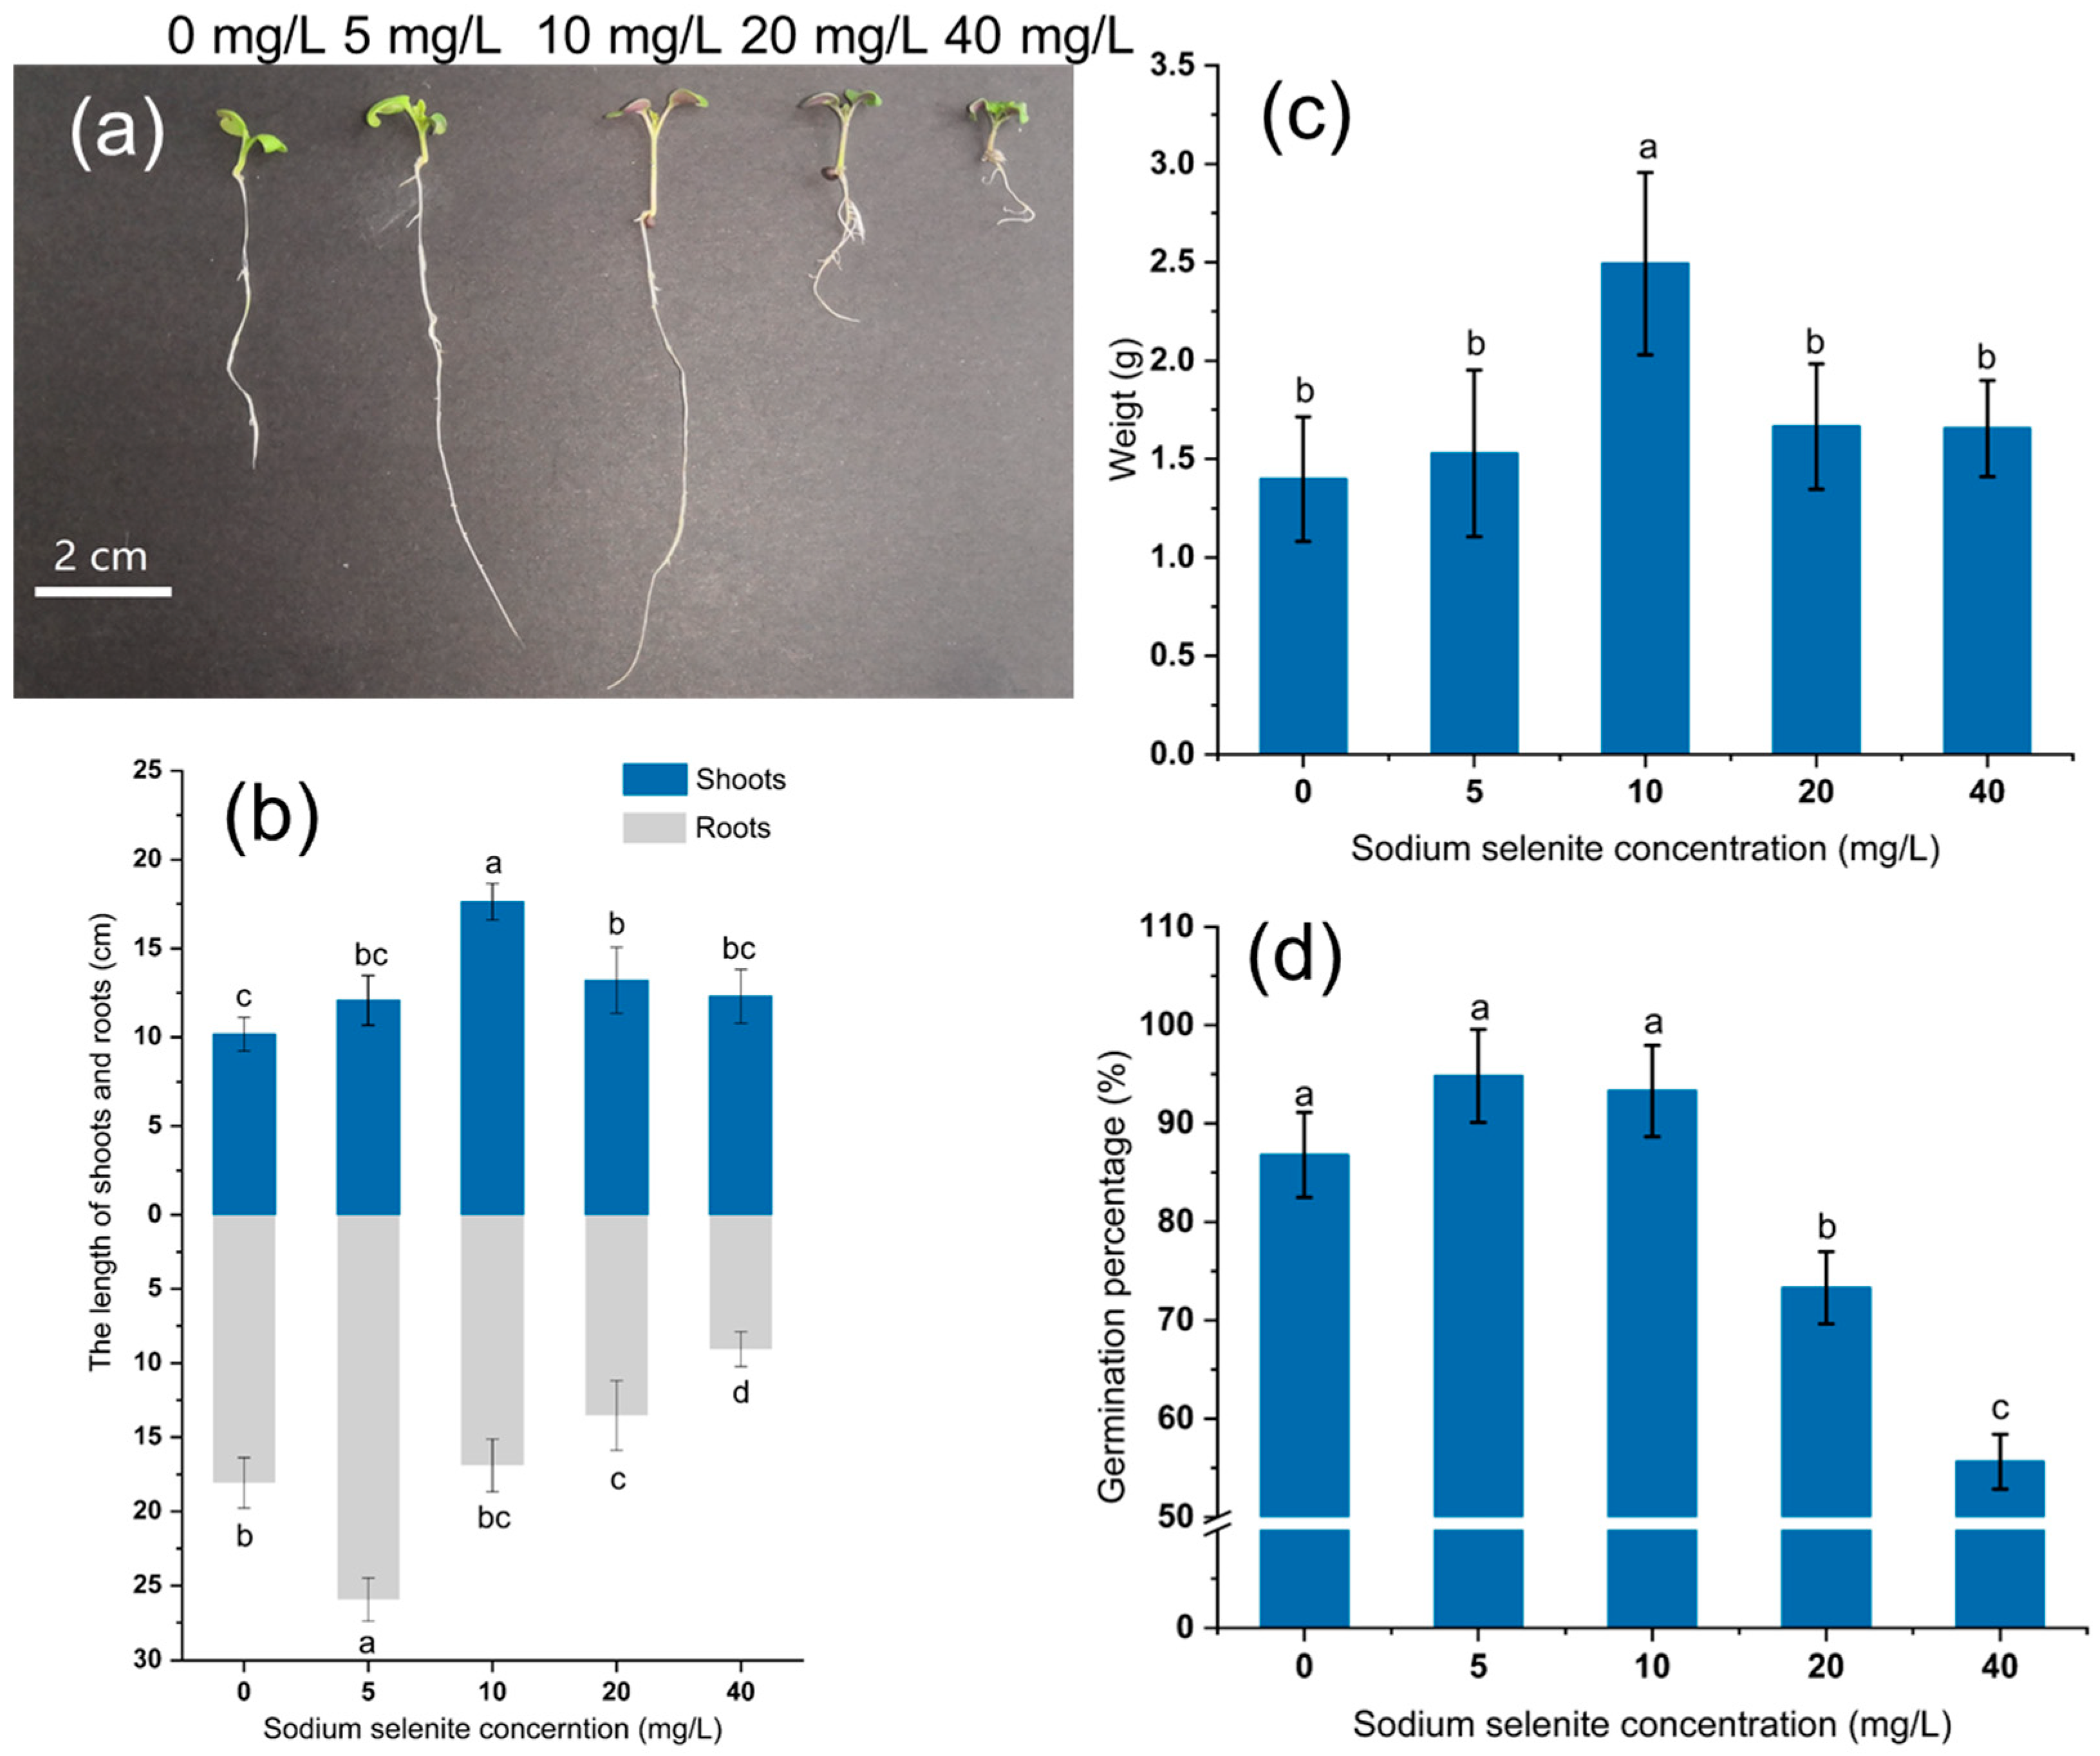
Figure 1. Effects of different concentrations of Na2SeO3 on plant height, root length and biomass of mustard. (a) Growth status of mustard under different concentrations of Na2SeO3 treatment. (b) Length of shoots and roots. (c) Fresh weight of whole plant. (d) Germination rate of seedlings. CK represents the control group sample. The error bar represents the standard error of the mean (n = 3), and different letters represent the difference level between the mean values of Duncan’s new complex range test (p < 0.05).
Agronomy 13 01425 g001
Figure 2. The effect of different concentrations of Na2SeO3 on the content of photosynthetic pigments and carotenoids in mustard leaves. (a) Chlorophyll a content. (b) Chlorophyll b content. (c) Carotenoid content. (d) Total chlorophyll content. The error bar represents the standard error of the mean (n = 3), and different letters represent the difference level between the mean values of Duncan’s new complex range test (p < 0.05).
Agronomy 13 01425 g002
Figure 3. Effects of different Na2SeO3 treatments on the contents of total Se and organic Se in mustard seedlings. (a) Total Se content in mustard seedlings. (b) Content of different Se forms in mustard seedlings. The error bar represents the standard error of the mean (n = 3), and different letters represent the difference level between the mean values of Duncan’s new complex range test (p < 0.05).
Agronomy 13 01425 g003
Figure 4. The effects of various concentrations of Na2SeO3 on the nutritional quality of mustard seedlings. (a) Vc contents. (b) Soluble sugar content. (c) Soluble protein content. (d) Total flavonoids content. (e) Content of total phenolic substances. (f) Anthocyanin content. The error bar represents the standard error of the mean (n = 3), and different letters represent the difference level between the mean values of Duncan’s new complex range test (p < 0.05).
Agronomy 13 01425 g004
Figure 5. The effects of various concentrations of Na2SeO3 on MDA content of mustard seedlings. The standard error of the mean is represented by the error bar (n = 3), and different letters represent the difference level between the mean values of Duncan’s new complex range test (p < 0.05).
Agronomy 13 01425 g005
Figure 6. The effects of various concentrations of Na2SeO3 on the activity of antioxidant enzymes in mustard seedlings. (a) GSH activity. (b) SOD activity. (c) POD activity. (d) CAT activity. The error bar represents the standard error of the average number of samples (n = 3), and different letters represent the difference level between the average values of Duncan’s new complex range test (p < 0.05).
Agronomy 13 01425 g006
Figure 7. WGCNA and module-trait correlation analysis. (a) The fitting index (R2) of the scale-free network under various soft thresholds, where the red line corresponds to R2 = 0.9. (b) The average connectivity under different soft thresholds. (c) The WGCNA is constructed using the dynamic tree cutting method, wherein different modules are distinguished by being marked with various colors. (d) Heatmap showing the correlation between different modules constructed through WGCNA.
Agronomy 13 01425 g007
Figure 8. WGCNA analysis of the correlation between Se species and expression modules of transcriptome in various treatment groups. (a) Distribution and quantity of DEGs in different modules. (b) The correlation between modules and traits. (c) Direct correlation coefficient between different processed samples and expression modules. The left side uses different color blocks to represent different modules.
Agronomy 13 01425 g008
Figure 9. Enrichment analysis results of hot genes in blue and turquoise modules. In the heat map, red indicates upregulated genes, brown indicates neutral genes, and green indicates downregulated genes. The bar plots illustrate the eigengene values, which are determined using the first principal component of the singular value composition. (a) The figure shows the GO enrichment results of blue module. (b) KEGG results of DEGs in the blue module. (c) GO enrichment of turquoise module. (d) KEGG enrichment of DEGs in the turquoise module.
Agronomy 13 01425 g009
Figure 10. The expression of genes related to Se distribution in B. juncea seedlings is shown in the blue and turquoise modules. In the figure, upregulated genes are represented by red lines, neutral genes by black, and downregulated genes by green. (a) The gene expression pattern in the blue module corresponds to Se species and contents. (b) The expression pattern of genes refers to Se species and contents in the turquoise module.
Agronomy 13 01425 g010
Figure 11. The relationship between Se species and gene transcription patterns in the blue and turquoise modules are depicted through a correlation heatmap and network analysis. (a) The heat map shows the correlation coefficient between different Se species and module characteristic genes. The white asterisk represents a significant analysis of correlation, where * represents <0.5, ** represents <0.1, and *** represents <0.05. (b) Additionally, a regulatory network has been created to illustrate how hot genes are regulated by different Se species in B. juncea seedlings.
Agronomy 13 01425 g011
Figure 12. Mechanism of absorption, transformation and transport of Na2SeO3 in hydroponic mustard. PHT2: Pi transporter 2; NIP: Nodulin 26-like intrinsic aquaporin proteins; Sultr 1:1: sulfate transporter 1:1; Sultr 1:2: sulfate transporter 1:2; Sultr 3:3: sulfate transporter 3:3; APS: adenosine triphosphate sulfurylase; APR: adenosine 5′-phosphosulfate reductase; SIR: sulfite reductase; CS: Cysteine synthase; SL: Cysteine lyase; SMT: selenocysteine methyltransferase; CBL: cystathionine β-lyase; NRT: Nitrate transporters; MMT: Methionine methyltransferase; MTR: Methionine Synthase; GSH: glutathione; SeCys: Selenocysteine; MeSeCys: Methyl selenocysteine; MeSeMet: Methyl selenomethionine; DMSe: Dimethylselenium; DMDSe: Dimethyldiselenide.
Agronomy 13 01425 g012
Table 1. The content and proportion of Se forms in mustard seedling after Na2SeO3 treatment.
Na2SeO3 Concentration (mg/L)Content of Different Se Forms (mg/kg DW)
SeCys2MeSeCysSe4+SeMetSe6+
0NDND0.0038 ± 0.0001 d0.0160 ± 0.0003 dND
50.0109 ± 0.0009 d0.0188 ± 0.0007 b0.0016 ± 0.0002 c0.0422 ± 0.0012 d0.0124 ± 0.0003 c
100.0328 ± 0.0013 c0.0091 ± 0.0008 c0.0014 ± 0.0008 cd0.1198 ± 0.0027 c0.0177 ± 0.0011 c
200.0592 ± 0.0011 b0.1887 ± 0.0028 b0.0037 ± 0.0002 b0.7126 ± 0.0087 b0.0418 ± 0.0019 b
400.2227 ± 0.0026 a0.6469 ± 0.0095 a0.0054 ± 0.0002 a1.8165 ± 0.0475 a0.1854 ± 0.0046 a
Note: The lowercase letters a–d indicates the significance analysis of the content of different Se species in mustard after treatment with different concentrations of Na2SeO3, with a p-value < 0.05. The percentage in the table is the proportion of each Se species to the total Se content. ‘ND’ indicates that the Se species content was not detected in the sample.
Disclaimer/Publisher’s Note: The statements, opinions and data contained in all publications are solely those of the individual author(s) and contributor(s) and not of MDPI and/or the editor(s). MDPI and/or the editor(s) disclaim responsibility for any injury to people or property resulting from any ideas, methods, instructions or products referred to in the content.