Abstract
Low soil fertility and low microbiological activity have been widely observed in certain newly cultivated lands. To develop effective agricultural management practices that can improve soil quality rapidly, a field experiment was conducted on paddy fields reclaimed from unused, low-slope, hilly wasteland in Quzhou City, Zhejiang Province, Southeast China. The six treatments that were applied included (1) control (CK), no crops were planted and no fertilizers were applied; (2) R, rice planted without fertilization; (3) RR, rice–ryegrass rotation without fertilizer application; (4) RRM, rice–ryegrass rotation with the application of mineral fertilizer; (5) RRMO, rice–ryegrass rotation with the application of mineral fertilizer and organic manure; and (6) RRMH, rice–ryegrass rotation with mineral fertilizer and humic acid application. The results showed that the application of fertilizer with ryegrass cropping improved the amounts of soil organic C (SOC) by 115–296% and particulate organic C (POC) by 162–256% (p < 0.05). Additionally, the RRMO treatment had the highest soil quality index value (0.81), which was significantly higher (p < 0.05) than that of the other treatments. The random forest model showed that N-related properties (including urease activity, total N, and particulate organic N), C-related properties (including SOC, POC, and cellulase activity), and available P could significantly (p < 0.05) explain the response of rice yield to different fertilization management strategies. Compared with CK, the cultivated land quality grades of RRMO and RRMH increased from Grade 9 to Grade 7. However, the RRMH obtained the highest net profit from farmland quota trading. Overall, RRMO and RRMH are suggested to rapidly improve soil productivity and maximize the economic benefit of newly cultivated land utilization, respectively.
1. Introduction
With increasing rapid urbanization, the area of cultivated land has decreased gradually in China []. To ensure that food production meets the needs of the growing population, high-quality, arable land is needed for agricultural production. Thus, the Chinese government has implemented the requisition–compensation balance of farmland (RCBF) policy [], which involves developing and utilizing abandoned and reclaimed lands and improving the virgin soil through agricultural practices such as fertilization or tillage [,]. According to this policy, the stakeholders occupying farmlands for non-agricultural development must provide compensation equivalent to the quantity and quality of the requisitioned farmland []. However, the RCBF policy has triggered a series of unexpected problems during its implementation, such as “an insufficient amount of compensated farmland” and “superior occupation and inferior compensation”, which may lead to a decline in farmland quality and productivity []. Hence, rapidly improving soil quality in the short term has already become a major concern of the RCBF.
The soil quality of newly cultivated lands does not completely meet the demands for a high crop yield, mainly owing to the relatively smaller amounts of soil organic matter (SOM) []. The common method to improve soil fertility is the application of organic materials, such as straw, animal manure, or bio-based materials [,,]. However, the positive effects of organic amendments on soil fertility are affected by the quality and dose of organic materials. Doan et al. used a 3-year mesocosm experiment and found that the application of vermicompost had higher soil organic C (SOC), available P (AP), and cation exchangeable capacity levels than that with buffalo manure treatment []. An alternative method to improve soil fertility is through cover crop practices, which can provide numerous environmental benefits and improve soil quality [,]. Li et al. found that 15 consecutive years of mineral fertilizer and green manure application resulted in 8% higher annual rice grain yield and 57.7% higher total C input than in the NPK-alone treatment []. Ryegrass as a green manure can increase SOC and the utilization of residual plant N, P, and K []. Additionally, the rice–ryegrass rotation system has been widely used in South China, which increases rice yield and positively affects microbial community composition and function [,]. Although the practice of using cover crops is an appropriate choice, it is not clear how its combined effect with different fertilization measures affects soil quality in the short term.
Soil quality is complex, and its assessment requires the integration of several soil properties []. Previous studies have used the soil quality index (SQI) to assess the effects of different practices on soil sustainability []. In newly cultivated land, however, few studies have analyzed the combined effect of different organic amendments and mineral fertilizers on the SQI and the economic benefit.
Thus, the objectives of this study were to (1) evaluate the effects of different fertilization measures on SQI, soil chemical properties, and rice grain yield; (2) investigate the relative importance of soil chemical properties in predicting rice grain yield; and (3) perform an economic analysis of rice production under different fertilization management strategies in the newly cultivated land based on the RCBF policy.
2. Materials and Methods
2.1. Site and Climate
This study was conducted from September 2017 to October 2019, located in Maxi Village, Quanwang Town, Qujiang District, Quzhou City (119°3′27″ E, 28°56′06″ N). The area has a subtropical, humid, monsoon climate, with an average annual temperature of 17.3 °C, an average annual rainfall of 1700 mm, and a frost-free period of 251–261 days. Newly cultivated paddy fields were set up in July 2017. Before reclamation, the low-slope, hilly wasteland had been covered by natural vegetation and left uncultivated for several decades. The soil belongs to Inceptisols with a sandy loam texture. The basic chemical properties of the topsoil are listed in Table 1.

Table 1.
Main properties of the top layer of soil and organic materials before the experiment.
2.2. Experiment Design
Six treatments were set up in the experiment: (1) control (CK), no crops were planted and no fertilizers were applied; (2) R, rice planted without fertilization; (3) RR, rice–ryegrass rotation without fertilizer application; (4) RRM, rice–ryegrass rotation with the application of mineral fertilizer during rice growth; (5) RRMO, rice–ryegrass rotation with the application of mineral fertilizer and organic manure during rice growth; and (6) RRMH, rice–ryegrass rotation with mineral fertilizer and humic acid application during rice growth. The plot area was 70 m2 (14 m × 5 m), and the experiment was repeated three times. A random block design was adopted. Ridges were built around the plots, and plastic films were used to isolate the plots to prevent fertilizer and water from flowing out.
Ryegrass (Lolium multiflorum cv. “Tetragold”) is an annual grass species introduced from Barenbrug (Tangent, OR, USA). It was sown in October 2017 and 2018, with the sowing amount being 45 kg ha−1. No fertilizer was applied during the growth of ryegrass, and it was turned over in situ before the heading stage in April 2018 and 2019. Rice (Oryza sativa L. cv. “Yongyou 9”) obtained from the Ningbo Academy of Agricultural Sciences was sown in May, transplanted in June with a planting density of 25 cm × 25 cm, and harvested in October 2018 and 2019.
Urea (N = 46%), calcium superphosphate (P = 12%), and potassium chloride (K = 60%) were applied as the fertilization treatments each year. N, P, and K fertilizers were applied at annual rates of 225 kg ha−1, 120 kg ha−1, and 90 kg ha−1, respectively. One day before rice transplantation, a full dose of P and K fertilizers were applied. Urea was applied in two doses: 50% at the basal stage and 50% at the tillering stage.
Mushroom residues were converted into organic manure through a series of composting procedures. Humic acid was extracted from weathered coal. The basic chemical properties of the solid organic manure and humic acid supplied by Zhejiang Fengyu Ecological Technology Co., Ltd. (Jinhua, China) are shown in Table 1. The application rates of organic manure and humic acid were 75 t ha−1 and 30 t ha−1, respectively, and they were applied once in September 2017. The irrigation and pest control practices were consistent for all treatments.
2.3. Sampling and Measurement
Mature rice crops were harvested in October 2018 and 2019. After threshing, the rice grain yield was dried to a 14% standard water content, and the actual yield was measured by weighing. Topsoil samples (0–20 cm) were collected from each plot using a random multipoint sampling method in October 2019. After being uniformly mixed, fresh samples were collected, sieved through a 2 mm sieve, and stored at 4 °C for the determination of soil ammonium N (NH4+-N), nitrate N (NO3−-N), and dissolved organic C (DOC) and N (DON). Inorganic N (NH4+-N and NO3−-N) was determined by extraction with 2 mol L−1 KCl solution, and the filtrate was analyzed using an autoanalyzer (TRAACS-2000, BRAN+LUEBBE, Norderstedt, Germany). The DOC and DON were measured by extraction with 0.05 mol L−1 K2SO4, and the extract was passed through a 0.45 μm membrane filter and determined using a Multi 3100 N/C TOC analyzer (Analytik Jena, Jena, Germany) [].
Other physical and chemical indices were measured after air drying at ambient temperature. The soil pH was measured using distilled water (1:2.5, w/v). The SOM and total nitrogen (TN) were determined using a Vario MACRO C/N elemental analyzer (Elementar Corp, Hanau, Germany). Soil alkaline hydrolysis N (AN) was determined using the sodium hydroxide hydrolysis diffusion method []. Particulate organic matter was extracted by shaking with sodium hexametaphosphate solution, and the C and N levels were determined using an elemental analyzer []. Labile organic C (LOC) was determined using the 0.333 mol L−1 potassium permanganate solution oxidation method []. AP was extracted using an extractant consisting of 0.025 mol L−1 HCl and 0.03 mol L−1 NH4F (1:10, w/v) and then determined by molybdenum blue colorimetry []. Available K (AK) was lixiviated using 1 mol L−1 NH4OAc (1:10, w/v) and estimated by flame spectrophotometry. The urease activity was determined as described by Watts and Chrisp []. Soil phosphatase and cellulase activities were measured using the microplate fluorescence method []. Sucrase activity was analyzed using 3,5-dinitrosalicylic acid colorimetry [].
The SQI was calculated using the integrated quality index equation described by Doran and Parkin []:
where Wi is the weight of each indicator, Si is the indicator score, and n is the number of variables.
According to the “Regulations for Gradation on Agriculture Land Quality” (GB/T, 28407-2012) [], the factor method was used to construct the evaluation system for cultivated land quality. Nine indicators, namely, soil basic fertility, surface soil texture, soil organic content, tillage layer thickness, guaranteed rate of irrigation water, altitude, soil pH, effective soil layer thickness, and slope, were selected to calculate the quality score of each evaluation unit. The weights for the soil- and site-condition-related indicators were established based on the growth suitability of the local staple crops of rape and rice. The relationships between indicators and quality scores are shown in Tables S1 and S2. The cultivated land grade index, ICLG, is calculated as follows:
where ICLG is the cultivated land grade index; αrape and αrice are the light–temperature (climatic) productive potential indices of rape (=510) and rice (=2178), respectively; βrape and βrice are the production ratio coefficients of rape (=2.85) and rice (=1); QSRAn and WRAn are the quality score and weight, respectively, of the soil indicator n of a rape plot; and QSRIn and WRIn are the quality score and weight, respectively, of the soil indicator n of a rice plot.
The quality of cultivated land is graded according to the grade index interval shown in Table S3. The evaluation result was categorized using a 15-grade system, with Grade 1 indicating the best quality of cultivated land and Grade 15 indicating the worst. Excellent cultivated land (Grades 1–4), high-grade cultivated land (Grades 5–8), middle-grade cultivated land (Grades 9–12), and low-grade cultivated land (Grades 13–15) were the four grades of cultivated land in China [].
The profit is calculated as follows:
where RCLQT is the revenue from cultivated land quota transactions. Based on the price of supplementary cultivated land quota transactions in Quzhou City, Zhejiang Province, the compensation fee for requisitioning Grade 10 cultivated land is 50,725 USD ha−1, which will increase by 7246 USD ha−1 for every 1-grade increase and vice versa; YRI2018 and YRI2019 are the yields of rice (kg ha−1) in 2018 and 2019, respectively; PRIS, PRYS, PN, PP, and PK are the price of rice seed, ryegrass seed, and N, P, and K fertilizers (USD kg−1), respectively; SRIS, SRYS, FN, FP, and FK are amounts of rice seed, ryegrass seed, and N, P, and K fertilizers rates (kg ha−1), respectively; CLR, CP, and CL are the cost (USD kg−1) of land reclamation, pesticide, and labor, respectively; labor cost consists of plowing, sowing, transplanting, irrigation, fertilization, pesticide spraying, weeding, and harvesting costs.
2.4. Data Analysis
Data were analyzed by analysis of variance (ANOVA) followed by Duncan’s multiple range tests at a probability level of 0.05. The relationship between rice grain yield and soil parameters was assessed by Spearman’s correlation analysis using the “ggm” package in R version 4.1.2. Random forest model (RFM) analysis was conducted using the “randomForest” package to identify the relative importance of factors on rice grain yield. The significance of each predictor was further assessed with the “rfPermute” package in R version 4.1.2.
3. Results
3.1. Rice Grain Yield
There were no differences in the rice grain yield between the only rice and rice–ryegrass treatments (Figure 1). However, rice grain yield was significantly improved by the application of fertilizers. In the rice–ryegrass rotation system, the 2-year average rice yield under different fertilization treatments was ranked as RRMO>RRMH>RRM>RR. Compared to the RRM treatment, RRMO and RRMH produced significantly (p < 0.05) higher 2-year average rice grain yields of 10.9% and 6.7%, respectively (Figure 1).
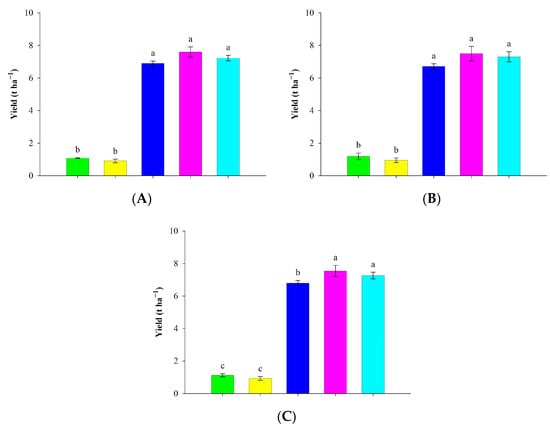
Figure 1.
Rice grain yield under different management practices in 2018 (A), 2019 (B), and the average of the two years (C). Note: R: rice planted without fertilization, RR: rice–ryegrass rotation without fertilizer application, RRM: rice–ryegrass rotation with the application of mineral fertilizer, RRMO: rice–ryegrass rotation with the application of mineral fertilizer and organic manure, RRMH: rice–ryegrass rotation with mineral fertilizer and humic acid application. Different lower-case letters indicate significant differences at the 5% level. Vertical bars indicate the standard deviation of the mean.
3.2. SOM Fractions
There were no differences in SOC, POC, and LOC levels among the CK, R, and RR treatments, indicating that planting cover crops could not increase SOC and its labile fractions in the short term. In contrast, different types of fertilizer applications under the rice–ryegrass rotation systems could improve SOM and its fractions at different magnitudes (Table 2). Compared with the RR treatment, the RRM, RRMO, and RRMH treatments resulted in significantly higher concentrations of soil LOC, which increased by 14.2–18.8% and 34.2–43.9% for LOC and DOC, respectively (Table 2). In contrast, larger improvements in the levels of SOC (115–296%) and POC (162–256%) were observed in fertilization treatments compared to those under the unfertilized rice–ryegrass rotation system. In addition, the combined use of mineral fertilizer and organic manure resulted in higher SOC, POC, and particulate organic nitrogen (PON) levels than with the mineral-fertilizer-alone treatment (Table 2).
Table 2.
Soil organic matter and its fractions under different management practices.
3.3. Soil Nutrients
In the rice–ryegrass rotation cropping system, the application of fertilizers significantly increased the levels of TN (53–159%), AN (71–105%), and NH4+-N (29–154%) compared to those with the unfertilized treatment (Table 3). The RRMO treatment had the highest TN, AP, and AK levels, which increased by 71.8%, 314.6%, and 56.9%, respectively, compared to the RRM treatment (Table 3). In contrast, the RRM and RRMH treatments caused an obvious decrease in the amount of AK compared to that with CK (Table 3).
Table 3.
Soil nutrient contents under different management practices.
3.4. Soil Enzyme Activity
In the absence of fertilization, there were no differences in soil enzyme activities involved in C, N, and P cycling, except for sucrase activity between rice–winter fallow (R) and rice–ryegrass rotation systems (RR) (Figure 2). In contrast, the combined use of mineral fertilizer and organic manure in rice–ryegrass rotation resulted in 42.3–287%, 63.1–92.1%, and 29.9–66.6% higher urease, sucrase, and cellulase activities, respectively, than those in the RR, RRM, and RRMH treatments (Figure 2). Neutral phosphatase activity was significantly higher in the RRMH treatment than in the other treatments (Figure 2).
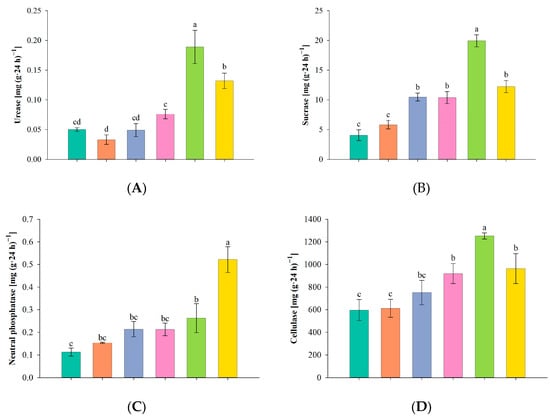
Figure 2.
Soil urease (A), sucrase (B), neutral phosphatase (C), and cellulase (D) activities under different management practices. CK: no crops planted and no fertilizers applied, R: rice planted without fertilization, RR: rice–ryegrass rotation without fertilizer application, RRM: rice–ryegrass rotation with the application of mineral fertilizer, RRMO: rice–ryegrass rotation with the application of mineral fertilizer and organic manure, RRMH: rice–ryegrass rotation with mineral fertilizer and humic acid application. Different lower-case letters indicate significant differences at the 5% level. Vertical bars indicate the standard deviation of the mean.
3.5. Influencing Factors of Yield Response to Soil Properties
Except for NO3− and AK, rice grain yield was positively associated with all soil properties. SOC, TN, and AP were positively correlated with soil enzyme activities (p < 0.05, Figure 3). AK was significantly negatively correlated with NH4+ and LOC (p < 0.05, Figure 3). Urease activity in the N cycle was found to be positive (p < 0.05) for NH4+, but negative (p < 0.05) for NO3−. DON had a positive effect on AN and NO3− (p < 0.05).
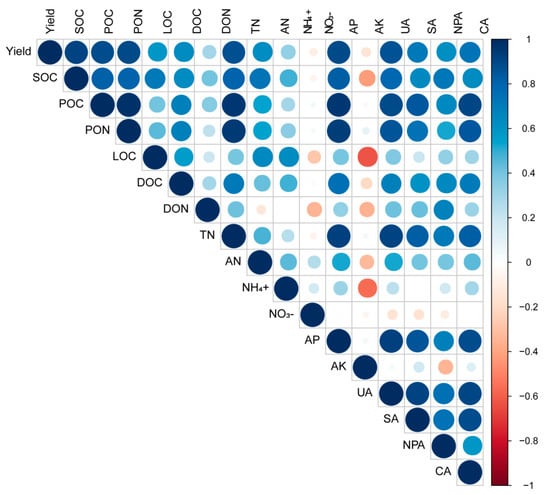
Figure 3.
Heatmap showing correlations among all variables. All circles represent significant Spearman correlation coefficients (p < 0.05). SOC: soil organic carbon, POC: particulate organic carbon, PON: particulate organic nitrogen, LOC: labile organic carbon, DOC: dissolved organic carbon, DON: dissolved organic nitrogen, TN: total nitrogen, AN: alkaline-hydrolysis nitrogen, AP: available P, AK: available K, UA: urease activity, SA: sucrase activity, NPA: neutral phosphatase activity, CA: cellulase activity.
The RFM was used to identify the most important environmental factors for predicting rice grain yield. The RFM showed that N-related properties (including urease activity, TN, and PON), C-related properties (including SOC, POC, and cellulase activity), and AP could significantly (p < 0.05) explain the response of rice yield to different fertilization treatments (Figure 4). The most important environmental factor was urease activity, followed by AP and POC, indicating that they could predict the rice grain yield better than the other soil properties (including DOC, LOC, and neutral phosphatase activity).
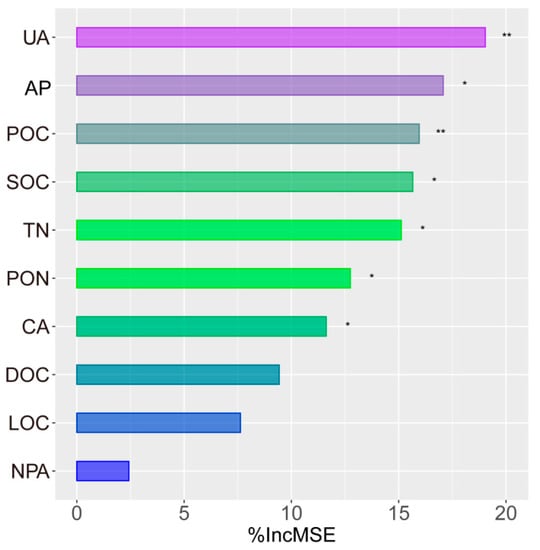
Figure 4.
Prediction of yield responses to soil properties based on the random forest model (RFM). UA: urease activity, AP: available P, POC: particulate organic carbon, SOC: soil organic carbon, TN: total nitrogen, PON: particulate organic nitrogen, CA: cellulase activity, DOC: dissolved organic carbon, LOC: labile organic carbon, NPA: neutral phosphatase activity. * indicates p < 0.05, and ** indicates p < 0.01.
3.6. SQI
After all the indicators were scored and weighted (Table S4), the SQI values were calculated using the total data set (TDS) method, and values ranged from 0.43 to 0.81. Fertilization resulted in a significantly higher (32.6–89.9%) SQI value (p < 0.05) than with the no-fertilizer treatments (Figure 5). The RRMO treatment had the highest value (0.81), which was significantly higher (p < 0.05) than those of the other treatments (Figure 5).
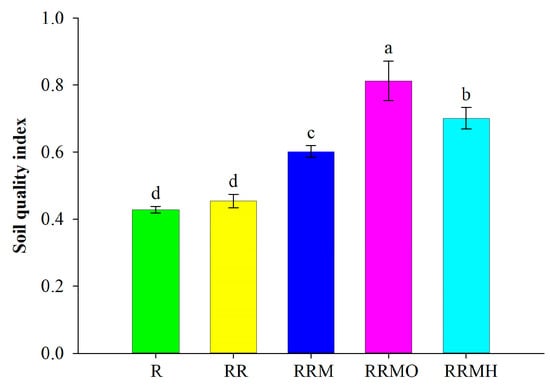
Figure 5.
Mean values of soil quality index (SQI) based on the total data set (TDS) method. R: rice planted without fertilization, RR: rice–ryegrass rotation without fertilizer application, RRM: rice–ryegrass rotation with the application of mineral fertilizer, RRMO: rice–ryegrass rotation with the application of mineral fertilizer and organic manure, RRMH: rice–ryegrass rotation with mineral fertilizer and humic acid application. Different lower-case letters indicate significant differences at the 5% level. Vertical bars indicate the standard deviation of the mean.
3.7. Economy Analysis
Fertilization management practices improved the cultivated land quality grade, especially the combined application of mineral fertilizer and organic amendments, being Grade 7 cultivated land for RRMO and RRMH (Table 4). Results showed that all treatments were economically profitable as they gave a rate of return above 200% (Table 4). Compared to CK, the R and RR treatment had lower profits because the revenue from rice production insufficiently offset labor costs. Profit was increased by 17–33% in response to fertilization. Large amounts of organic amendments with mineral fertilizer maximized profit by improving rice grain yield and farmland grade, although costs increased remarkably. The RRMH treatment gave a higher profit due to incurring only about half of the labor cost of applying organic amendments compared with the RRMO treatment.
Table 4.
Total revenue, cost, and profits based on the requisition–compensation balance of farmland (RCBF) policy.
4. Discussion
There were no differences in the rice grain yield between the only rice and rice–ryegrass treatments. Our results showed that there were no differences in the 2-year average rice grain yield between rice monoculture and rice–ryegrass rotation without any fertilizer (mineral or organic fertilizer) inputs, suggesting that replacing fallow periods with annual ryegrass did not guarantee an increase in rice grain yield. Abdalla et al. summarized 106 studies and found that cover crops led to a 4% reduction in the grain yield of the primary crop []. However, this disadvantage can be avoided by selecting mixed cover crops with a range of legumes and non-legumes. He et al. demonstrated that relatively higher residue rates of ryegrass facilitated rice growth by improving the bacterial community structure in red soil []. As a gramineous plant, ryegrass requires a high fertility level for production, especially an adequate N supply. In the present study, the rice–ryegrass rotation system in the newly cultivated land without fertilization was not conducive to N fixation of ryegrass because of low ryegrass biomass and soil microbial activity. Therefore, ryegrass could not provide sufficient N for the next rice crop. Selecting mixed cover crops with ryegrass and legumes (e.g., vetches and clover) might be an effective management practice for newly cultivated land []. Compared to the unfertilized control, the application of mineral fertilizer alone or in combination with organic amendments can improve rice grain yield. In addition, the high-input treatment (incorporation of ryegrass and organic manure or humic acid) resulted in 6.7–10.9% higher grain yields than with the RRM treatment, suggesting a good yield response with nutrient addition.
The soil nutrient levels (e.g., TN, AN, and AP) showed a gradient with the input amount after two consecutive years of the fertilizer application tests (Table 3). This was consistent with results obtained by Verlinden et al., who observed that, compared to the control, the application of dairy manure (22.4 t ha−1) for 15 consecutive years resulted in a significant increase in AP by 720% and AK by 95% []. However, the continuous application of manure has the potential risk of leaching P and other nutrients [,]. In the present study, the amounts of AP in the RRMO treatment increased by 10.7 mg kg−1 annually, and there was a risk of leaching in the future. Thus, it is important to determine an appropriate rate of manure application, which can not only reduce environmental pollution but also save costs. In contrast, the amounts of AK showed a decreasing trend in all fertilizer treatments. An annual input of 90 kg K ha−1 from mineral fertilizer did not guarantee sustainable rice production. Liu et al. reported that paddy fields in Southeast China are typically deficient in AK, which might be the most limiting constraint on rice productivity []. Similarly, Mi et al. discovered a decrease in AK levels in a double-rice cropping system in Southeast China []. The decrease in soil AK with the RRMH treatment may be related to the adsorption and retention of soil AK by humic acid []. Because organic manure can provide additional K nutrients, there was no significant drop in soil AK. To balance the nutrient budgets, the RRM and RRMH treatments required a higher application rate of K fertilizers.
Cover crop management has proved to be an economic and effective sustainable agriculture practice for improving SOC []. A two-year field experiment in a rice–ryegrass rotation system demonstrated that ryegrass amendment increased SOC levels significantly with a high N application rate during the rice season []. A lower N application rate, on the other hand, did not result in a significant difference in SOC level between rice monoculture and rice–ryegrass rotation, which is consistent with our findings. Therefore, nitrogen input is crucial for the decomposition process of certain cover crops in agricultural systems, especially for ryegrass with a higher C:N ratio. Our results also showed that the higher levels of SOC and its labile fractions in the fertilization treatments could be ascribed to larger inputs of root and stubble residues or organic material addition. Similarly, soil cellulase and sucrase activities were higher in the RRMO and RRMH treatments. This was possibly because higher organic inputs promoted microbial growth, thereby increasing the production of enzymes to decompose recalcitrant SOC. SOC is a key attribute of soil quality because of its effects on soil physical, chemical, and biological processes that regulate the sustainability and productivity of agroecosystems []. POC, among other labile SOC fractions, is more sensitive to changes caused by crops and soil management practices []. The RFM also showed that SOC and POC were important factors that could better predict the response of rice yield to different fertilization management strategies.
In newly cultivated land, fertilization is essential to sustain and improve soil quality. A field trial on the newly cultivated land suggested that lack of fertilizer application gives rise to land degradation and results in the deterioration of soil quality []. Organic manure has been reported to be an ideal soil amendment for newly cultivated land, mainly because it can improve not only SOM levels but also soil physical properties []. Another effective indicator suitable for evaluating soil productivity is the cultivated land quality grade, in addition to the SQI. In the present study, the cultivated land quality grade among different treatments possessed a tendency similar to that of rice grain yield, indicating that rice grain yield can largely reflect the cultivated land quality grade. According to economic benefit analysis, higher economic returns were preserved by the RRMO and RRMH in comparison with the other treatments. Such a high-input cropping system is still profitable due to the relatively higher trading price of the farmland quota. In China, a shortage of land quotas often results in developed regions purchasing land quotas from relatively underdeveloped areas []. Taking Zhejiang as an example, the Zhejiang Province focuses most of its large infrastructure projects on the Hangzhou–Jiaxing–Huzhou–Shaoxing Plain, while the compensatory farmlands are in the Jinhua–Quzhou basin and Wenzhou–Taizhou coastal area []. The cultivated land quality grade of newly cultivated land was improved by the combined application of mineral fertilizer and organic amendments in underdeveloped areas of the Zhejiang Province, such as Quzhou City. Selling quotas in these areas can alleviate financial poverty and help protect farmland.
5. Conclusions
Our study showed that the application of fertilizer with ryegrass cropping improved the rice grain yield, the SOC pool, and the soil nutrients. The RRMO treatment had the most profound positive effect on rice grain yield and soil quality. The RFM showed that N-related properties (including urease activity, TN, and PON), C-related properties (including SOC, POC, and cellulase activity), and AP could significantly (p < 0.05) explain the response of rice yield to different fertilization management strategies. The same cultivated land quality grade was observed in the RRMO and RRMH treatments. Overall, rice–ryegrass rotation with the application of mineral fertilizer and organic manure was the optimal practice to rapidly improve the soil productivity of the newly cultivated land. However, given the implementation of the RCBF policy, rice–ryegrass rotation with the application of mineral fertilizer and humic acid obtained the highest profit.
Supplementary Materials
The following supporting information can be downloaded at https://www.mdpi.com/article/10.3390/agronomy13051361/s1: Tables S1–S4. Table S1. Relationship between indicators and quality score in the rape planting system. Table S2. Relationship between indicators and quality score in the rice planting system. Table S3. Relationship between grade and grade index. Table S4. Estimated communality and weight value of each soil quality in the total data set (TDS).
Author Contributions
L.S.: conceptualization and writing the original draft. J.X.: analysis, review, and editing. K.C.: methodology, sampling, and reviewing the draft. X.Z.: data collection, software, and editing. K.H.: supervision, conceptualization, review, and editing. J.W.: read and approved the final manuscript. All authors have read and agreed to the published version of the manuscript.
Funding
This research was funded by the National Natural Science Foundation of China (42107358), the earmarked fund for China Modern Agriculture Research System—Green Manure (CARS-22), the National Key Research and Development Program of China (2021YFD1700200), the Natural Science Foundation of Zhejiang Province (LQ20C030005), and the Youth Fund Project of National Natural Science Foundation of China (32101317).
Data Availability Statement
Not applicable.
Conflicts of Interest
The authors declare no conflict of interest.
References
- Xu, H. Analysis and countermeasures on effective land use of rural residential area in Jinan, Shandong Province. Chin. J. Popul. Resour. Environ. 2006, 4, 41–44. [Google Scholar] [CrossRef]
- Liu, Y.; Fang, F.; Li, Y. Key issues of land use in China and implications for policy making. Land Use Policy 2014, 40, 6–12. [Google Scholar] [CrossRef]
- Otremba, K.; Kozłowski, M.; Tatuśko-Krygier, N.; Pająk, M.; Kołodziej, B.; Bryk, M. Impact of alfalfa and NPK fertilization in agricultural reclamation on the transformation of Technosols in an area following lignite mining. Land Degrad. Dev. 2021, 32, 1179–1191. [Google Scholar] [CrossRef]
- Jacinthe, P.; Lal, R. Tillage effects on carbon sequestration and microbial biomass in reclaimed farmland soils of southwestern Indiana. Soil Sci. Soc. Am. J. 2009, 73, 605–613. [Google Scholar] [CrossRef]
- Shen, X.; Wang, L.; Wu, C.; Lv, T.; Lu, Z.; Luo, W.; Li, G. Local interests or centralized targets? How China’s local government implements the farmland policy of Requisition–Compensation Balance. Land Use Policy 2017, 67, 716–724. [Google Scholar] [CrossRef]
- Chen, W.; Ye, X.; Li, J.; Fan, X.; Liu, Q.; Dong, W. Analyzing requisition–compensation balance of farmland policy in China through telecoupling: A case study in the middle reaches of Yangtze River Urban Agglomerations. Land Use Policy 2019, 83, 134–146. [Google Scholar] [CrossRef]
- Li, X.; Su, Y.; Ahmed, T.; Ren, H.; Javed, M.R.; Yao, Y.; An, Q.; Yan, J.; Li, B. Effects of different organic fertilizers on improving soil from newly reclaimed land to crop soil. Agriculture 2021, 11, 560. [Google Scholar] [CrossRef]
- Xu, X.; Schaeffer, S.; Sun, Z.; Zhang, J.; An, T.; Wang, J. Carbon stabilization in aggregate fractions responds to straw input levels under varied soil fertility levels. Soil Tillage Res. 2020, 199, 104593. [Google Scholar] [CrossRef]
- Biratu, G.K.; Elias, E.; Ntawuruhunga, P. Soil fertility status of cassava fields treated by integrated application of manure and NPK fertilizer in Zambia. Environ. Syst. Res. 2019, 8, 3. [Google Scholar] [CrossRef]
- Wang, C.; Liu, J.; Shen, J.; Chen, D.; Li, Y.; Jiang, B.; Wu, J. Effects of biochar amendment on net greenhouse gas emissions and soil fertility in a double rice cropping system: A 4-year field experiment. Agric. Ecosyst. Environ. 2018, 262, 83–96. [Google Scholar] [CrossRef]
- Doan, T.T.; Henry-Des-Tureaux, T.; Rumpel, C.; Janeau, J.; Jouquet, P. Impact of compost, vermicompost and biochar on soil fertility, maize yield and soil erosion in Northern Vietnam: A three year mesocosm experiment. Sci. Total Environ. 2015, 514, 147–154. [Google Scholar] [CrossRef] [PubMed]
- Weerasekara, C.S.; Udawatta, R.P.; Gantzer, C.J.; Kremer, R.J.; Jose, S.; Veum, K.S. Effects of cover crops on soil quality: Selected chemical and biological parameters. Commun. Soil Sci. Plant Anal. 2017, 48, 2074–2082. [Google Scholar] [CrossRef]
- Bowles, T.M.; Jilling, A.; Morán-Rivera, K.; Schnecker, J.; Grandy, A.S. Crop rotational complexity affects plant-soil nitrogen cycling during water deficit. Soil Biol. Biochem. 2022, 166, 108552. [Google Scholar] [CrossRef]
- Li, Z.; Liu, M.; Wu, X.; Han, F.; Zhang, T. Effects of long-term chemical fertilization and organic amendments on dynamics of soil organic C and total N in paddy soil derived from barren land in subtropical China. Soil Tillage Res. 2010, 106, 268–274. [Google Scholar] [CrossRef]
- He, H.; Li, W.; Zhang, Y.; Cheng, J.; Jia, X.; Li, S.; Yang, H.; Chen, B.; Xin, G. Effects of Italian ryegrass residues as green manure on soil properties and bacterial communities under an Italian ryegrass (Lolium multiflorum L.)-rice (Oryza sativa L.) rotation. Soil Tillage Res. 2020, 196, 104487. [Google Scholar] [CrossRef]
- Yang, Z.Y.; Xin, G.R.; Yuan, J.G.; Fang, W.; Li, G.X. Ecological fertilization: An example for paddy rice performed as a crop rotation system in southern China. In Fertilizers: Properties, Applications and Effects; Elsworth, L.R., Paley, W.O., Eds.; Nova Science Publishers: New York, NY, USA, 2008; pp. 1–28. [Google Scholar]
- Trillas, M.I.; Segarra, G. Chapter 8 interactions between nonpathogenic fungi and plants. Adv. Bot. Res. 2009, 51, 321–359. [Google Scholar] [CrossRef]
- Boluda, R.; Roca-Pérez, L.; Iranzo, M.; Gil, C.; Mormeneo, S. Determination of enzymatic activities using a miniaturized system as a rapid method to assess soil quality. Eur. J. Soil Sci. 2014, 65, 286–294. [Google Scholar] [CrossRef]
- Liu, Z.; Zhou, W.; Li, S.; He, P.; Liang, G.; Lv, J.; Jin, H. Assessing soil quality of gleyed paddy soils with different productivities in subtropical China. Catena 2015, 133, 293–302. [Google Scholar] [CrossRef]
- Jones, D.L.; Willett, V.B. Experimental evaluation of methods to quantify dissolved organic nitrogen (DON) and dissolved organic carbon (DOC) in soil. Soil Biol. Biochem. 2006, 38, 991–999. [Google Scholar] [CrossRef]
- Xiong, Y.; Xia, H.; Li, Z.A.; Cai, X.A.; Fu, S. Impacts of litter and understory removal on soil properties in a subtropical Acacia mangium plantation in China. Plant Soil 2008, 304, 179–188. [Google Scholar] [CrossRef]
- Cambardella, C.A.; Elliott, E.T. Particulate soil organic-matter changes across a grassland cultivation sequence. Soil Sci. Soc. Am. J. 1992, 56, 777–783. [Google Scholar] [CrossRef]
- Blair, G.J.; Lefroy, R.; Lisle, L. Soil carbon fractions based on their degree of oxidation, and the development of a carbon management index for agricultural systems. Aust. J. Agric. Res. 1995, 46, 1459–1466. [Google Scholar] [CrossRef]
- Bray, R.H.; Kurtz, L.T. Determination of total, organic, and available forms of phosphorus in soils. Soil Sci. 1945, 59, 39–46. [Google Scholar] [CrossRef]
- Watt, G.W.; Chrisp, J.D. Spectrophotometric method for determination of hydrazine. Anal. Chem. 1952, 24, 2006–2008. [Google Scholar] [CrossRef]
- Yang, X.Z.; Chen, Z.H.; Zhang, Y.L.; Chen, L.J. Effect of exogenous phytase addition on soil phosphatase activities: A Fluorescence Spectroscopy study. Spectrosc. Spectr. Anal. 2015, 35, 1294–1299. [Google Scholar]
- Frankeberger, W.T.; Johanson, J.B. Method of measuring invertase activity in soils. Plant Soil 1983, 74, 301–311. [Google Scholar] [CrossRef]
- Doran, J.W.; Parkin, T.B. Defining and assessing soil quality. In Defining Soil Quality for a Sustainable Environment; Doran, J.W., Coleman, D.C., Bezdicek, D.F., Stewart, B.A., Eds.; Soil Science Society of America: Madison, WI, USA, 1994; pp. 3–21. [Google Scholar]
- GB/T 28407-2012; Regulation for Gradation on Agriculture Land Quality. Standards Press of China: Beijing, China, 2012.
- Yuan, X.; Shao, Y.; Li, Y.; Liu, Y.; Wang, Y.; Wei, X.; Wang, X.; Zhao, Y. Cultivated land quality improvement to promote revitalization of sandy rural areas along the Great Wall in northern Shaanxi Province, China. J. Rural Stud. 2022, 93, 367–374. [Google Scholar] [CrossRef]
- Abdalla, M.; Hastings, A.; Cheng, K.; Yue, Q.; Chadwick, D.; Espenberg, M.; Truu, J.; Rees, R.M.; Smith, P. A critical review of the impacts of cover crops on nitrogen leaching, net greenhouse gas balance and crop productivity. Glob. Change Biol. 2019, 25, 2530–2543. [Google Scholar] [CrossRef]
- Doltra, J.; Olesen, J.E. The role of catch crops in the ecological intensification of spring cereals in organic farming under Nordic climate. Eur. J. Agron. 2013, 44, 98–108. [Google Scholar] [CrossRef]
- Verlinden, S.; Mcdonald, L.; Kotcon, J.; Childs, S. Long-term effect of manure application in a certified organic production system on soil physical and chemical parameters and vegetable yields. HortTechnology 2017, 27, 171–176. [Google Scholar] [CrossRef]
- Evanylo, G.; Sherony, C.; Spargo, J.; Starner, D.; Brosius, M.; Haering, K. Soil and water environmental effects of fertilizer-, manure-, and compost-based fertility practices in an organic vegetable cropping system. Agric. Ecosyst. Environ. 2008, 127, 50–58. [Google Scholar] [CrossRef]
- Vanden Nest, T.; Vandecasteele, B.; Ruysschaert, G.; Cougnon, M.; Merckx, R.; Reheul, D. Effect of organic and mineral fertilizers on soil P and C levels, crop yield and P leaching in a long term trial on a silt loam soil. Agric. Ecosyst. Environ. 2014, 197, 309–317. [Google Scholar] [CrossRef]
- Liu, Z.; Zhou, W.; Shen, J.; He, P.; Lei, Q.; Liang, G. A simple assessment on spatial variability of rice yield and selected soil chemical properties of paddy fields in South China. Geoderma 2014, 235–236, 39–47. [Google Scholar] [CrossRef]
- Mi, W.; Gao, Q.; Xia, S.; Zhao, H.; Wu, L.; Mao, W.; Hu, Z.; Liu, Y. Medium-term effects of different types of N fertilizer on yield, apparent N recovery, and soil chemical properties of a double rice cropping system. Field Crops Res. 2019, 234, 87–94. [Google Scholar] [CrossRef]
- Selladurai, R.; Purakayastha, T.J. Effect of humic acid multinutrient fertilizers on yield and nutrient use efficiency of potato. J. Plant Nutr. 2016, 39, 949–956. [Google Scholar] [CrossRef]
- Wulanningtyas, H.S.; Gong, Y.; Li, P.; Sakagami, N.; Nishiwaki, J.; Komatsuzaki, M. A cover crop and no-tillage system for enhancing soil health by increasing soil organic matter in soybean cultivation. Soil Tillage Res. 2021, 205, 104749. [Google Scholar] [CrossRef]
- Hou, P.; Xue, L.; Wang, J.; Petropoulos, E.; Deng, X.; Qiao, J.; Xue, L.; Yang, L. Continuous milk vetch amendment in rice-fallow rotation improves soil fertility and maintains rice yield without increasing CH4 emissions: Evidence from a long-term experiment. Agric. Ecosyst. Environ. 2022, 325, 107774. [Google Scholar] [CrossRef]
- Nardi, S.; Morari, F.; Berti, A.; Tosoni, M.; Giardini, L. Soil organic matter properties after 40 years of different use of organic and mineral fertilisers. Eur. J. Agron. 2004, 21, 357–367. [Google Scholar] [CrossRef]
- Duval, M.E.; Galantini, J.A.; Iglesias, J.O.; Canelo, S.; Martinez, J.M.; Wall, L. Analysis of organic fractions as indicators of soil quality under natural and cultivated systems. Soil Tillage Res. 2013, 131, 11–19. [Google Scholar] [CrossRef]
- Gui, D.; Lei, J.; Mu, G.; Zeng, F. Effects of different management intensities on soil quality of farmland during oasis development in southern Tarim Basin, Xinjiang, China. Int. J. Sust. Dev. World Ecol. 2009, 16, 295–301. [Google Scholar] [CrossRef]
- Liang, X.; Yuan, Q.; Tan, X.; Chen, S. The conservation of collective-owned farmland via the transfer of development rights (TDR) in China--the case of Ecological Fruit Park in Guangzhou. J. Rural Stud. 2020, 78, 399–410. [Google Scholar] [CrossRef]
- Deng, Z.; Zhao, Q.; Bao, H.X.H. The impact of urbanization on farmland productivity: Implications for China’s Requisition–Compensation Balance of Farmland Policy. Land 2020, 9, 311. [Google Scholar] [CrossRef]
Disclaimer/Publisher’s Note: The statements, opinions and data contained in all publications are solely those of the individual author(s) and contributor(s) and not of MDPI and/or the editor(s). MDPI and/or the editor(s) disclaim responsibility for any injury to people or property resulting from any ideas, methods, instructions or products referred to in the content. |
© 2023 by the authors. Licensee MDPI, Basel, Switzerland. This article is an open access article distributed under the terms and conditions of the Creative Commons Attribution (CC BY) license (https://creativecommons.org/licenses/by/4.0/).