Article

Effects of Source Strength and Sink Size on Starch Metabolism, Starch Properties and Grain Quality of Rice (Oryza sativa L.)

1
Jiangsu Key Laboratory of Crop Genetics and Physiology/Jiangsu Key Laboratory of Crop Cultivation and Physiology, Agricultural College, Yangzhou University, Yangzhou 225009, China
2
Jiangsu Co-Innovation Center for Modern Production Technology of Grain Crops, Yangzhou University, Yangzhou 225009, China
*
Authors to whom correspondence should be addressed.
Agronomy 2023, 13(5), 1288; https://doi.org/10.3390/agronomy13051288
Submission received: 4 April 2023 / Revised: 25 April 2023 / Accepted: 28 April 2023 / Published: 29 April 2023
(This article belongs to the Section Plant-Crop Biology and Biochemistry)

Abstract

:
The source strength and sink demand as well as their interaction have been demonstrated to co-regulate the synthesis of starch and determine the grain quality, but the knowledge of the underlying physiological mechanisms is limiting. An indica variety, Yangdao 6, and a japonica variety, Jinxiangyu 1, were planted with three treatments, including normal growth plant (CK), leaf-cutting (LC) and spikelet-thinning (ST). The transcript levels of starch metabolic genes, physicochemical characteristics of starch and appearance, milling, cooking and tasting qualities of rice under different treatments were determined. The ST treatment increased the relative expression of genes related to the synthesis of short branch-chains of amylopectin (SSI, BEI, BEIIb) and amylose (GBSSI) and reduced the relative expression of medium-long to long branch-chains of amylopectin synthesis genes (SSIIa, SSIIIa, SSIIIb, ISA1). When comparing ST with the CK treatment, starch granules became smoother with higher contents of short branch-chains and lower ratios of medium-long and long branch-chains of amylopectin; the crystallinity and the value of 1045/1022 cm−1 was decreased; for pasting properties, the setback and pasting temperature were decreased; the peak viscosity, hot viscosity, breakdown and final viscosity were significantly increased. Meanwhile, the ST treatment improved the appearance, milling and cooking and tasting qualities. The opposite results were observed under the LC treatment. These results indicated that source strength and sink size would regulate expression levels of starch metabolic genes, which is pivotal for the contents of amylose and short/long branch chains ratio of amylopectin, thus changing the structure and physicochemical properties of starch and grain quality. Here, we speculated that the improved source strength in terms of higher leaf/canopy photosynthesis and small sink size, such as small panicle size, would be preferred traits in high grain quality rice breeding.

1. Introduction

The quality and yield of rice are mainly determined by the activities of the source, sink and flow and interactions among them [1]. The source assimilates CO2 from the ambient air, synthesizes it into sugars and transports the sugars to the sink. The flag leaf is normally regarded as the primary source of photosynthate for the developing grains [2,3]. Grains are considered as the major sink organs [4]. Grain yields were determined by the source-sink relationship. The leaf area per spikelet (the ratio of leaf area to spikelet number) represents the capability of source supply for each spikelet’s demands and could be a pivotal determinant of grain weight [5]. Source-sink relationship manipulation (e.g., leaf-cutting, spikelet-thinning, shading) is the most commonly used method to alter the source-sink relationship [6,7]. Lots of studies have reported the influences of source strength or sink size on plant growth and yield production [8,9,10]. For example, a low light environment would limit the supply of photosynthetic assimilates for grain filling and would result in lower yield [11,12]. However, there are few reports that have explored how source or sink strength influenced grain quality. Tao et al. [13] found that by partial spikelet removal, the transparency, gel consistency and head rice percentage were significantly improved, while chalky rate and chalkiness of rice were reduced and grain quality was deteriorated in defoliation treatment. However, Yuan et al. [14] reported that spikelet-thinning reduced the head rice percentage. Miao et al. [15] suggested that the spikelet-thinning treatment could significantly improve the appearance of rice, but not milling quality. The effect of spikelet-thinning on cooking and eating quality differed between varieties. Obviously, there were contradictions regarding the effect of source-sink manipulation on rice quality, and the underlying mechanisms of source or sink strength and how they affect rice quality need further study. Furthermore, the structure and physicochemical properties were not studied.
Starch comprises 80–85% of the dry weight of grain. Its fine structure and physicochemical properties are closely related to grain quality [16,17,18]. The synthesis of starch is rather complicated. The synthesis of sucrose by photosynthesis is the first step of starch formation. Sucrose is hydrolyzed to fructose and UDP-glucose (UDPG) under sucrose synthase (SUS), transformed into glucose-1-phosphate (G1P) and catalyzed to ADP-glucose (ADPG) by ADP-glucose pyrophosphorylase (AGPase). Finally, ADPG is converted into glucan through a series of enzymatic reactions [19,20]. The key enzymes of starch synthesis mainly include AGPase, soluble starch synthase (SS), granule-bound starch synthase (GBSS), starch branching enzyme (SBE) and starch debranching enzyme (DBE), which also influence the capacity and activity of sinks in grain [21,22,23]. The activities of AGPase limit the synthesis of starch [24]. AGPase is composed of two subunit types, including seven isozymes (AGPS1, AGPS2a, AGPS2b, AGPL1, AGPL2, AGPL3 and AGPL4) in rice, which coordinate and catalyze the first step of starch biosynthesis. AGPS2b and AGPL2 are the major small subunit and large subunit isoforms in the endosperm, respectively [25]. The levels of AGPase transcript are positively correlated with the rate of starch deposition [26]. SS utilizes ADPG to extend the branch length by forming new α-1,4-glucosidic linkages. SSI is primarily involved in the elongation of short glucan chains, elongating the chains from DP 6–7 to DP 8–12 [27]. SSII is related to the biosynthesis of long B1 chains by elongating short A and B1 chains of amylopectin [28]. SSIII is responsible for the synthesis of relatively long chains (DP > 30) of amylopectin in rice endosperms [29]. SSIIa and SSIIIa are two key genes participating in biosynthesis of amylopectin [30]. GBSS is mainly responsible for the contents of amylose [31]. GBSSI is encoded by the Wx gene, synthesizing the linear chains of amylose [32,33]. GBSSII is responsible for the transient starch of amylose in non-storage organs such as leaves and photosynthetic tissues. Starch branching enzymes (SBEs) play important roles in the fine structure of amylopectin by introducing α-1,6-glucosidic linkages [34,35]. BEIIb is specifically expressed in endosperm cells, whereas BEIIa is ubiquitously expressed [36]. DBE contains isoamylase (ISA) and pullulanase (PUL). ISA mainly debranches phytoglycogen and amylopectin, whereas PUL acts upon pullulan and amylopectin, excepting phytoglycogen [37]. The constitutions of starch metabolic genes have important roles in starch fine structure, and physicochemical properties need to be further explored.
Nowadays, people also have a higher demand for high quality rice. The source-sink relationship would influence the formation and accumulation of starch in grains, which directly affects the quality of rice. Source-sink reduction treatments could significantly affect rice quality by regulating grain filling dynamics [8]. For example, the high yielding ‘super’ rice cultivars have a large sink strength with numerous spikelets on a panicle, but the percentages of filled grain were significantly lower than conventional rice cultivars due to limited source supply [38]. It is also reported that grain quality is deteriorated in super rice with larger sink strength [39]. Thus, it is essential to study effects of source or sink strength on rice quality. The results from this study could be helpful for optimizing source–sink relationships to improve grain quality in ideotype design. In this study, conventional indica rice, Yangdao 6 (YD 6), and japonica rice, Jinxiangyu 1 (JXY 1), were chosen as experimental varieties. There were three treatments, including normal growth plant (CK), leaf-cutting (LC) and spikelet-thinning (ST). We studied the transcript levels of key genes in starch metabolism, starch structure, physicochemical properties and grain quality to explore the physiological mechanisms of the effects of source/sink strengths on starch synthesis in rice.

2. Materials and Methods

2.1. Plant Material and Experimental Design

An indica rice cultivar, Yangdao 6 (YD 6, Oryza sativa L.), and a japonica rice cultivar, Jinxiangyu 1 (JXY 1), were planted in this experiment. The experiment was carried out at an experimental station in Yangzhou, Jiangsu Province, China (119.42° E, 32.39° N) in the years 2019 and 2020. Except for parameters related to cooking and tasting qualities which were measured in both years, the other results were obtained from the study of the year 2020. The former crop was wheat. The soil was sandy loam containing 24.9 g kg−1 organic matter, 105 mg kg−1 alkaline nitrogen, 34.6 mg kg−1 available phosphorus and 68.2 mg kg−1 available potassium after rice harvest in the year 2020. It was a field factorial design experiment with three treatments and two cultivars. For the combination of each treatment and cultivar, there were three replicates. For each replicate, the area was 5 × 6 m. The seeds were sown on 22 May and then transplanted on June 11. There were 30 cm between rows and 13.3 cm between hills within one row. There were two seedling per hill. The total application of N as urea was 300 kg N ha−1 with the ratio of 5:2:2:1 at pre-transplanting, early tillering, panicle initiation and initial of spikelet differentiation. Phosphorus (30 kg ha−1 as single superphosphate) and potassium (40 kg ha−1 as KCl) were applied and incorporated before transplanting as basal fertilizer.
A total of 200–300 plants that flowered on the same day were chosen, and the panicle of the main stem was tagged for each plot. For half of the selected plants, the flag leaves of the main stems of rice plants were cut (LC treatment). The spikelets of the other half of the plants were thinned (ST treatment) by removing half of the primary rachis branches along the main panicle rachis of the panicle of the main stem. The filling grains of three treatments were sampled at 1, 2, 3, 5, 10, 15, 20 and 25 days after flowering (DAF) and then immediately stored in liquid nitrogen and preserved at −80 °C in the refrigerator for measurements of gene transcriptions. The filling grains at 10, 15, 20 and 25 DAF were detached from the tagged spikelets for measurements of chain length distribution (CLD), and grains at maturity were collected from the tagged spikelets for measurements of grain quality and other starch physicochemical properties.

2.2. Measurements of Grain Quality and Starch Physicochemical Properties

The brown rice percentage, milled rice percentage, head rice percentage, chalky rice rate, chalkiness, chalkiness area, amylose content, protein content and gelatinization consistency were measured according to the national standard GB/T17891-2017. The taste value was determined by the Satake taste meter (RCTA 11A, Satake Co., Hiroshima, Japan). The texture properties were measured with a texture analyzer (TA-XT Plus, Stable Micro Systems Ltd., Surrey, UK) with the P/36R probe following the method of Jiang et al. [40].
For soil nutrient contents, the organic matter, alkaline nitrogen, available phosphorus and available potassium in the 0–20 cm soil layer after harvest were determined according to the method described by Li et al. [41].
The starch samples were extracted using the neutral protease to remove the protein according to the method of Tran et al. [42]. After this, the dried starch samples were coated with gold, then were observed and photographed by environmental scanning electron microscopy (XL-30 ESEM, Philips, Amsterdam, Netherlands).
For the CLD of debranched amylopectin, we followed the method of Zhou et al. [39], briefly, a PA-800 Plus System equipped with a solid-state laser-induced fluorescence (Beckman Coulter, Brea, CA, USA) detector was used to measure the CLD by the fluorophore-assisted carbohydrate electrophoresis (FACE) method.
The relative crystallinity of starch was measured by an RU200R X-ray diffractometer (XRD, Rigaku, Tokyo, Japan) at 40 kV and 40 mA radiation. The X-ray diffraction patterns were processed by MDI Jade 6.0 to obtain crystalline area (Ac) and amorphous area (Aa).
Crystallinity (%) = Ac/(Ac + Aa) × 100%
The ordered structure of starch external region was analyzed by Fourier transform infrared (FTIR, Varian 7000, America) to obtain spectral data over a 400–4000 cm−1 region. The spectra were normalized using multipoint linear baseline correction then deconvoluted (k factor 2.0, half width is 25 cm−1).
The starch pasting properties were determined by a rapid viscosity analyzer (Model 3D, Newport Scientific, Warriewood, Australia) according to the method described by Lu et al. [43], and the values of peak viscosity, hot viscosity, breakdown, final viscosity, setback, peaking time and pasting temperature were recorded.

2.3. Total RNA Extraction and qRT-PCR Analysis

Total RNA was extracted from grains using the RNAsimple Total RNA kit (DP419, Tiangen Biotech, Beijing, China) following the manufacturer’s instructions. The concentration of RNA was examined, and then the RNA was reverse transcribed to cDNA using a FastKing gDNA Dispelling RT SuperMix kit (KR118, Tiangen Biotech, Beijing, China). The quantitative real-time qRT-PCR analysis used a fluorescence quantitative PCR kit called the SuperReal PreMix Plus (SYBR Green) kit (FP205, Tiangen Biotech, Beijing, China). Reactions were carried out on an iCycle (CFX 96 touch, Bio-Rad, Hercules, CA, USA) according to the manufacturer’s protocols. The reaction system and conditions were referred to in the kit instructions. The rice Actin gene was used as a reference gene with three replicates per sample. The primers used for PCR were the same as Ohdan et al. [44] and are listed in Table 1.

2.4. Statistical Analysis

The data in all the tables and figures are the means of the triplicate replicates. Means were tested by least significant difference at the P0.05 level. The experimental data were analyzed by Microsoft Excel 2016 and SPSS 16.0 software. The data were visualized in Origin 2021.

3. Results

3.1. Expression Profiles of AGPase Genes

AGPase catalyzes glucose-1-phosphate (G1P) to ADPG [45]. As showed in Figure 1, the expression of AGPS1 and AGPL1 increased to peak at 5 DAF and then declined in both varieties. Compared with the CK treatment, the transcript levels of AGPS1 and AGPL1 were significantly up-regulated under the ST treatment but slightly down-regulated under the LC treatment in the beginning of grain filling (Figure 1A,D,a,d). The expression levels of AGP2a and AGPL3 were low in the endosperm, and there were no significant differences between the three treatments throughout seed development (Figure 1B,F,b,f). The expression patterns of AGPS2b and AGPL2 were similar, with a typical bimodal distribution, but AGPS2b transcripts peaked at 5 DAF and 20 DAF and AGPL2 transcripts peaked at 5 DAF and 15 DAF (Figure 1C,E,c,e). Compared with the CK treatment, the expression levels of AGPS2b had a decreasing trend under the LC treatment, and the opposite trend was observed under the ST treatment for YD 6, but the trend was not obvious for JXY 1. The expression levels of AGPL2 increased at 5 DAF and 5–15 DAF for YD 6 and JXY 1, respectively, when comparing the ST treatment to the CK treatment. The transcript level of AGPL4 was relatively low and peaked at 10 DAF under all three treatments. The ST treatment up-regulated the expression level of AGPL4, but the LC treatment down-regulated its expression at 10 DAF for JXY 1 (Figure 1G,g). Among all the AGPase isoform genes, AGPS2b and AGPL2 were vigorously expressed throughout seed development, but with the highest expression level in the middle of grain filling (5–20 DAF).

3.2. Expression Profiles of SS Genes

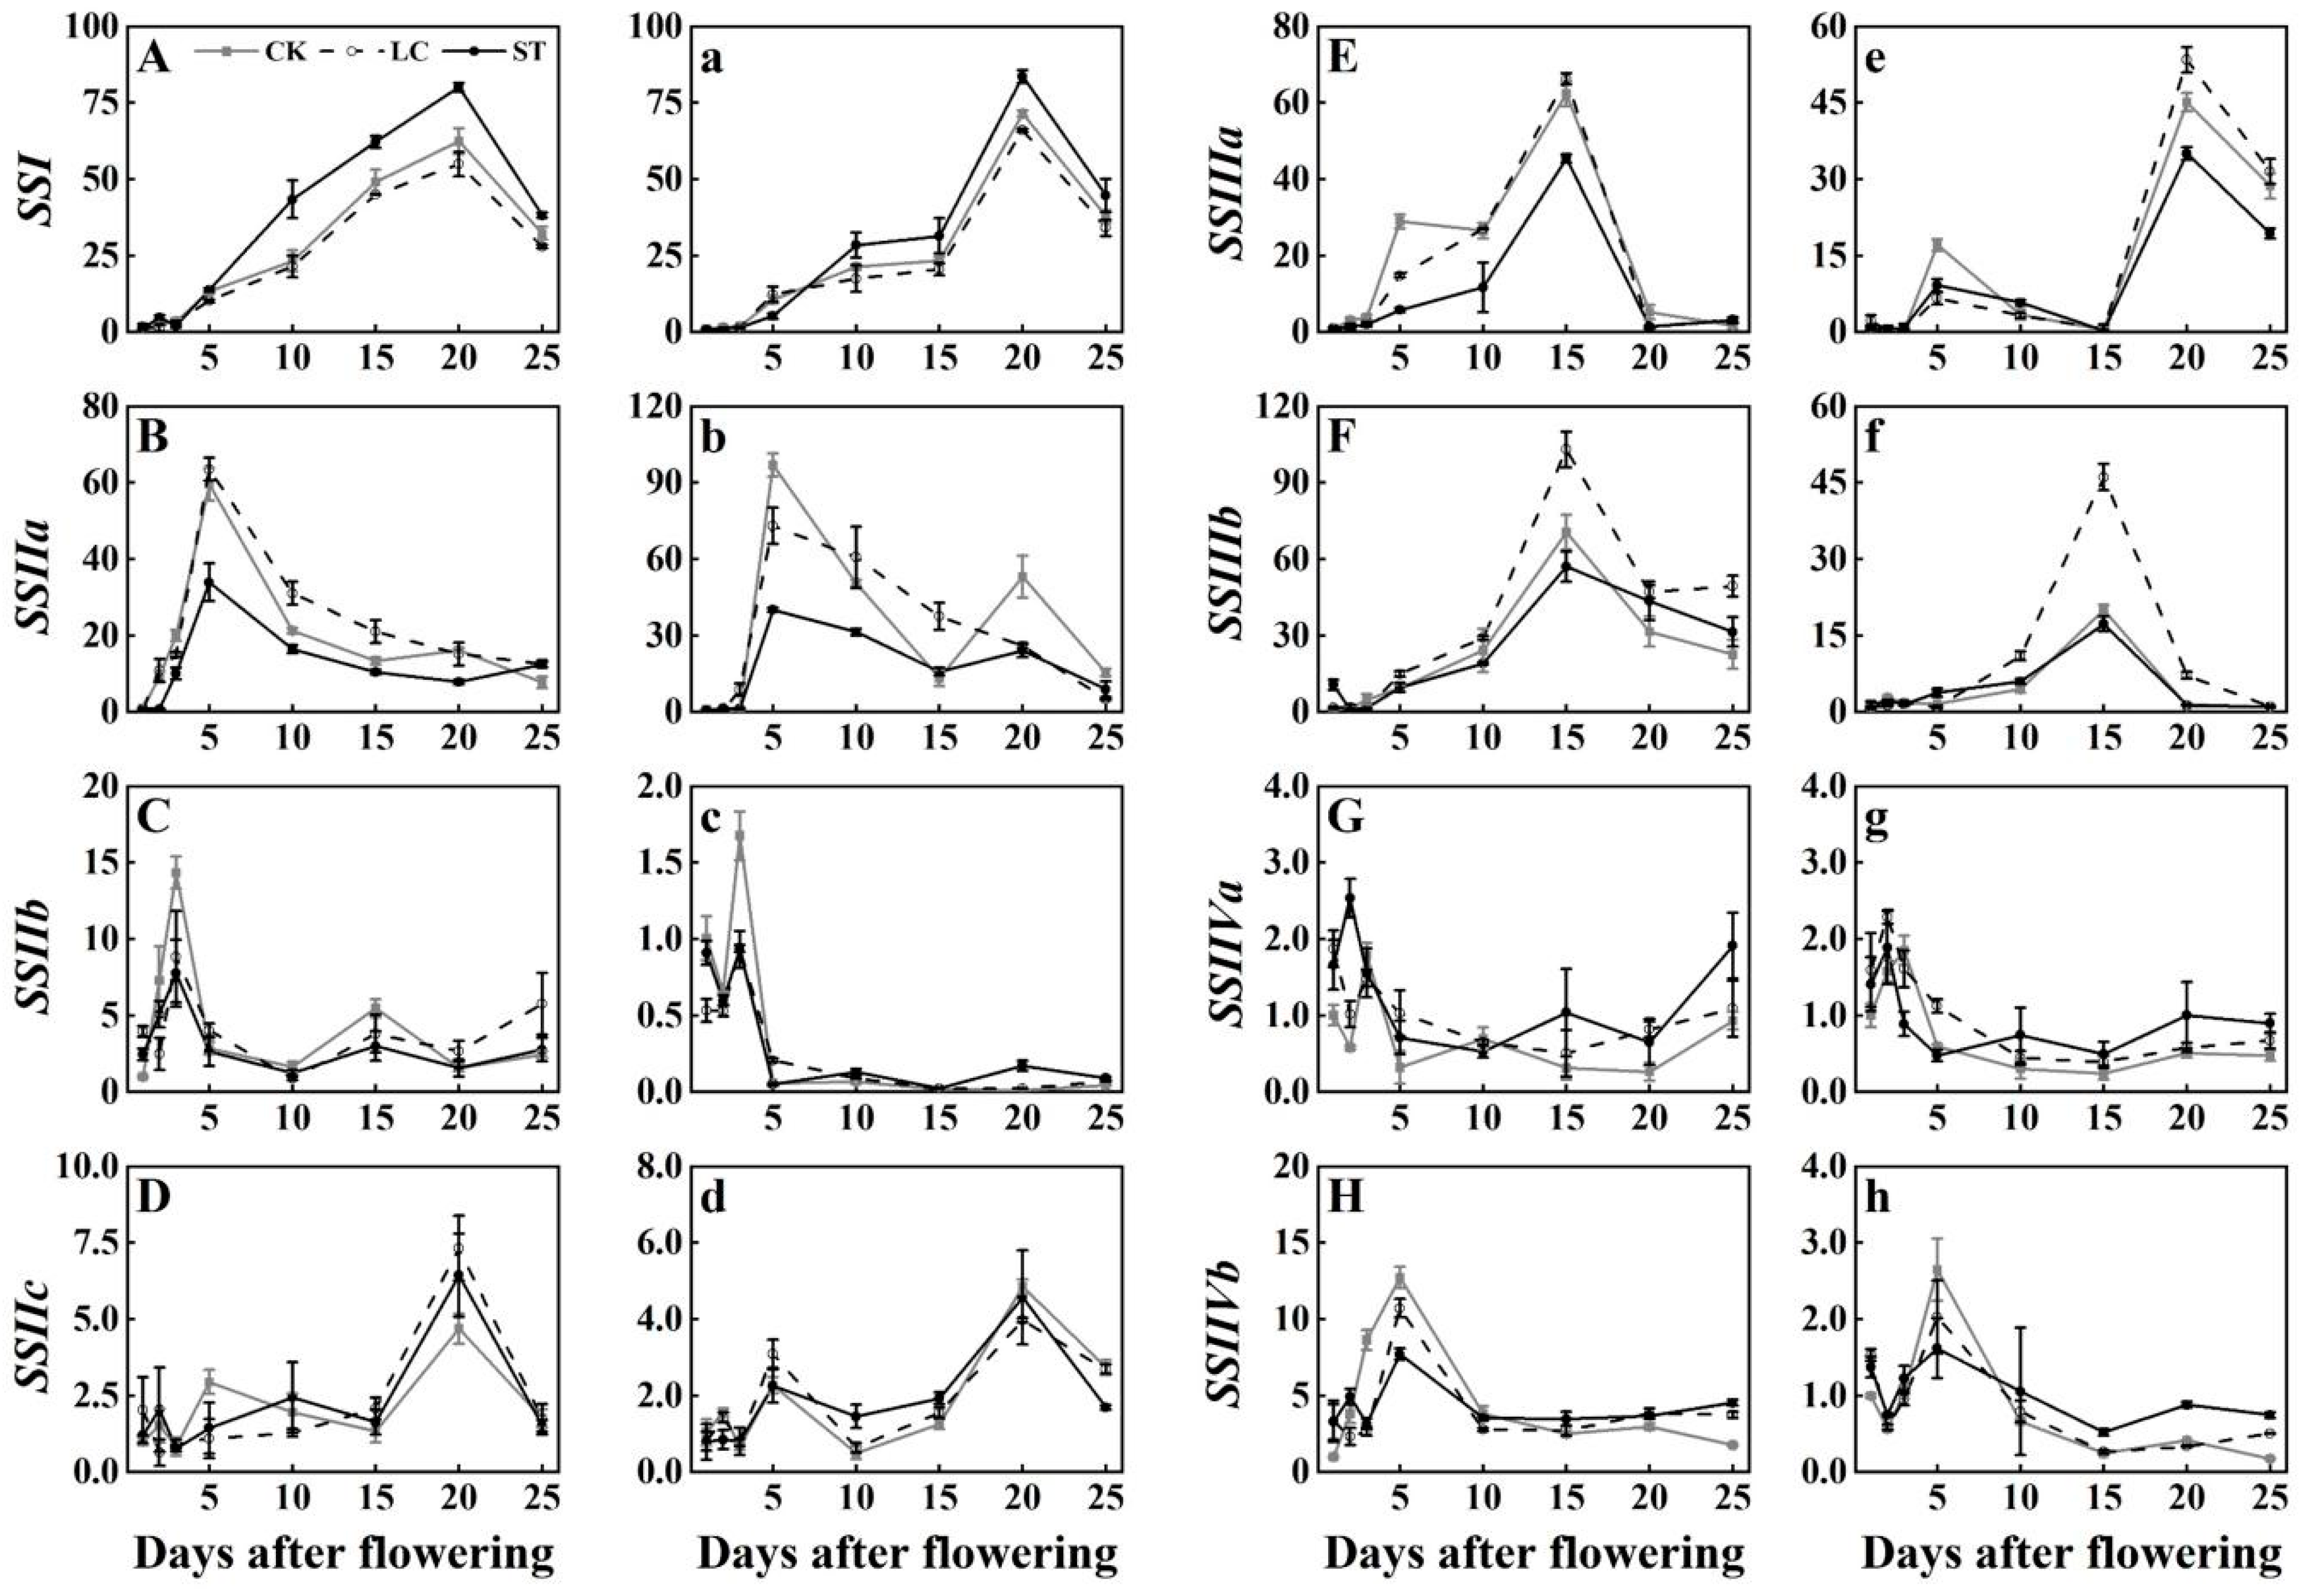
SS comprises eight genes, i.e., OsSSI, OsSSIIa, OsSSIIb, OsSSIIc, OsSSIIIa, OsSSIIIb, OsSSIVa and OsSSIVb. The transcript levels of SS genes are presented in Figure 2. The expression level of SSI gradually increased with grain development, reached the peak at 20 DAF and then decreased to a constant level until the end of endosperm development. Compared with the CK treatment, SSI transcripts were significantly increased under the ST treatment, but slightly decreased under the LC treatment (Figure 2A,a). The transcript level of SSIIa peaked at 5 DAF, but the trends differed between treatments (Figure 2B,b). At 5 DAF, transcripts of SSIIa were significantly down-regulated under the ST treatment compared with the CK and LC treatments. The expression level of SSIIa was much higher for JXY 1 than for YD 6 at 20 DAF under the CK treatment. The expression pattern of the SSIIIa gene showed a typical bimodal distribution. The transcript level of SSIIIa rose to peak at 5 DAF and 15 DAF for YD 6, but reached peak at 5 DAF and 20 DAF for JXY 1 (Figure 2E,e). Compared with the CK treatment, the expression of the SSIIIa gene was significantly down-regulated in the ST treatment, but the effects of LC were not obvious. The expression levels of SSIIb, SSIIc, SSIVa and SSIVb in the endosperm were relatively low, and there was no significant difference between the two varieties (Figure 2C,D,G,H,c,d,g,h). The expression levels of SSIIb, SSIVa and SSIVb were mainly high in the early grain filling stage, while the expression level of SSIIc was high in the late stage of grain filling. The expression level of SSIIIb was low at both early and late stages of grain filling but peaked at 15 DAF (Figure 2F,f). Compared with the CK treatment, the expression level of SSIIIb was significantly up-regulated in the LC treatment and slightly down-regulated in the ST treatment. The above results showed that spikelet-thinning (sink reduction) increased the expression level of SSI but decreased the expression level of SSIIIa. Leaf-cutting (source reduction) increased the expression level of SSIIIb. The expression levels of SSIIb, SSIIc, SSIVa and SSIVb were relatively low in the endosperm.

3.3. Expression Profiles of GBSS Genes

GBSS comprises GBSSI and GBSSII. There were two genes, i.e., OsGBSSI and OsGBSSII, in rice. The expression level of GBSSI showed a typical bimodal distribution with peaks at 5 DAF and 15 DAF (Figure 3). The peak value at 15 DAF was significantly higher than that at 5 DAF, with the same trends in both varieties (Figure 3A,a). At 5–25 DAF, the expression level of GBSSI was mostly down-regulated under the LC treatment and up-regulated under the ST treatment for both varieties when compared to the CK treatment. By contrast, the expression level of GBSSII was generally very low, but peaked around 3 DAF. There were no significant differences in the transcript level of GBSSII between different treatments (Figure 3B,b).

3.4. Expression Profiles of SBE Genes

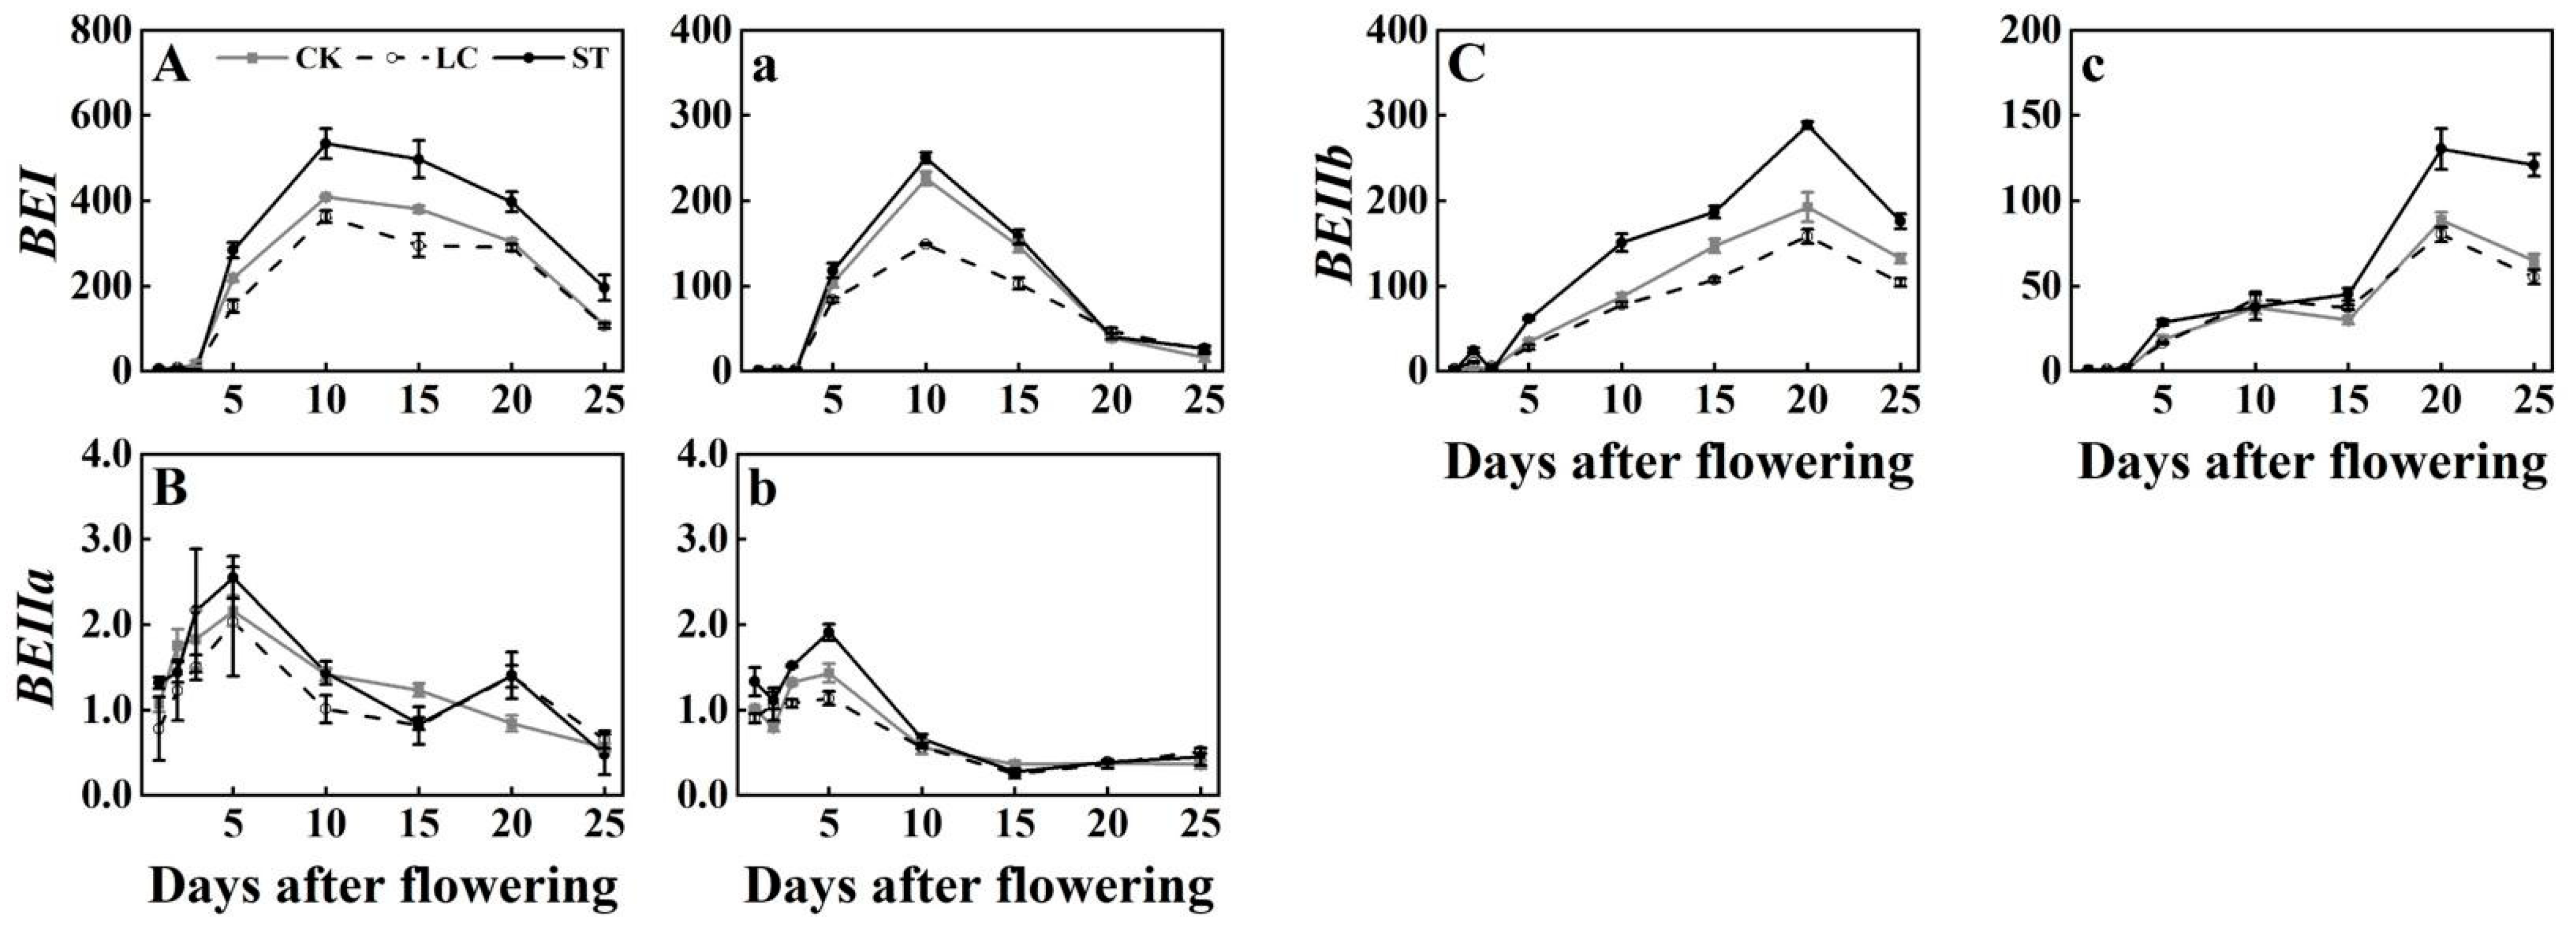
There were two types of SBEs, including BEI (OsBEI) and BEIIs (OsBEIIa and OsBEIIb) in rice. The relative low expression levels of BEI and BEIIb rapidly increased from 3 DAF to peak at 10 and 20 DAF, respectively (Figure 4). Compared with the CK treatment, the expression levels of BEI and BEIIb were significantly up-regulated under the ST treatment and down-regulated under the LC treatment for YD 6 at the middle and late stages of grain filling (Figure 4A,C). BEI transcription significantly reduced at 5–20 DAF under the LC treatment, and BEIIb transcription significantly increased at 15–25 DAF under the ST treatment for JXY 1 (Figure 4a,c). The expression level of BEIIa reached the peak at 5 DAF (Figure 4B,b). At 5 DAF, the ST treatment improved the expression level of BEIIa, while the LC treatment decreased its transcripts for JXY 1. The expression level of BEIIa was low but with the highest value appearing at the early grain filling stage, while the expression level of BEIIb was high and appeared to be the most vigorous at the late stage of grain filling. The above results showed that spikelet-thinning (sink reduction) could increase the expression level of SBE genes.

3.5. Expression Profiles of DBE genes

The DBE genes include ISA and PUL, which differ in substrate specificity. For DBE genes in rice, there are OsISA1, OsISA2, OsISA3 and OsPUL. The expression levels of ISA1 and ISA2 were high at the middle stage of grain filling. The dynamic changes of expression levels of ISA1 were consistent between the two varieties in grain development (Figure 5A,a). The expression level of ISA1 increased from 3 DAF, sharply rose to peak at 10 DAF and then decreased gradually. The expression level of ISA1 was lower in the ST treatment than in the CK treatment, especially at 10 DAF, for both varieties. Compared with the CK treatment, the expression level of ISA2 was up-regulated under the LC treatment (Figure 5B,b). For ISA3, the transcripts peaked at 3DAF and then gradually decreased. There was no significant difference between treatments (Figure 5C,c). The expression level of the PUL gene was high, showing unimodal distribution. The expression level of PUL reached the peak at 10 DAF then began to decline, with a faster rate in JXY 1 than in YD 6 (Figure 5D,d).

3.6. The Observation of the Morphology of Starch Granules

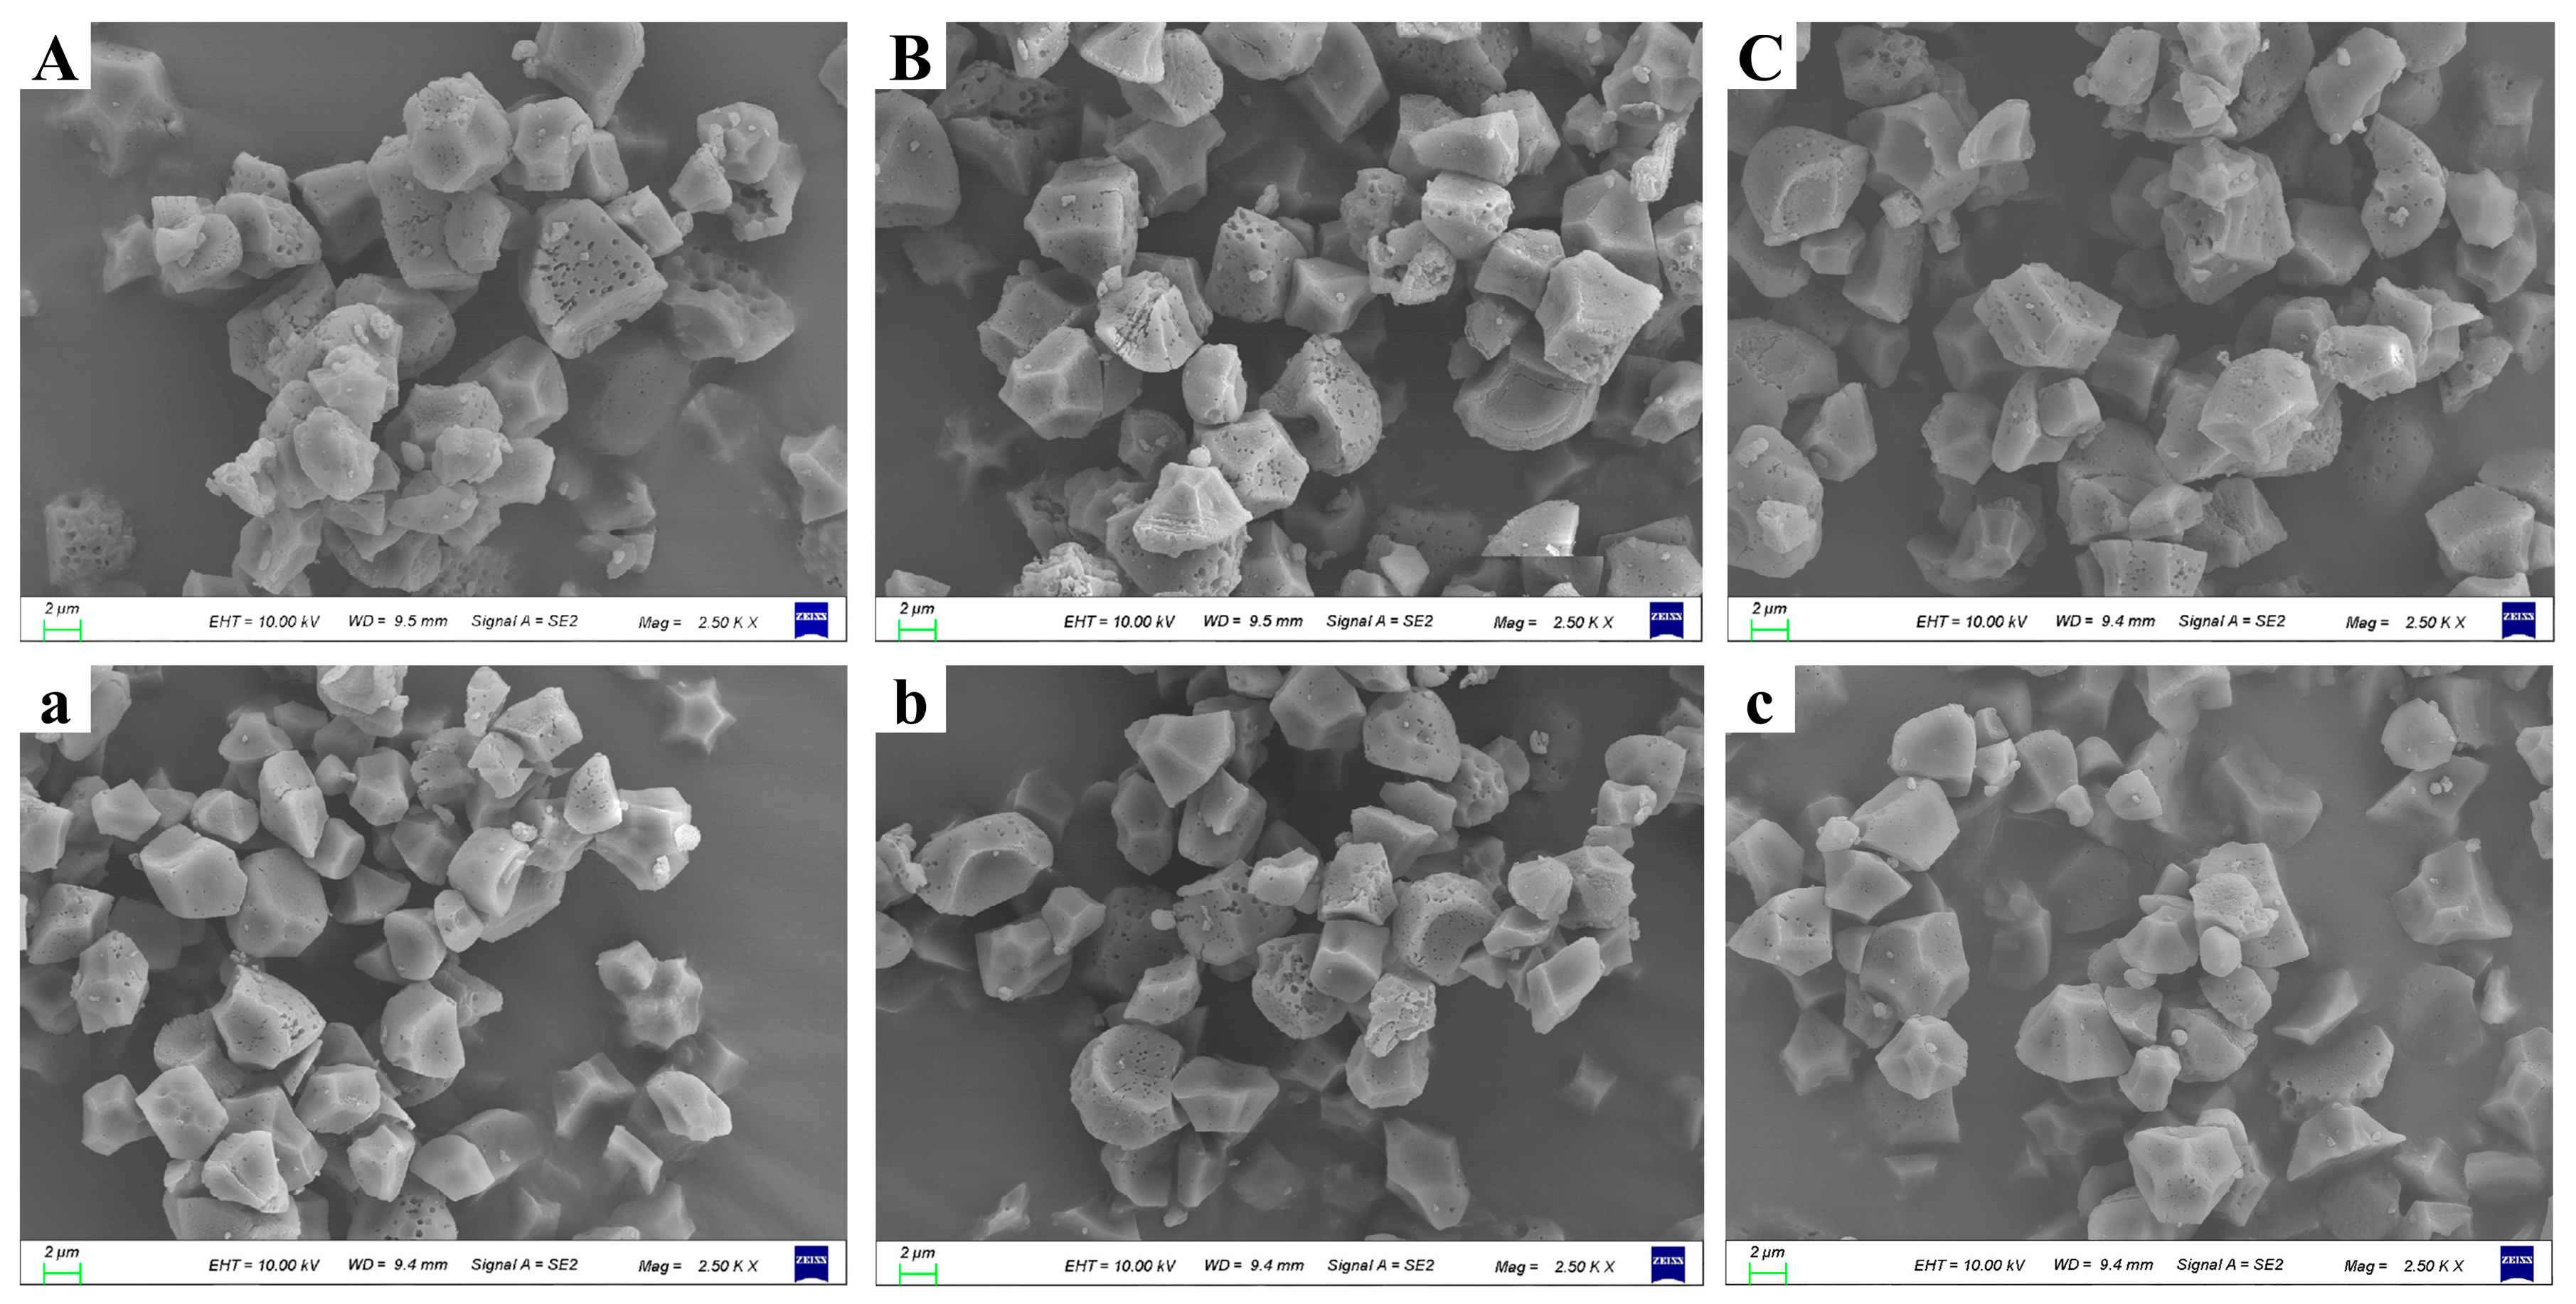
In all the treatments, the starch granules of both rice varieties showed anomalous polygons with small shallow holes on the surface (Figure 6). Compared with the CK treatment, the surfaces of starch granules were smoother with fewer cavities and the starch granules were more complete under the ST treatment, while the opposite results were observed under the LC treatment.

3.7. The Chain Length Distribution (CLD) of Amylopectin

The CLD of amylopectin is presented in Figure 7. According to the degree of polymerization, the chain length of amylopectin after debranching was divided into four categories: A chain (DP 6–12), B1 chain (DP 13–24), B2 chain (DP 25–37) and B3 chain (DP > 37) [46]. Overall, the contents of A and B1 chains of the two varieties showed an increasing trend after anthesis, while the contents of B2 and B3 chains showed a decreasing trend. Compared with CK, the contents of A and B1 chains decreased and the contents of B2 and B3 chains increased under the LC treatment in variety YD 6. The opposite results were valid when comparing ST with the CK treatment in variety YD 6. However, for variety JXY 1, the effects of ST or LC on CLD were not obvious, especially for the contents of B1 chain and B2 chain.

3.8. The XRD Patterns, Relative Crystallinity of Rice Starch and Ordered Structure of Starch External Region

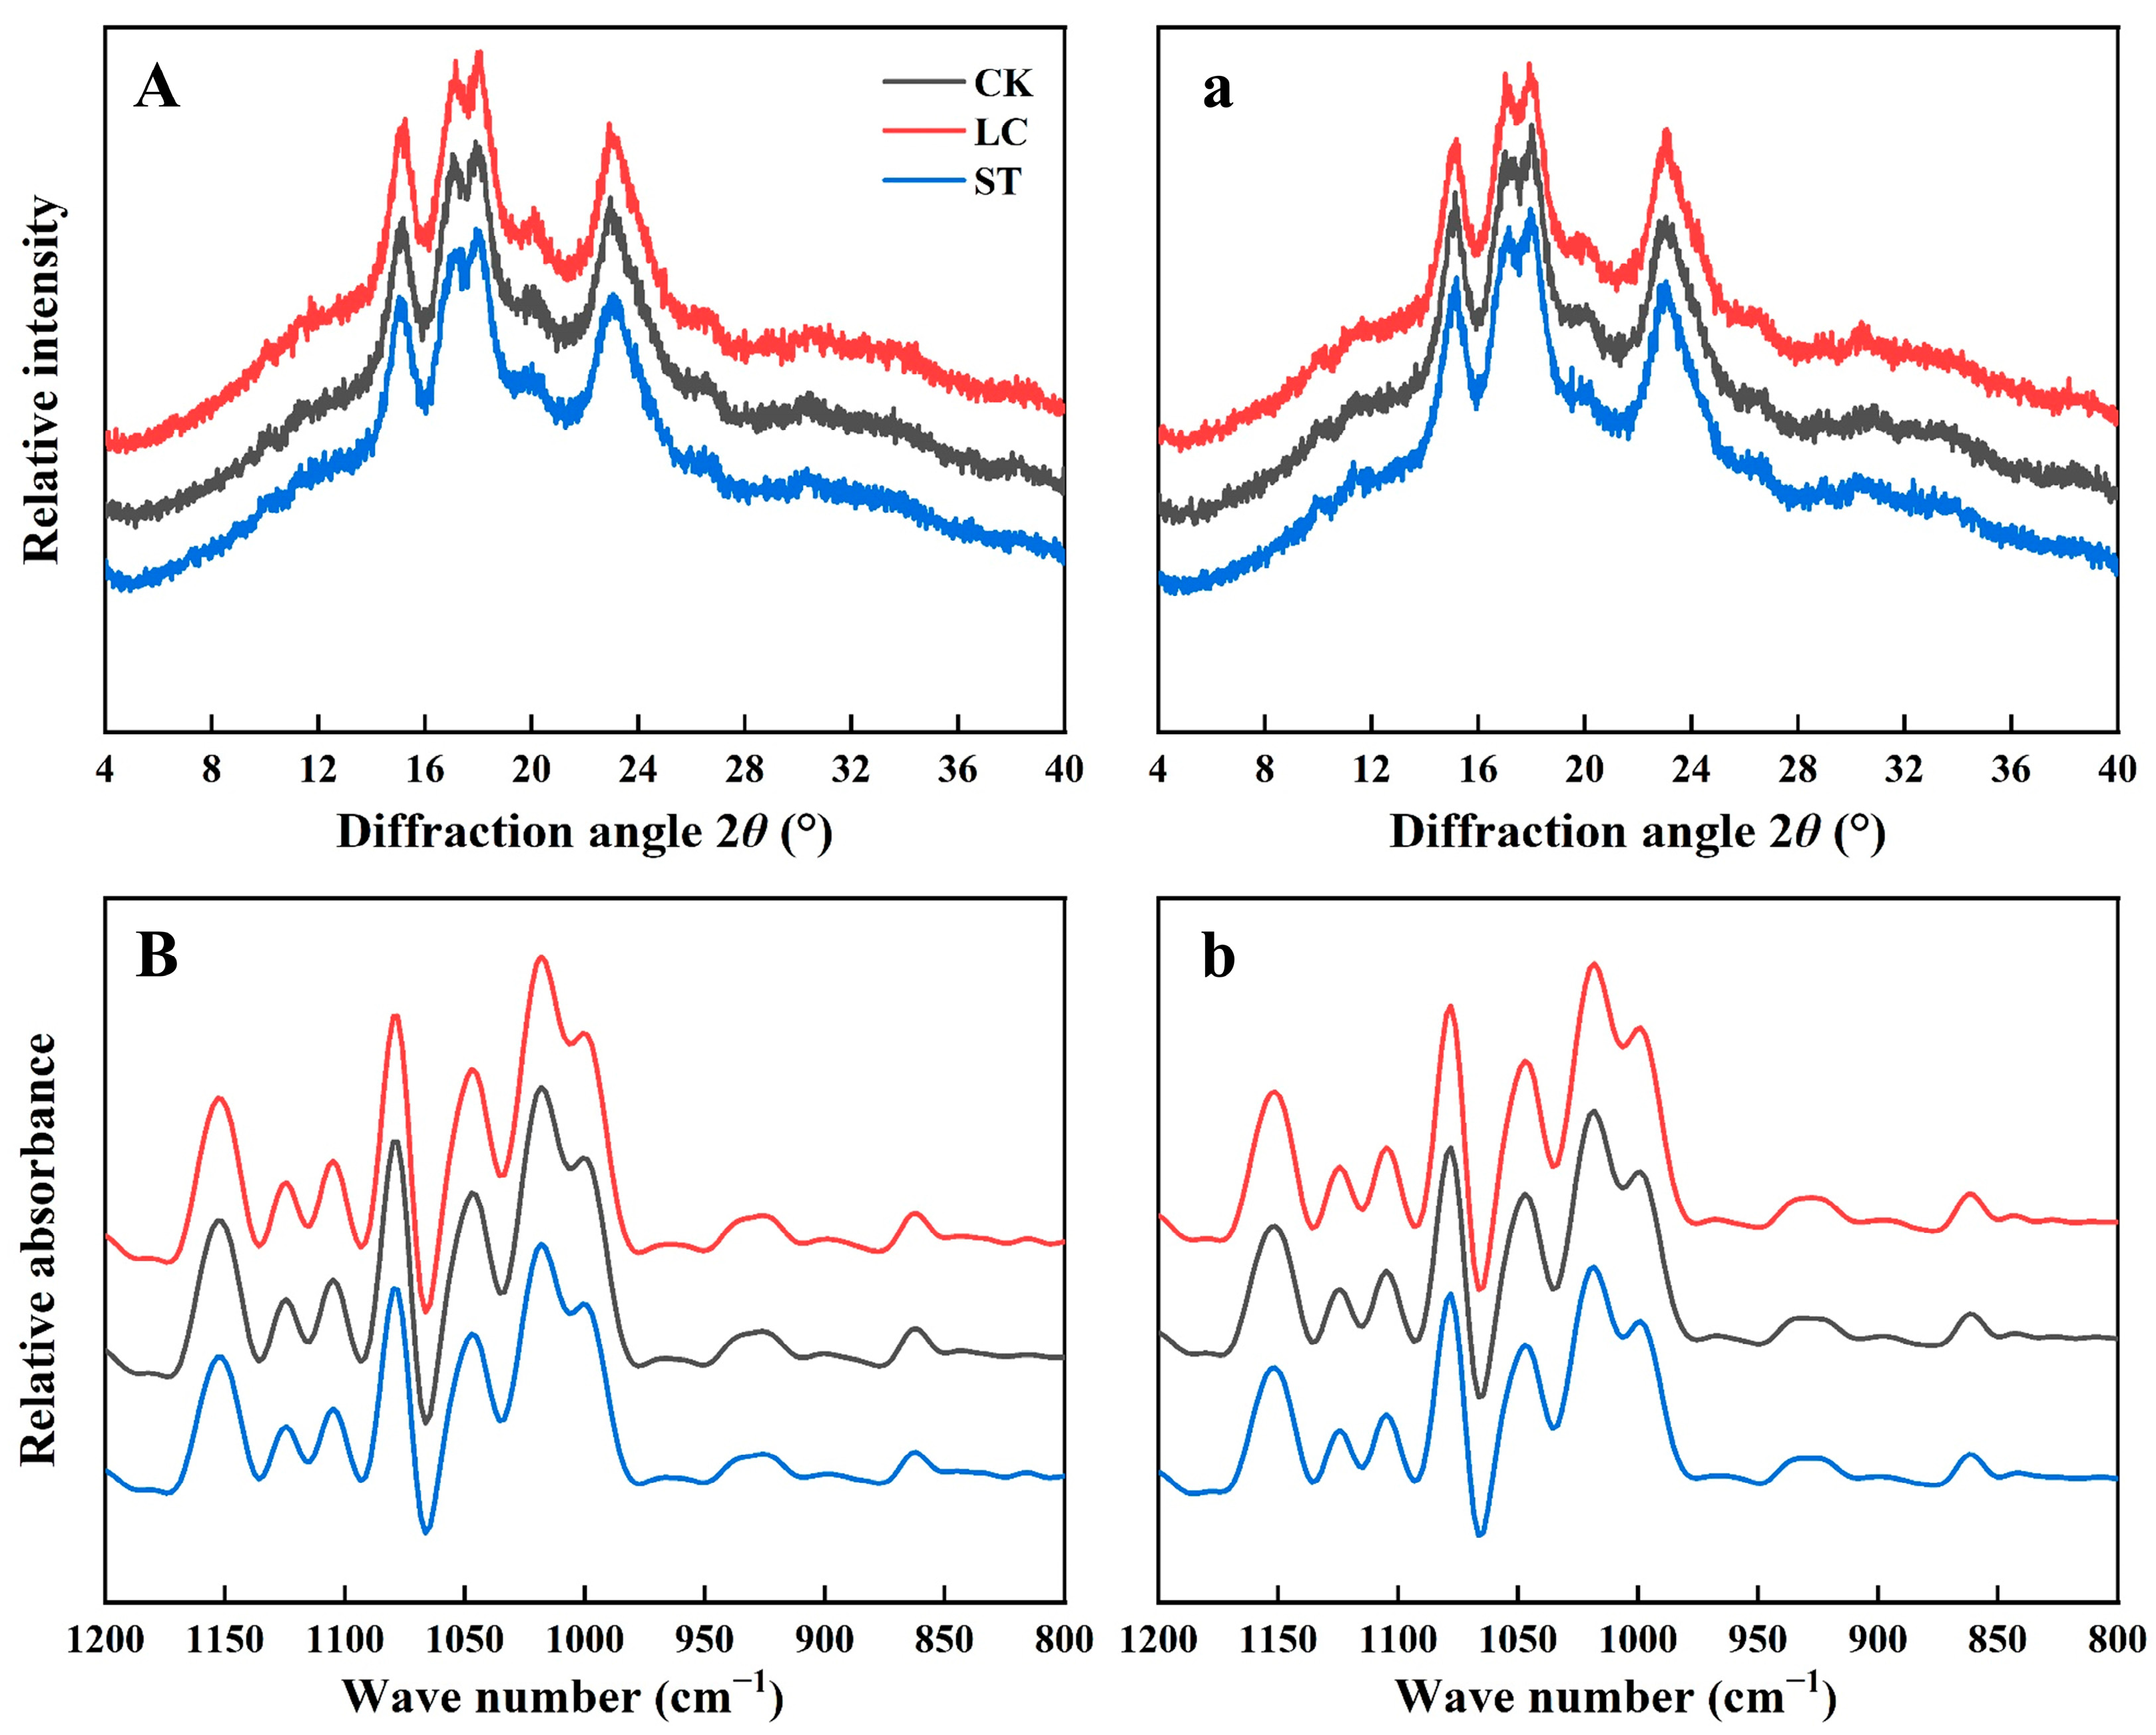
The XRD patterns of both varieties showed A-type, and there were strong reflection peaks at 15° and 23° at 2θ diffraction angle and continuous peaks at 17° and 18° (Figure 8A,a) [47]. The LC and ST treatments did not alter the crystal type. Compared to the CK treatment, the relative crystallinity of YD 6 and JXY 1 were increased by 1.62% and 1.67% under the LC treatment, respectively, but decreased by 5.38% and 5.17% under the ST treatment, respectively (Table 2).
When compared with the CK treatment, the ratios of 1045/1022 cm−1 were significantly increased, but the ratios of 1022/995 cm−1 were significantly decreased (Table 2) under the LC treatment for both varieties. Opposite results were observed in the ST treatment. The ratio of 1045/1022 cm−1 and 1022/995 cm−1 reflected the order of the starch surface layer and the disorder of the starch surface layer, respectively [48]. There were significant differences in the ratio of 1045/1022 cm−1 and 1022/995 cm−1 between the three treatments. The ST treatment could effectively reduce relative crystallinity. In contrast, the LC treatment increased the order of the starch surface structure.

3.9. Starch Pasting Properties

The pasting properties of both rice varieties under different treatments are presented in Table 3. The peak viscosity, hot viscosity, breakdown and final viscosity were, on average, decreased by 5.47%, 3.33%, 13.40% and 3.20%, respectively, when comparing the LC treatment with CK. In contrast, the peak viscosity, hot viscosity, breakdown and final viscosity were, on average, increased by 4.49%, 2.96%, 10.16% and 2.93%, respectively, when comparing the ST treatment with CK. The setback values of YD 6 and JXY 1 were increased by 23.17% and 12.77%, respectively, when comparing LC with CK, but decreased by 16.00% and 7.51%, respectively, when comparing ST with CK. The LC treatment significantly increased the pasting temperature for both varieties, while the ST treatment decreased the value. A high breakdown value reflects low resistance to heating, and setback value indicates the retrogradation of starch paste during cooling. This indicated that leaf-cutting (source reduction) leads to the deterioration of RVA profile characteristics in rice starch, and spikelet-thinning (sink reduction) will improve the viscosity characteristics of rice starch.

3.10. Processing and Appearance Quality of Rice

Compared with the CK treatment, the brown rice rate, milled rice rate and head rice rate were significantly decreased under the LC treatment but significantly increased under the ST treatment (Table 4). The brown rice rate, milled rice rate and head rice rate were decreased by 0.80%, 0.69% and 6.31% for YD 6, and decreased by 1.46%, 1.40% and 3.21% for JXY 1 when comparing LC with the CK treatment. Among all the traits, the LC treatment influenced the trait of head rice rate the most. The results are similar in both varieties.
Compared to the CK treatment, chalkiness area, chalky rice rate and chalkiness were significantly increased under the LC treatment and were significantly decreased under the ST treatment (Table 4). Compared to the CK treatment, the chalkiness area, chalky rice rate and chalkiness were increased by 3.95%, 5.49% and 6.10% for YD 6 and increased by 4.46%, 3.77% and 10.97% for JXY 1 under the LC treatment. The chalkiness area, chalky rice rate and chalkiness were decreased by 4.27%, 4.62% and 15.18% for YD 6 and decreased by 7.11%, 7.66% and 13.13% for JXY 1 when comparing ST with the CK treatment. Among the traits of appearance quality, the chalkiness was mostly influenced by treatments for both varieties. When compared with the CK treatment, the chalkiness was, on average, decreased by 14.15% under the ST treatment but increased by 8.53% under the LC treatment.

3.11. Cooking and Tasting Qualities of Rice

There were no significant differences between the three treatments for protein content in 2019 and 2020. When compared with the CK treatment, the contents of amylose significantly increased for YD 6 under the ST treatment, and the gelatinization consistency decreased under the ST treatment. Compared with the CK treatment, hardness was significantly increased, but stickiness and taste value were decreased under the LC treatment. However, there were no significant differences between the ST and CK treatments (Table 5). There were no significant differences of cooking and tasting qualities between the two years.

4. Discussion

4.1. Effects of the Transcript Levels of Key Starch Metabolic Genes on Chain Length Distribution (CLD) of Amylopectin

Rice starch consists of amylose (20–30%) and amylopectin (70–80%). The fine structure of amylopectin greatly influences physicochemical properties of starch [49]. The SS plays an indispensable role in the synthesis of amylopectin. It extends the length of the chain of amylopectin through the formation of α-1,4 glycosidic bonds and plays an important role in determining the CLD of amylopectin. The contents of A and B1 chains increased after 10 DAF (Figure 7A,B,a,b), whereas the contents of B2 and B3 chains decreased after 10 DAF (Figure 7C,D,c,d). We hypothesized that this may be due to the expression level of the SSI gene, whose expression level was high in the late stage of grain filling (Figure 2A,a). It was reported that the SSI gene contributed to the elongation of short glucan chains, which extended chains of DP 6–7 to DP 8–12 [27,50]. The transcripts of the SSI gene were significantly higher in the ST treatment than in the LC treatment (Figure 2A,a), which resulted in higher contents of A and B1 chains in ST (Figure 7A,a,B,b).
It is reported that SSIIa is involved in the synthesis of medium-length chains (16 < DP < 21) [32]. Miura et al. [51] also reported the roles of the SSIIa gene in the synthesis of medium-length chains of amylopectin with a SSIIa-deficient mutant. In our study, the contents of B1 chain were slightly increased in the middle and late stages of grain filling (Figure 7B,b), which could be related to the low expression level of the SSIIa gene at these stages (Figure 2B,b). The transcript level of SSIII was related to the synthesis of long chains of amylopectin [27]. In this study, it was found that, compared with the CK treatment, the ST treatment significantly down-regulated the expression level of the SSIIIa gene (Figure 2E,e) and the contents of B2 and B3 chains decreased accordingly (Figure 7C,D,c,d). The SSIIIa gene contributes to the extension of B2−B4 chains [29,52,53]. Zhang et al. [54] inhibited the expression of SSIIa and SSIIIa genes by RNA interference, then found that amylopectin content decreased. In our study, spikelet-thinning decreased the expression level of the SSIIIa gene, which increased the amylose content and decreased the contents of B2 and B3 chains.
The structure of amylopectin is not only affected by SS but also regulated by SBEs. Studies [55,56,57] have shown that the BEI gene is involved in the synthesis of B1 chains, forming a cluster structure of amylopectin. The absence of the BEIIa gene influenced transient starch synthesis and had no effect on the synthesis of stored starch. The BEIIb gene plays an important role in the synthesis of A chains of amylopectin. In this study, compared with CK, the LC treatment reduced the expression level of BEI in the middle grain filling stage and the ST treatment increased the expression level of BEIIb in the late stage (Figure 4A,a,C,c), which may be the reasons for the changes of the contents of A and B1 chains in amylopectin (Figure 7A,a,B,b). The ISA1 gene is one of the most important genes that determines starch structure. Cao et al. [58] found that high temperature could significantly up-regulate the expression level of the ISA1 gene, decreasing the contents of B1 chains of amylopectin and increasing the contents of B2 and B3 chains. In this study, the expression of the ISA1 gene was significantly down-regulated under the ST treatment at 5–10 DAF (Figure 5A,a). The above results showed that the LC and ST treatments affected starch synthesis, especially the chain length distribution, by altering transcript levels of isoform genes of starch metabolisms.

4.2. Effects of Source and Sink Strengths on Grain Quality and Starch Physiochemical Properties

The appearance characteristics of rice include grain shape, translucency and chalkiness. During the grain filling stage, a limited supply of carbohydrates for grain filling would cause loosely packed starch granules and result in chalkiness [59]. AGPase is the rate-limiting enzyme in starch biosynthesis. The expression levels of AGPS1, AGPS2b, AGPL1 and AGPL2 genes were higher under the ST treatment than in LC during most times of the grain filling stage (Figure 1A,C–E,a,c–e), which promoted grain filling rate, improved dry matter production and transport during the grain filling stage and decreased chalkiness.
There are few and controversial results on the effects of LC and ST on milling quality. Miao et al. [15] reported that spikelet-thinning had no significant effect on rice milling quality. Chun et al. [60] found that the loosely arranged starch granules reduced the hardness of milled rice, which could be easily broken during milling, and head rice rate would decrease. Jing et al. [61] found that the head rice rate of Wuyunjing 23 was mostly influenced by spikelet removal, which agreed with our study (Table 4). In this study, processing quality of rice decreased significantly in JXY 1 and YD 6 when comparing the LC treatment with CK.
It is reported that the spikelet-thinning (sink-limited) treatment could significantly improve the gelatinization consistency of rice, but it had little effect on the contents of amylose and protein [13]. However, different results were reported in this study (Table 5); the ST treatment decreased gelatinization consistency and increased the amylose content, while opposite results were observed in the LC treatment. All the treatments had no significant effects on the contents of protein. GBSSI is the major gene responsible for the synthesis of amylose [33]. The transcript level of the GBSSI gene was high throughout the grain filling stage (Figure 3A,a). The expression level of GBSSII was low and peaked at 3 DAF (Figure 3B,b). When compared with the CK treatment, the ST treatment increased the expression level of GBSSI, which increased the contents of amylose (Table 5). The changes of the contents of amylose and protein between different treatments could be the main reason for the changes in gelatinization consistency. There were some minor differences in the responses of the gelatinization consistency and amylose content to leaf cutting between YD 6 and JXY 1. YD 6 is a variety with larger panicle sizes, so a higher extent of response to leaf cutting is observed in YD 6 than in JXY 1 (Table 5).
The starch pasting properties were greatly influenced by treatments. This may relate to the higher content of long chains in amylopectin and the higher transcript level of SSIIa under the LC treatment. It was reported that SSIIa was the major gene controlling pasting temperature [62]. Starch pasting temperature increased with increasing branch chain-length of amylopectin [63]. The long chains of amylopectin produced double helix structures with stronger interaction between starch molecules, inhibiting the swelling of starch granules and thus increasing the pasting temperature [40]. Short chains of amylopectin (DP < 11) are not able to form double helices and resulted in defects in the crystalline region and relative lower crystallinity. On the other hand, longer amylopectin chains (DP 16–21) can build a stronger crystalline structure that requires a higher energy to gelatinize [35,64]. This is consistent with our study. The ratio of short-chains to long-chains of amylopectin decreased, the relative crystallinity and the value of 1045/1022 cm−1 increased and the value of 1022/995 cm−1 decreased when comparing LC with the CK treatment (Table 2). These results indicated that leaf-cutting (source reduction) reduced the amorphous structure, increased the stability of starch granules and hardness, but decreased stickiness and taste value, then ultimately deteriorated the cooking and tasting qualities of rice. In conclusion, grain quality could be improved by manipulate source–sink relationships, and we speculated that the improved source strength in terms of higher leaf/canopy photosynthesis and small sink size, such as small panicle size, would be preferred traits in high grain quality rice breeding.

5. Conclusions

The source and sink strength could influence the synthesis of starch and resulted in changes in fine structure and physicochemical properties of starch and grain quality. When comparing ST with the CK treatment, the expression levels of AGPase (AGPS1, AGPS2b, AGPL1, AGPL2, AGPL4) were increased and resulted in increased starch accumulation; the expression levels of short branch-chains of amylopectin synthesis genes (SSI, BEI, and BEIIb) increased, but the expression levels of medium-long and long branch-chains of amylopectin synthesis genes (SSIIa, SSIIIa, SSIIIb, ISA1) decreased; there were higher contents of A and B1 chains of amylopectin and lower contents of B2 and B3 chains of amylopectin with low relative crystallinity and a lower degree of order of structure. For grain quality, when comparing ST with the CK treatment, there were higher values of peak viscosity, hot viscosity, breakdown and final viscosity and lower values of setback and pasting temperature; appearance quality and milling quality were significantly improved. The opposite results were observed in the LC treatment. The above results illustrated the effects of source–sink relationship manipulation on starch synthesis of rice. We clarified the complex correlation between the CLD and the expressions of key enzyme genes of starch metabolism. We also discussed the potential to improve grain quality by exploiting source–sink relationships.

Author Contributions

Conceptualization, J.G., J.Y., Z.W., W.W., W.Z., H.Z. and L.L.; validation, C.L. and X.F.; formal analysis, C.W., J.J. and Z.X.; investigation, C.W. and T.Z.; data curation, C.W.; writing—original draft preparation, C.W.; writing—review and editing, J.G. and J.Y.; visualization, C.W.; supervision, J.G. and J.Y.; project administration, Z.W., W.Z., H.Z. and L.L.; funding acquisition, J.G. and J.Y. All authors have read and agreed to the published version of the manuscript.

Funding

This research was funded by the National Natural Science Foundation of China (32071943, 32272198), R&D Foundation of Jiangsu Province, China (BE2022425), and the Priority Academic Program Development of Jiangsu Higher Education Institutions (PAPD).

Institutional Review Board Statement

Not applicable.

Informed Consent Statement

Not applicable.

Data Availability Statement

The data presented in this study are available upon request from the corresponding author.

Conflicts of Interest

The authors declare no conflict of interest.

Abbreviations

ADPG, ADP-glucose; AGPase, ADP-glucose pyrophosphorylase; CLD, chain length distribution; DAF, days after flowering; DBE, starch debranching enzyme; DP, degree of polymerization; FTIR, Fourier transform infrared; GBSS, granule-bound starch synthase; G1P, glucose-1-phosphate; ISA, isoamylase; PUL, pullulanase; RVA, rapid viscosity analyzer; SBE, starch branching enzyme; SS, soluble starch synthase; SUS, sucrose synthase; UDPG, UDP-glucose; XRD, X-ray diffractometer.

References

  1. Motohide, S.; Gabriel, F.F.; Song, X.J.; Motoyuki, A.; Haruka, N.; Keiki, I.; Tomoyuki, Y.; Mayuko, I.; Hidemi, K.; Akiko, S. A mathematical model of phloem sucrose transport as a new tool for designing rice panicle structure for high grain yield. Plant Cell Physiol. 2015, 56, 605–619. [Google Scholar]
  2. Schnyder, H. The role of carbohydrate storage and redistribution in the source-sink relations of wheat and barley during grain filling-a review. New Phytol. 1993, 123, 233–245. [Google Scholar] [CrossRef]
  3. Kong, L.G.; Wang, F.H.; Feng, B.; Li, S.D.; Si, J.S.; Zhang, B. The structural and photosynthetic characteristics of the exposed peduncle of wheat (Triticum aestivum L.): An important photosynthate source for grain-filling. BMC Plant Biol. 2010, 10, 141–150. [Google Scholar] [CrossRef] [PubMed] [Green Version]
  4. Biswas, A.K.; Mondal, S.K. Regulation by kinetin and abcisic acid of correlative senescence in relation to grain maturation, source-sink relationship and yield of rice (Oryza sativa L.). Plant Growth Regul. 1986, 4, 239–245. [Google Scholar] [CrossRef]
  5. Cui, K.H.; Peng, S.B.; Xing, Y.Z.; Yu, S.B.; Xu, C.G.; Zhang, Q. Molecular dissection of the genetic relationships of source, sink and transport tissue with yield traits in rice. Theor. Appl. Genet. 2003, 106, 649–658. [Google Scholar] [CrossRef]
  6. Nagato, K.; Chaudhry, F.M. Influence of panicle clipping, flag leaf cutting and shading on ripening of japonica and indica rice. Jpn. J. Crop Sci. 1970, 39, 204–212. [Google Scholar] [CrossRef] [Green Version]
  7. Tang, T.; Xie, H.; Wang, Y.X.; Lü, B.; Liang, J.S. The effect of sucrose and abscisic acid interaction on sucrose synthase and its relationship to grain filling of rice (Oryza sativa L.). J. Exp. Bot. 2009, 60, 2641–2652. [Google Scholar] [CrossRef] [PubMed] [Green Version]
  8. Shi, W.J.; Muthurajan, R.; Rahman, H.; Selvam, J.; Peng, S.B.; Zou, Y.B.; Jagadish, K.S.V. Source-sink dynamics and proteomic reprogramming under elevated night temperature and their impact on rice yield and grain quality. New Phytol. 2013, 197, 825–837. [Google Scholar] [CrossRef] [PubMed]
  9. He, A.B.; Wang, W.Q.; Jiang, G.L.; Sun, H.J.; Jiang, M.; Man, J.G.; Cui, K.H.; Huang, J.L.; Peng, S.B.; Nie, L.X. Source-sink regulation and its effects on the regeneration ability of ratoon rice. Field Crop Res. 2019, 236, 155–164. [Google Scholar] [CrossRef]
  10. Gao, B.; Hu, S.W.; Jing, L.Q.; Niu, X.C.; Wang, Y.X.; Zhu, J.G.; Wang, Y.L.; Yang, L.X. Alterations in source-sink relations affect rice yield response to elevated CO2: A free-air CO2 enrichment study. Front. Plant Sci. 2021, 12, 700159. [Google Scholar] [CrossRef]
  11. Liu, K.; Yang, R.; Lu, J.; Wang, X.Y.; Lu, B.L.; Tian, X.H.; Zhang, Y.B. Radiation use efficiency and source-sink changes of super hybrid rice under shade stress during grain-filling stage. Agron J. 2019, 111, 1788–1798. [Google Scholar] [CrossRef]
  12. Liu, Q.H.; Wu, X.; Chen, B.C.; Ma, J.Q.; Gao, J. Effects of low light on agronomic and physiological characteristics of rice including grain yield and quality. Rice Sci. 2014, 21, 243–251. [Google Scholar] [CrossRef]
  13. Tao, L.X.; Wang, X.; Liao, X.Y.; Shen, B.; Tan, H.J.; Huang, S.W. Physiological effects of air temperature and sink-source volume at milk-filling stage of rice on its grain quality. Chin. J. Appl. Ecol. 2006, 17, 647–652, (In Chinese with English Abstract). [Google Scholar]
  14. Yuan, J.C.; Ding, Z.Y.; Zhao, C.; Zhu, Q.S.; Li, J.Q.; Yang, J.C. Effects of sunshine-shading, leaf-cutting and spikelet-removing on yield and quality of rice in the high altitude region. Acta Agron. Sin. 2005, 31, 1429–1436, (In Chinese with English Abstract). [Google Scholar]
  15. Miao, X.J.; Wang, S.H.; Li, G.H.; Ding, Y.F. Effects of spikelet-removing on non-structural carbohydrate translocation in filling stage and grain quality of hybrid rice. Hybrid Rice 2008, 23, 55–59, (In Chinese with English Abstract). [Google Scholar]
  16. Ramesh, M.; Ali, S.Z.; Bhattacharya, K.R. Structure of rice starch and its relation to cooked-rice texture. Carbohyd. Polym. 1999, 38, 337–347. [Google Scholar] [CrossRef]
  17. Zhang, C.Q.; Zhou, L.H.; Lu, Y.; Yang, Y.; Feng, L.H.; Hao, W.Z.; Li, Q.F.; Fan, X.L.; Zhao, D.S.; Liu, Q.Q. Changes in the physicochemical properties and starch structures of rice grains upon pre-harvest sprouting. Carbohyd. Polym. 2020, 234, 115893. [Google Scholar] [CrossRef]
  18. Yao, D.P.; Wu, J.; Luo, Q.H.; Zhang, D.M.; Zhang, W.; Xiao, G.; Deng, Q.Y.; Bai, B. Effects of salinity stress at reproductive growth stage on rice (Oryza sativa L.) composition, starch structure, and physicochemical properties. Front. Nutr. 2022, 9, 926217. [Google Scholar] [CrossRef]
  19. Smith, A.M. Prospects for increasing starch and sucrose yields for bioethanol production. Plant J. Cell Mol. Biol. 2008, 54, 546–558. [Google Scholar] [CrossRef]
  20. Tetlow, I.; Emes, M. Starch biosynthesis in the developing endosperms of grasses and cereals. Agronomy 2017, 7, 81. [Google Scholar] [CrossRef] [Green Version]
  21. Emes, M.J.; Bowsher, C.G.; Hedley, C.; Burrell, M.M., II; Scrase-Field, E.S.F.; Tetlow, I.J. Starch synthesis and carbon partitioning in developing endosperm. J. Exp. Bot. 2003, 54, 569–575. [Google Scholar] [CrossRef] [PubMed] [Green Version]
  22. Li, X.G.; Liu, H.Y.; Jin, Z.X.; Liu, H.L.; Huang, X.; Xu, M.L.; Zhang, F.Z. Changes in activities of key enzymes for starch synthesis and glutamine synthetase in grains of progenies from a rice cross during grain filling. Rice Sci. 2010, 17, 243–246. [Google Scholar] [CrossRef]
  23. Tuncel, A.; Okita, T.W. Improving starch yield in cereals by over-expression of ADPglucose pyrophosphorylase: Expectations and unanticipated outcomes. Plant Sci. 2013, 211, 52–60. [Google Scholar] [CrossRef] [PubMed]
  24. Green, T.W.; Hannah, L.C. Adenosine diphosphate glucose pyrophosphorylase, a rate-limiting step in starch biosynthesis. Physiol. Plantarum. 1998, 103, 574–580. [Google Scholar] [CrossRef]
  25. Lee, S.K.; Hwang, S.K.; Han, M.H.; Eom, J.S.; Kang, H.G.; Han, Y.; Choi, S.B.; Cho, M.H.; Bhoo, S.H.; An, G.; et al. Identification of the ADP-glucose pyrophosphorylase isoforms essential for starch synthesis in the leaf and seed endosperm of rice (Oryza sativa L.). Plant Mol. Biol. 2007, 65, 531–546. [Google Scholar] [CrossRef] [PubMed]
  26. Andersen, J.M.; Larsen, R.; Laudencia, D.; Kim, W.T.; Morrow, D.; Okita, T.W.; Preiss, J. Molecular characterization of the gene encoding a rice endosperm-specific ADPglucose pyrophosphorylase subunit and its developmental pattern of transcription. Gene 1991, 97, 199–205. [Google Scholar] [CrossRef]
  27. Fujita, N.; Yoshida, M.; Asakura, N.; Ohdan, T.; Miyao, A.; Hirochika, H.; Nakamura, Y. Function and characterization of starch synthase I using mutants in rice. Plant Physiol. 2006, 140, 1070–1084. [Google Scholar] [CrossRef] [Green Version]
  28. Nakamura, Y.; Francisco, P.B.; Hosaka, Y.; Sato, A.; Sawada, T.; Kubo, A.; Fujita, N. Essential amino acids of starch synthase IIa differentiate amylopectin structure and starch quality between japonica and indica rice varieties. Plant Mol. Biol. 2005, 58, 213–227. [Google Scholar] [CrossRef]
  29. Fujita, N.; Yoshida, M.; Kondo, T.; Saito, K.; Utsumi, Y.; Tokunaga, T.; Nishi, A.; Satoh, H.; Park, J.H.; Jane, J.L.; et al. Characterization of SSIIIa-deficient mutants of rice: The function of SSIIIa and pleiotropic effects by SSIIIa deficiency in the rice endosperm. Plant Physiol. 2007, 144, 2009–2023. [Google Scholar] [CrossRef] [Green Version]
  30. Yao, S.; Zhang, Y.D.; Lu, K.; Wang, C.L. Progress on the functions, allelic variations and interactions of soluble starch synthases SSIIa and SSIIIa genes in rice. Chin. J. Rice Sci. 2022, 36, 227–236, (In Chinese with English Abstract). [Google Scholar]
  31. Nakamura, T.; Vrinten, P.; Hayakawa, K.; Ikeda, J. Characterization of a granule-bound starch synthase isoform found in the pericarp of wheat. Plant Physiol. 1998, 118, 451–459. [Google Scholar] [CrossRef] [PubMed] [Green Version]
  32. Wang, K.; Hasjim, J.; Wu, A.C.; Li, E.P.; Henry, R.J.; Gilbert, R.G. Roles of GBSSI and SSIIa in determining amylose fine structure. Carbohyd. Polym. 2015, 127, 264–274. [Google Scholar] [CrossRef]
  33. Smith, A.M.; Denyer, K.; Martin, C. The synthesis of the starch granule. Annu. Rev. Plant Physiol. Plant Mol. Biol. 1997, 48, 67–87. [Google Scholar] [CrossRef]
  34. Tanaka, N.; Fujita, N.; Nishi, A.; Satoh, H.; Hosaka, Y.; Ugaki, M.; Kawasaki, S.; Nakamura, Y. The structure of starch can be manipulated by changing the expression levels of starch branching enzyme IIb in rice endosperm. Plant Biotechnol. J. 2004, 2, 507–516. [Google Scholar] [CrossRef]
  35. Boyer, C.; Preiss, J. Biosynthesis of bacterial glycogen. Purification and properties of the Escherichia coli B α-1,4-glucan: α-1,4-glucan 6-glycosyltransferase. Biochemistry 1977, 16, 3693–3699. [Google Scholar] [CrossRef]
  36. Mizuno, K.; Kawasaki, T.; Shimada, H.; Satoh, H.; Kobayashi, E.; Okumura, S.; Arai, Y.; Baba, T. Alteration of the structural properties of starch components by the lack of an isoform of starch branching enzyme in rice seeds. J. Biol. Chem. 1993, 268, 19084–19091. [Google Scholar] [CrossRef]
  37. Jeon, J.S.; Ryoo, N.; Hahn, T.R.; Walia, H.; Nakamura, Y. Starch biosynthesis in cereal endosperm. Plant Physiol. Biochem. 2010, 48, 383–392. [Google Scholar] [CrossRef]
  38. Yang, J.C.; Zhang, J.H. Grain-filling problem in ‘super’ rice. J. Exp. Bot. 2010, 61, 1–5. [Google Scholar] [CrossRef] [PubMed] [Green Version]
  39. Zhou, T.Y.; Zhou, Q.; Li, E.P.; Yuan, L.M.; Wang, W.L.; Zhang, H.; Liu, L.J.; Wang, Z.Q.; Yang, J.C.; Gu, J.F. Effects of nitrogen fertilizer on structure and physicochemical properties of ‘super’ rice starch. Carbohyd. Polym. 2020, 239, 116237. [Google Scholar] [CrossRef]
  40. Jiang, Y.; Chen, Y.; Zhao, C.; Liu, G.M.; Shi, Y.; Zhao, L.T.; Wang, Y.; Wang, W.L.; Xu, K.; Li, G.H.; et al. The starch physicochemical properties between superior and inferior grains of japonica rice under panicle nitrogen fertilizer determine the difference in eating quality. Foods 2022, 11, 2489. [Google Scholar] [CrossRef] [PubMed]
  41. Li, Z.K.; Shen, Y.; Zhang, W.Y.; Zhang, H.; Liu, L.J.; Wang, Z.Q.; Gu, J.F.; Yang, J.C. Effects of long-term straw returning on rice yield and soil properties and bacterial community in a rice-wheat rotation system. Field Crops Res. 2023, 291, 108800. [Google Scholar] [CrossRef]
  42. Tran, T.T.B.; Shelat, K.J.; Tang, D.; Li, E.P.; Gilbert, R.G.; Hasjim, J. Milling of rice grains. The degradation on three structural levels of starch in rice flour can be independently controlled during grinding. J. Agric. Food Chem. 2011, 59, 3964–3973. [Google Scholar] [CrossRef] [PubMed]
  43. Lu, D.L.; Lu, W.P. Effects of protein removal on the physicochemical properties of waxy maize flours. Starch-Stärke 2012, 64, 874–881. [Google Scholar] [CrossRef]
  44. Ohdan, T.; Francisco, P.B.; Sawada, T.; Hirose, T.; Terao, T.; Satoh, H.; Nakamura, Y. Expression profiling of genes involved in starch synthesis in sink and source organs of rice. J. Exp. Bot. 2005, 56, 3229–3244. [Google Scholar] [CrossRef] [Green Version]
  45. Bowsher, C.G.; Scrase-Field, E.F.A.L.; Esposito, S.; Emes, M.J.; Tetlow, I.J. Characterization of ADP-glucose transport across the cereal endosperm amyloplast envelope. J. Exp. Bot. 2007, 58, 1321–1332. [Google Scholar] [CrossRef] [Green Version]
  46. Hanashiro, I.; Abe, J.I.; Hizukuri, S. A periodic distribution of the chain length of amylopectin as revealed by high-performance anion-exchange chromatography. Carbohyd. Res. 1996, 283, 151–159. [Google Scholar] [CrossRef]
  47. Cheetham, N.W.H.; Tao, L.P. Variation in crystalline type with amylose content in maize starch granules: An X-ray powder diffraction study. Carbohyd. Polym. 1998, 36, 277–284. [Google Scholar] [CrossRef]
  48. Sevenou, O.; Hill, S.E.; Farhat, I.A.; Mitchell, J.R. Organisation of the external region of the starch granule as determined by infrared spectroscopy. Int. J. Biol. Macromol. 2002, 31, 79–85. [Google Scholar] [CrossRef]
  49. Jenkins, P.J.; Cameron, R.E.; Donald, A.M. A universal feature in the structure of starch granules from different botanical sources. Starch-Stärke 1993, 45, 417–420. [Google Scholar] [CrossRef]
  50. Cao, H.P.; James, M.G.; Myers, A.M. Purification and characterization of soluble starch synthases from maize endosperm. Arch. Biochem. Biophys. 2000, 373, 135–146. [Google Scholar] [CrossRef]
  51. Miura, S.; Crofts, N.; Saito, Y.; Hosaka, Y.; Oitome, N.F.; Watanabe, T.; Kumamaru, T.; Fujita, N. Starch synthase IIa-deficient mutant rice line produces endosperm starch with lower gelatinization temperature than japonica rice cultivars. Front. Plant Sci. 2018, 9, 645. [Google Scholar] [CrossRef] [Green Version]
  52. Ryoo, N.; Yu, C.; Park, C.S.; Baik, M.Y.; Park, I.M.; Cho, M.H.; Bhoo, S.H.; An, G.; Hahn, T.R.; Jeon, J.S. Knockout of a starch synthase gene OsSSIIIa/Flo5 causes white-core floury endosperm in rice (Oryza sativa L.). Plant Cell Rep. 2007, 26, 1083–1095. [Google Scholar] [CrossRef] [PubMed]
  53. Crofts, N.; Abe, N.; Oitome, N.F.; Matsushima, R.; Hayashi, M.; Tetlow, I.J.; Emes, M.J.; Nakamura, Y.; Fujita, N. Amylopectin biosynthetic enzymes from developing rice seed form enzymatically active protein complexes. J. Exp. Bot. 2015, 66, 4469–4482. [Google Scholar] [CrossRef] [PubMed] [Green Version]
  54. Zhang, G.Y.; Chen, Z.J.; Zhang, X.; Guo, X.P.; Su, N.; Jiang, L.; Mao, L.; Wan, J.M. Double repression of soluble starch synthase genes SSIIa and SSIIIa in rice (Oryza sativa L.) uncovers interactive effects on the physicochemical properties of starch. Genome 2011, 54, 448–459. [Google Scholar] [CrossRef]
  55. Blauth, S.L.; Yao, Y.; Klucinec, J.D.; Shannon, J.C.; Thompson, D.B.; Guilitinan, M.J. Identification of mutator insertional mutants of starch-branching enzyme 2a in corn. Plant Physiol. 2001, 125, 1396–1405. [Google Scholar] [CrossRef]
  56. Satoh, H.; Nishi, A.; Yamashita, K.; Takemoto, Y.; Tanaka, Y.; Hosaka, Y.; Sakurai, A.; Fujita, N.; Nakamura, Y. Starch-branching enzyme I-deficient mutation specifically affects the structure and properties of starch in rice endosperm. Plant Physiol. 2003, 133, 1111–1121. [Google Scholar] [CrossRef] [PubMed] [Green Version]
  57. Jiang, H.Y.; Zhang, J.; Wang, J.M.; Xia, M.; Zhu, S.W.; Cheng, B.J. RNA interference-mediated silencing of the starch branching enzyme gene improves amylose content in rice. Genet. Mol. Res. 2013, 12, 2800–2808. [Google Scholar] [CrossRef]
  58. Cao, Z.Z.; Pan, G.; Wang, F.B.; Wei, K.S.; Li, Z.W.; Shi, C.H.; Geng, W.; Cheng, F.M. Effect of high temperature on the expressions of genes encoding starch synthesis enzymes in developing rice endosperms. J. Integr. Agric. 2015, 14, 642–659. [Google Scholar] [CrossRef]
  59. Raju, G.N.; Srinivas, T. Effect of physical, physiological, and chemical factors on the expression of chalkiness in rice. Cereal Chem. 1991, 68, 210–211. [Google Scholar]
  60. Chun, A.; Song, J.; Kim, K.J.; Lee, H.J. Quality of head and chalky rice and deterioration of eating quality by chalky rice. J. Crop Sci. Biotechnol. 2009, 12, 235–240. [Google Scholar] [CrossRef]
  61. Jing, L.Q.; Zhen, W.Y.; Zhuang, S.T.; Wang, Y.X.; Zhu, J.G.; Wang, Y.L.; Yang, L.X. Effects of CO2 enrichment and spikelet removal on rice quality under open-air field conditions. J. Integr. Agric. 2016, 15, 2012–2022. [Google Scholar] [CrossRef] [Green Version]
  62. Tian, Z.X.; Qian, Q.; Liu, Q.Q.; Yan, M.X.; Liu, X.F.; Yan, C.J.; Liu, G.F.; Gao, Z.Y.; Tang, S.Z.; Zeng, D.L.; et al. Allelic diversities in rice starch biosynthesis lead to a diverse array of rice eating and cooking qualities. Proc. Natl. Acad. Sci. USA 2009, 106, 21760–21765. [Google Scholar] [CrossRef] [PubMed] [Green Version]
  63. Jane, J.; Chen, Y.Y.; Lee, L.F.; Mcpherson, A.E.; Wong, K.S.; Radosavljevic, M.; Kasemsuwan, T. Effects of amylopectin branch chain length and amylose content on the gelatinization and pasting properties of starch. Cereal Chem. 1999, 76, 629–637. [Google Scholar] [CrossRef]
  64. Witt, T.; Doutch, J.; Gilbert, E.P.; Gilbert, R.G. Relations between molecular, crystalline, and lamellar structures of amylopectin. Biomacromolecules 2012, 13, 4273–4282. [Google Scholar] [CrossRef] [PubMed]
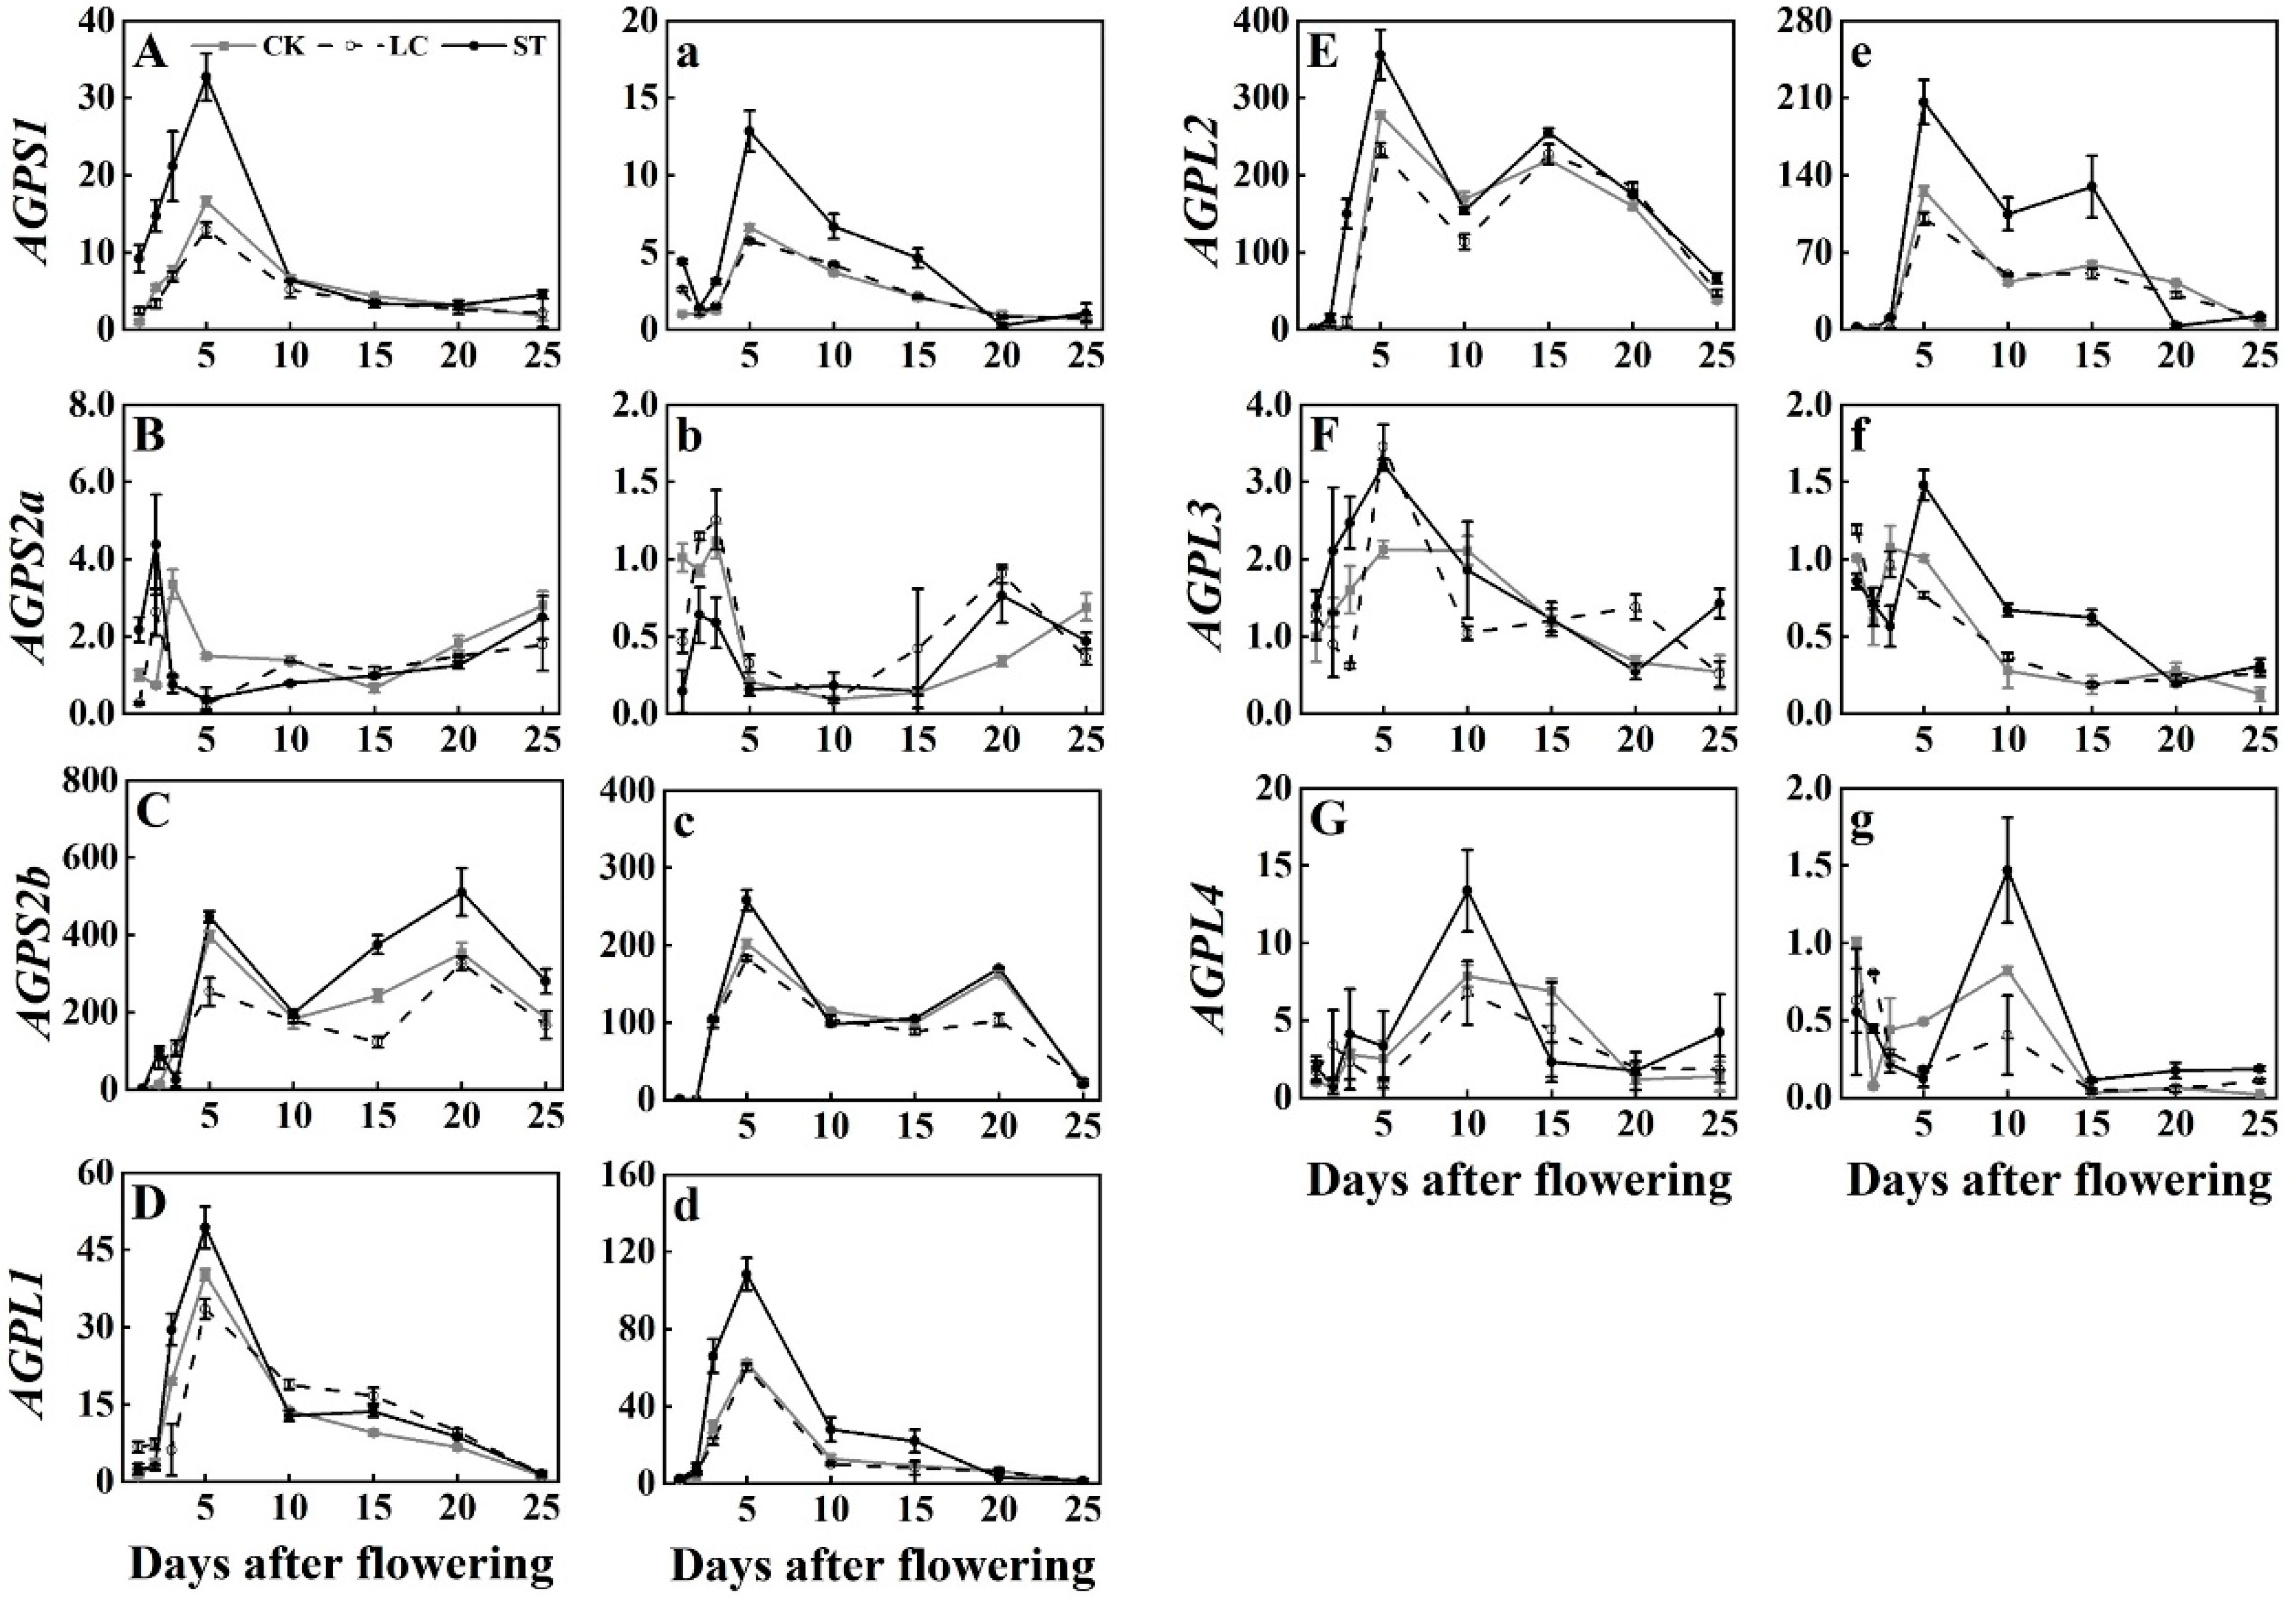
Figure 1. Expression profiles of AGPase genes during development of rice seeds under CK, leaf-cutting (LC) and spikelet-thinning (ST) of rice variety YD 6 (AG) and JXY 1 (ag). DAF, days after flowering.
Agronomy 13 01288 g001
Figure 2. Expression profiles of SS genes during development of rice seeds under CK, leaf-cutting (LC) and spikelet-thinning (ST) of rice varieties YD 6 (AH) and JXY 1 (ah). DAF, days after flowering.
Agronomy 13 01288 g002
Figure 3. Expression profiles of GBSS genes during development of rice seeds under CK, leaf-cutting (LC) and spikelet-thinning (ST) of rice varieties YD 6 (A,B) and JXY 1 (a,b). DAF, days after flowering.
Agronomy 13 01288 g003
Figure 4. Expression profiles of SBE genes during development of rice seeds under CK, leaf-cutting (LC) and spikelet-thinning (ST) of rice varieties YD 6 (AC) and JXY 1 (ac). DAF, days after flowering.
Agronomy 13 01288 g004
Figure 5. Expression profiles of DBE genes (ISA and PUL) during development of rice seeds under CK, leaf-cutting (LC) and spikelet-thinning (ST) of rice varieties YD 6 (AD) and JXY 1 (ad). DAF, days after flowering.
Agronomy 13 01288 g005
Figure 6. The morphology of starch granules under CK (A,a), leaf-cutting (LC, (B,b)) and spikelet-thinning (ST, (C,c)) of rice varieties YD 6 (AC) and JXY 1 (ac).
Agronomy 13 01288 g006
Figure 7. The dynamic changes of contents of A chain (A,a), B1 chain (B,b), B2 chain (C,c) and B3 chain (D,d) of amylopectin under CK, leaf-cutting (LC) and spikelet-thinning (ST) of rice varieties YD 6 (AD) and JXY 1 (ad). DAF, days after flowering.
Agronomy 13 01288 g007
Figure 8. The XRD patterns (A,a) and FTIR spectra of starch (B,b) under CK, leaf-cutting (LC) and spikelet-thinning (ST) of rice varieties YD 6 (A,B) and JXY 1 (a,b).
Agronomy 13 01288 g008
Table 1. Starch metabolic-related genes and their primer sequences.
Gene NameForward PrimerReverse Primer
OsAGPS1F: 5′-GTGCCACTTAAAGGCACCATT-3′R: 5′-CCCACATTTCAGACACGGTTT-3′
OsAGPS2aF: 5′-ACTCCAAGAGCTCGCAGACC-3′R: 5′-GCCTGTAGTTGGCACCCAGA-3′
OsAGPS2bF: 5′-AACAATCGAAGCGCGAGAAA-3′R: 5′-GCCTGTAGTTGGCACCCAGA-3′
OsAGPL1F: 5′-GGAAGACGGATGATCGAGAAAG-3′R: 5′-CACATGAGATGCACCAACGA-3′
OsAGPL2F: 5′-AGTTCGATTCAAGACGGATAGC-3′R: 5′-CGACTTCCACAGGCAGCTTATT-3′
OsAGPL3F: 5′-AAGCCAGCCATGACCATTTG-3′R: 5′-CACACGGTAGATTCACGAGACAA-3′
OsAGPL4F: 5′-TCAACGTCGATGCAGCAAAT-3′R: 5′-ATCCCTCAGTTCCTAGCCTCATT-3′
OsSSIF: 5′-GGGCCTTCATGGATCAACC-3′R: 5′-CCGCTTCAAGCATCCTCATC-3′
OsSSIIaF: 5′-GCTTCCGGTTTGTGTGTTCA-3′R: 5′-CTTAATACTCCCTCAACTCCACCAT-3′
OsSSIIbF: 5′-TAGGAGCAACGGTGGAAGTGA-3′R: 5′-GTGAACGTGAGTACGTGACCAAT-3′
OsSSIIcF: 5′-GACCGAAATGCCTTTTTCTCG-3′R: 5′-GGGCTTGGAGCCTCTCCTTA-3′
OsSSIIIaF: 5′-GCCTGCCCTGGACTACATTG-3′R: 5′-GCAAACATATGTACACGGTTCTGG-3′
OsSSIIIbF: 5′-ATTCCGCTCGCAAGAACTGA-3′R: 5′-CAACCGCAGGATAACGGAAA-3′
OsSSIIVaF: 5′-GGGAGCGGCTCAAACATAAA-3′R: 5′-CCGTGCACTGACTGCAAAAT-3′
OsSSIIVbF: 5′-ATGCAGGAAGCCGAGATGTT-3′R: 5′-ACGACAATGGGTGCCAAGAT-3′
OsGBSSIF: 5′-AACGTGGCTGCTCCTTGAA-3′R: 5′-TTGGCAATAAGCCACACACA-3′
OsGBSSIIF: 5′-AGGCATCGAGGGTGAGGAG-3′R: 5′-CCATCTGGCCCACATCTCTA-3′
OsBEIF: 5′-TGGCCATGGAAGAGTTGGC-3′R: 5′-CAGAAGCAACTGCTCCACC-3′
OsBEIIaF: 5′-GCCAATGCCAGGAAGATGA-3′R: 5′-GCGCAACATAGGATGGGTTT-3′
OsBEIIbF: 5′-ATGCTAGAGTTTGACCGC-3′R: 5′-AGTGTGATGGATCCTGCC-3′
OsISA1F: 5′-TGCTCAGCTACTCCTCCATCATC-3′R: 5′-AGGACCGCACAACTTCAACATA-3′
OsISA2F: 5′-TAGAGGTCCTCTTGGAGG-3′R: 5′-AATCAGCTTCTGAGTCACCG-3′
OsISA3F: 5′-ACAGCTTGAGACACTGGGTTGAG-3′R: 5′-GCATCAAGAGGACAACCATCTG-3′
OsPULF: 5′-ACCTTTCTTCCATGCTGG-3′R: 5′-CAAAGGTCTGAAAGATGGG-3′
ActinF: 5′-CTGACAGGATGAGCAAGGAG-3′R: 5′-GGCAATCCACATCTGCTGGA-3′
Table 2. The relative crystallinity and infrared ratio of rice starch under CK, leaf-cutting (LC) and spikelet-thinning (ST) of rice varieties YD 6 and JXY 1.
VarietyTreatmentRelative
Crystallinity (%)
Infrared Ratio
1045/1022 cm−11022/995 cm−1
YD 6CK29.01 ± 0.04 b0.715 ± 0.002 b1.361 ± 0.011 b
LC29.48 ± 0.05 a0.745 ± 0.015 a1.328 ± 0.005 c
ST27.45 ± 0.07 c0.682 ± 0.006 c1.420 ± 0.007 a
JXY 1CK28.82 ± 0.07 b0.696 ± 0.006 b1.405 ± 0.012 b
LC29.30 ± 0.06 a0.745 ± 0.021 a1.355 ± 0.027 c
ST27.33 ± 0.02 c0.662 ± 0.011 c1.444 ± 0.011 a
Values in the same varieties and column with different letters are significantly different (p < 0.05).
Table 3. Starch pasting properties of rice varieties YD 6 and JXY 1 under CK, leaf-cutting (LC) and spikelet-thinning (ST).
VarietyTreatmentPeak Viscosity
(cP)
Hot Viscosity
(cP)
Breakdown
(cP)
Final Viscosity
(cP)
Setback
(cP)
Peaking Time (s)Pasting
Temperature (°C)
YD 6CK2715.33 ± 17.04 b2146.33 ± 7.09 b569.00 ± 14.73 b2957.00 ± 20.42 b241.67 ± 9.07 b7.00 ± 0.23 a76.25 ± 0.09 b
LC2559.00 ± 10.82 c2054.33 ± 13.20 c504.67 ± 13.05 c2856.67 ± 10.69 c297.67 ± 26.08 a6.97 ± 0.06 a77.28 ± 0.16 a
ST2845.33 ± 28.01 a2214.67 ± 11.50 a630.67 ± 8.08 a3048.33 ± 26.58 a203.00 ± 19.08 b6.96 ± 0.04 a75.10 ± 0.15 c
JXY 1CK2787.00 ± 13.00 b2189.00 ± 8.72 b598.00 ± 13.53 b3173.33 ± 11.37 b386.33 ± 14.57 b6.34 ± 0.22 a76.43 ± 0.29 b
LC2642.33 ± 16.86 c2137.00 ± 19.00 c505.33 ± 16.86 c3078.00 ± 24.27 c435.67 ± 7.51 a6.27 ± 0.14 a77.10 ± 0.11 a
ST2903.67 ± 16.17 a2249.00 ± 27.07 a654.67 ± 19.09 a3261.00 ± 17.06 a357.33 ± 11.93 c6.24 ± 0.16 a75.30 ± 0.21 c
Values in the same varieties and column with different letters are significantly different (p < 0.05).
Table 4. Processing and appearance quality of rice varieties YD 6 and JXY 1 under CK, leaf-cutting (LC) and spikelet-thinning (ST).
VarietyTreatmentProcessing QualityAppearance Quality
Brown Rice
Rate (%)
Milled Rice
Rate (%)
Head Rice
Rate (%)
Chalkiness
Area (%)
Chalky Rice
Rate (%)
Chalkiness
(%)
YD 6CK81.19 ± 0.03 b74.12 ± 0.08 b69.74 ± 0.04 b25.55 ± 0.11 b26.43 ± 0.03 b7.38 ± 0.06 b
LC80.54 ± 0.04 c73.61 ± 0.04 c65.34 ± 0.03 c26.56 ± 0.04 a27.88 ± 0.10 a7.83 ± 0.10 a
ST81.64 ± 0.03 a74.44 ± 0.08 a71.21 ± 0.02 a24.46 ± 0.05 c25.21 ± 0.09 c6.26 ± 0.05 c
JXY 1CK83.69 ± 0.10 b75.80 ± 0.09 b71.41 ± 0.05 b23.77 ± 0.12 b24.92 ± 0.11 b6.93 ± 0.06 b
LC82.47 ± 0.03 c74.74 ± 0.04 c69.12 ± 0.12 c24.83 ± 0.06 a25.86 ± 0.06 a7.69 ± 0.09 a
ST84.34 ± 0.08 a76.97 ± 0.04 a72.41 ± 0.09 a22.08 ± 0.02 c23.01 ± 0.12 c6.02 ± 0.02 c
Values in the same varieties and column with different letters are significantly different (p < 0.05).
Table 5. Cooking and tasting qualities of rice varieties YD 6 and JXY 1 under CK, leaf-cutting (LC) and spikelet-thinning (ST).
YearVarietyTreatmentProtein
Content (%)
Gelatinization
Consistency (mm)
Amylose
Content (%)
Hardness
(g)
Stickiness
(g)
Taste
Value
2019YD 6CK10.31 ± 0.09 a63.50 ± 0.45 b15.43 ± 0.15 b6.57 ± 0.06 b5.20 ± 0.10 a50.00 ± 0.87 a
LC10.22 ± 0.29 a64.88 ± 0.26 a14.98 ± 0.11 c7.00 ± 0.10 a4.63 ± 0.12 b42.00 ± 1.73 b
ST10.44 ± 0.23 a62.60 ± 0.19 c16.04 ± 0.23 a6.67 ± 0.06 b5.13 ± 0.15 a48.00 ± 1.00 a
JXY 1CK9.84 ± 0.28 a65.38 ± 0.48 a13.26 ± 0.14 b6.37 ± 0.06 b5.27 ± 0.15 a54.00 ± 0.50 a
LC9.68 ± 0.14 a66.04 ± 0.21 a13.18 ± 0.13 b7.03 ± 0.06 a4.70 ± 0.10 b46.00 ± 0.50 b
ST9.97 ± 0.10 a62.85 ± 0.49 b13.73 ± 0.19 a6.40 ± 0.10 b5.07 ± 0.15 a54.00 ± 0.50 a
2020YD 6CK10.34 ± 0.17 a63.52 ± 0.30 b15.58 ± 0.21 b6.60 ± 0.10 b5.17 ± 0.06 a49.50 ± 0.50 a
LC10.26 ± 0.20 a65.18 ± 0.42 a15.06 ± 0.20 c7.07 ± 0.06 a4.53 ± 0.06 b41.00 ± 1.00 b
ST10.43 ± 0.21 a62.57 ± 0.33 c16.17 ± 0.18 a6.70 ± 0.10 b5.10 ± 0.10 a47.83 ± 0.29 a
JXY 1CK9.74 ± 0.20 a65.54 ± 0.48 a13.43 ± 0.15 ab6.33 ± 0.06 b5.33 ± 0.06 a54.33 ± 0.29 a
LC9.64 ± 0.20 a66.58 ± 0.44 a13.30 ± 0.19 b7.00 ± 0.10 a4.73 ± 0.12 b46.50 ± 0.50 b
ST9.80 ± 0.18 a63.27 ± 0.31 b13.86 ± 0.18 a6.33 ± 0.06 b5.17 ± 0.06 a54.17 ± 0.29 a
Analysis of variance
Year (Y)NSNSNSNSNSNS
Variety (V)56.14 **89.14 **301.96 **51.61 **4.71 *268.34 **
Treatment (T) NS158.60 **55.18 **181.65 **87.89 **263.08 **
Y × VNSNSNSNSNSNS
Y × TNSNSNSNSNSNS
V × TNS10.65 **5.87 **11.56 **NS3.56 *
Y × V × TNSNSNSNSNSNS
Values in the same varieties and column with different letters are significantly different (p < 0.05). *, significant at p < 0.05 level; **, significant at p < 0.01 level; NS, not statistically significant.
Disclaimer/Publisher’s Note: The statements, opinions and data contained in all publications are solely those of the individual author(s) and contributor(s) and not of MDPI and/or the editor(s). MDPI and/or the editor(s) disclaim responsibility for any injury to people or property resulting from any ideas, methods, instructions or products referred to in the content.