Article

Understanding the Physiological Mechanisms of Canopy Light Interception and Nitrogen Distribution Characteristics of Different Maize Varieties at Varying Nitrogen Application Levels

1
Institute of Crop Science, Chinese Academy of Agricultural Sciences/Key Laboratory of Crop Physiology and Ecology, Ministry of Agriculture and Rural Affairs, Beijing 100081, China
2
College of Agronomy, Resource and Environment, Tianjin Agricultural University, Tianjin 300384, China
3
College of Agronomy and Biotechnology, Hebei Normal University of Science & Technology, Qinhuangdao 066004, China
*
Author to whom correspondence should be addressed.
Agronomy 2023, 13(4), 1146; https://doi.org/10.3390/agronomy13041146
Submission received: 29 March 2023 / Revised: 10 April 2023 / Accepted: 12 April 2023 / Published: 18 April 2023
(This article belongs to the Section Soil and Plant Nutrition)

Abstract

:
Reasonable canopy structure and leaf physiological characteristics are considered as important factors for improving canopy nitrogen (N) distribution by matching the available light resources and thus increasing the grain yield of maize (Zea mays L.). However, the determinants of different maize varieties in light–N matching and grain yields with specific canopy structures and leaf physiological characteristics, as well as the response to the N application rate, remain poorly understood. In this study, we analyzed the relationships between different canopy structures and the enzyme activity and light utilization of spring maize in the field. Two maize varieties (XY335 and ZD958) with different canopy structures were used as the experimental material in a 2-year field experiment from 2014 to 2015, grown under different N inputs of 0, 100, 200, and 300 kg N ha−1 (N0, N1, N2, and N3) at a planting density of 90,000 plants ha−1 in Jilin Province on the Northeast China Plain. The results show that XY335 combined with N3 had a greater leaf angle, upper internode length and number, and upper leaf area index of the upper layer compared with ZD958. Higher N assimilatory enzyme (glutamine synthase (GS), glutamate synthase (GOGAT), and nitrate reductase (NR)) activities in the upper and middle leaves were observed in XY335 compared to ZD958. Furthermore, the light interception and light utilization efficiency of the upper leaves of XY335 increased, especially at higher N application rates, which significantly affected the N translocation post-silking and its distribution in different populations. As a result, the photosynthetic N use efficiency (PNUE) values of the upper leaves (10.4%) and middle leaves (5.2%) of XY335 were higher than those of ZD958, coordinating the canopy light and N distributions and being positively correlated with the maize grain yield. This suggested that the superior canopy structure of the upper layer and N assimilatory enzymes of the upper and middle leaves of this maize variety significantly increased the light interception of the canopy, while the synchronization of light and the N of the upper and middle leaves increased the light and N utilization efficiency of maize, which ultimately increased the grain yield at a high plant density.

1. Introduction

High grain production can be achieved by increasing the level of dry matter accumulation. For various crops, 95% of accumulated biomass is a product of photosynthesis, and light is the energy source for photosynthesis in crops [1,2]. The increase in canopy light utilization is linearly related to high dry matter accumulation and grain yield [3,4]. At a high plant density, canopy light utilization efficiency can be improved by selecting a genotype with an optimal canopy structure or higher leaf physiological/metabolic characteristics [5,6,7,8] through N treatment to regulate leaf physiological activities (such as N assimilate enzyme activity), or both [8,9,10]. Accurate evaluation of the canopy characteristics and leaf physiological activities of maize hybrids of different genotypes is a crucial physiological basis for regulating maize grain yields at various levels of N input.
Differences in the leaf structure and structural characteristics of maize populations have been shown to lead to differences in canopy light distribution, thus affecting the leaf photosynthetic performance of the population [11]. The morphological characteristics of the maize plant structure include the internode length and number, leaf layer distribution, leaf size, and leaf angle changes [12]. These characteristics mainly affect the distribution of irradiation within the canopy, thus changing the level of coordination between crop light interception and light quality. Moreover, the photosynthetic rate is affected by both the leaf position and plant structure, mainly via adjustments to the canopy structure, which affect the photosynthetic rate and thus greatly enhance the photosynthetic capacity [13]. Improving the canopy structure of maize is therefore conducive to improving the population quality of plants and ultimately increasing the maize grain yield [14,15,16,17]. Changes in the crop population structure tend to adjust the canopy structure and function and improve the absorption and utilization efficiency of light energy by improving the transmittance of the colony under high-density planting conditions [18].
The total interception of photosynthetically active radiation by the canopy of maize and the light interception rate of the upper layer of the canopy increased under high-density planting conditions, while the light interception rates of the ear leaf and the lower layer decreased [19]. The maize yield is determined by the production, accumulation, and transport characteristics of photosynthetic substances, and a higher N content of the leaves during the early stage of grain filling is conducive to maintaining a higher leaf area index (LAI) and chlorophyll content, thus improving the photosynthetic assimilation capacity [20]. Additionally, the improved N assimilatory enzymes (such as GS activity, GOGAT activity, and NR activity) equally contribute to the leaf N content and physiological activity [10]. Therefore, the light distribution within the population is enhanced by adjusting the canopy structure and key N assimilatory enzymes of high-planting-density populations, which is conducive to improving the leaf physiological activity and the efficient utilization of light energy.
The vertical distribution of N in the crop canopy is a regulatory mechanism of adaptation to the vertical distribution of light intensity in the canopy [21]. The photosynthetic N use efficiency (PNUE) represents the photosynthetic capacity of the N content per unit leaf area, which is an important index that indicates the coordination between the photosynthetic capacity of leaves and their N use efficiency [22]. The interaction between light and N plays an important role in the metabolism of crop carbon and N. N use efficiency and photosynthetic N use efficiency typically show a significant positive correlation. However, the ways in which the coordination of light and N in different layers and different types of maize functions to improve the grain yield remain unclear.
Previous reports have mainly concerned the effects of the genotype or rate of N input to the soil on the plant leaf angle, showing, for example, that the photosynthetic efficiency can be increased via the selection of a genotype with upright leaves [7]. However, the contributions of different canopy characteristics (upper, middle, and lower) to light utilization and the relationships between light utilization and plant physiological indices have been overlooked. There have been few studies on the quantitative effects of different canopy layers and leaf physiology activities on light utilization among hybrids of different genotypes and the effects of nitrogen supply on the quantitative relationships of light utilization with dry matter accumulation and yield formation. Therefore, the objectives of this study were as follows: (i) to investigate differences in the canopy structure and leaf physiological characteristics of different maize hybrids; (ii) to quantify the contributions of the upper, middle, and lower canopy structures and leaf physiological characteristics to light interception and light utilization; and (iii) to clarify the relationship between light utilization, N distribute, dry matter, and the grain yield. Our investigation provides insight into N-associated physiological processes correlated with the optimization of canopy morphological–physiological structure in intensive spring maize cultivation.

2. Materials and Methods

2.1. Site Description

The field experiments were conducted from 2014 to 2015 at Gongzhuling Experimental Station (43°31′ N, 124°48′ E), Chinese Academy of Agricultural Sciences, which is located in Jilin Province. The black soil consisted of 26.2 g kg−1 organic matter, 1.6 g kg−1 total N, 143.3 mg kg−1 available N, 64.4 mg kg−1 available phosphate, and 150.5 mg kg−1 available potassium. Pests, weeds, and diseases were controlled, and no irrigation was applied throughout the growing season. The daily precipitation, mean temperature, and sunshine hours during the growing season are shown in Figure 1.

2.2. Experiment Design and Field Management

The field experiment was designed as a split-plot experiment with the N level as the main plot and varieties as the split plot (with three replicates). The N treatments included 0 kg ha−1 (N0), 100 kg ha−1 (N1), 200 kg ha−1 (N2) and 300 kg ha−1 (N3) as NH4NO3. Then, 50% nitrogen fertilizer was disseminated and incorporated into the soil as NH4NO3 shortly after sowing, while 30% and 20% nitrogen fertilizers were disseminated and incorporated into the soil at jointing and in the silking period, respectively. The maize hybrids XY335 and ZD958, which are widely grown on the North China Plain, were used, and the Reid–Tang Si Ping Tou and Reid–Lancaster models represented ZD958 and XY335, respectively. The split-plot size was 36 m2 (6 × 6 m). Phosphate fertilizer (P2O5, 46%) and potassium fertilizer (potassium sulfate, K2O 50%) were applied at 100 kg ha−1, and a planting pattern with 60 cm spacing between rows was adopted. The other cultivation and management practices were identical to those used for high-yield fields. The maize was planted by hand on 1 May 2014 and 28 April 2015. The planting density was 90,000 plants ha−1, which represents a relatively high density compared with conventional growing conditions on the North China Plain. The harvest dates of the maize were 1 October 2014 and 3 October 2015.

2.3. Data Collection

2.3.1. Plant Morphology

In the silking stage of the 2015 growing seasons, 6 plants that visually appeared to be uniform in growth were measured to determine the internode length and leaf angle. The internode length and leaf angle were measured with a meter ruler and protractor, as follows:
lov (leaf value) = θ × Lf/L
where θ = the 90-leaf angle, L is the leaf length (cm), and Lf is the distance from the leaf base to the highest point of the leaf (cm).

2.3.2. Leaf Area Index (LAI)

Three representative plants were selected during the silking stages of the 2014 and 2015. The leaf lengths and widths were measured according to the following three layers: “three ear leaves” for the middle-layer leaves, the “three ear leaves” above as the upper layer and the three lower leaves as the lower layer.
Leaf area (cm2) = length × width × 0.75
Leaf area index = leaf area per plant
× number of plants per unit area/unit land area

2.3.3. Net Photosynthetic Rate (Pn) and Photosynthetic N Use Efficiency (PNUE)

During the silking stages of the 2015, at least three tagged plants were selected from each plot, and the leaves of the middle layer (3rd leaf on the ear leaf), upper layer (ear leaf), and lower layer (the 3rd leaf under the ear leaf) were used to measure photosynthesis with a portable photosynthesis apparatus (LI-6400, Li-Cor, Lincoln, NE, USA) in the late morning (9:30–12:00). All measurements were performed in three technical and three biological replicates, respectively.
The PNUE (µmol CO2g−1 N·s−1) is calculated as:
PNUE (µmol CO2g−1 N·s−1) = Pn/SLN
where Pn is the net photosynthetic rate (µmol m−2·s−1). The specific leaf N (SLN) was calculated as the N content per unit leaf area [8].

2.3.4. PAR and PAR Utilization

During the silking stages of 2014 and 2015, at least three tagged plants were selected from each plot to determine the distribution of PAR in the canopy using a SunScan canopy analyzer (Delta, UK). Three points were selected diagonally, and the PAR was measured, the average was calculated, and each point was divided into five layers: the top layer (10–20 cm from the upper canopy), the third leaves upon the ear, the ear leaves, the third leaves below the ear leaves, and the bottom layer (10–20 cm from the ground). PAR utilization (RUE, g·MJ−1) was calculated as:
RUR = In × NDMM/IPAR
where NDMM is the dry matter accumulation (g·m−2) in the growth stage, IPAR is the canopy PAR intercept (MJ·m−2) in the growth stage, and In is the canopy PAR interception rate.

2.3.5. GS Activity, GOGAT Activity and NR Activity

In the silking stage of 2014 and 2015, the upper layer (3rd leaf on the ear leaf), middle layer (ear leaf), and lower layer (the 3rd leaf under the ear leaf) were selected to measure the GS, GOGAT and NR activity.
To determine GS enzyme activity: the fresh samples (0.5 g) of panicle leaves were ground using a mortar as a homogenate with adding Tris-HCI buffer (100 mmol/L, at pH 7.6). The ground homogenate was separated from 13,000 rpm for 25 min, and the supernatant was taken as the enzyme solution. The reaction solution was made by enzyme solution, and 6 mL of imidazole–hydrochloride buffer (0.25 mol/L, pH 7.0), 0.4 mL of sodium glutamate solution (0.30 mol/L, pH 7.0), 0.4 mL of ATP-Na solution (30 mmol/L, pH 7.0), and 0.2 mL of MgSO4 solution (0.5 mol/L) were sequentially added. The reaction solution was kept in a 25 °C water bath for 5 min, then 0.2 mL of hydroxylamine reagent was added, and FeCl3 was added to terminate the reaction 15 min later. The terminated reaction solution was centrifuged (4 °C, 4000 rpm) for 15 min, and the supernatant was taken and sampled at 540 nm in an ultraviolet spectrophotometer. The different layer leaf GS was measured according to the method of Hire et al. [23].
The GOGAT was measured according to Lin and Kao [24] and Nasar et al. [10]. The frozen plant leaf samples (0.5 g) were homogenized in a mortar and pestle with an extraction buffer that was pre-cooled and contained 100 mM Tris-HCl (pH 7.6), 1.0 mM MgCl2-6H2O, 10 mM 2-mercaptoethanol, and 1.0 m Methylenediaminetetraacetic acid (EDTA). The homogenates were centrifuged at 4 °C for 15 min with 13,000 rpm shaking. Then, the supernatants were used as crude extracts, adding 25 mM Tris-base, 100 mM -Ketoglutaric acid, 10 mM KCl, 20 mM L-glutamine, and 3 mM NADH. Thereafter, NADH oxidation caused the absorbance, which was measured at 340 nm.
The NR measurement was as follows: Briefly, 0.5 g of fresh leaf from each sample was transferred to a separate centrifuge tube and placed in an ice bath mortar, adding a small amount of quartz sand and 4 mL of phosphate buffer ground to a uniform consistency after incubation at 4 °C for 15 min with 4000 rpm shaking. Then, 0.4 mL of the supernatant was removed and transferred to a 10 mL test tube, adding KNO3 solution (1.2 mol L−1) and 0.4 mol L−1 NADH phosphate-buffered solution. The reaction took place at 25 °C for 30 min, including CK without NADH, which was replaced with phosphate buffer. The reaction was terminated immediately with 1 mL naphthylamine solution, and then we added 1 mL of ethylene amine solution. After 15 min of color development, the samples were centrifuged. A spectrophotometer was used to determine the absorbance at 520 nm. The NR activity was calculated following the method of Aslam et al. [25].

2.3.6. N Content, Remobilization and Grain Yield

The plants were divided into stem and leaf sections of different layers in the silking and maturity stages of 2014 and 2015, and the N content was determined by the semi-micro Kjeldahl method (Nelson and Somers, 1973). Upon reaching maturity, plants were harvested from a 6 m2 area and thrashed in each plot. Then, the grains were dried, and the grain yield was determined.
N remobilization (g m−2) was calculated as:
N remobilization = (Leaf N content at R1-leaf N content at R6)/Leaf N contents at R1
where R1 denotes the silking stage, and R6 denotes the maturity stage.

2.4. Statistical Analysis

Three-factor ANOVA was performed using SPSS 20.0 software (SPSS Institute Inc., Chicago, IL, USA), and figures were produced using Origin 2021 and R3.4.1. Structural equation modeling (SEM) was performed to verify the hypothetical relationships of the upper, middle, and lower structures with light utilization and the grain yield. Partial least squares regression (PLS) was conducted in Smartpls v2.0 (Ringle et al., 2005), which had no requirements for a normal distribution of the data or sample size. PLS can also be used with mixed models containing both reflective and latent variables.

3. Results

3.1. Grain Yield and Yield Compositions

The results of the ANOVA analysis showed that the year (Y), hybrid (H), N level (N), and their interactions (N × H and Y × N × H) had significant effects on the yield and yield components (H and Y × N × H effects on yield not included) (Table 1). Compared with N0, the grain yield increased with the increasing N input, while no significant difference between N2 and N3 was observed for either of the two hybrids. Interestingly, under low-N conditions (N0 and N1), XY335 had a relatively low grain yield compared to ZD958. However, under high-N treatment (N2 and N3), XY335 had a lower 1000-grain value (3.9% in 2014 and 3.9% in 2015) but a higher kernel number than ZD958 (15.4% in 2014 and 12.8% in 2015), which contributed to a higher grain yield of XY335 compared to ZD958 (6.1% in 2014 and 10.7% in 2015).

3.2. Internode Length, Leaf Angle, and Leaf Orientation

There were significant effects regarding the factors of the N level (N), hybrid (H), and their interactions on the internode length (N effects on internode length of the middle and lower layers not included), leaf angle, and leaf orientation (Table 2). For both varieties, increasing the levels of N applied to the soils significantly reduced the internode length of upper layer.
XY335 had higher internode lengths of the upper, middle, and lower layers at 22.2%, 27.2%, and 28.1%, respectively, compared to ZD958 (Table 1). The increased internode length above the ear significantly enlarged the upper space of the plant, which benefitted the interception of light radiation and improved the canopy structure. In addition, the leaf angles were 22.9%, 42.4%, and 45.4% higher in the case of XY335 compared to ZD958 for the respective upper, middle, and lower layers. XY335 had a considerably higher (17.1%) leaf orientation of the upper layer than ZD958 but lower leaf orientations of the middle (12.1%) and lower layers (19.3%) compared to ZD958.

3.3. Leaf Area Index (LAI) and Upper Internode Number

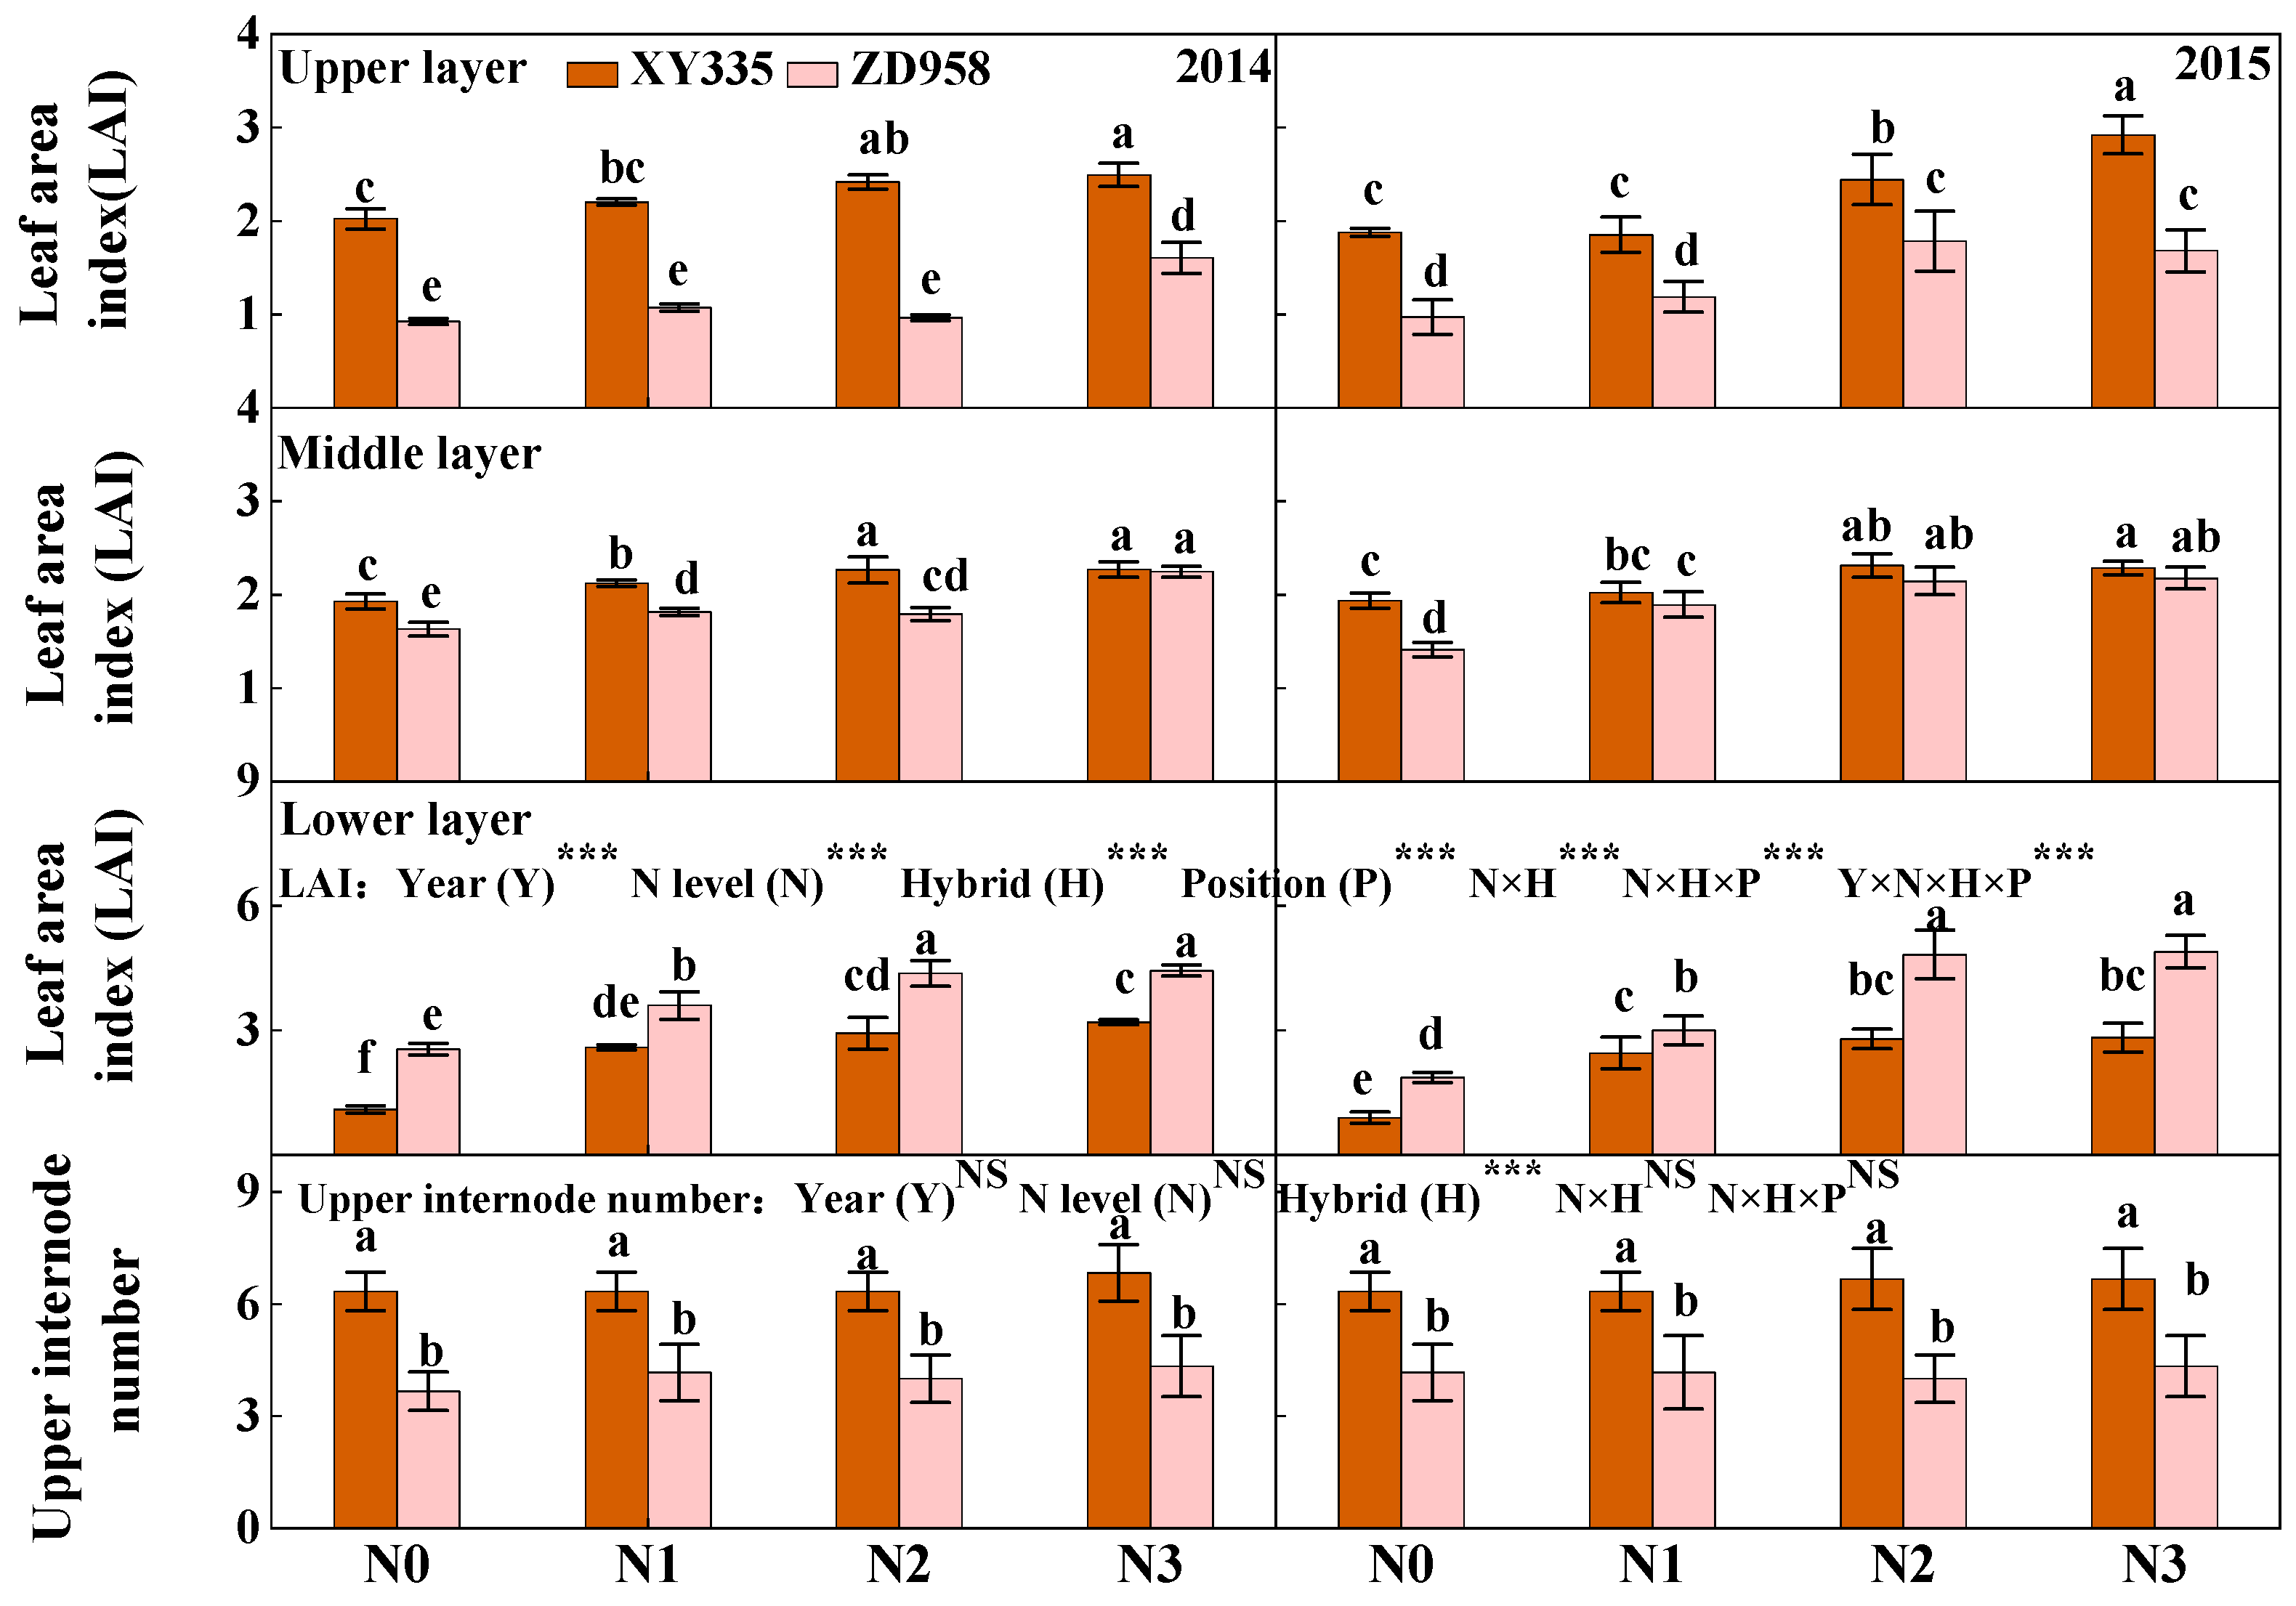
Overall, the LAI was significantly affected by the factors of the year (Y), N level (N), hybrid (H), position (P), and their interactions (N × H, N × H × P, and Y × N × H × P) (Figure 2). In general, increasing the N level enhanced the LAI. Furthermore, for 2 years, the LAIs of the upper and middle layers of XY335 were significantly higher (44.4% for the upper layer and 12.1% for the middle layer) than those of ZD958. Conversely, the LAI of the lower layer was lower for XY335 (37.6%) than ZD958. In addition, the upper internode number was higher for XY335 than ZD958, and it was significantly affected by the hybrid factor.

3.4. N Distribution and Remobilization

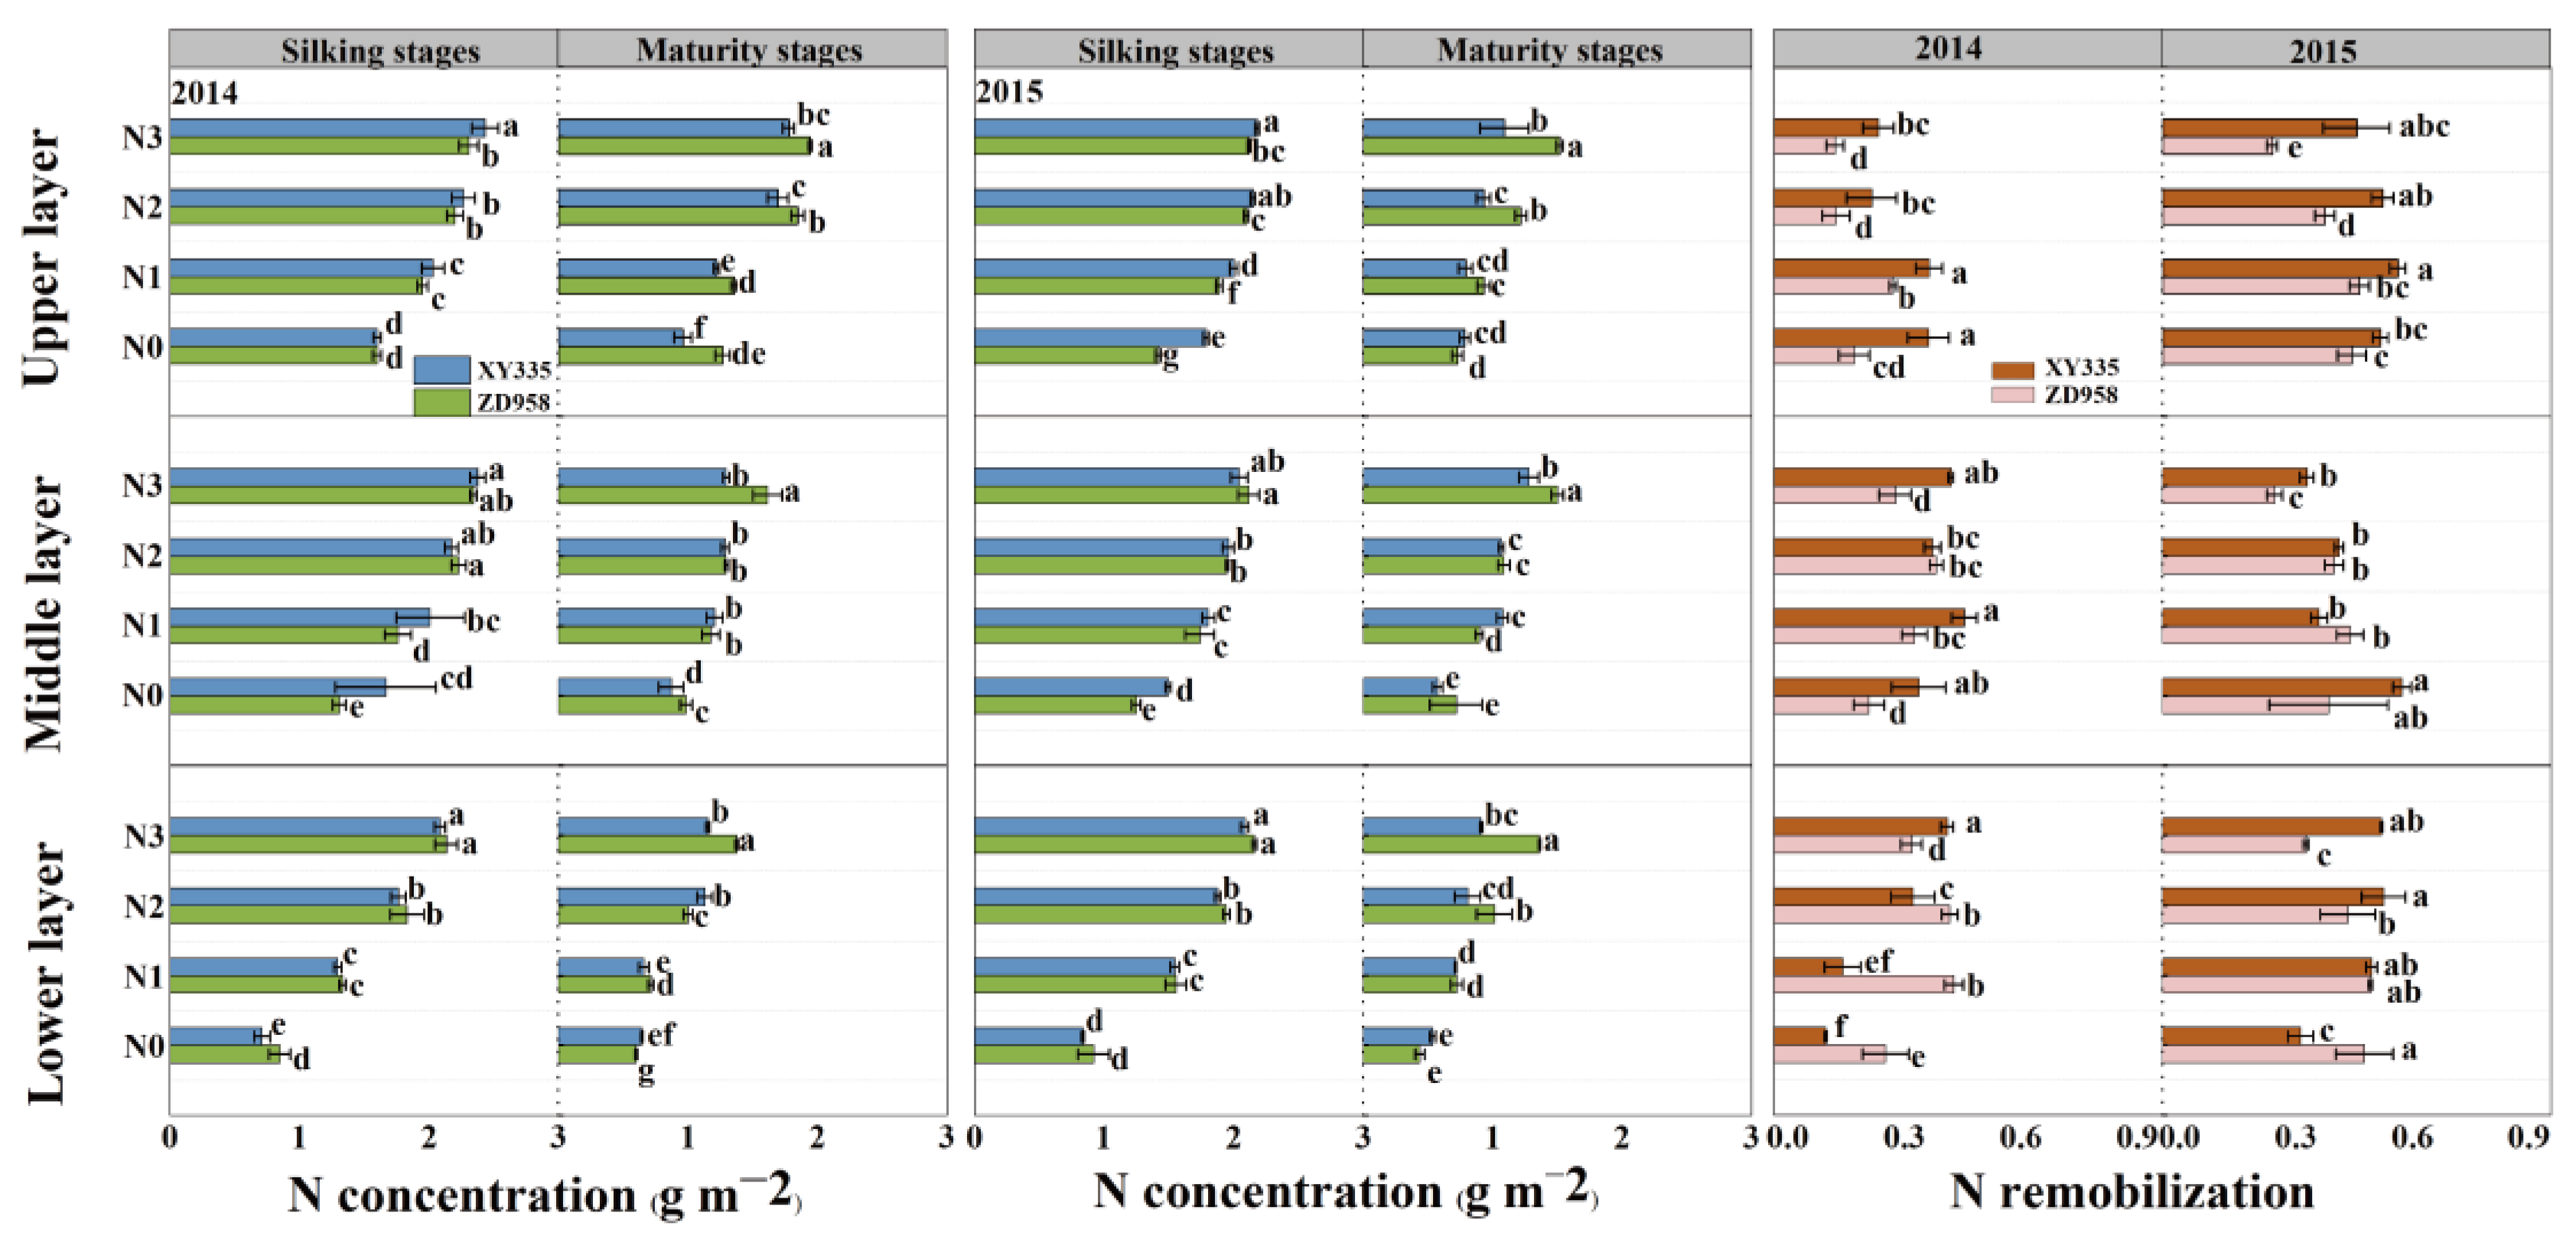
For the three layers (upper, middle, and lower layer) of maize leaves, increasing N levels promoted increases in the N content in both the silking and maturity stages compared to N0. Additionally, significantly greater N contents of the upper layer were measured in XY335 than in ZD958 in the silking stage, while in the maturity stages, opposite observations were made for all the treatments, with higher N remobilization of the upper leaf in XY335 than in ZD958. Under high-N-treatment conditions (N2 and N3), there were no significant differences in the N content of the middle and lower leaves between the two hybrids in the silking stage, while XY335 had a considerably lower N content in maturity, which resulted in higher N remobilization of the middle and lower leaves in XY335 than in ZD958 (Figure 3).

3.5. GS Activity, GOGAT Activity and NR Activity

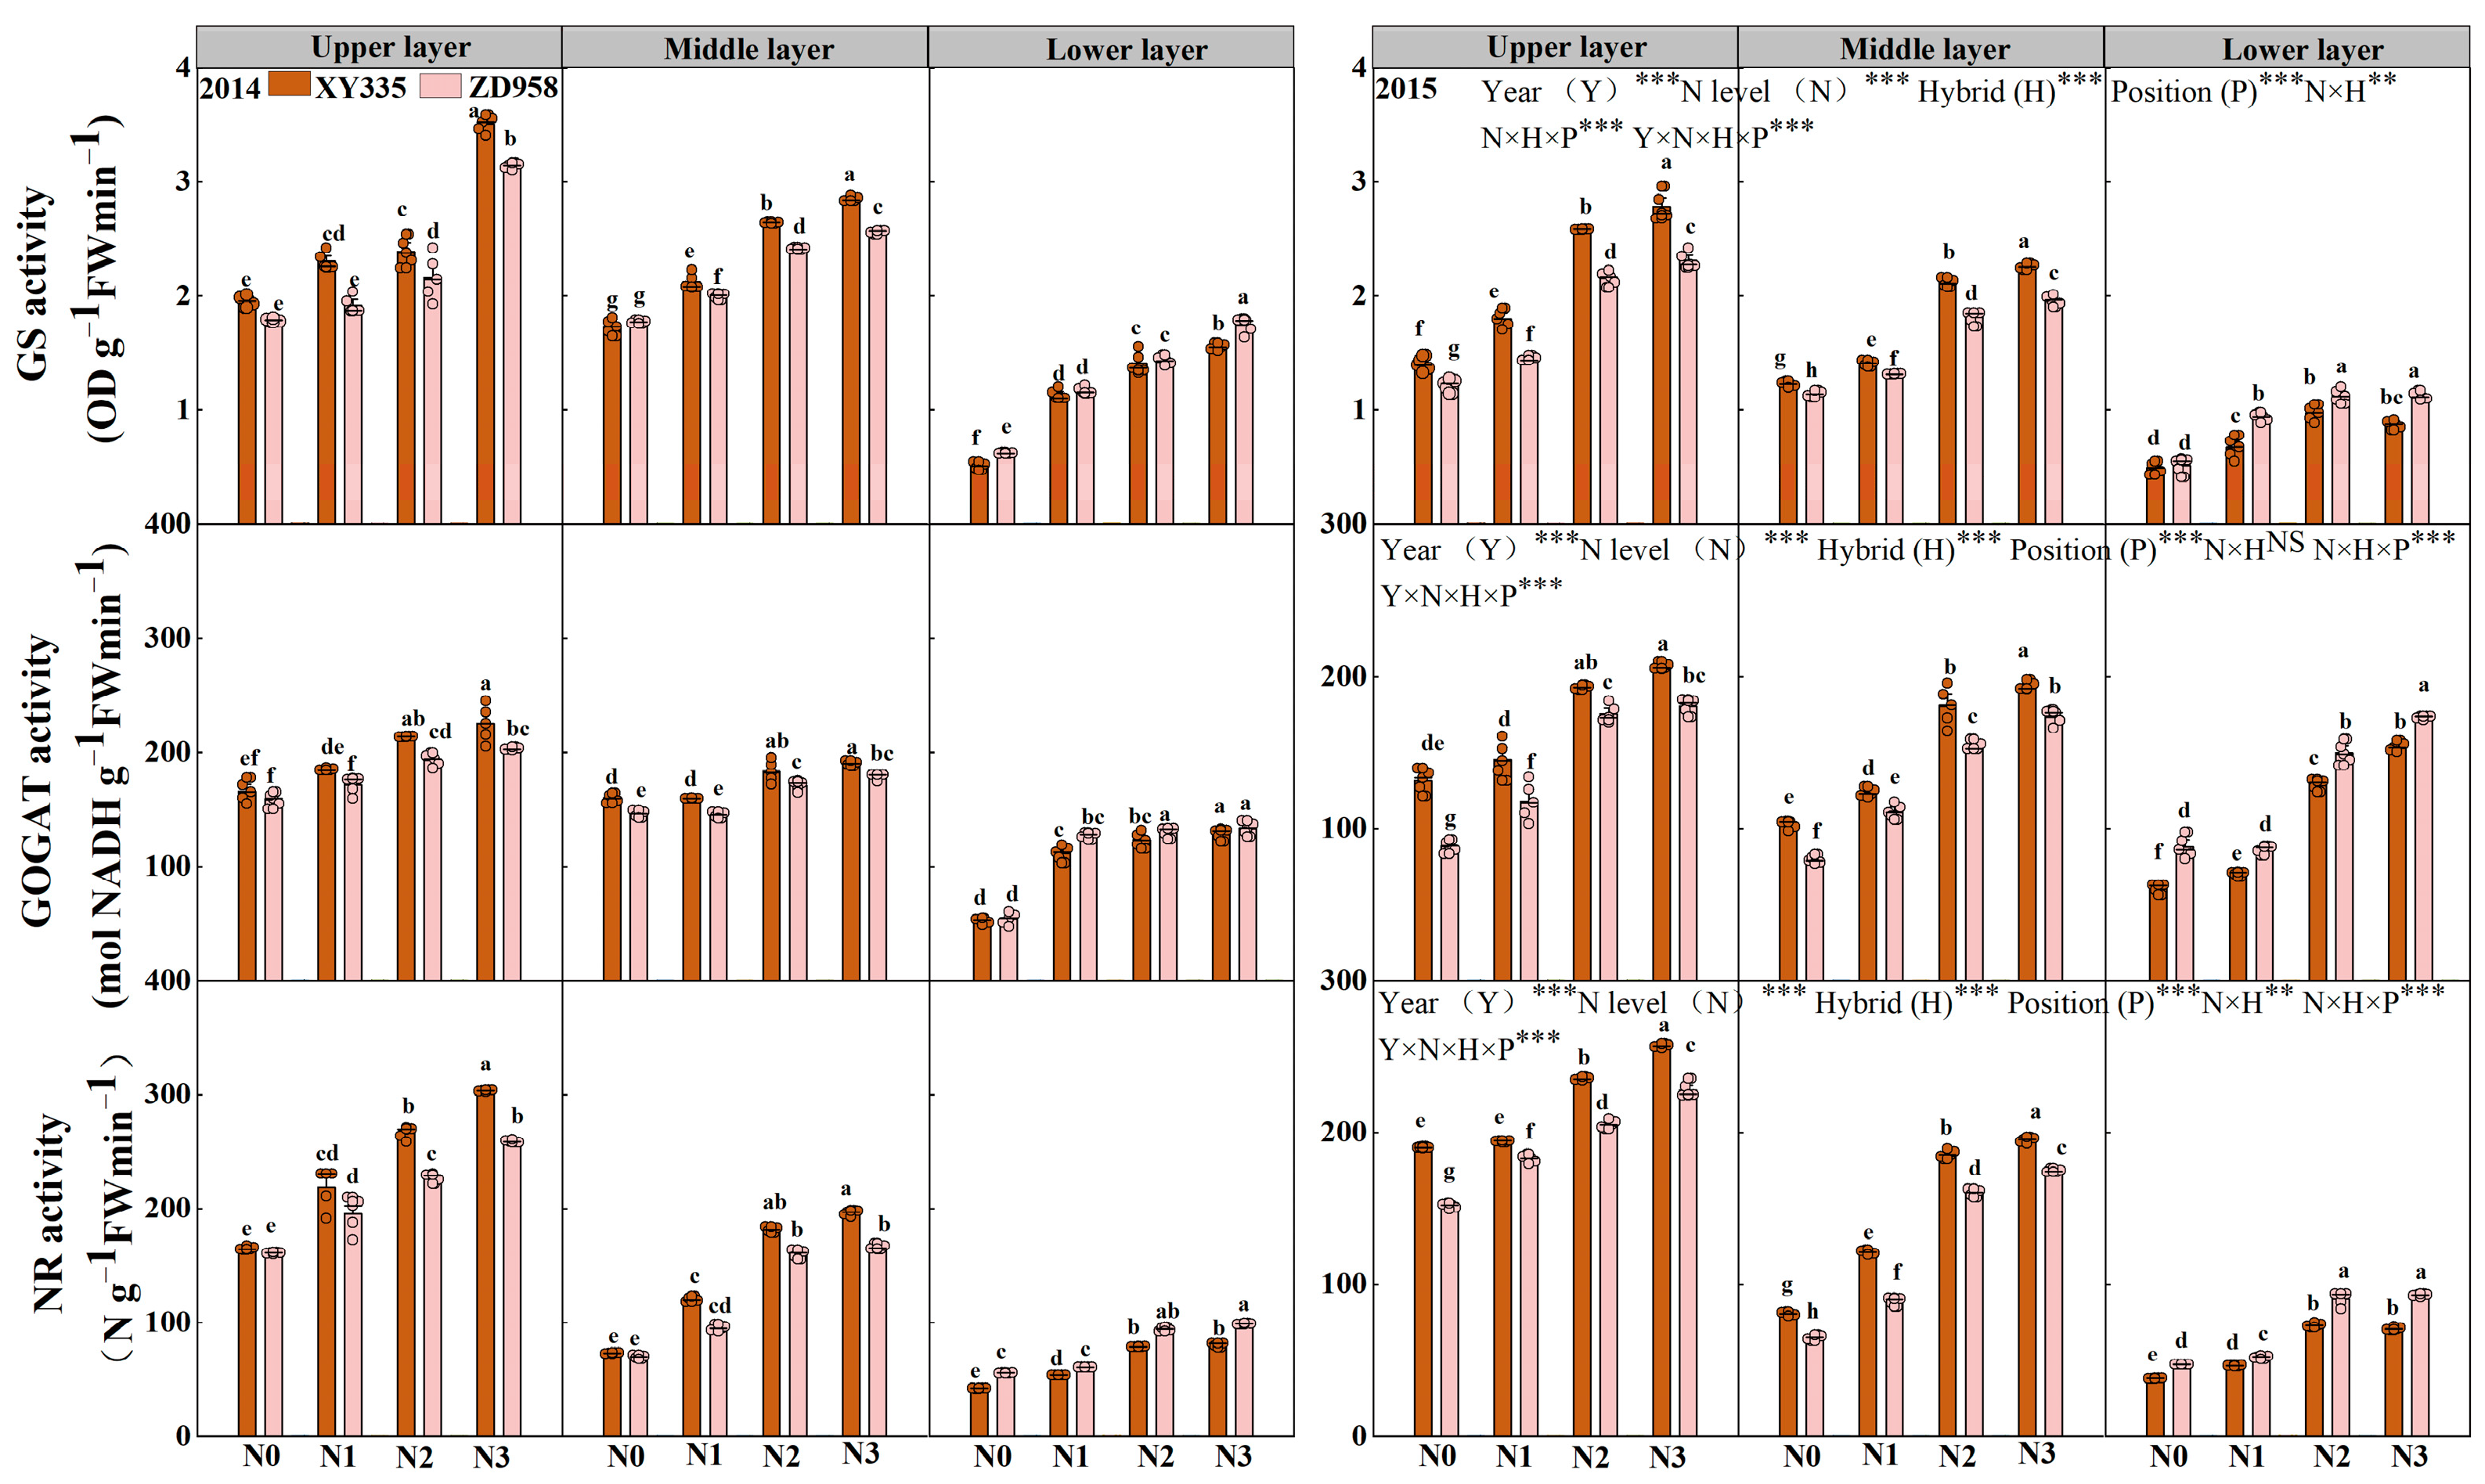
The GS activity, GOGAT activity and NR activity were significantly affected by the N level (N), hybrid (H), position (P), and their interactions (N × H and N × H ×P; N × H effect on GOGAT activity not included) (Figure 4). Increased N fertilization levels significantly raised the GS activity, GOGAT activity, and NR activity of the three layers of leaves (upper, middle, and lower layers) for both maize varieties. The GS activity, GOGAT activity, and NR activity of the upper leaves and middle leaves were higher than those of the lower leaves. XY335 showed relatively high GS activity, GOGAT activity, and NR activity of the upper leaf layer (13.9% for GS activity, 13.1% for GOGAT activity, and 11.6% for NR activity) and middle leaf layer (7.9% for GS activity, 11.0% for GOGAT activity, and 15.4% for NR activity) but reduced GS activity, GOGAT activity, and NR activity of the lower leaf layer (12.9% for GS activity, 12.3% for GOGAT activity, and 19.9% for NR activity) compared to ZD958.

3.6. Net Photosynthetic Rate (Pn) and Photosynthetic N Use Efficiency (PNUE)

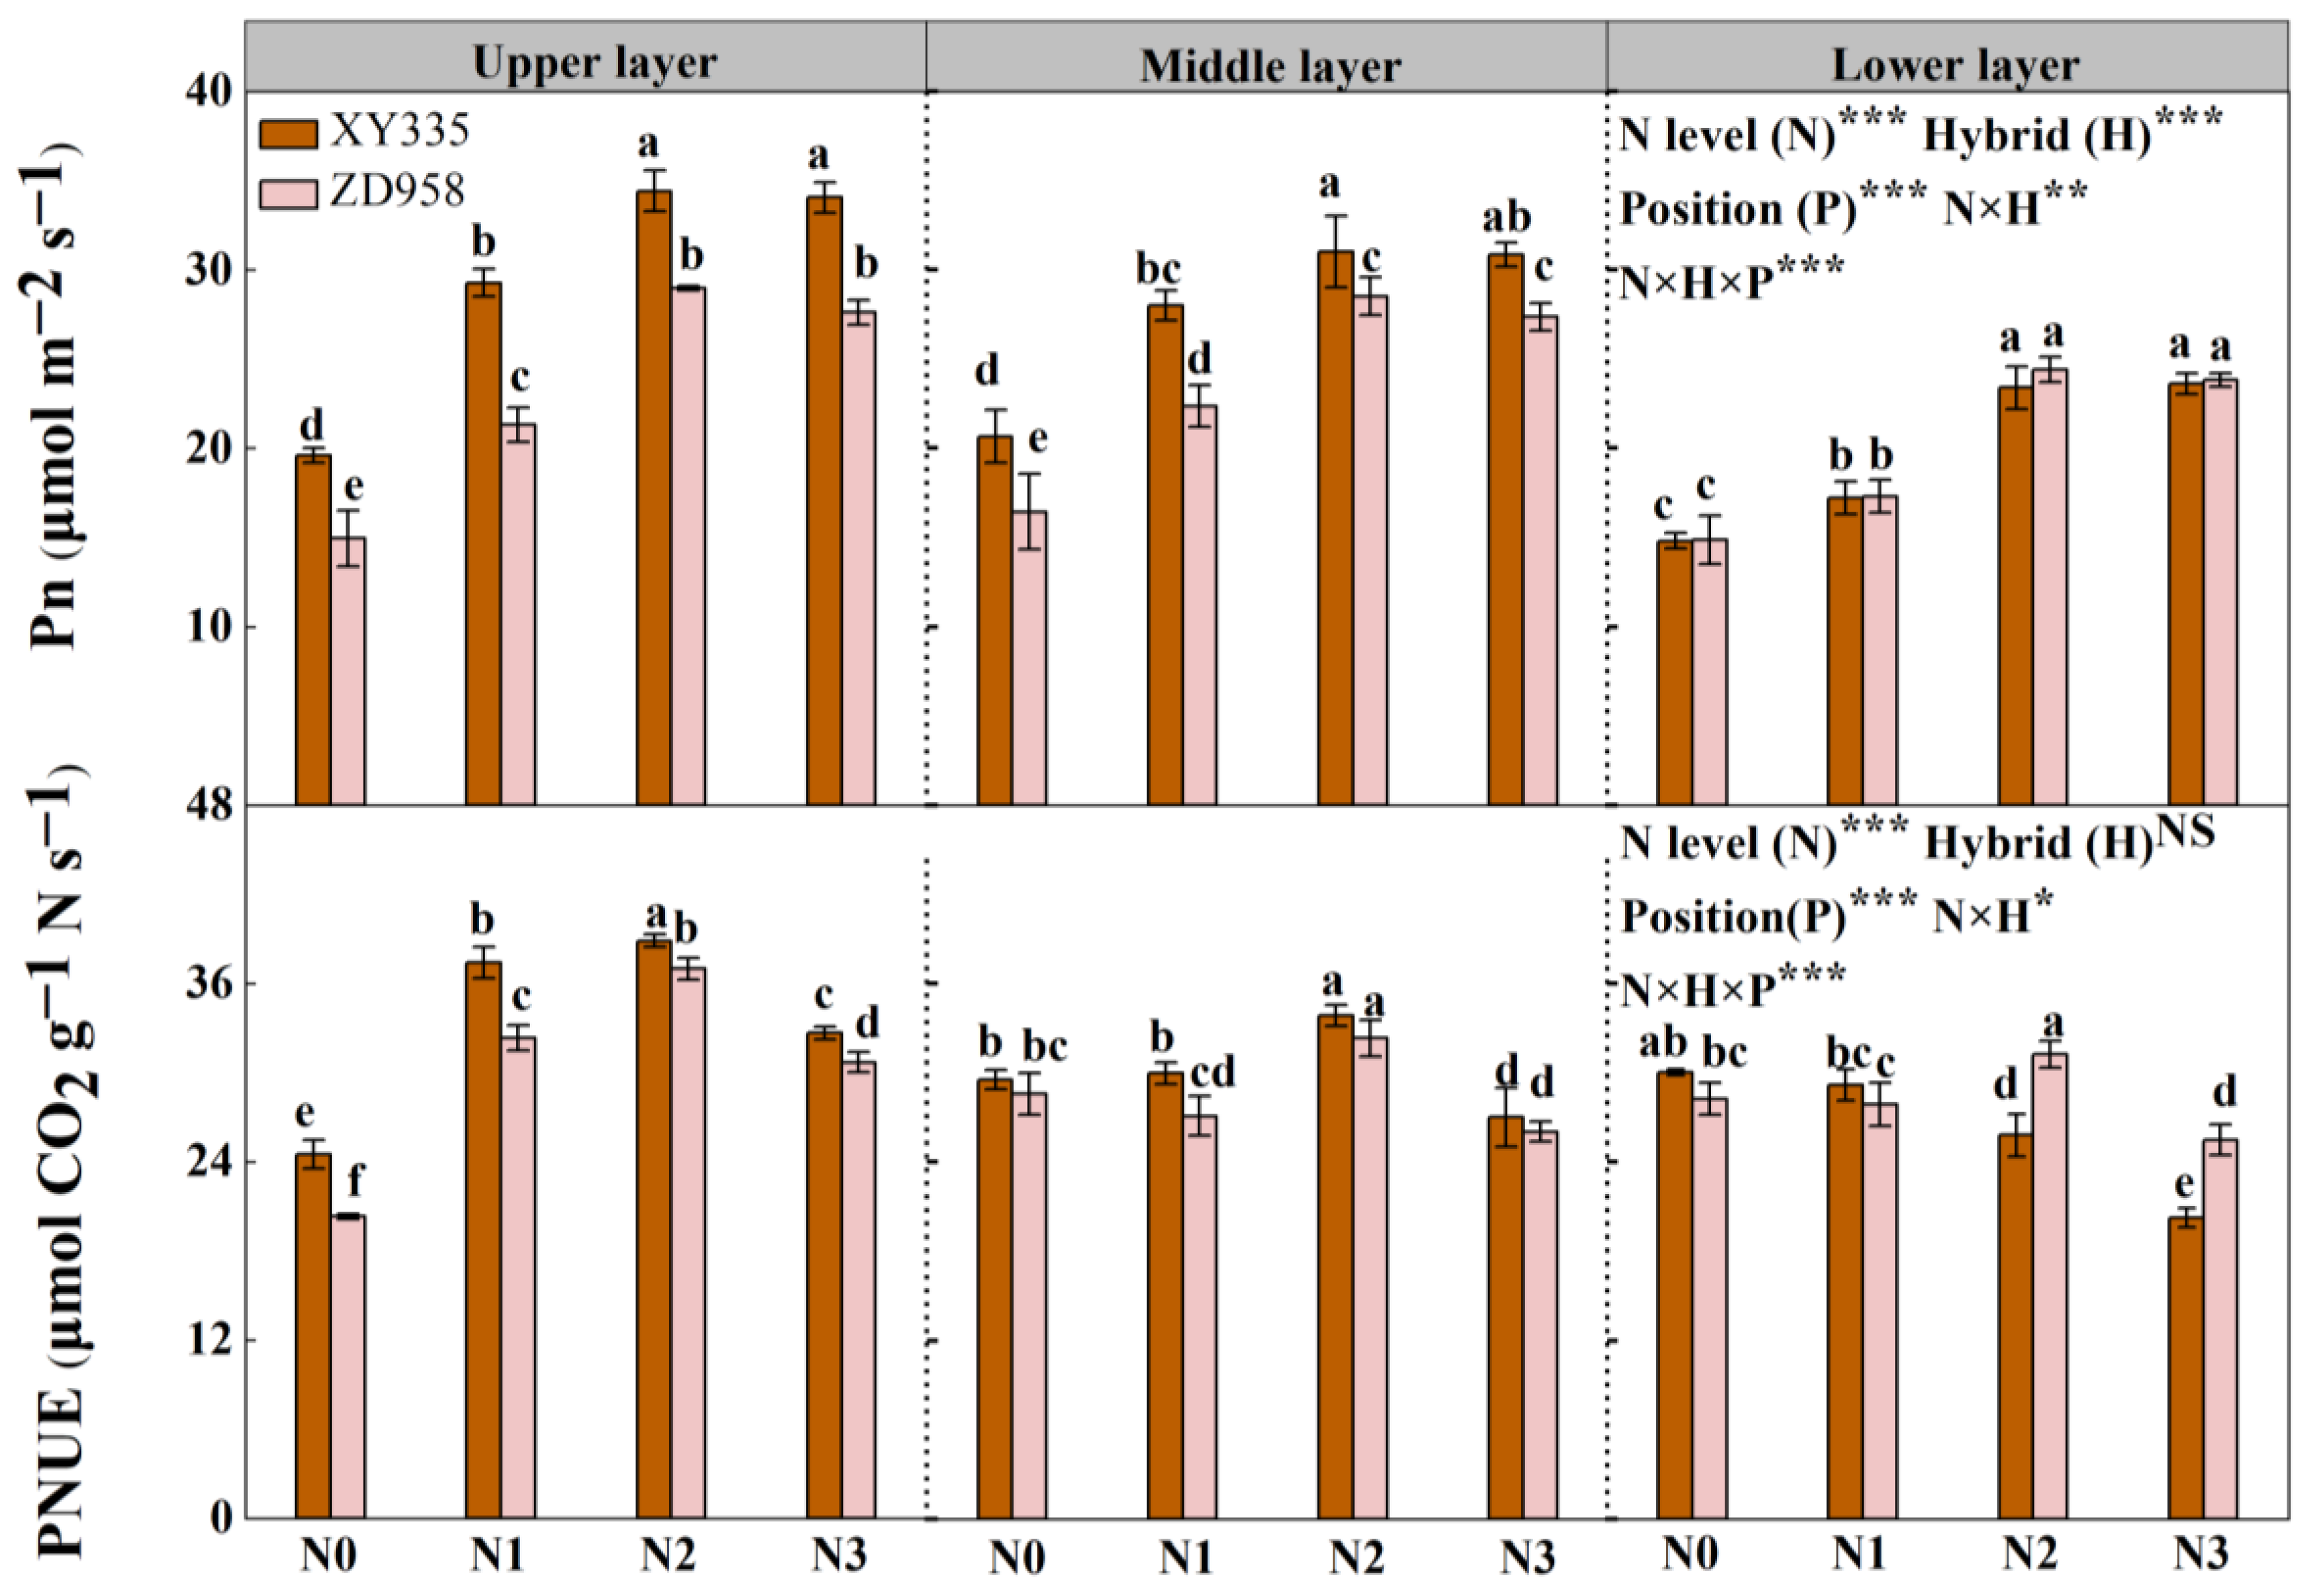
Overall, the Pn and PNUE were significantly affected by the N level (N), hybrid (H), position (P), and their interactions (H × N and P × H × N; H effect on PNUE not included). The Pn and PNUE of the upper leaf layer were higher than those of middle and lower leaf layers. Compared with N0, with the application of increasing N fertilizer, the average Pn increased for both hybrids (Figure 5). Interestingly, on average, a higher Pn of the upper (21.4%) and middle leaf layers (15.0%) and lower Pn of the lower leaf layer (1.5%) were observed in XY335 compared to ZD958.
Compared with N0, the application of increasing N to the soil (N1, N2, and N3) significantly increased the PNUE of the upper and middle leaf layers, while the PNUE of the lower leaf layer did not undergo a similar phenomenon. Additionally, significantly greater PNUE values of the upper leaf (on average 10.4% higher) and middle leaf layer (on average 5.2% higher) were measured in XY335 compared to ZD958. Under N0 and N1 treatment, the PNUE of the lower leaf layer showed no obvious difference between the two hybrids, but with increasing N input into the soil (N2 and N3), XY335 had a comparatively lower PNUE of the lower leaf layer than ZD958 (Figure 5).

3.7. Light Interception Rate and PAR Utilization (RUE)

The light interception rate, dry matter accumulation (NDMN), canopy PAR intercept (IPAR), and PAR utilization (RUE) were significantly affected by the year (Y), N level (N), hybrid (H), and N × H (Table 3). The light interception rate of the upper leaf layer was higher than those of the middle and lower leaf layers. The light interception rate of the upper leaves of XY335 was significantly higher than that of ZD958, being on average 10.3% and 10.6% higher in 2014 and 2015, respectively, whereas the middle and lower leaves of XY335 had lower light intercept rates than those of ZD958. The NDMN, IPAR, and RUE levels gradually rose with the increase in N input. Over 2 years, under N0 and N1 treatment, the NDMN and RUE of XY335 were significantly lower than those of ZD958. Conversely, under high-N conditions (N2 and N3), greater NDMN (9.0%) and RUE (7.8%) were observed in XY335 than in ZD958.

3.8. Correlation Analysis

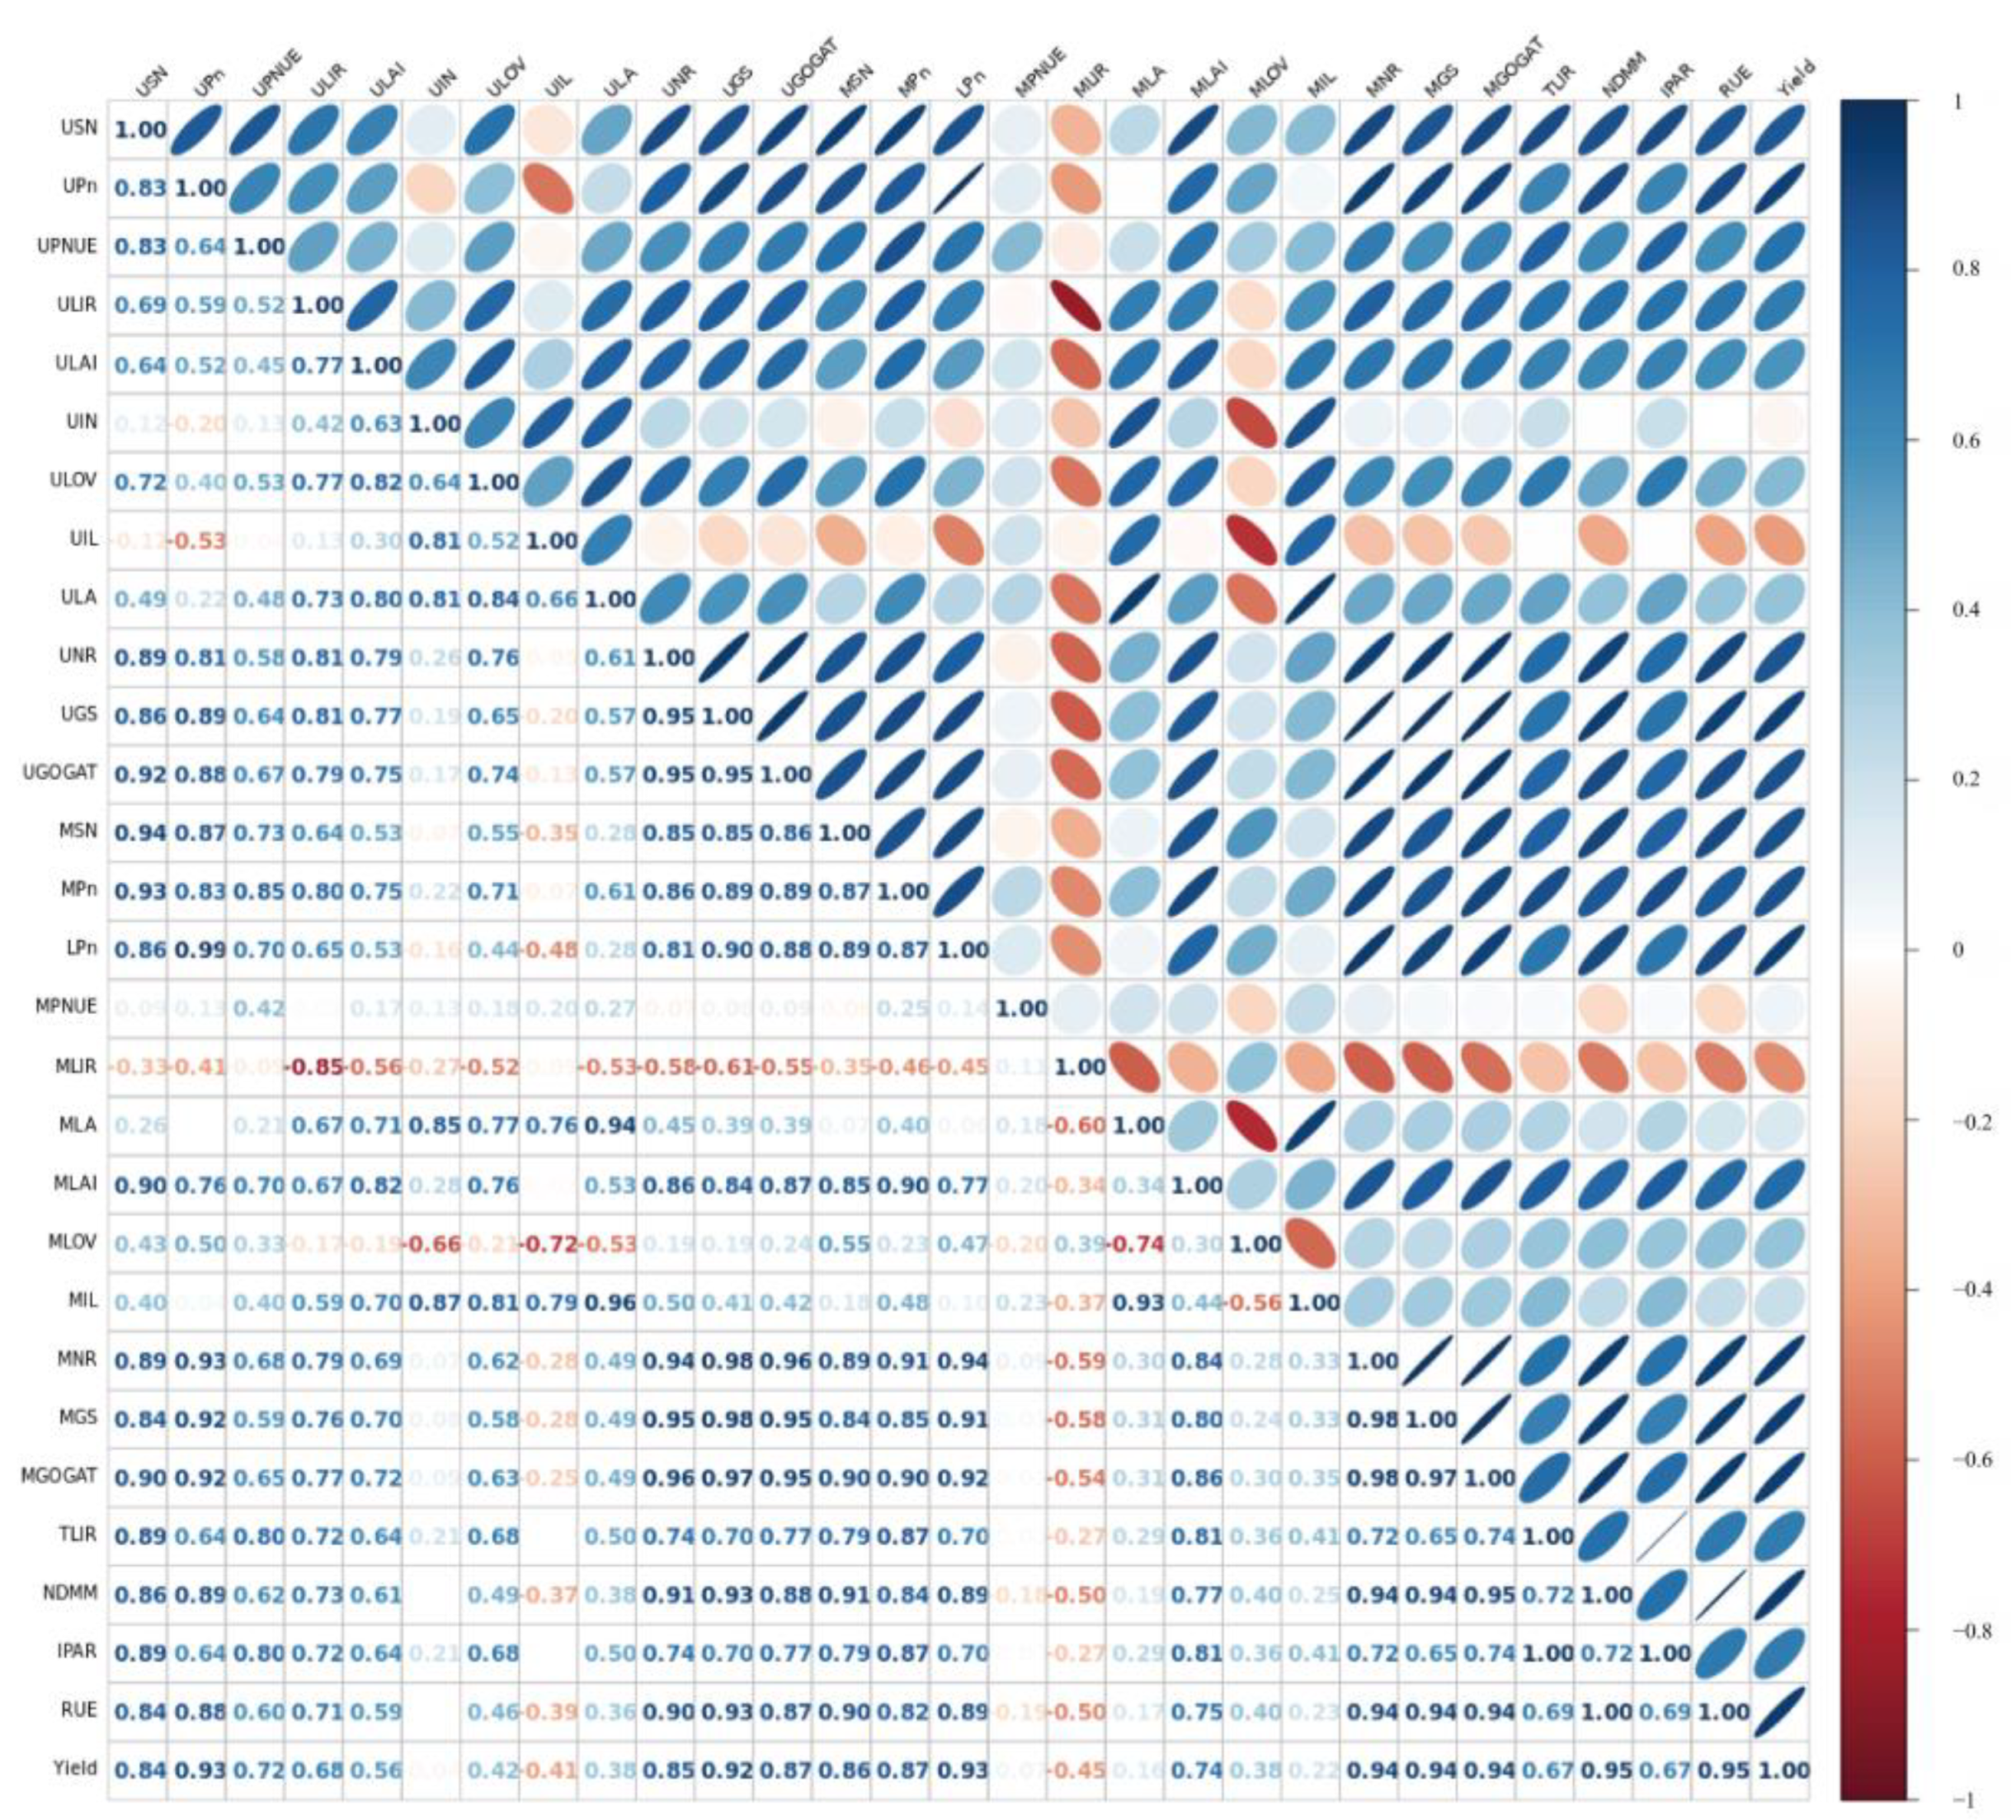
As shown in Figure 6, the grain yield presented significant positive correlations with the leaf N content of the upper layer in the silking stages, accumulation of dry matter, total radiation interception rate, and RUE. The correlation analysis showed that the RUE and total radiation interception were positively correlated with the PNUE of the upper layer. Additionally, the PNUE of the upper layer was significantly positively correlated with leaf N content in the silking stages and the LAI, Pn, RUE, and N assimilation enzyme activity (GS activity, GOGAT activity, and NR activity) of the upper layer.

3.9. SEM Explained the RUE and Grain Yield

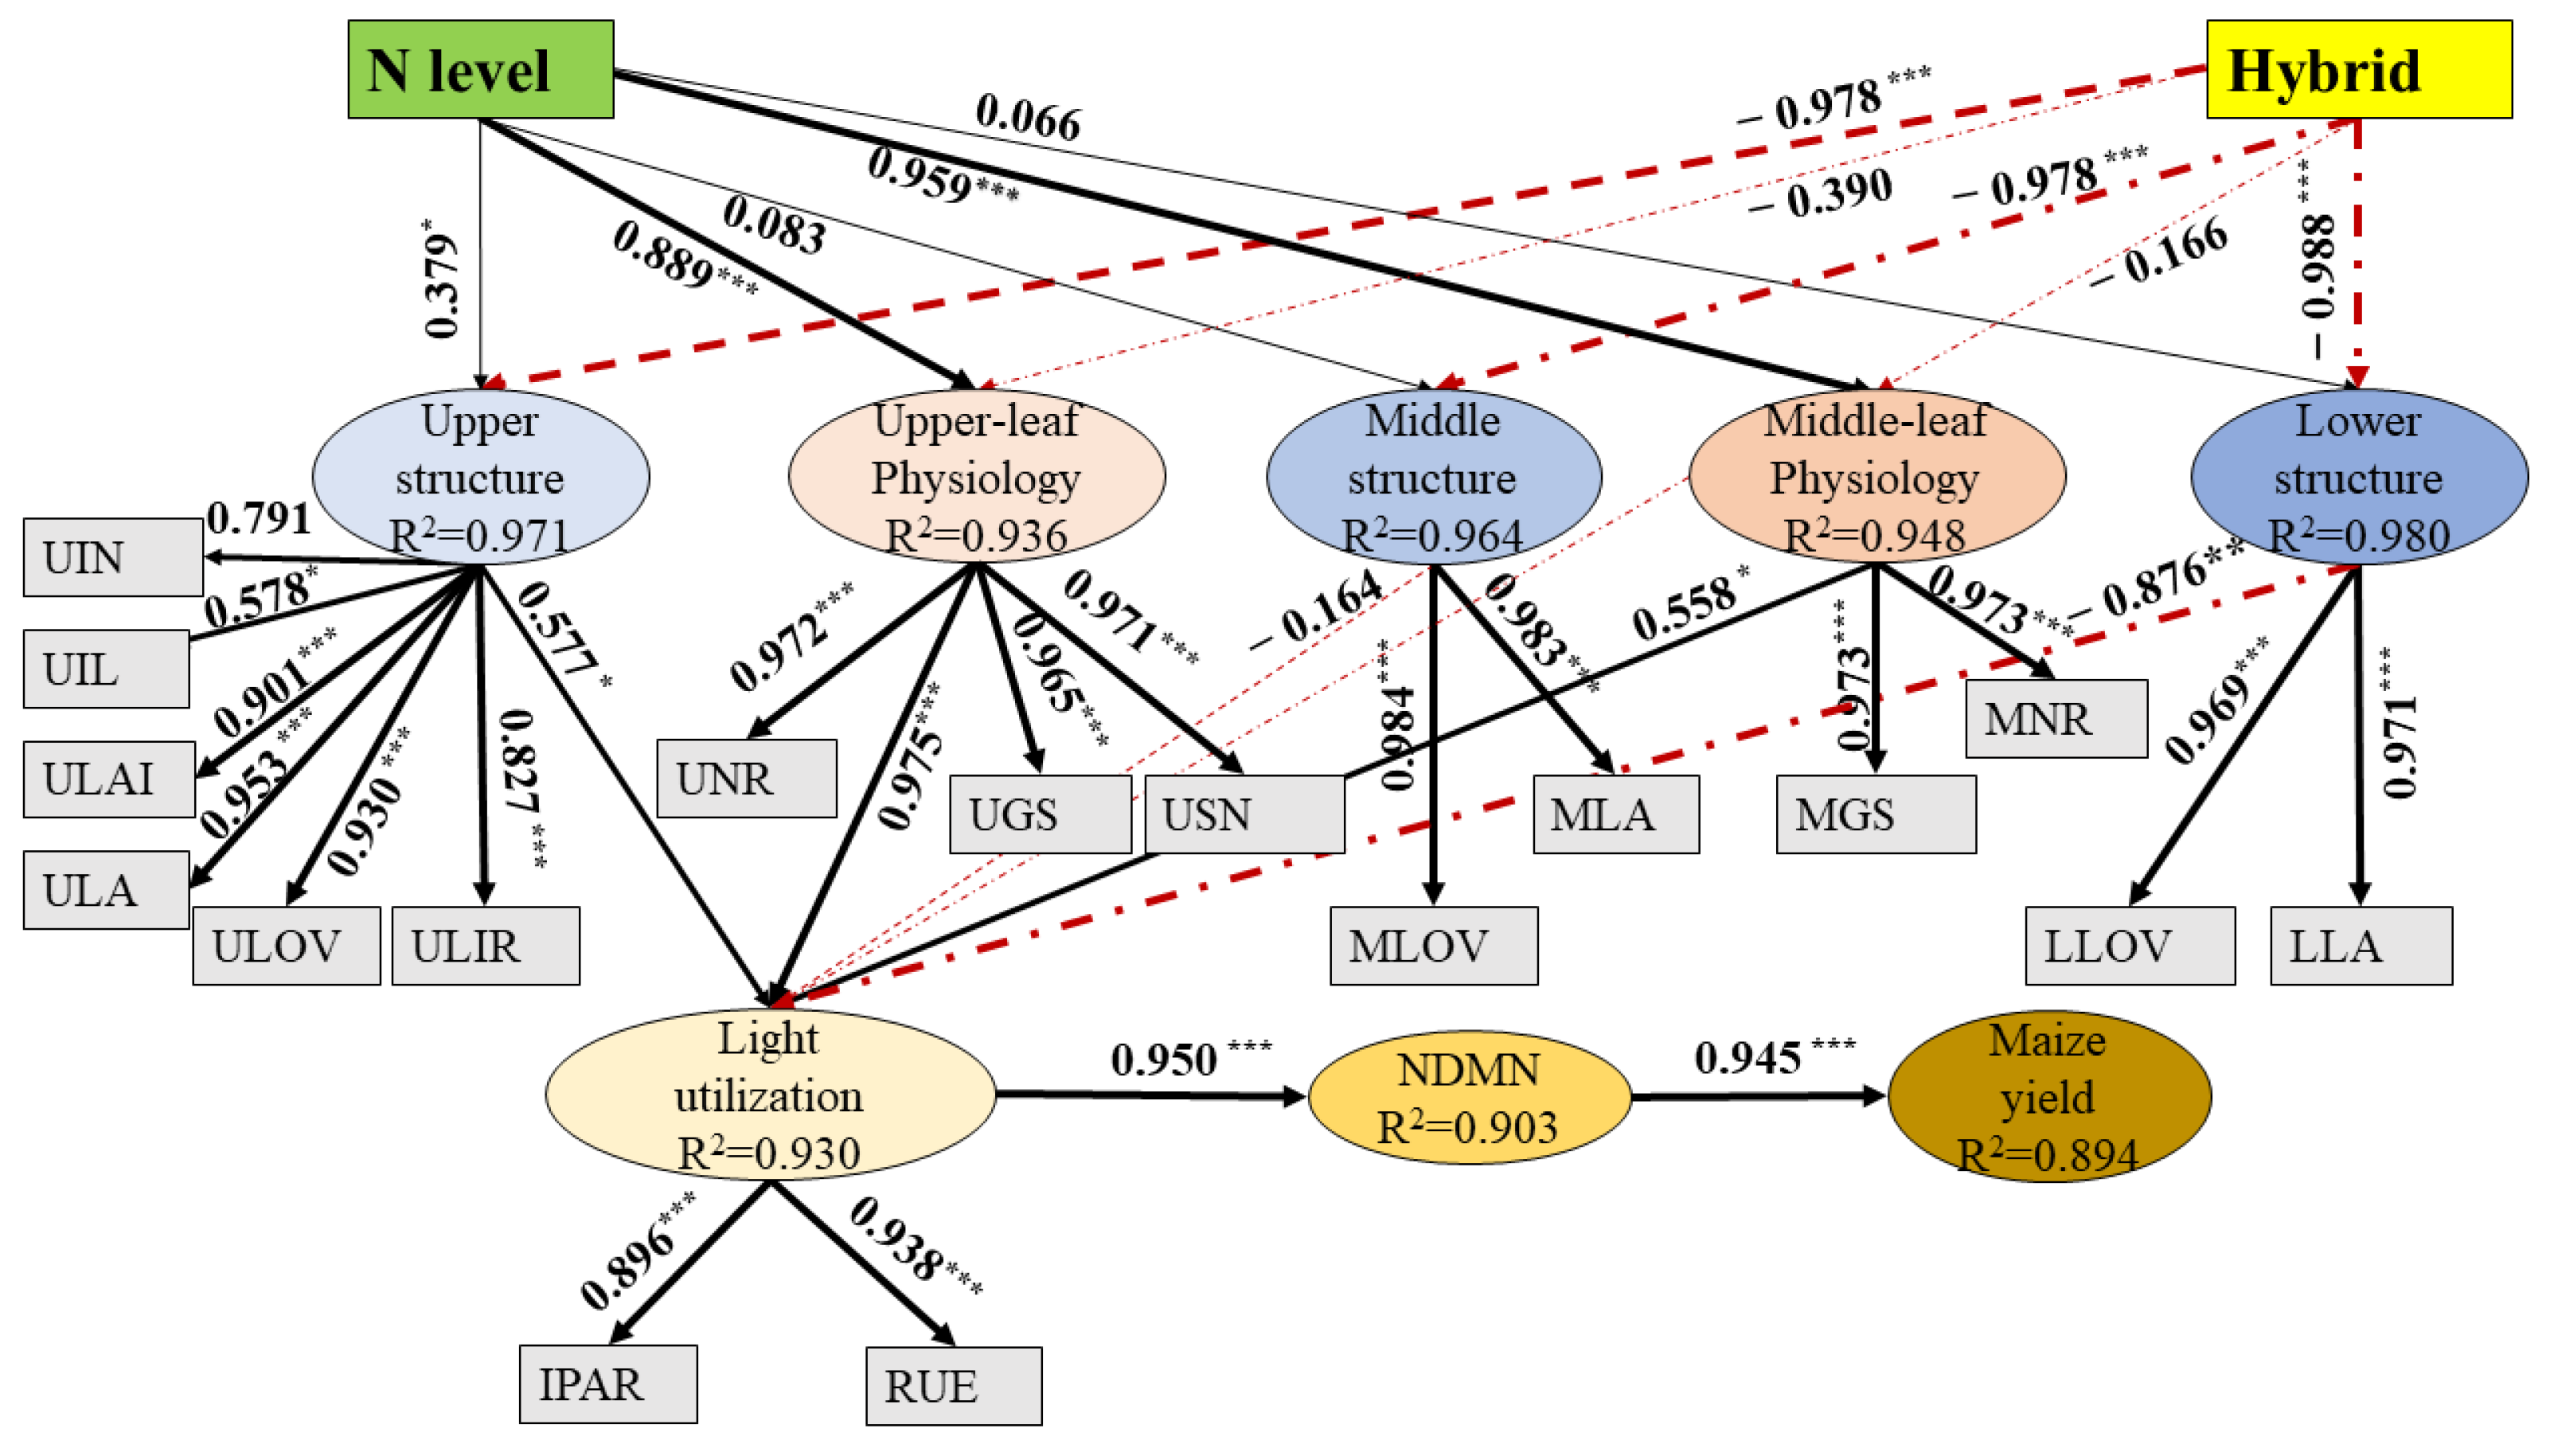
The simulation results showed that the combined reliability value and Cronbach’s α coefficient value of the model were higher than the recommended threshold of 0.70, and the average extraction variance value was greater than the recommended threshold of 0.50. As shown in Figure 7, the factor loads of the reflective variable measurement indexes were higher than the threshold value of 0.70 at the level of 0.001. Therefore, the models had good internal consistency and aggregation validity.
The SEM approach showed that the maize upper structure (ULIA, light interception rate of the upper layer; UIN, upper internode number; ULAI, upper leaf area index; UIL, upper internode length; ULOV, upper-layer leaf orientation value; ULA, upper layer angle), upper-layer leaf physiological characteristics (UGS, glutamine synthase enzyme activity of upper leaves; UNR, nitrate reeducates activity of upper leaves; USN content, the silking N content of the upper leaves), middle structure (MLOV, leaf orientation value of the middle layer; MLA, middle-layer leaf angle), middle-layer leaf physiological characteristics (MGS, glutamine synthase enzyme activity of middle leaves; MNR, nitrate reeducates activity of middle leaves), and lower structure (LLOV, leaf orientation value of the lower layer; LLA, lower-layer leaf angle), as well as the light utilization (IPAR and RUE) and accumulated of dry matter, explained the maize yield. SEM indicated that 93.0% of light utilization was explained by the maize upper, middle, and lower structures, as well as the upper physiology and middle physiology; 90.3% of the NDMN was explained by the physiology index; and 89.4% of the yield was explained by the NDMN. Light utilization directly increased with increases in the maize upper layer structure (p < 0.05) and upper-layer (p < 0.001) and middle-layer leaf physiological characteristics (p < 0.05). The middle structure (there was no significant effect on light utilization) and lower structure both had negative effects on light utilization. The maize yield also indirectly increased with increases in the physiology index and NDMN. The path coefficient was 95.0% × 94.5% = 89.8%.

4. Discussion

4.1. Hybrids × N Management: Grain Yield

In crop production, the grain yield is determined by crop management practices (such as plant density, fertilization, select higher grain yield hybrid). Since management practices could improve intercepting light, the light distribution, and light conversion efficiency of the canopy, thereby increasing grain yield [26,27]. Consequently, a reasonable canopy structure is the basis for obtaining a high yield [28], while the morphological characteristics of plants are the determining factor for the canopy structure. The size of the leaf area affects the light interception capacity of the canopy, and its vertical distribution affects the capture ability of the canopy and the distribution of light within it [4,9,29]. In our experiment, the canopy structures of maize varieties with different N use efficiencies differed significantly at a high planting density. XY335 did not show a more compact structure, but its longer internode length on the ear (Table 2) and higher internode number of upper layer (Figure 2) were conducive to the expansion of the upper space. These factors also increased the leaf orientation of the upper section (Table 2), which was conducive to a better use of light energy [30]. The key to the construction of a canopy structure with high efficiency is to increase the plant density and proper N application amount [30,31,32]. This study showed that the accumulation of dry matter (Table 3) and grain yield of XY335 were significantly higher than those of ZD958 under the optimal and high-N conditions (N2 and N3) (Table 1). This may be due to the fact that XY335 had a more optimized canopy structure of the upper layer than ZD958, which improved the light energy interception of the planted population under high-density conditions [3].

4.2. The Relationship between the Canopy Structure and Light Utilization

The canopy structure of a maize population is mainly affected by the spatial structure of the leaves and the characteristics of the plant type, which regulate the consistency of light interception and extinction of plants [11]. With changes in the canopy structure, the light distribution and intensity of each layer of the population will change accordingly, which will further affect the efficiency of light energy utilization [13]. A better plant growth type under high-density conditions will lead to a more reasonable canopy structure. Improved ventilation and light transmission of the population will improve the efficiency of light energy absorption and utilization in the canopy and thus increase the grain yield [14,16]. In maize leaves, as the main sites for the interception of PAR, a higher LAI allows for more light to be intercepted [3,4,16,29,33]. In our case, XY335 exhibited a lower leaf area index (LAI) of the lower layer but a higher LAI of the upper and middle layers than ZD958 (Figure 2), which led to a total light interception rate and canopy PAR intercept (IPAR) of XY335 that were significantly higher than those of ZD958 (not including the IPAR under N2 conditions) (Table 3). PAR intercept can be used as the main source of energy for plants to carry out photosynthesis, which can promote crop growth and grain yield [4,31,32]. In this study, further correlation analysis showed that LAI of the upper and middle layers was positively related to the total light interception rate and the canopy IPAR (Figure 6). This suggested that a variety with high N use efficiency can improve the ventilation and light transmittance of the population due to its superior plant characteristics and thus improve the absorption and utilization of light energy in the canopy.
Crop light utilization depends on the light interception ability of the population and the light energy conversion of the plant canopy. Crop genetic improvement, N application, and planting density [2,4,34] exert significant effects on crop light interception and light vertical distribution. Increases in the solar radiation interception of crops can maximize the photosynthesis of leaves and enhance the dry matter yield [35,36,37]. In our case, increased N application could significantly enhance the PAR utilization (RUE). XY335 had a higher RUE and dry matter accumulation than ZD958 under N2 and N3 conditions, mainly because of the increased light interception rate of the upper layer (Table 3). The results show that appropriate increase of N application to soil and selection of varieties with optimized canopy structure can improve the interception efficiency of PAR, thereby maximizing the photosynthesis of leaves and enhancing dry matter accumulation [35,36,37].

4.3. The Relationship between Physiological Characteristics and Light Utilization

The vertical distribution of N and light in the crop canopy represents an adaptive mechanism [21]. In this study, the light intensity decreased with the increasing canopy depth, and the photosynthetic rate of the upper leaves was higher than that of the lower leaves. The synthesis of photosynthetic products increased the demand for N and had a “pull” effect on the N in leaves, thus promoting the N in the lower leaves to shift toward the middle and upper leaves [22]. After the silking stage, the N from the leaves, stem sheaths, and other vegetative organs was transferred to the grain, while the photosynthetic rate decreased, and the interaction of light and N played an important role in the crop metabolism of carbon and N [38]. The photosynthetic N use efficiency (PNUE) represents an instantaneous measurement of leaf N metabolism and indicates the ratio of the maximum photosynthetic rate and leaf N content at the given time [22,38]. PNUE can also be used to compare different varieties [39]. In this study, XY335 had a higher Pn and leaf N content of the upper layer than ZD958 (Figure 3 and Figure 5). In addition, a higher PNUE of the upper layer (10.4%) of the canopy structure was observed in XY335 compared to ZD958 (Figure 6). Further analysis indicated that the Pn and leaf N content of the upper layer were related to the PNUE (Figure 6). These results reveal that adjustment of the light and N distribution in the upper layers plays a crucial role in improving the PNUE and grain yield.
Under light–N matching, the use of light energy by plants is not only positively correlated with the leaf N content but involves also N remobilization and key N metabolic enzyme activity [10,40,41,42]. In this study, we found that XY335 not only exhibited a higher N content in the silking stage but also had higher N remobilization and key N metabolic enzyme activity (GS, GOGAT, and NR activity) in the upper and middle leaves than ZD958 (Figure 4). Further analysis indicated that the upper layer structure (the path coefficient was 57.7%; p < 0.05), the leaf physiological activity of the upper leaves (the path coefficient was 97.5%; p < 0.001), and the leaf physiological activity of the middle leaves (the path coefficient was 55.8%; p < 0.05) directly contributed to light utilization (IPAR and RUE) (Figure 7).
These results suggest that XY335 had a better canopy structure, specifically regarding the physiological characteristics of the upper and middle layers, which helped it to obtain a better light and N matching degree, improved the efficiency of light and N utilization and eventually led to the achievement of a high maize yield under high-density planting conditions.

5. Conclusions

The maize variety XY335 had specific and unique plant traits that helped to build a better canopy structure. Moreover, the higher activities of key N assimilatory enzymes (GS, NR, and GOGAT) of the upper and middle leaves, which regulated the leaf physiological activities, supported leaf N absorption and N utilization. Therefore, the optimized canopy structure, combined with the higher leaf N assimilation enzyme activity of XY335, were more conducive to increased photosynthetic N use efficiency, canopy PAR interception (IPAR) and PAR utilization (RUE), as well as better light and N matching, ultimately leading to an increased grain yield under high-density conditions. These results, to some extent, could be used for maize breeding and cultivation, and they indicate that maize varieties with a higher upper layer structure and higher N assimilatory enzymes in the upper and middle leaves tend to achieve higher yields.

Author Contributions

H.R., collected the samples, analyzed the samples, and wrote the manuscript. C.L. and M.Z. designed the study; P.Z. review and editing, B.Z., X.L., X.W., J.G. and Z.D. contributed reagents/materials/analysis tools and analyzed the data. All authors have read and agreed to the published version of the manuscript.

Funding

This research was funded by China Agriculture Research System of MOF and MARA (CARS-02-14), Inner Mongolia Autonomous Region Science and Technology Plan Project (2022YFDZ0041), and the CAAS Science and Technology Innovation Program (2060302-2).

Institutional Review Board Statement

Not applicable.

Informed Consent Statement

Not applicable.

Data Availability Statement

The data presented in this study are available on request from the corresponding author.

Acknowledgments

We gratefully acknowledge the institute of Crop Science, Chinese Academy of Agricultural Sciences/Key Laboratory of Crop Physiology and Ecology, Ministry of Agriculture and Rural Affairs (Beijing 100081, China) for providing the laboratory of this study. We also sincerely thank the reviewers for his critical comments on our original manuscript.

Conflicts of Interest

The authors declare no conflict of interest. All the authors listed have approved the manuscript that is enclosed.

References

  1. Dong, S.T.; Gao, R.Q.; Hu, C.H.; Wang, Q.Y.; Wang, K.J. Study of canopy photosynthesis property and high yield potential after a thesis in maize. Acta Agron. Sin. 1997, 23, 318–325. [Google Scholar]
  2. Li, Y.; Ming, B.; Fan, P.; Liu, Y.; Wang, K.; Hou, P.; Xue, J.; Li, S.; Xie, R. Quantifying contributions of leaf area and longevity to leaf area duration under increased planting density and nitrogen input regimens during maize yield improvement. Field Crop. Res. 2022, 283, 10855. [Google Scholar] [CrossRef]
  3. Liu, K.; Harrison, M.T.; Yan, H.; Liu, D.L.; Meinke, H.; Hoogenboom, G.; Bin Wang, B.; Bin Peng, B.; Guan, K.; Jaegermeyr, J.; et al. Silver lining to a climate crisis in multiple prospects for alleviating crop waterlogging under future climates. Nat. Commun. 2023, 14, 765. [Google Scholar] [CrossRef] [PubMed]
  4. Yu, N.; Ren, B.; Zhao, B.; Liu, P.; Zhang, J. Optimized agronomic management practices narrow the yield gap of summer maize through regulating canopy light interception and nitrogen distribution. Eur. J. Agron. 2022, 137, 126520. [Google Scholar] [CrossRef]
  5. Tollenaar, M.; Lee, E. Yield potential, yield stability and stress tolerance in maize. Field Crop. Res. 2002, 75, 161–169. [Google Scholar] [CrossRef]
  6. Moreau, D.; Allard, V.; Gaju, O.; Le Gouis, J.; Foulkes, M.J.; Martre, P. Acclimation of leaf nitrogen to vertical light gradient at anthesis in wheat is a whole-plant process that scales with the size of the canopy. Plant Physiol. 2012, 160, 1479–1490. [Google Scholar] [CrossRef] [PubMed]
  7. Long, S.P.; Zhu, X.G.; Naidu, S.L.; Ort, D.R. Can improvement in photosynthesis increase crop yields? Plant Cell Environ. 2006, 29, 315–330. [Google Scholar] [CrossRef] [PubMed]
  8. Mu, X.; Chen, Q.; Chen, F.; Yuan, L.; Mi, G. Within-Leaf Nitrogen Allocation in Adaptation to Low Nitrogen Supply in Maize during Grain-Filling Stage. Front. Plant Sci. 2016, 7, 699. [Google Scholar] [CrossRef] [PubMed]
  9. Massignam, A.M.; Chapman, S.C.; Hammer, G.L.; Fukai, S. Effects of nitrogen supply on canopy development of maize and sunflower. Crop. Pasture Sci. 2012, 62, 1045–1055. [Google Scholar] [CrossRef]
  10. Nasar, J.; Wang, G.-Y.; Ahmad, S.; Muhammad, I.; Zeeshan, M.; Gitari, H.; Adnan, M.; Fahad, S.; Bin Khalid, M.H.; Zhou, X.-B.; et al. Nitrogen fertilization coupled with iron foliar application improves the photosynthetic characteristics, photosynthetic nitrogen use efficiency, and the related enzymes of maize crops under different planting patterns. Front. Plant Sci. 2022, 13, 988055. [Google Scholar] [CrossRef]
  11. Shen, X.Y.; Dai, J.Y.; Hu, A.C. Studies on relationship among character of canopy light interception and yield in maize populations (Zea mays L.). Acta Agron. Sin. 1993, 19, 246–252, (In Chinese with English Abstract). [Google Scholar]
  12. Lai, Z.M.; Yang, K.C.; Lei, B.M.; Wen, A.C. Studies on the inheritance of quantitative traits in several inbred lines of maize. Sci. Agri. Sin. 1981, 4, 28–36, (In Chinese with English Abstract). [Google Scholar]
  13. Hikosaka, K.; Terashima, I.; Katoh, S. Effects of leaf age, nitrogen nutrition and photon flux density on the distribution of nitrogen among leaves of a vine (Ipomoea tricolor Cav.) grown horizontally to avoid mutual shading of leaves. Oecologia 1994, 97, 451–457. [Google Scholar] [CrossRef]
  14. Bernhard, B.J.; Below, F.E. Plant population and row spacing effects on corn: Plant growth, phenology, and grain yield. Agron. J. 2020, 112, 2456–2465. [Google Scholar] [CrossRef]
  15. Raza, M.A.; Cui, L.; Khan, I.; Din, A.M.U.; Chen, G.; Ansar, M.; Ahmed, M.; Ahmad, S.; Manaf, A.; Titriku, J.K.; et al. Compact maize canopy improves radiation use efficiency and grain yield of maize/soybean relay intercropping system. Environ. Sci. Pollut. Res. 2021, 28, 41135–41148. [Google Scholar] [CrossRef] [PubMed]
  16. Fromme, D.D.; Spivey, T.A.; Grichar, W.J. Agronomic Response of Corn (Zea mays L.) Hybrids to Plant Populations. Int. J. Agron. 2019, 2019, 3589768. [Google Scholar] [CrossRef]
  17. Tollenaar, M.; Deen, W.; Echarte, L.; Liu, W. Effect of Crowding Stress on Dry Matter Accumulation and Harvest Index in Maize. Agron. J. 2006, 98, 930–937. [Google Scholar] [CrossRef]
  18. Li, Y.L.; Huang, X.L.; Xi, Z.Y.; Jia, J.X.; Wang, S.H. Study on the basis of the quantitative inheritance of the simultaneous improvement of corn plant-type and ear-kernel traits. Acta Agric. Uni. Henan. 1996, 30, 319–323. [Google Scholar]
  19. Maddonni, G.A.; Otegui, M.E.; Cirilo, A.G. Plant population density, rows pacing and hybrid effects on maize canopy architecture and light attenuation. Field Crops Res. 2001, 71, 183–193. [Google Scholar] [CrossRef]
  20. Pommel, B.; Gallais, A.; Coque, M.; Quilleré, I.; Hirel, B.; Prioul, J.; Andrieu, B.; Floriot, M. Carbon and nitrogen allocation and grain filling in three maize hybrids differing in leaf senescence. Eur. J. Agron. 2006, 24, 203–211. [Google Scholar] [CrossRef]
  21. Anten, N.P.R.; Schieving, F.; Werger, M.J.A. Patterns of light and nitrogen distribution in relation to whole canopy carbon Sgain in C3 and C4 Mono-and dicotyledonous species. Oecologia 1995, 101, 504–513. [Google Scholar] [CrossRef]
  22. Chen, Y.; Wu, D.; Mu, X.; Xiao, C.; Chen, F.; Yuan, L.; Mi, G. Vertical Distribution of Photosynthetic Nitrogen Use Efficiency and Its Response to Nitrogen in Field-Grown Maize. Crop. Sci. 2016, 56, 397–407. [Google Scholar] [CrossRef]
  23. Hirel, B.; Andrieu, B.; Valadier, M.-H.; Renard, S.; Quillere, I.; Chelle, M.; Pommel, B.; Fournier, C.; Drouet, J.-L. Physiology of maize II: Identification of physiological markers representative of the nitrogen status of maize (Zea mays) leaves during grain filling. Physiol. Plant. 2005, 124, 178–188. [Google Scholar] [CrossRef]
  24. Lin, C.C.; Kao, C.H. Disturbed ammonium assimilation is associated with growth inhibition of roots in rice seedlings caused by NaCl. Plant Growth Regul. 1996, 18, 233–238. [Google Scholar] [CrossRef]
  25. Aslam, M.; Travis, R.L.; Rains, D. Enhancement of nitrate reductase activity and metabolic nitrate concentration by methionine sulfoximine in barley roots. Plant Sci. 2001, 161, 133–142. [Google Scholar] [CrossRef]
  26. Zhou, Z.; Struik, P.C.; Gu, J.; van der Putten, P.E.; Wang, Z.; Yin, X.; Yang, J. Leaf-colour modification affects canopy photosynthesis, dry-matter accumulation and yield traits in rice. Field Crop. Res. 2023, 290, 108746. [Google Scholar] [CrossRef]
  27. Pan, Y.; Cao, Y.; Chai, Y.; Meng, X.; Wang, M.; Wang, G.; Guo, S. Identification of photosynthetic parameters for superior yield of two super hybrid rice varieties: A cross-scale study from leaf to canopy. Front. Plant Sci. 2023, 14, 1110257. [Google Scholar] [CrossRef]
  28. Parker, G.G. Tamm review: Leaf Area Index (LAI) is both a determinant and a consequence of important processes in vegetation canopies. For. Ecol. Manag. 2020, 477, 118496. [Google Scholar] [CrossRef]
  29. Chen, W.; Zhang, J.; Deng, X. The spike weight contribution of the photosynthetic area above the upper internode in a winter wheat under different nitrogen and mulching regimes. Crop. J. 2018, 7, 89–100. [Google Scholar] [CrossRef]
  30. Yin, L.; Xu, H.; Dong, S.; Chu, J.; Dai, X.; He, M. Optimised nitrogen allocation favours improvement in canopy photosynthetic nitrogen-use efficiency: Evidence from late-sown winter wheat. Environ. Exp. Bot. 2019, 159, 75–86. [Google Scholar] [CrossRef]
  31. Wu, B.; Zuo, W.; Yang, P.; Zhang, W. Optimal water and nitrogen management increases cotton yield through improving leaf number and canopy light environment. Field Crop. Res. 2023, 290, 108745. [Google Scholar] [CrossRef]
  32. Yan, P.; Yue, S.; Qiu, M.; Chen, X.; Cui, Z.; Chen, F. Using maize hybrids and in-season nitrogen management to improve grain yield and grain nitrogen concentrations. Field Crop. Res. 2014, 166, 38–45. [Google Scholar] [CrossRef]
  33. Plénet, D.; Mollier, A.; Pellerin, S. Growth analysis of maize field crops under phosphorus deficiency. II. Radiation-use efficiency, biomass accumulation and yield components. Plant Soil 2000, 224, 259–272. [Google Scholar] [CrossRef]
  34. Duan, F.; Wei, Z.; Soualiou, S.; Zhou, W. Nitrogen partitioning in maize organs and underlined mechanisms from different plant density levels and N application rate in China. Field Crop. Res. 2023, 294, 108874. [Google Scholar] [CrossRef]
  35. Gardner, F.P.; McCloud, D.E.; Valle, R. Yield Characteristics of Ancient Races of Maize Compared to a Modern Hybrid. Agron. J. 1990, 82, 864–868. [Google Scholar] [CrossRef]
  36. Li, H.; Liang, Z.; Ding, G.; Shi, L.; Xu, F.; Cai, H. A Natural Light/Dark Cycle Regulation of Carbon-Nitrogen Metabolism and Gene Expression in Rice Shoots. Front. Plant Sci. 2016, 7, 1318. [Google Scholar] [CrossRef]
  37. Ning, P.; Yang, L.; Li, C.; Fritschi, F.B. Post-silking carbon partitioning under nitrogen deficiency revealed sink limitation of grain yield in maize. J. Exp. Bot. 2018, 69, 1707–1719. [Google Scholar] [CrossRef]
  38. Ma, Q.; Li, Y.; Zhu, Y.; Liu, X.; Yu, H.; Li, L.; Qi, M.; Sun, H.; Yin, Z.; Wang, Y.; et al. Precipitation variations, rather than N deposition, determine plant ecophysiological traits in a desert steppe in Northern China. Ecol. Indic. 2022, 141, 109144. [Google Scholar] [CrossRef]
  39. Ghannoum, O.; Evans, J.R.; Chow, W.S.; Andrews, T.J.; Conroy, J.P.; von Caemmerer, S. Faster Rubisco Is the Key to Superior Nitrogen-Use Efficiency in NADP-Malic Enzyme Relative to NAD-Malic Enzyme C4 Grasses. Plant Physiol. 2005, 137, 638–650. [Google Scholar] [CrossRef]
  40. Ren, H.; Jiang, Y.; Zhao, M.; Qi, H.; Li, C. Nitrogen Supply Regulates Vascular Bundle Structure and Matter Transport Characteristics of Spring Maize Under High Plant Density. Front. Plant Sci. 2021, 11, 602739. [Google Scholar] [CrossRef]
  41. Ren, H.; Zhao, M.; Zhou, B.; Zhou, W.; Li, K.; Qi, H.; Jiang, Y.; Li, C. Understanding physiological mechanisms of variation in grain filling of maize under high planting density and varying nitrogen applicate rate. Front. Nutr. 2022, 9, 998946. [Google Scholar] [CrossRef] [PubMed]
  42. Nasar, J.; Zhao, C.J.; Khan, R.; Gul, H.; Gitari, H.; Shao, Z.; Abbas, G.; Haider, I.; Iqbal, Z.; Ahmed, W.; et al. Maize-soybean intercropping at optimal N fertilization increases the N uptake, N yield and N use efficiency of maize crop by regulating the N assimilatory enzymes. Front. Plant Sci. 2023, 13, 1077948. [Google Scholar] [CrossRef] [PubMed]
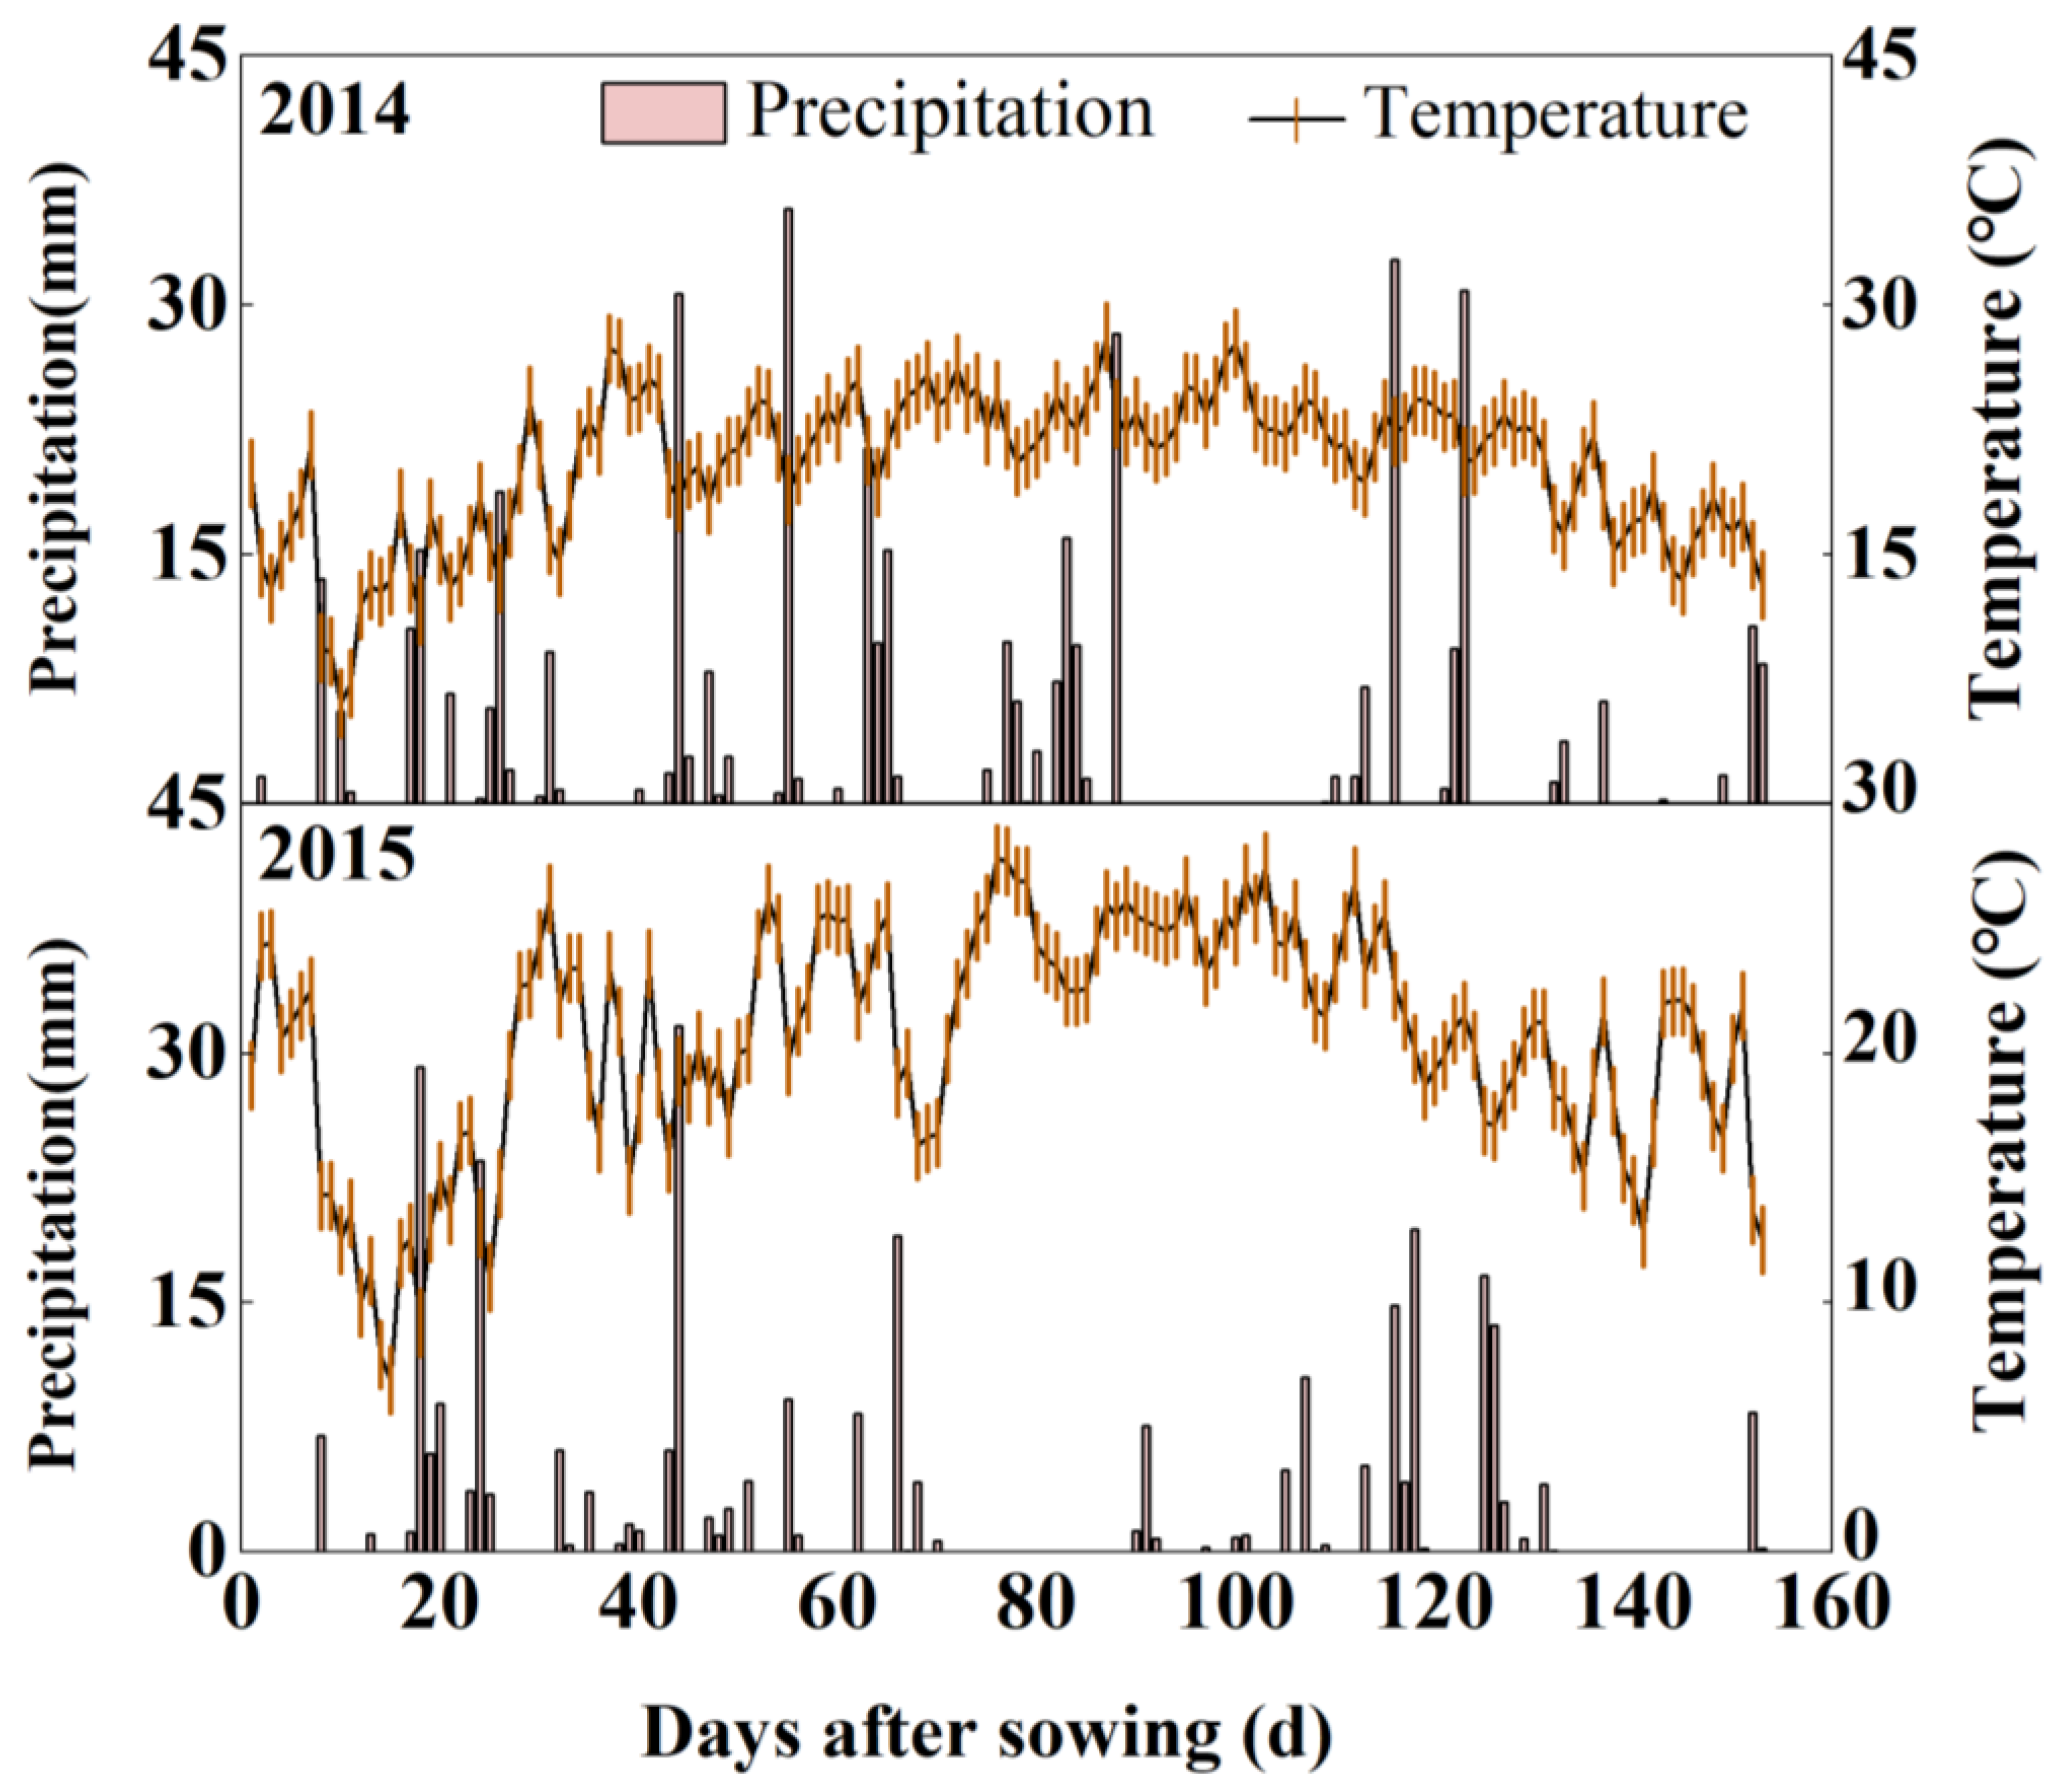
Figure 1. Daily precipitation and mean temperature during the growing seasons of 2014 and 2015.
Agronomy 13 01146 g001
Figure 2. Leaf area index and upper internode number of different maize genotypes at a high plant density in 2014 and 2015. N0, N1, N2, and N3 indicate applications of 0, 100, 200, and 300 kg N ha−1, respectively. Different letters indicate a significant difference at the 5% level. Values are shown as the mean ± SE (n = 3). *** p < 0.001. NS, no significance.
Agronomy 13 01146 g002
Figure 3. N content and remobilization in different maize genotypes at a high plant density in 2014 and 2015. N0, N1, N2, and N3 indicate applications of 0, 100, 200, and 300 kg N ha−1, respectively. Different letters indicate a significant difference at the 5% level. Values are shown as the mean ± SE (n = 3).
Agronomy 13 01146 g003
Figure 4. GS activity, GOGAT activity and NR activity of different maize genotypes at a high plant density in 2014 and 2015. N0, N1, N2, and N3 indicate applications of 0, 100, 200, and 300 kg N ha−1, respectively. Different letters indicate a significant difference at the 5% level. Values are shown as the mean ± SE (n = 5). ** p < 0.01, *** p < 0.001. NS, no significance.
Agronomy 13 01146 g004
Figure 5. Pn and PNUE of leaves of different maize genotypes at a high plant density in 2015. N0, N1, N2, and N3 indicate applications of 0, 100, 200, and 300 kg N ha−1, respectively. Different letters indicate a significant difference at the 5% level. Values are shown as the mean ± SE (n = 3). * p < 0.05, ** p < 0.01, *** p < 0.001. NS, no significance.
Agronomy 13 01146 g005
Figure 6. Correlation analysis of PAR utilization (RUE), canopy PAR intercept (IPAR), leaf N content, and grain yield at different N fertilization levels in 2015. USN and MSN, silking N content of the upper and middle leaf. UPn and MPn, net photosynthetic rate of upper and middle layer; UPNUE and MPNUE, photosynthetic N use efficiency of upper and middle layer; ULIR and MLIR, light intercept rate of upper and middle layer; ULAI and MLAI, upper and middle leaf area index; UIN, the internode number of upper layer; UIL and MIL, the internode length of upper and middle layer; ULA and MLA, leaf angle of upper and middle layer; ULOV and MLOV, leaf orientation value upper layer and middle layer; UGS and MGS, glutamine synthase activity of upper and middle leaf; UGOGAT and MGOGAT, glutamate synthase activity of upper and middle leaf; UNR and MNR, nitrate reductase activity of upper and middle leaf; NDMM, the dry matter accumulation, IPAR; the canopy PAR intercept; RUE, the PAR utilization; TLIR, total light intercept rate.
Agronomy 13 01146 g006
Figure 7. Structural equation models (SEMs) explaining the PNUE, RUE, NDMN, and maize grain yield in 2015. LLOV, leaf orientation value of the lower layer; LLA, lower-layer leaf angle. The other letters have the same meanings as in Figure 7. The number above each arrow is the standardized path coefficient. * p < 0.05, ** p < 0.01, *** p < 0.001. R2 values within the circles denote the proportion of variance that can be explained by the corresponding variable in the SEM. The arrow width is proportional to the strength of the path coefficient adjacent to the numbers. Solid lines represent positive paths and dotted lines represent negative paths.
Agronomy 13 01146 g007
Table 1. Yields and yield compositions of maize of different genotypes at a high plant density in 2014 and 2015.
N Rate
(kg N ha−1)
HybridGrain Yield (t ha−1)Kernel No. per Ear1000-Kernel Weight (g)
201420152014201520142015
0XY3355.1 ± 0.2 f4.9 ± 0.7 e265.1 ± 2.2 f296.9 ± 2.4 g298.5 ± 0.9 f272.7 ± 1.4 g
ZD9586.3 ± 0.3 e6.3 ± 0.3 d332.8 ± 1.8 e318.4 ± 1.1 f328.2 ± 1.4 e334.4 ± 2.4 e
100XY3359.3 ± 0.2 d8.4 ± 0.2 c542.4 ± 2.6 b485.6 ± 1.2 b300.9 ± 1.0 f312.4 ± 2.1 f
ZD9589.4 ± 0.1 d8.2 ± 0.1 c507.4 ± 2.1 c425.1 ± 0.9 e348.0 ± 2.4 d351.4 ± 2.6 c
200XY33512.8 ± 0.9 ab12.5 ± 0.5 a594.6 ± 1.9 a516.0 ± 1.2 a350.9 ± 1.9 d351.0 ± 0.5 c
ZD95812.0 ± 0.6 c11.0 ± 0.5 b504.1 ± 2.0 c443.7 ± 3.3 d370.6 ± 1.5 c364.7 ± 2.0 a
300XY33513.5 ± 0.5 a12.5 ± 0.5 a590.7 ± 5.7 a513.3 ± 3.7 a384.9 ± 3.0 b342.1 ± 0.6 d
ZD95812.7 ± 0.1b c11.2 ± 0.1 b498.3 ± 2.1 d453.3 ± 1.1 c395.0 ± 1.3 a356.4 ± 1.7 b
ANOVA Year (Y)*********
N level (N)*********
Hybrids (H)NS******
N × H*********
Y × N × HNS******
N0, N1, N2, and N3 indicate applications of 0, 100, 200, and 300 kg N ha−1, respectively. Different letters indicate a significant difference at the 5% level. Values are shown as the mean ± SE (n = 3). *** p < 0.001. NS, no significance.
Table 2. Internode length, leaf angle, and leaf orientation of different maize genotypes under high plant density.
YearN RateHybridInternode Length (cm)Leaf Angle (°)Leaf Orientation Value
(kg N ha−1) Upper LayerMiddle LayerLower LayerUpper LayerMiddle LayerLower LayerUpper LayerMiddle LayerLower Layer
20140XY33515.5 ± 0.5 a18.0 ± 0.2 a16.3 ± 0.2 c------
ZD95812.3 ± 0.4 d12.6 ± 0.4 d15.3 ± 0.2 d------
100XY33515.8 ± 0.3 a16.3 ± 0.6 b18.6 ± 0.2 b------
ZD95813.6 ± 0.6 c13.7 ± 0.2 c14.5 ± 0.2 e------
200XY33515.4 ± 0.2 a18.2 ± 0.3 a19.2 ± 0.2 a------
ZD95810.5 ± 0.4 e12.3 ± 0.2 d12.4 ± 0.4 f------
300XY33514.6 ± 0.4 b18.2 ± 0.2 a19.6 ± 0.3 a------
ZD95811.9 ± 0.1 e12.5 ± 0.1 d12.4 ± 0.4 f------
20150XY33516.6 ± 0.2 a16.3 ± 0.3 c17.4 ± 0.4 c18.4 ± 0.3 c33.3 ± 0.2 d32.2 ± 0.3 a65.4 ± 0.4 c47.6 ± 0.4 d48.2 ± 0.1 g
ZD95812.4 ± 0.3 e12.2 ± 0.4 e14.4 ± 0.4 d15.2 ± 0.2 e24.3 ± 0.6 e15.2 ± 0.2 e47.6 ± 0.2 g45.6 ± 0.2 f58.6 ± 0.2 d
100XY33515.6 ± 0.5 b17.4 ± 0.4 e18.6 ± 0.2 b20.0 ± 0.3 b36.4 ± 0.4 c28.5 ± 0.4 b65.1 ± 0.2 c47.5 ± 0.4 e51.4 ± 0.2 e
ZD95812.7 ± 0.1 e13.6 ± 0.2 d13.4 ± 0.4 e15.5 ± 0.3 e18.2 ± 0.4 f15.9 ± 0.3 d52.9 ± 0.4 f59.3 ± 0.4 a60.3 ± 0.2 c
200XY33514.4 ± 0.3 c18.4 ± 0.2 a20.6 ± 0.2 a21.3 ± 0.2 a37.6 ± 0.1 b28.5 ± 0.2 b66.5 ± 0.2 b48.4 ± 0.2 e52.7 ± 0.2 d
ZD95810.6 ± 0.3 f12.3 ± 0.2 e12.5 ± 0.2 f16.1 ± 0.3 d19.1 ± 0.3 g17.0 ± 0.2 c58.6 ± 0.3 e59.7 ± 0.31 a66.5 ± 0.3 a
300XY33513.6 ± 0.2 d17.5 ± 0.4 b20.6 ± 0.4 a21.2 ± 0.2 a38.3 ± 0.1 a31.3 ± 0.3 a67.6 ± 0.2 a50.5 ± 0.3 c48.2 ± 0.34 g
ZD95810.5 ± 0.2 f12.7 ± 0.3 e12.4 ± 0.4 f15.4 ± 0.3 e21.7 ± 0.3 f17.5 ± 0.2 c60.5 ± 0.3 d58.7 ± 0.3 b63.5 ± 0.3 b
ANOVA N level (N)***NSNS******************
Hybrids (H)***************************
N × H**************************
N0, N1, N2, and N3 indicate applications of 0, 100, 200, and 300 kg N ha−1, respectively. Different letters indicate a significant difference at the 5% level. Values are shown as the mean ± SE (n = 3). ** p < 0.01, *** p < 0.001. NS, no significance.
Table 3. Light interception rate, NDMM, and RUE of maize of different genotypes at a high plant density in 2014 and 2015.
YearN Rate
(kg N ha−1)
HybridLight Interception Rate (%)NDMM
(g m−2)
IPAR
(MJ m−2)
RUE
(g MJ−1)
UpperMiddleLowerTotal
2014N0XY33557.9 ± 0.8 e21.2 ± 0.6 b13.5 ± 0.9 a92.6 ± 0.5 d1253.8 ± 17.3 h1151.1 ± 6.6 d1.1 ± 0.02 g
ZD95855.7 ± 0.7 f20.0 ± 0.8 bc14.5 ± 0.4 a90.3 ± 0.5 e1456.4 ± 8.1 g1121.9 ± 6.3 e1.3 ± 0.01 f
N1XY33568.5 ± 0.9 b17.6 ± 1.6 e9.1 ± 0.4 c95.1 ± 0.6 bc2207.3 ± 4.0 f1181.7 ± 7.2 c1.9 ± 0.01 e
ZD95853.3 ± 1.8 g25.9 ± 0.1 a14.3 ± 1.0 a93.5 ± 0.8 d2281.8 ± 11.8 e1161.6 ± 9.8 d2.0 ± 0.03 d
N2XY33565.6 ± 1.6 c19.4 ± 0.3 cd9.6 ± 0.7 c94.6 ± 0.8 c3062.7 ± 8.6 b1175.7 ± 9.6 bc2.6 ± 0.03 b
ZD95863.1 ± 1.8 d20.2 ± 0.9 bc12.1 ± 0.9 b95.4 ± 0.1 ab2779.9 ± 11.6 d1185.8 ± 0.6 ab2.3 ± 0.01 c
N3XY33573.1 ± 1.0 a15.3 ± 1.2 f7.9 ± 0.1 d96.2 ± 0.2 a3245.3 ± 11.4 a1196.3 ± 2.9 a2.7 ± 0.01 a
ZD95864.9 ± 0.4 cd18.1 ± 0.2 de11.5 ± 0.2 b94.4 ± 0.3 bc3024.2 ± 3.2 c1173.5 ± 3.3 bc2.6 ± 0.01 b
2015N0XY33557.4 ± 1.3 e18.3 ± 0.2 b15.1 ± 1.0 ab90.7 ± 0.6 d1532.2 ± 3.1 h1127.8 ± 7.0 d1.4 ± 0.01 h
ZD95855.0 ± 1.6 f16.7 ± 0.2 cd16.2 ± 0.4 a87.9 ± 1.3 e1547.9 ± 2.1 g1092.3 ± 16.6 e1.4 ± 0.02 g
N1XY33566.4 ± 0.3 b15.5 ± 1.1 de11.3 ± 0.8 d93.2 ± 0.5 ab2114.9 ± 4.2 f1157.9 ± 6.4 ab1.8 ± 0.01 f
ZD95852.4 ± 1.2 g23.0 ± 0.4 a16.3 ± 0.8 a91.7 ± 0.7 cd2152.3 ± 3.6 e1139.8 ± 9.3 cd1.9 ± 0.02 e
N2XY33564.4 ± 2.1 bc16.4 ± 0.5 de11.5 ± 1.0 d92.3 ± 1.0 bc2668.9 ± 12.8 c1147.0 ± 12.6 bc2.3 ± 0.04 c
ZD95861.0 ± 1.6 d17.7 ± 0.7 bc14.3 ± 0.9 bc93.0 ± 0.1 ab2407.4 ± 15.1 d1156.5 ± 1.0 ab2.1 ± 0.01 d
N3XY33571.5 ± 1.3 a12.4 ± 1.3 f10.0 ± 0.1 e93.9 ± 0.3 a3155.7 ± 5.4 a1167.0 ± 3.6 a2.7 ± 0.01 a
ZD95863.1 ± 0.3 cd15.4 ± 0.2 de13.7 ± 0.2 c92.2 ± 0.2 bc2832.0 ± 6.5 b1145.6 ± 2.7 bc2.5 ± 0.01 b
ANOVA Year(Y)*********************
N rate (N)*********************
Hybrid (H)*********************
N × H*********************
Y × N × HNSNSNSNS***NS***
NDMM is the dry matter accumulation (g·m−2), IPAR is the canopy PAR intercept (MJ·m−2), and RUE is the PAR utilization. N0, N1, N2, and N3 indicate applications of 0, 100, 200, and 300 kg N ha−1, respectively. Different letters indicate a significant difference at the 5% level. Values are shown as the mean ± SE (n = 3). *** p < 0.001. NS, no significance.
Disclaimer/Publisher’s Note: The statements, opinions and data contained in all publications are solely those of the individual author(s) and contributor(s) and not of MDPI and/or the editor(s). MDPI and/or the editor(s) disclaim responsibility for any injury to people or property resulting from any ideas, methods, instructions or products referred to in the content.