Article

Effects of Changing Climate Extremes on Maize Grain Yield in Northeast China

College of Resources and Environmental Sciences, China Agricultural University, No. 2 Yuanmingyuan West Rd., Haidian District, Beijing 100193, China
*
Author to whom correspondence should be addressed.
Agronomy 2023, 13(4), 1050; https://doi.org/10.3390/agronomy13041050
Submission received: 9 February 2023 / Revised: 30 March 2023 / Accepted: 31 March 2023 / Published: 4 April 2023
(This article belongs to the Section Farming Sustainability)

Abstract

:
The increased frequency of climate extremes associated with ongoing climate change has the potential for significant impacts on maize grain yield in maize-producing regions worldwide. In this study, we used a modeling approach to investigate the effects of different types of climatic extremes on maize grain yield in Northeast China. We combined annual mean air temperature and accumulated precipitation data and divided the climate years into 9 categories, using the 10th and 90th percentiles as extreme thresholds. The climate data were represented by 1 normal climate type, 4 individual climate extremes, and 4 combined climate extremes. Changes in the frequencies of climate extremes and their impacts on maize grain yields were analyzed for two 30-year periods (period I: 1960–1989; period II: 1990–2019) using the Agricultural Production Systems sIMulator (APSIM-Maize). Compared with period I, the occurrences of the normal climate and all 3 cold-related climate extremes (i.e., cold-normal, cold-humid, and cold-dry) decreased during period II, while occurrences of the other climate extremes increased. Moreover, according to the APSIM-Maize model, the estimated yield in the years with a normal climate decreased by 4.01%; the 3 cold-related climate extremes increased yields by 26.56%, 12.10%, and 6.68%, respectively; the 2 warm-related climate extremes (warm-normal and warm-dry) and normal-humid years decreased estimated yields by 6.39%, 24.12%, and 5.10%, respectively. The increase in the occurrence of warm-humid years increased the estimated yield by 11.69%. This work confirms the adverse effects of warmer temperatures in the absence of excess rainfall on grain yield and highlights the importance of extremely dry or wet conditions under normal temperature conditions.

1. Introduction

Widespread evidence suggests that the increase in frequency and intensity of extreme weather events in the context of global climate change is a threat to agricultural production and food security [1,2,3,4,5]. This is of particular relevance for maize production in Northeast China. As one of the largest corn production regions in China, Northeast China accounts for more than 32% of the annual production of maize in the country [6,7]. China ranks second globally for maize production and consumption [8,9]. In 2019, the worldwide harvest area of maize was 2.39 × 10⁸ ha, and the total production was 1.41 × 10⁹ tons [10].
The growth and development of crops are determined by genes and the environment. From a macroscopic perspective, the growth and yield of maize are very sensitive to climate change and extreme climate. From a microscopic perspective, the expression of genes, inhibitors, and transcription factors in maize also plays a crucial role in growth and development and stress response, affecting processes such as seed germination, morphogenesis, flowering, and the abiotic stress response [11,12]. Therefore, plant breeders must be prepared to meet the challenge of climate change and feed the world by cultivating varieties that are more adaptable to environments with limited water resources [13].
Due to the lack of preventive measures to address frequent extreme climate events, the annual agricultural disaster area in Northeast China reached 6.43 × 10⁴ km2 by 2016 [14], with an increasingly severe impact on agricultural production [15,16,17,18]. Zhang and Huang [19] found that the decrease in precipitation negatively impacts yields as temperatures increase in northern China.
The rainfed potential yield is the possible crop yield with no irrigation, no pests or weeds, sufficient nutrients [20], and a specific combination of solar radiation, water, temperature, and soil conditions. The potential yield of rainfed crops in a country or region is greater than the actual yield because many restrictive factors affect the latter [21]. Due to the lack of accurate observations of field management measures, obtaining reliable data on the potential yield of rainfed crops in the field is difficult [22], and crop models are often used for simulation. The Agricultural Production Systems Simulator (APSIM) model has been widely used to study the impact of climate change on crop productivity and can accurately simulate the growth and yield of crops [23,24]. In this study, the APSIM model was used to simulate the rainfed potential yield of maize.
Most previous studies on the impact of climate change on maize grain yields in Northeast China have focused on the changing trends of normal climate factors over a certain period [25,26], while few researchers have separated normal climate from climate extremes and analyzed the impact of individual climate extremes and combined climate extremes in depth. There is a close relationship between precipitation and temperature. Combining temperature and precipitation into different climate year types can more clearly reflect the temporal and spatial distributions of extreme climatic changes. This study set out to investigate the impact of changes in the frequency of occurrence of different climate extreme types during 1960–2019 on maize yield in Northeast China, using long-term climate datasets and a modeling approach to simulate maize grain yield. In this study, we took 1990 as the time node and divided 1960–2019 into two 30-year periods (period I: 1960–1989 and period II: 1990–2019). We combined annual mean air temperature and accumulated precipitation data and divided the climate years into 9 categories (including 1 normal climate, 4 individual climate extremes, and 4 combined climate extremes). Different types of climate extremes were identified based on the 10th and 90th percentiles as having extreme thresholds. Then, based on the maize grain yield estimated by the well-validated APSIM-Maize model, we analyzed the effects of a normal climate and climate extremes on maize grain yields in Northeast China. The purposes of this study were to (1) explore the temporal and spatial changes in the frequencies of a normal climate and climate extremes, and (2) explore the impact of a normal climate and climate extremes on maize grain yield (estimated using the APSIM-Maize model). The results of this research provide a reference for climate extremes and disaster prevention and mitigation.

2. Materials and Methods

2.1. Study Area and Climatic Data

The study area (Figure 1) was the cultivable area of maize (the area with an accumulated temperature ≥ 10 °C or greater than 2100 °C d) in the three provinces in Northeast China, including Heilongjiang, Jilin, and Liaoning [27]. The daily meteorological data from 1960 to 2019 at 62 meteorological stations (Figure 1) were obtained from the China Meteorological Data Network [28]. These data included maximum air temperature, minimum air temperature, average air temperature, wind speed, precipitation, and sunshine duration data.

2.2. Simulation of Rainfed Potential Yield

Since maize production is mainly rainfed in Northeast China, the rainfed potential yield, which is defined as “the crop yield obtained with no other manageable limitation apart from the water supply” [29], was simulated as the climate-related yield by the APSIM-Maize model. The APSIM-Maize model can accurately simulate the growth and yield of maize [1], including in Northeast China [30]. The APSIM-Maize model is based on the interaction between climate, soil, management measures, and crop growth. In this study, we constructed the model with historical climate data (1960–2019), soil data, and management measures. The soil data were obtained from the China Soil Scientific Database (CSSD) and included bulk density (BD), drained upper limit (DUL), 15-bar lower limit (LL15), and saturated volumetric water content (SAT) in different soil layers [30]. The management measures were collected from the local agro-meteorological stations. A detailed description of the model can be found in our previous report [30]. The Penman–Monteith [31] formula was used to calculate the daily solar radiation. The stations and years used for APSIM model adjustment and validation are shown in Table 1. The selected sites were representative of each province, and the year was randomly selected. The model was evaluated using international general statistics: R2, RMSE, NRMSE, and D value [32,33]. The specific calculation formulas for these metrics are as follows:
R M S E = i = 1 n O i S i 2 N
N R M S E = R M S E O × 100 %
D = 1 S i O i 2 S i O + O i O 2
where  S i  is the simulated value,  O i  is the observed value,  O  is the observed average value, and  N  is the number of samples.

2.3. Definitions of Normal Climate and Climate Extremes

The extreme state refers to the phenomenon in which the value of a weather or climate variable exceeds a threshold. The threshold often has a value near the high end (or low end) of the range of values for that variable [34]. In this study, the 10th and 90th percentiles of the annual mean temperature and accumulated precipitation distribution of each station were used to identify the upper and lower threshold values, and values above or below these percentiles were regarded as extremes [35,36].
A year was classified as a warm-normal year if the annual mean temperature at the station exceeded the 90th percentile (upper extreme) but as a cold-normal year if the annual mean temperature at the station was lower than the 10th percentile (lower extreme). Similarly, normal-humid years and normal-dry years were classified according to the accumulated precipitation. Under these four conditions, only temperature or precipitation was selected as the classification standard, so these four conditions are referred to as individual climate extremes. A year was classified as a warm-normal year if the annual mean temperature was higher than the 90th percentile and the accumulated precipitation was also higher than the 90th percentile. However, it was regarded as a warm-dry year if the accumulated precipitation was lower than the 10th percentile. Similarly, cold-humid years and cold-dry years were classified according to the accumulated precipitation when the annual mean temperature was lower than the 10th percentile. Temperature and precipitation were selected as the division criteria for these four conditions, so they are referred to as combined climate extremes. Years within these four thresholds were classified as normal-normal, which we refer to as a normal climate (Figure 2).

2.4. Yield Change Rate Due to Climate Extremes

In this study, YCD was used to represent the degree of estimated yield change rate due to climate extremes. YCDI and YCDII were used to represent the change rates in estimated yield relative to a normal climate under different climate extremes in periods I (1960–1989) and II (1990–2019), respectively. According to the definitions of climate extremes in Figure 2, taking warm-normal as an example, the degree of climate extreme estimated yield change in periods I and II relative to the normal climate was calculated based on Equations (4) and (5):
Y C D W a r m - N o r m a l - I = Y W a r m - N o r m a l - I ¯ Y N o r m a l - N o r m a l - I ¯ Y N o r m a l - N o r m a l - I ¯ × 100 %
Y C D W a r m - N o r m a l - I I = Y W a r m - N o r m a l - I I ¯ Y N o r m a l - N o r m a l - I I ¯ Y N o r m a l - N o r m a l - I I ¯ × 100 %
where  Y C D W a r m - N o r m a l - I  and  Y C D W a r m - N o r m a l - I I  are the estimated yield change rates in periods I and II under the warm-normal climate relative to a normal climate, respectively (%).  Y W a r m - N o r m a l - I ¯  and  Y N o r m a l - N o r m a l - I I ¯  are the maize rainfed potential yields in periods I and II under warm-normal conditions, respectively (kg·ha−1).  Y N o r m a l - N o r m a l - I  and  Y N o r m a l - N o r m a l - I I  are the potential maize grain yields in periods I and II under a normal climate, respectively (kg·ha−1).
Yield change rate between two periods (YCR):
Y C R W a r m - N o r m a l = Y C D W a r m - N o r m a l - I I Y C D W a r m - N o r m a l - I
where  Y C R W a r m - N o r m a l  is the potential maize change rate in warm-normal years between the two periods (%).
To examine the significance of the yield change rate due to climate extremes, we conducted a significance test using a two-way ANOVA. The statistical analysis results were represented by MSE (Mean Square Error). MSE described the impact of differences between different climate extremes on yield change (where p-value ≤ 0.05 indicates statistically significant).

3. Results

3.1. Validation of the APSIM Model for Simulating the Maize Growth Period and Yield Results

Figure 3 and Table 2 show the results and evaluation index of the adjustment and validation of the number of days from sowing to flowering and from flowering to maturity, as well as the yield of maize. Through comparison, we observed that the simulated and observed results of the number of days from sowing to flowering and from flowering to maturity and the yield of maize in the study area were evenly distributed on both sides of the 1:1 line. The R2 values of the simulated and observed values of the number of days from sowing to flowering and from flowering to maturity and the yield were 0.79, 0.75, and 0.88, respectively; the NRMSE values were 12.62%, 7.69%, and 7.36%, respectively; and the D values were 0.92, 0.92, and 0.96, respectively, with all values being close to 1. The results showed that the APSIM-Maize model, verified by parameter adjustment, can adequately simulate the growth and yield formation of maize in Northeast China.

3.2. Normal Climate and Climate Extremes

3.2.1. Annual Variation in Normal Climate and Climate Extremes

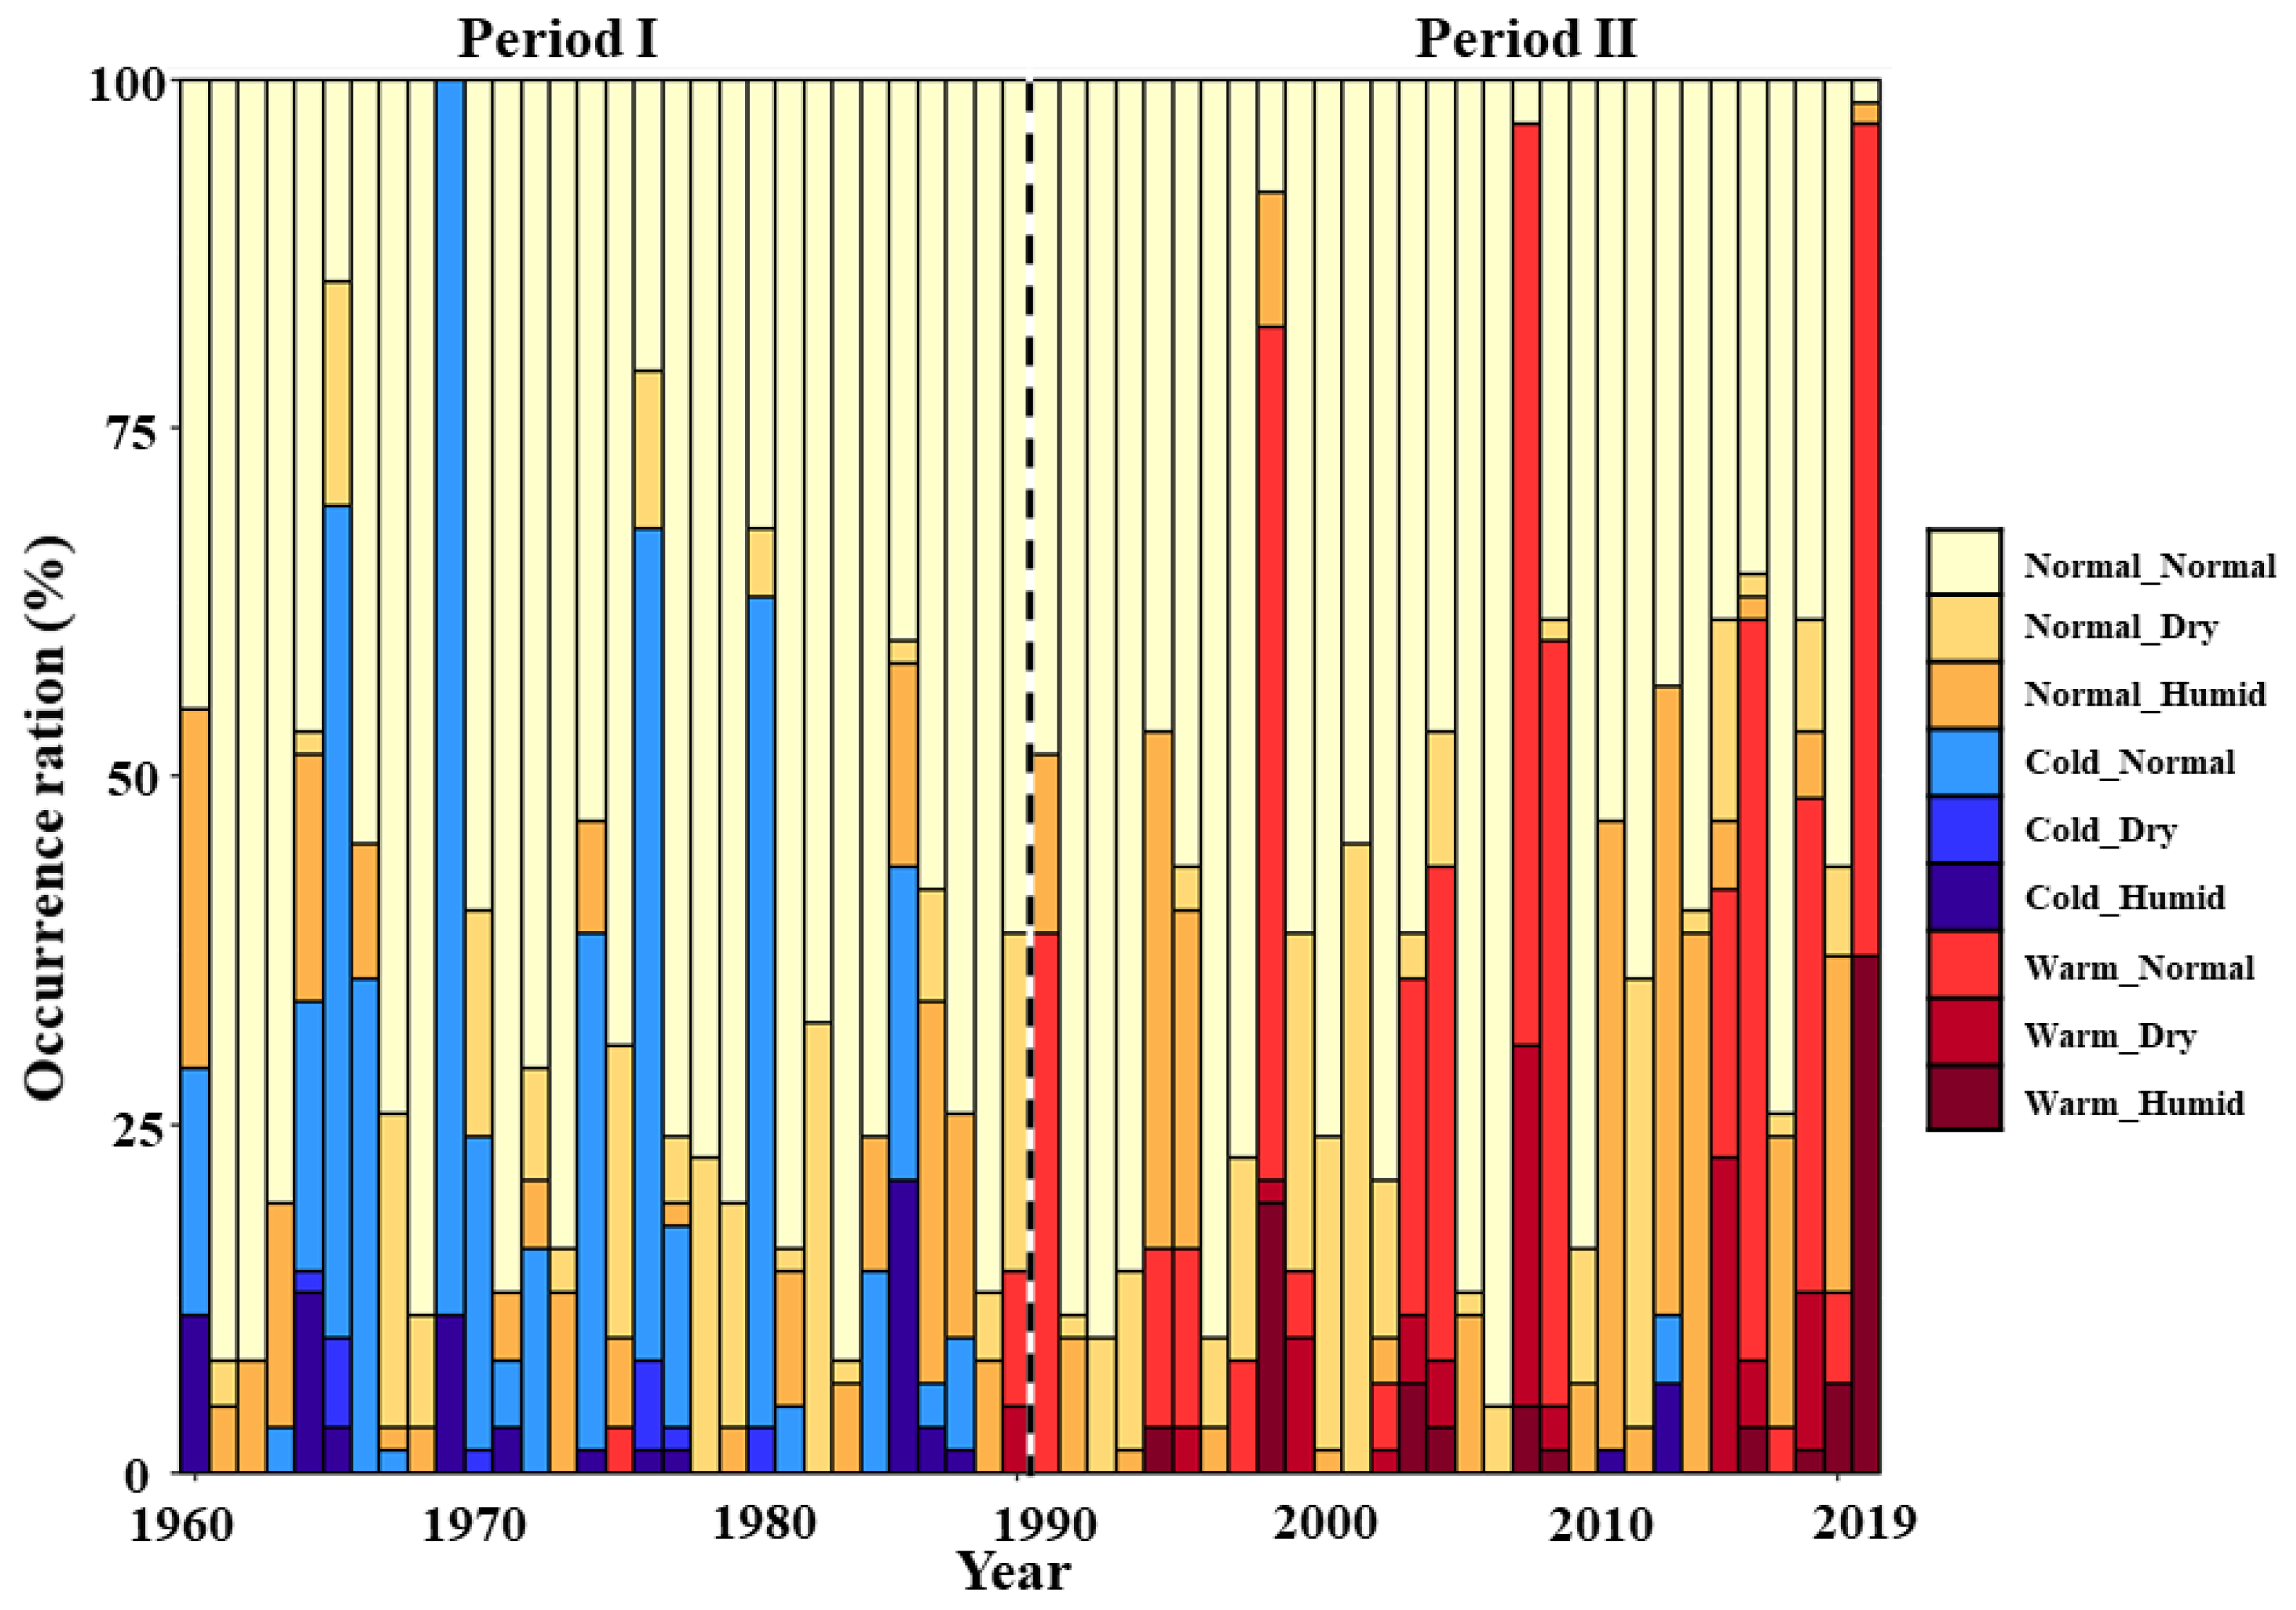
The changes in the frequency of normal climate years and the 8 climate extremes during 1960–2019 are shown in Figure 4. Although the number of normal climate years still accounts for a large proportion of total years, a decreasing trend can be observed in recent years. Among the 4 individual extremes, the cold conditions (cold-normal) were mostly concentrated in period I. The frequency of warm-normal years increased after 1990; there was no obvious trend in the dry (normal-dry) and humid (normal-humid) conditions, and they occurred alternately. Among the 4 combined climate extremes, cold conditions (cold-dry and cold-humid) mainly occurred in period I, and cold conditions occurred at only a few stations in 2010 and 2012. Warm conditions (warm-dry and warm-humid) mostly occurred in period II. In the context of global warming, in the past 60 years, Northeast China has changed from experiencing a high frequency of cold conditions in period I to experiencing a high frequency of warm conditions in period II.

3.2.2. Spatial Variation in Normal Climate and Extreme Climate Years

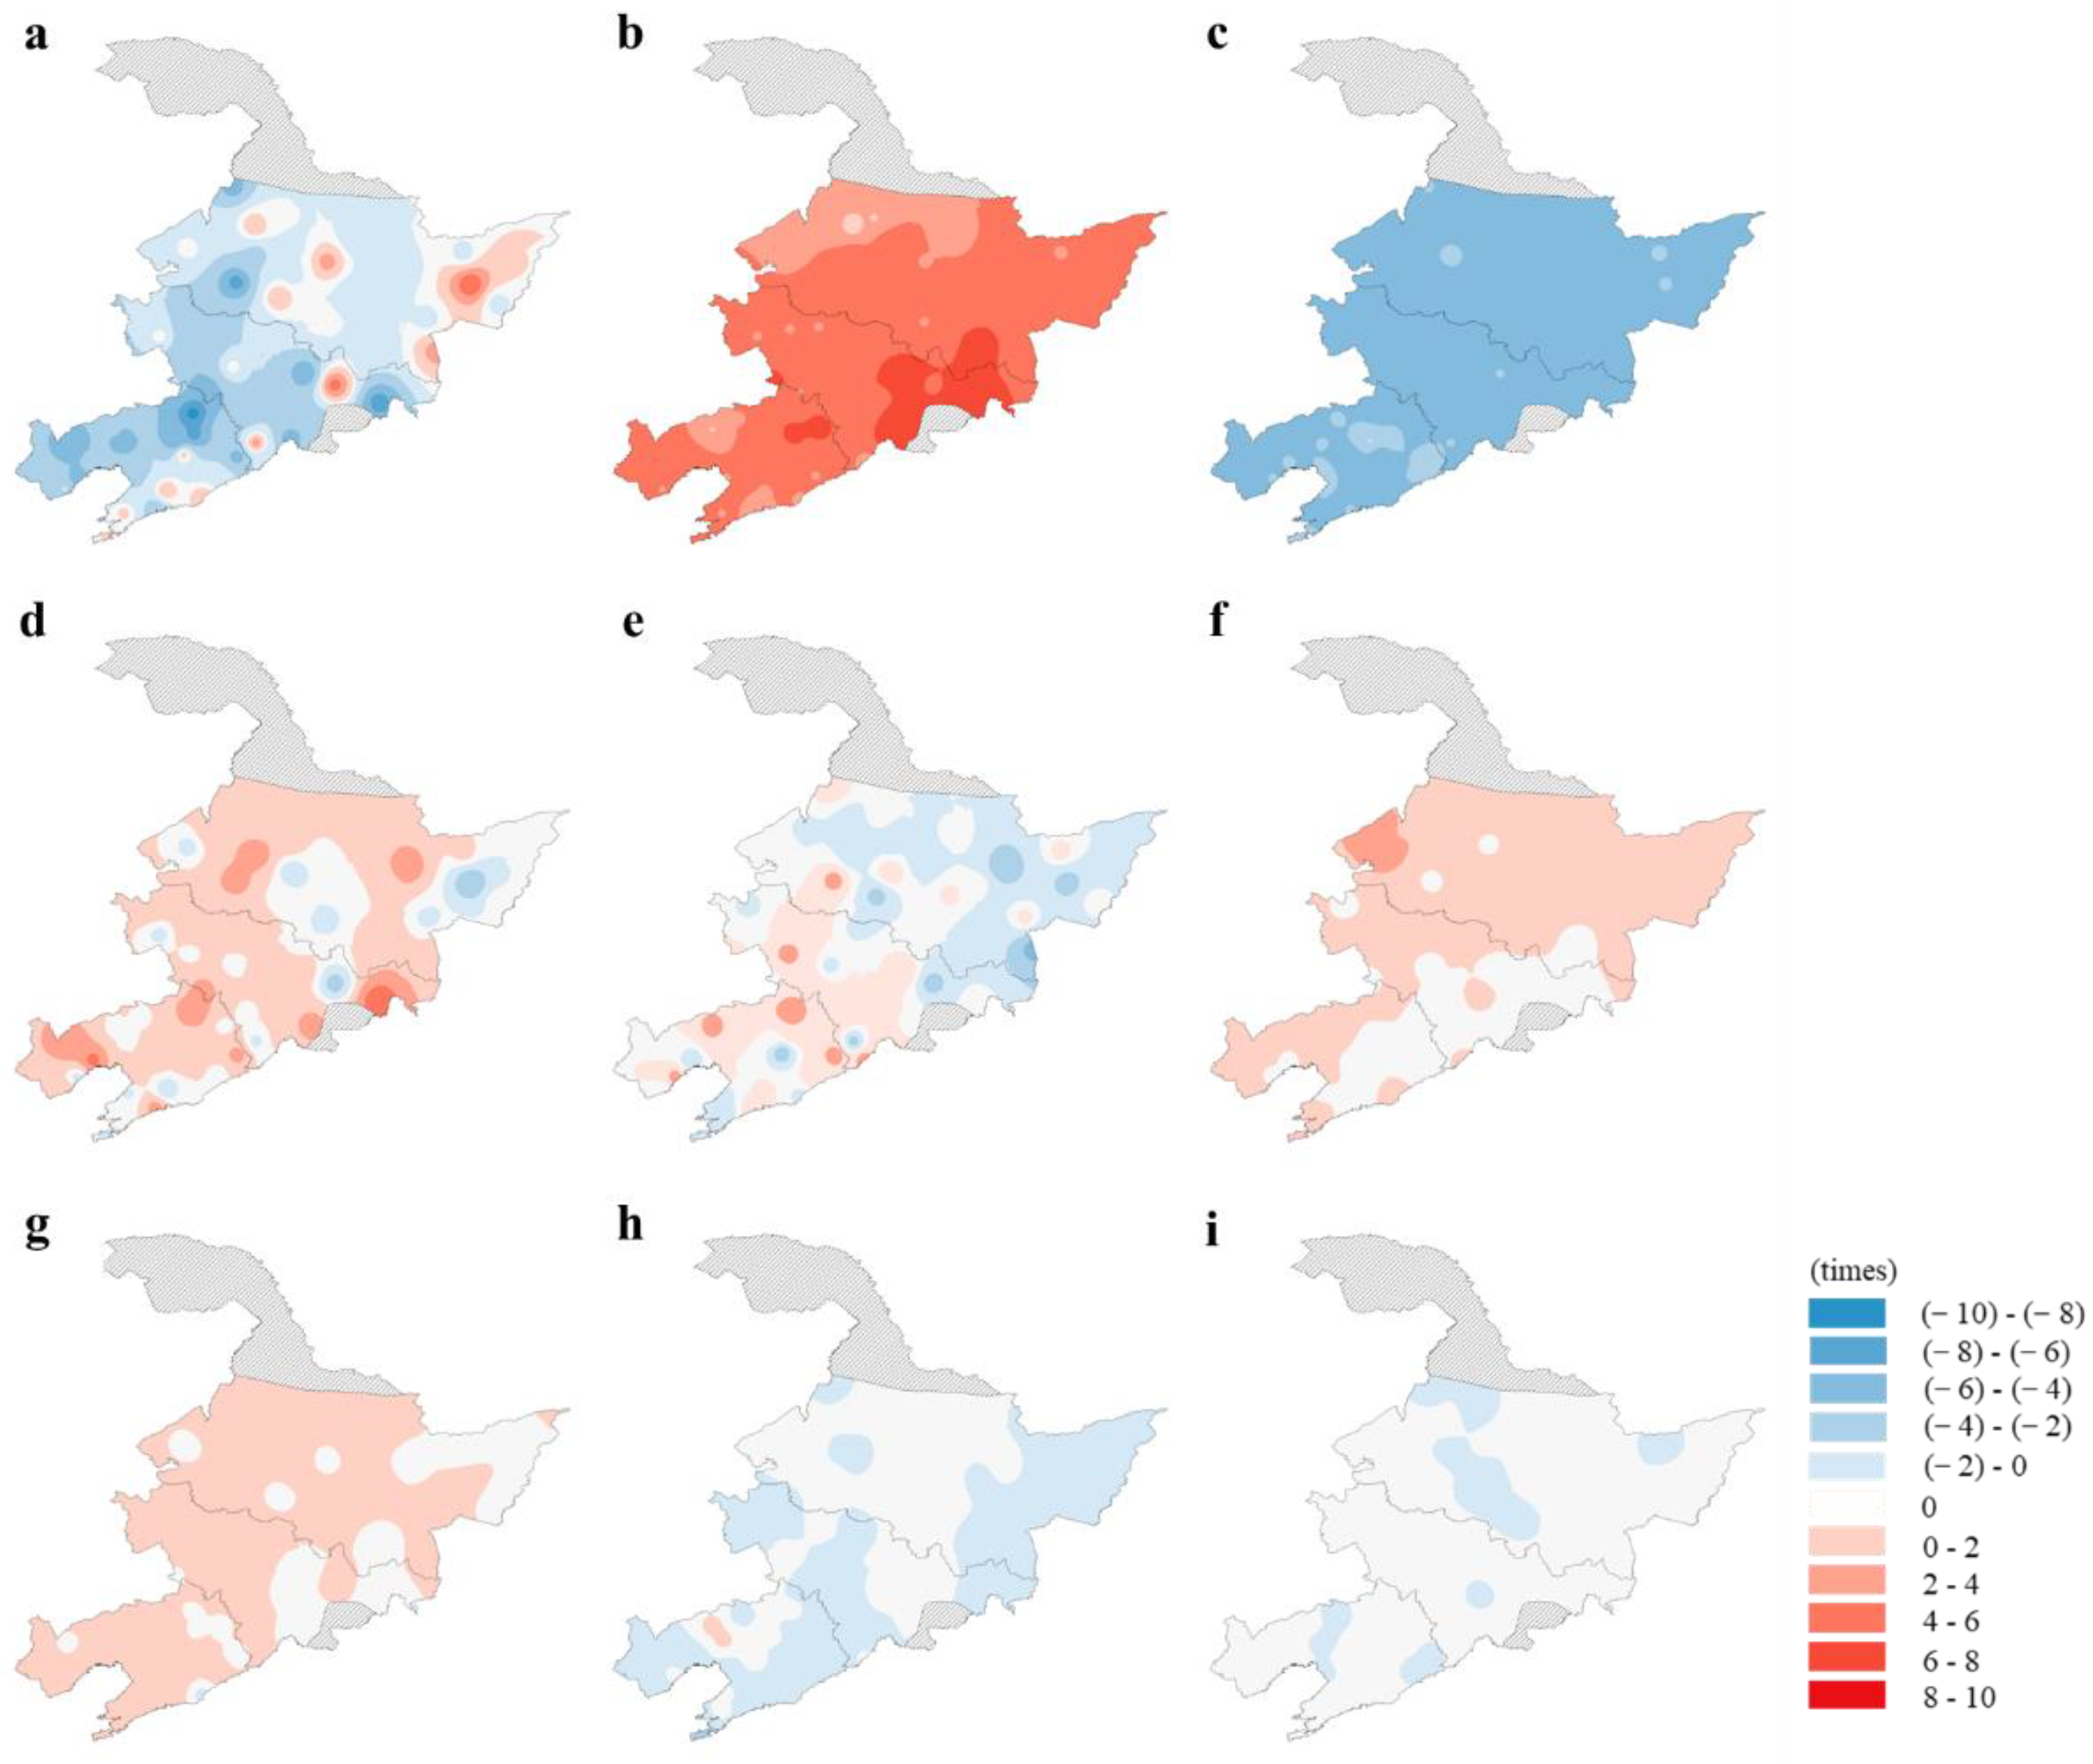
Compared with period I, the frequency of normal climate years showed a decreasing trend in most areas of Northeast China in period II, especially in northern Liaoning and southwestern Heilongjiang. An increasing trend can be observed in a small area in the eastern part of Northeast China and central Heilongjiang (Figure 5a).
Among the four individual extremes, the frequency of warm-normal years increased significantly throughout the study area, especially in eastern Jilin, and the frequency increased more than eightfold. In contrast, the frequency of cold-normal years decreased significantly. Normal-humid years showed an increasing trend in most parts of Northeast China, but in central and eastern Heilongjiang and southern Liaoning, they showed a weak downward or unchanged trend. Normal-dry years showed an increasing trend in the southwestern portion of the study area and a decreasing trend in the northeastern portion. The spatial distributions of both normal-humid and normal-dry conditions were inhomogeneous (Figure 5b–e).
Among the four combined extremes, warm-humid showed a weak increasing trend in eastern and northern Northeast China, and there was no change in the other areas. Warm-dry conditions showed a weak increasing trend in most areas, but there was no change in eastern Jilin and Heilongjiang. Both warm-humid and warm-dry conditions showed an increasing trend. The frequency of cold-humid conditions decreased in western and southeastern Liaoning, western and central Jilin, and eastern Heilongjiang and remained unchanged in other areas. The frequency of cold-dry conditions decreased in a small part of central and eastern Liaoning and central and northern Heilongjiang (Figure 5f–i).

3.3. The Effect of Changing Climate Extremes on Yield

3.3.1. The Effect of a Changing Normal Climate on Yields

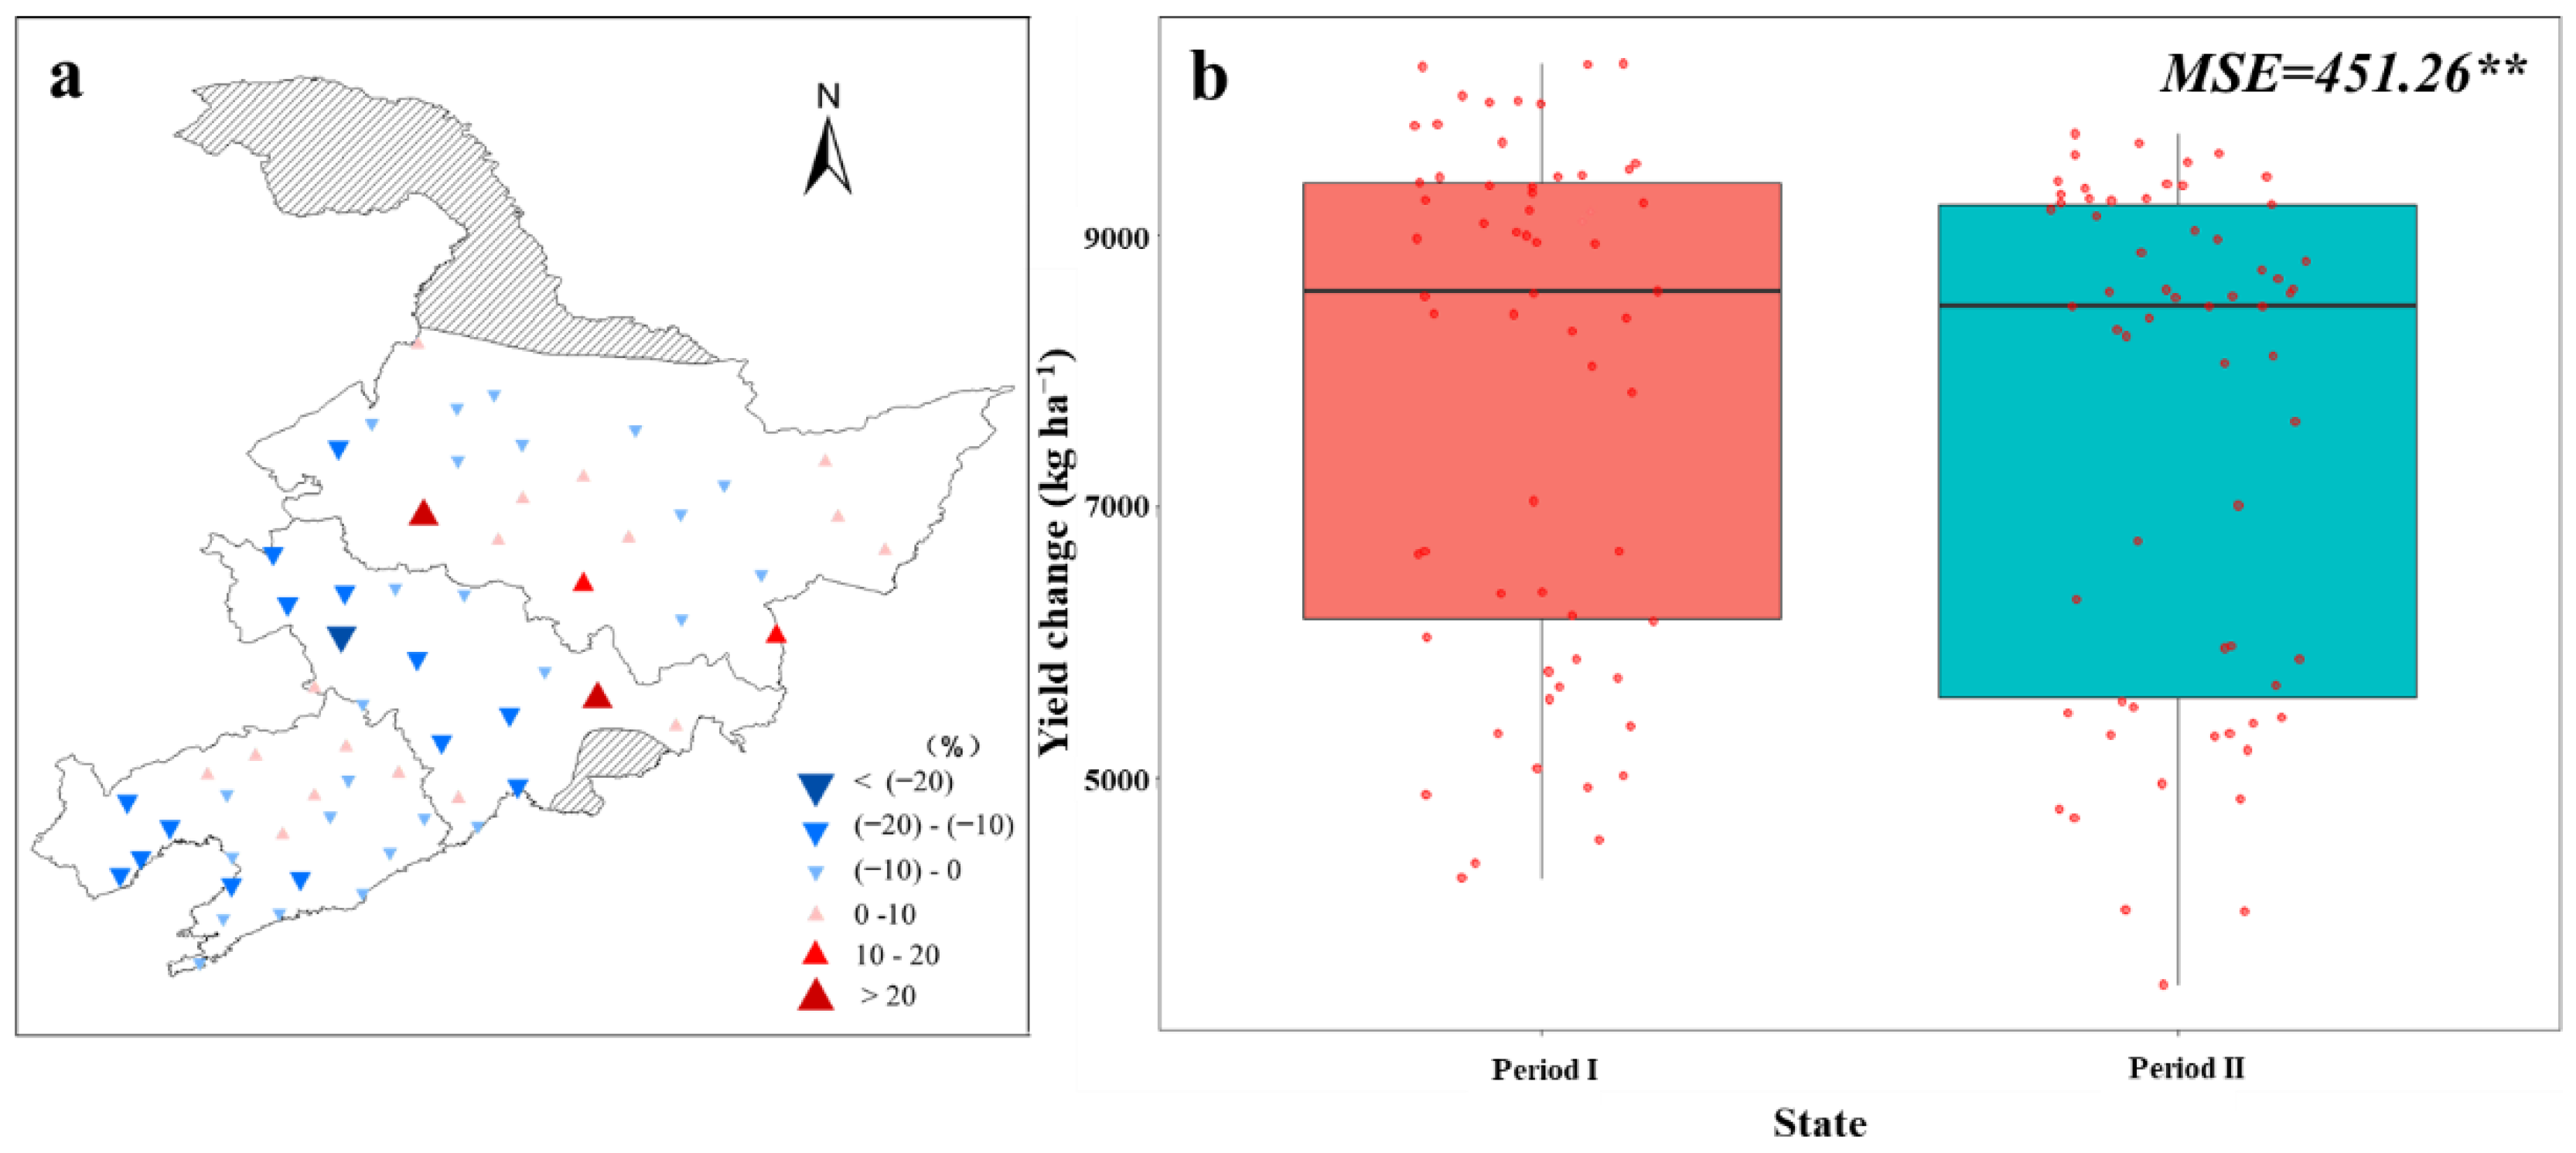
Under normal-normal conditions, period II showed higher maize grain yields (estimated using the APSIM-Maize model, and the yield mentioned in the following results section was the estimated yield simulated by the APSIM-Maize model) than period I in northern Liaoning, eastern Jilin, and central-southern and eastern Heilongjiang. The increase in maize grain yields ranged from 0.51% to 30.02%, especially at the Anda, Suifenhe, Dunhua, and Donggang stations. The maize grain yield in period II decreased compared with that in period I in southern and western Liaoning and most of Jilin and northern Heilongjiang. The range of reductions was between 0.2% and 23.85%, especially in western Liaoning and Jilin, showing a relatively obvious downward trend (Figure 6a).
On average, the yield in period II was slightly lower than that in period I (Figure 6b), with the decreased frequency of occurrence of a normal climate.

3.3.2. The Effect of Changing Climate Extremes on Yields

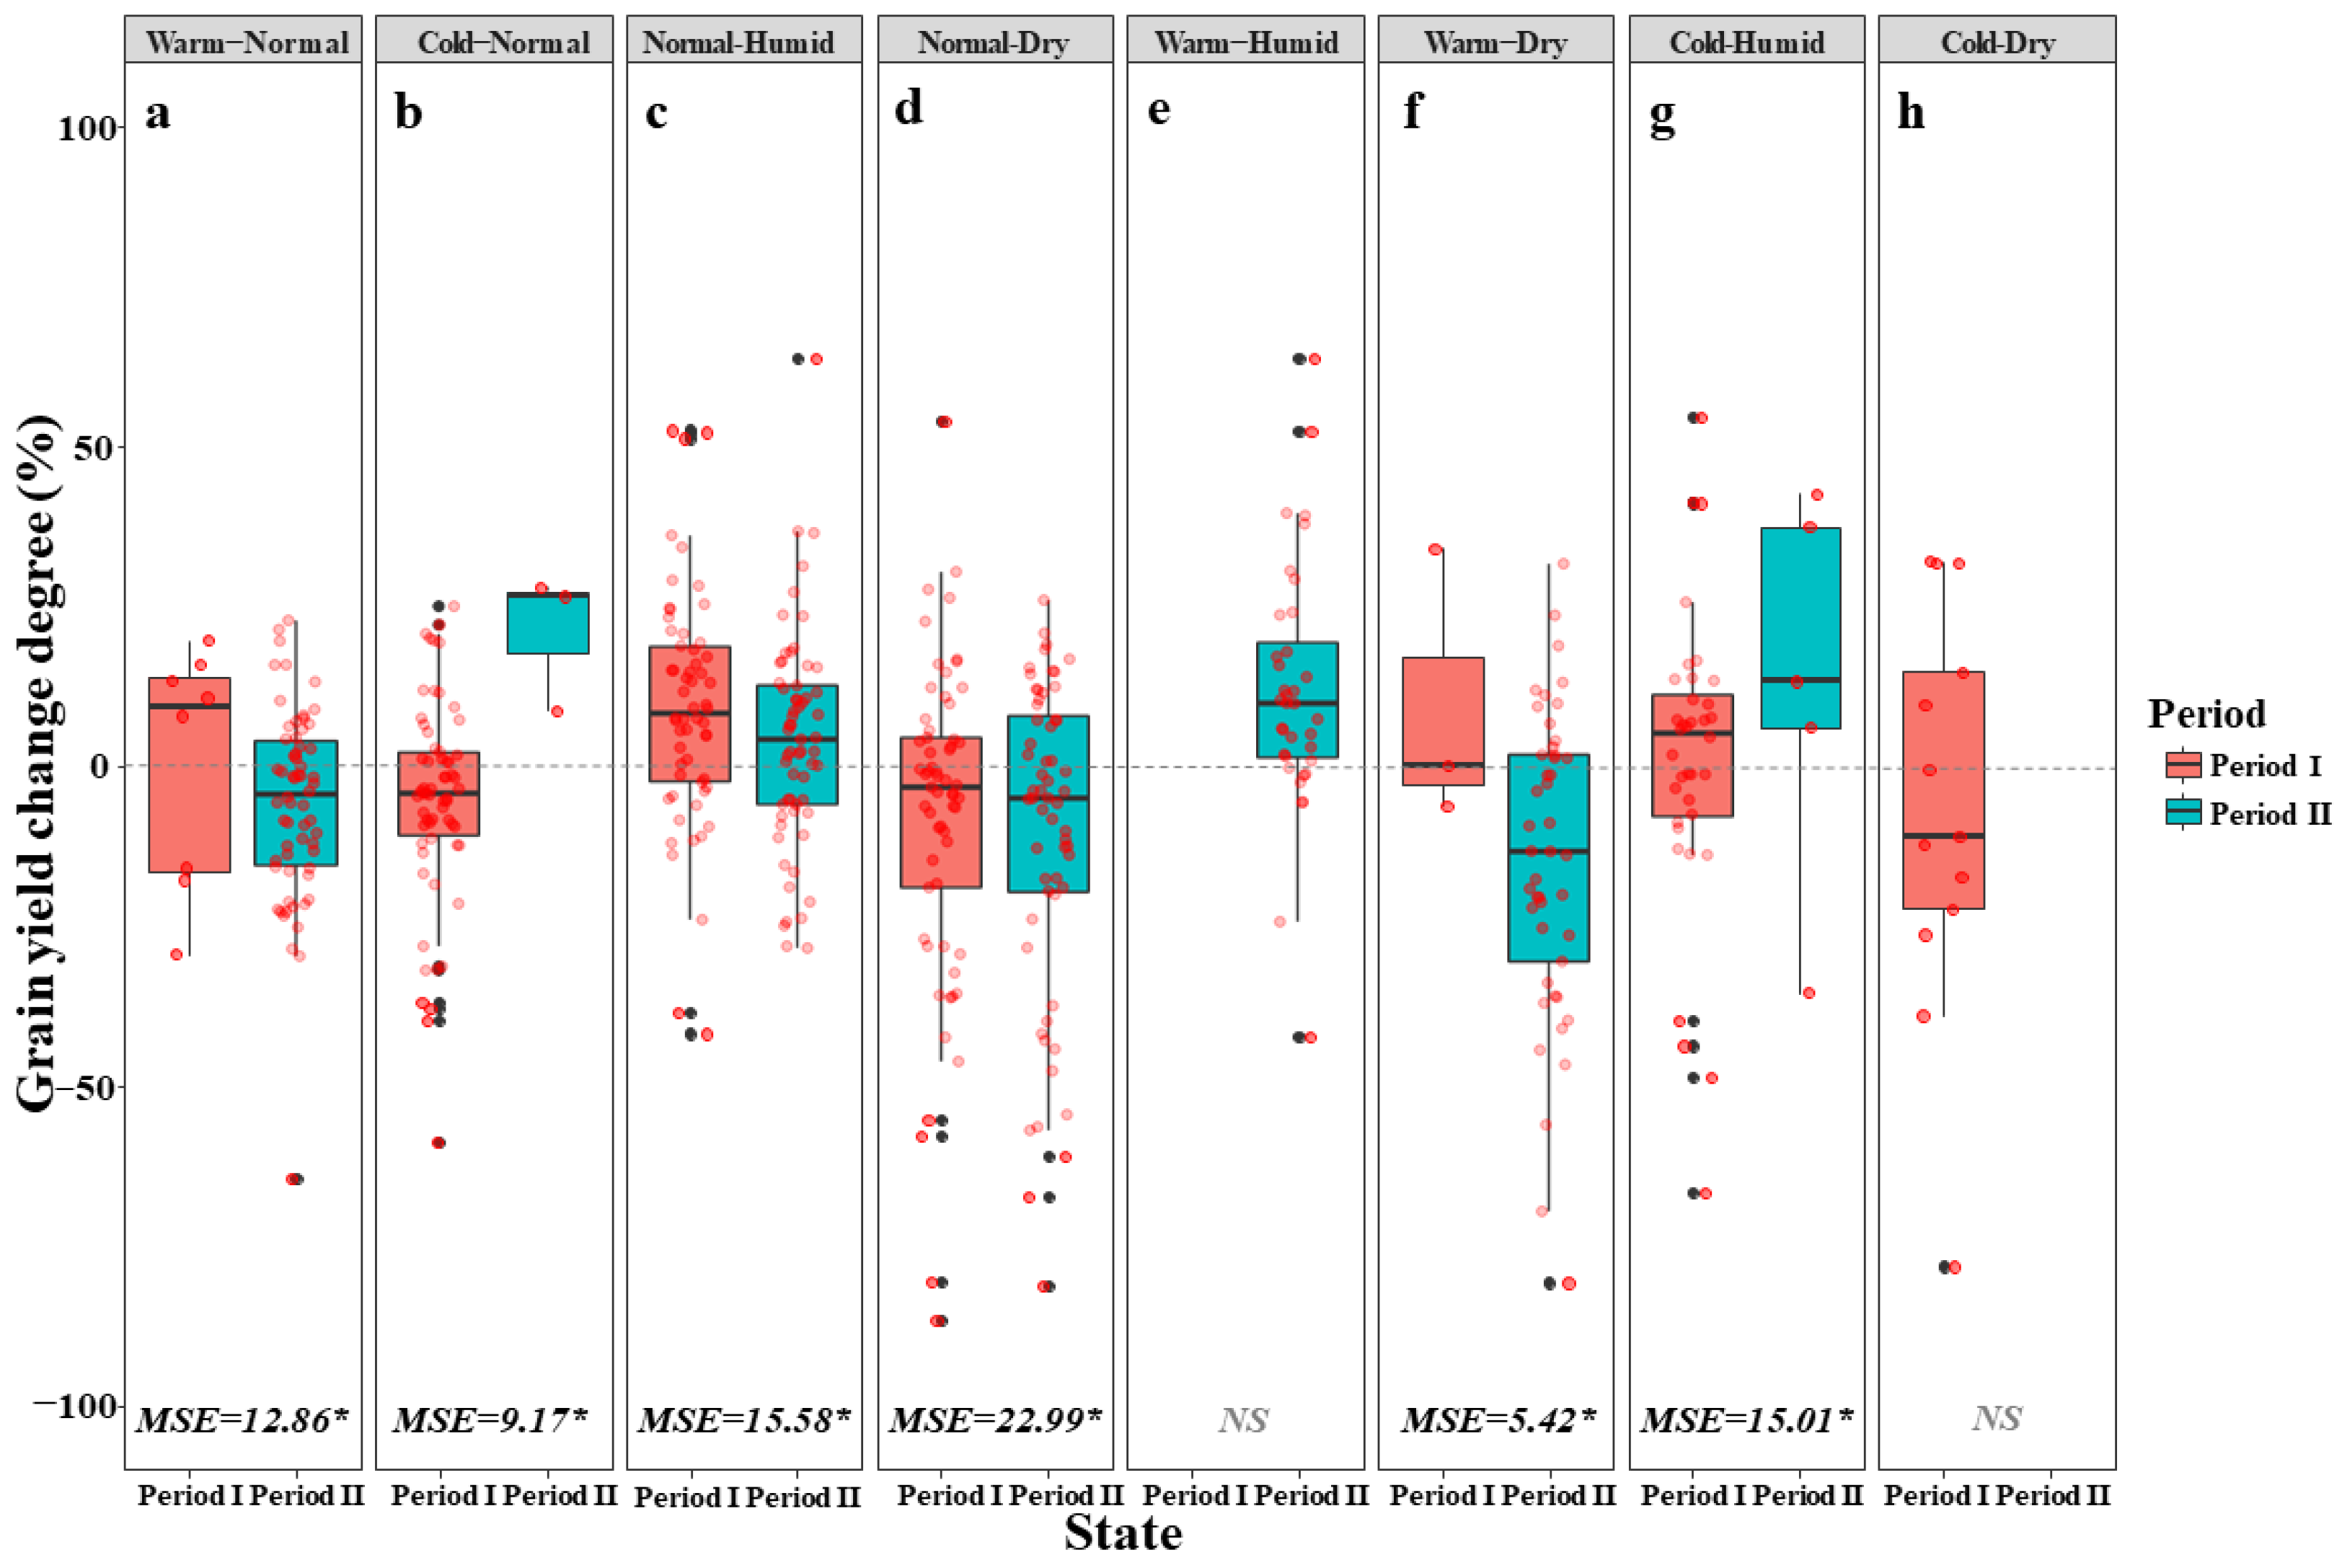
Figure 7 shows the change in yield relative to a normal climate under different climate extremes in period I (1960–1989) and period II (1990–2019), as calculated by Equations (4) and (5) in Section 2.4. Table 3 shows the MSE values of yield changes between climatic extremes and normal climates during periods I and II. Combined with the analysis of variance, it could be seen that all climate extremes except warm-humid and cold-dry had significant statistical significance between period I and period II, and most climate extremes had statistically significant yield changes relative to normal climate.
Compared with the normal climate yield, the average yield in warm-normal conditions was higher in period I but lower in period II. In contrast, the average yield in cold-normal conditions was lower than that in the normal state in period I but higher than that in the normal state in period II (Figure 7a,b). The average yield in normal-humid conditions in periods I and II was higher than that in the normal state, while the average yield in normal-dry conditions in the two periods was lower than that in the normal state (Figure 7c,d).
Among the 4 combined extremes, warm-humid and cold-dry conditions showed no change in yield in periods I and II because the frequency of occurrence of these extreme states was 0 in the 2 periods. The warm-humid state did not affect the yield in period I, but it did have an effect in period II by increasing the average yield of this period compared to that in the normal state (Figure 7e). The effect of warm-dry conditions was similar to that of warm-normal conditions. The average yield in period I was higher than that in the normal state, and the average yield in period II was lower than that in the normal state (Figure 7f). The average yield of cold-humid conditions in periods I and II was higher than that in the mean state, but the extreme state had a higher impact in period II than in period I (Figure 7g). The average yield of period I was lower than that of the normal state under cold-dry conditions, but this effect disappeared in period II (Figure 7h).
Under warm-normal, normal-humid, normal-dry, and warm-dry conditions, the increase in the frequency of climate extremes had a negative impact on the change rate of the average yield relative to the normal conditions in period II compared to that in period I, with decreases of 6.40% (p ≤ 0.05), 5.10% (p ≤ 0.05), 2.18% (p ≤ 0.05), and 24.12% (p ≤ 0.05), respectively (Figure 7a,c,d,f). Under cold-normal and cold-humid conditions, the reduction in the frequency of climate extremes significantly increased the change rate of the average yield in period II relative to the normal state compared to that in period I by 26.56% (p ≤ 0.05) and 12.10% (p ≤ 0.05), respectively (Figure 7b,g). The warm-humid condition was not affected in period I, and the change rate of the relatively normal state in period II was 11.69% (p ≤ 0.01). The change rate of cold-dry years relative to the normal state was −6.68% (p ≤ 0.05) in period I and was unaffected in period II. Because the influence of warm-humid conditions in period II was positive and the influence of cold-dry conditions in period I was negative, these two climate extremes both had a positive effect on yields (Figure 7e,h).
Overall, the three cold-related climate extremes had a greater positive impact on yields in period II than in period I, and the warm-related climate extremes (except warm-humid) had a negative impact on yields. The average lines of the three humidity-related climate types were all above the zero line, and the average values of the three aridity-related climate extremes were all below the zero line, indicating that the three humidity-related climate extremes had a positive impact on the yield in the two periods. In contrast, compared with the normal climate, the three aridity-related climate extremes had a negative effect on the yield in the two periods.

4. Discussion

Our results show that the frequency of warm-related extremes (warm-normal, warm-humid, and warm-dry) has increased significantly in Northeast China, the frequency of cold-related extremes (cold-normal, cold-humid, and cold-dry) has decreased significantly, and the frequency of normal-humid and normal-dry occurrences is increasing. These findings indicate that the study region tends to be warm and that the probability of extreme precipitation events has increased. The Northeast China region is experiencing more intense extreme precipitation events [37]. These findings are consistent with global changes; climate change has not only brought about an increase in the global average temperature but has also led to frequent, widespread, intense, and concurrent trends of extreme weather and climate events, making dry areas drier and humid areas wetter [38].
Our results show that the impact of climate extremes on estimated yields varied across periods. High temperatures, which shorten the growth process of maize and reduce the accumulation of dry matter, may be the direct cause of estimated yield decreases [39]. Water stress reduces the leaf area and chlorophyll content and reduces photosynthesis [40]. Due to water stress and high temperatures, drought continues to reduce maize grain yields [41]. With global climate warming, the temperature in the extremely high-temperature range in period I may be more suitable for the growth and development of maize than that in period II [42]. Under some extremely high temperatures (warm-normal and warm-dry), the response of estimated yields to changes in climate extremes was negative as the frequency of climate extremes increased. Similar results were observed for the extremely low temperatures (cold-normal and cold-humid), and the temperature in the extremely low-temperature range in period II may be more suitable for the growth and development of maize than that in period I. High temperatures increased the atmospheric water demand and aggravated the water deficit, and the reduction in yields caused by warm-dry conditions was much greater than that caused by warm-normal and normal-dry conditions, which is consistent with the results of the study by Li et al. [41]. Therefore, we can focus on the years in which climate extremes with adverse effects will occur in future maize production in Northeast China and enact disaster prevention and mitigation measures prior to their arrival.
Our results show that the increased frequency of warm-normal and warm-dry conditions had a negative impact on estimated yields, indicating that drought and high temperatures will affect the growth, development, and yield of maize [43]. The yield reduction rate of the warm-dry condition was higher than that of the warm-normal or normal-dry conditions; that is, the compound effects of high temperatures and drought on yield reductions were higher than those of high temperatures or drought alone. High temperatures accelerate the evaporation of water and enhance the water demand of crops. Exposure of maize crops to high temperatures and dry weather during the tasseling and flowering periods leads to issues with maize tasseling and delayed tasseling. This delay leads to the extension of the time between flowering and tasseling, the advance of tasseling and pollen dispersal or the late extraction of the top filaments, and the loss of fertilization opportunity, resulting in issues with pollination. Moreover, if there is an unbroken spell of wet weather during maize pollination, the pollination ability will be greatly reduced, which will reduce the chance of fertilization and affect the yield of fruits and seeds, thus leading to a lack of kernels in the ear of maize, which also influences yield [44].
In this study, the rainfed potential yield in Northeast China was simulated by the well-validated APSIM-Maize model. Due to the assumptions and uncertainties associated with the APSIM-Maize model, the impacts of diseases and pests on crops were not considered in the model; therefore, the simulation value would be higher in low-yield years [45]. Moreover, it was difficult to quantitatively estimate technical factors, including various parameters and agronomic management data. In addition, when exploring the impact of different extreme climate years, the phenological changes in maize in different periods were not considered. The same variety was assumed to be sown in the study area within the research period, but this assumption does not completely account for the difference in the temporal and spatial distribution of maize. Therefore, a certain gap was observed between the actual yield and the rainfed potential yield obtained by our simulation. However, the yield difference between the two periods was the focus of this work, and the difference between the potential yield and the actual yield of rainfed plants was negligible. This study explored only the impact of frequency changes on yields; the impact of the intensity of extreme states on yields and the mechanism of action of climate extremes should be studied in depth in the future.
Our study mainly focused on the rainfed potential yield of maize. However, the difference between the rainfed potential yield and the actual yield was small, and the reanalysis of the simulated yield would certainly increase the error of the results. In this paper, we ignored this uncertainty and attributed it to some nonobjective factors. Moreover, this study is limited to assigning yield changes to climate change alone when comparing data for two periods over 30 years. Biological progress and changes in agrotechnology are also important in agricultural production. Biological progress can enhance the adaptability of crops to extreme weather conditions (such as drought and salinity) [46]. Moreover, the combination of effective agricultural systems and optimized land use can greatly reduce the planting area and improve the efficiency of agricultural production [47]. Previous studies have shown that plant traits at both the physiological and molecular levels and the variation in the number of copies of phenological genes play a crucial role in improving the adaptability of crops [13]. To realize sustainable development, we should focus on genotype improvements through the full range of modern biological approaches to promote biological progress and improve our understanding of ecology, agronomic management, and agrotechnology [48]. Future yield loss of crops is reflected not only in individual climate extremes but also in combined climate extremes. This requires us to improve our understanding of and ability to model the impact of extreme climate events. This is not only critical to accurately predicting the impact of climate change on agriculture but also essential to developing effective management and adaptation measures (such as developing crop varieties with strong adaptability, strengthening the construction of drainage systems, improving agricultural disaster prevention, mitigation, and early warning systems, and planning reasonable agricultural production layouts) to reduce the yield loss of crops. In short, the success or failure of coping with the adverse effects of climate change depends on the current environment (such as soil properties, climate types, high temperatures, or drought severity) and the design of an ideal crop type that combines phenological genes with high resistance and good field management prospects.

5. Conclusions

In Northeast China, the rainfed potential yield of maize decreased as the climate extremes increased, which had different effects on the estimated maize grain yields in each period. In period I, the estimated yields under the warm-normal, normal-humid, warm-dry, and cold-humid conditions were higher than the estimated yields under a normal climate, while the estimated yields under the cold-normal, normal-dry, and cold-dry conditions were lower. In period II, the estimated yields under the cold-normal, normal-humid, warm-humid, and cold-humid conditions were higher than the estimated yields under a normal climate, while the yields under the warm-normal and warm-dry conditions were lower. As the frequency of warm-normal, normal-humid, normal-dry, and warm-dry conditions increased, the impact on estimated yields became negative. As the frequency of cold-normal and cold-humid conditions decreased, the impact on estimated yields became positive. In general, warm-humid and cold-dry conditions had a positive impact on the estimated yields. The results show the impact of different climate types on maize grain yield and suggest that the compound effect of high temperature and drought and drought alone are still the main reasons for the change in maize grain yield in Northeast China. In future maize planting in Northeast China, we should fully consider maize varieties with high-temperature tolerance, supplement water in a timely manner, and adjust the sowing date to ensure maize yield and national food security.

Author Contributions

Conceptualization, J.Z. and Z.L.; Data curation, Z.Z.; Formal analysis, M.D., S.G. and W.C.; Funding acquisition, X.Y.; Methodology, M.D. and E.L.; Software, Z.Z.; Supervision, X.Y.; Validation, J.Z.; Visualization, S.G.; Writing—original draft, M.D. All authors have read and agreed to the published version of the manuscript.

Funding

This work was supported by the Ministry of Science and Technology of China (Project No. 2019YFA0607402) and the 2115 Talent Development Program of China Agricultural University.

Data Availability Statement

The data that support the findings of this study are available from the corresponding author upon reasonable request.

Conflicts of Interest

The authors have no relevant financial or non-financial interests to disclose.

References

  1. IPCC. Climate Change 2021: The Physical Science Basis. In Summary for Policymakers; Cambridge University Press: Cambridge, UK, 2021; p. 41. [Google Scholar]
  2. Otto, C.; Piontek, F.; Kalkuhl, M.; Frieler, K. Event-based models to understand the scale of the impact of extremes. Nat. Energy 2020, 5, 111–114. [Google Scholar] [CrossRef]
  3. IPCC. Climate Change and Land: An IPCC special report on climate change, desertification, land degradation, sustainable land management, food security, and greenhouse gas fluxes in terrestrial ecosystems. In Summary for Policymakers; Cambridge University Press: Cambridge, UK, 2019; p. 9. [Google Scholar]
  4. Zhao, D.S.; Zheng, D.; Wu, S.H.; Wu, Z.F. Climate Changes in Northeastern China During Last Four Decades. Chin. Geogr. Sci. 2007, 17, 317–324. [Google Scholar] [CrossRef]
  5. Liu, J.; Du, H.B.; Wu, Z.F.; He, H.S.; Wang, L.; Zong, S.W. Recent and future changes in the combination of annual temperature and precipitation throughout China. Int. J. Climatol. 2017, 37, 821–833. [Google Scholar] [CrossRef]
  6. Li, X.Y.; Li, H.Y.; Yang, L.; Ren, Y.X. Assessment of Soil Quality of Croplands in the Corn Belt of Northeast China. Sustainability 2018, 10, 248. [Google Scholar] [CrossRef] [Green Version]
  7. National Bureau of Statistics of China (NBSC). China Statistical Yearbook; China Statistical Press: Beijing, China, 2021; pp. 399–401. Available online: http://www.stats.gov.cn/tjsj./ndsj/ (accessed on 1 March 2023).
  8. Niu, X.K.; Xie, R.Z.; Liu, X.; Zhang, F.L.; Li, S.K.; Gao, S.J. Maize Yield Gains in Northeast China in the Last Six Decades. J. Integr. Agric. 2013, 12, 630–637. [Google Scholar] [CrossRef]
  9. Zhao, J.; Yang, X.G.; Sun, S. Constraints on maize yield and yield stability in the main cropping regions in China. Eur. J. Agron. 2018, 99, 106–115. [Google Scholar] [CrossRef]
  10. FAO. FAOSTAT: Agriculture; Food and Agricultural Organizations of the United Nations: Rome, Italy, 2019; Available online: https://www.fao.org/faostat/en/#data/QCL (accessed on 2 October 2021).
  11. Sun, F.; Ding, L.; Feng, W.Q.; Cao, Y.; Lu, F.Z.; Yang, Q.Q.; Li, W.C.; Lu, Y.L.; Shabek, N.; Fu, F.L.; et al. Maize transcription factor ZmBES1/BZR1-5 positively regulates kernel size. J. Exp. Bot. 2021, 72, 1714–1726. [Google Scholar] [CrossRef] [PubMed]
  12. Feng, W.Q.; Liu, Y.; Cao, Y.; Zhao, Y.R.; Zhang, H.W.; Sun, F.; Yang, Q.Q.; Li, W.C.; Lu, Y.L.; Zhang, X.C.; et al. Maize ZmBES1/BZR1-3 and-9 transcription factors negatively regulate drought tolerance in transgenic Arabidopsis. Int. J. Mol. Sci. 2022, 23, 6025. [Google Scholar] [CrossRef]
  13. Dowla, M.A.N.N.U.; Edwards, I.; O’Hara, G.; Islam, S.; Ma, W. Developing wheat for improved yield and adaptation under a changing climate: Optimization of a few key genes. Engineering 2018, 4, 514–522. [Google Scholar] [CrossRef]
  14. Guo, E.L.; Liu, X.P.; Zhang, J.Q.; Wang, Y.F.; Wang, C.L.; Wang, R.; Li, D.J. Assessing spatiotemporal variation of drought and its impact on maize yield in Northeast China. J. Hydrol. 2017, 553, 231–247. [Google Scholar] [CrossRef]
  15. Tubiello, F.N.; Soussana, J.F.; Howden, S.M. Crop and pasture response to climate change. Proc. Natl. Acad. Sci. USA 2007, 104, 19686–19690. [Google Scholar] [CrossRef] [Green Version]
  16. Challinor, A.J.; Watson, J.; Lobell, D.B.; Howden, S.M.; Smith, D.R.; Chhetri, N. A meta-analysis of crop yield under climate change and adaptation. Nat. Clim. Chang. 2014, 4, 287–291. [Google Scholar] [CrossRef] [Green Version]
  17. Yu, X.Y.; Ma, Y.Y. Spatial and Temporal Analysis of Extreme Climate Events over Northeast China. Atmosphere 2022, 13, 1197. [Google Scholar] [CrossRef]
  18. Guo, S.B.; Guo, E.J.; Zhang, Z.T.; Dong, M.Q.; Wang, X.; Fu, Z.Z.; Guan, K.X.; Zhang, W.M.; Zhang, W.J.; Liu, Z.J.; et al. Impacts of mean climate and extreme climate indices on soybean yield and yield components in Northeast China. Sci. Total Environ. 2022, 838, 156284. [Google Scholar] [CrossRef] [PubMed]
  19. Zhang, T.Y.; Huang, Y. Impacts of climate change and inter-annual variability on cereal crops in China from 1980 to 2008. J. Sci. Food Agric. 2012, 92, 1643–1652. [Google Scholar] [CrossRef] [PubMed]
  20. Terjung, W.H.; Ji, H.Y.; Hayes, J.T.; O’Rourke, P.A.; Todhunter, P.E. Actual and potential yield for rainfed and irrigated maize in China. Int. J. Biometeorol. 1984, 28, 115–135. [Google Scholar] [CrossRef]
  21. Lobell, D.B.; Cassman, K.G.; Field, C.B. Crop yield gaps: Their importance, magnitudes, and causes. Annu. Rev. Environ. Resour. 2009, 34, 179–204. [Google Scholar] [CrossRef] [Green Version]
  22. Grassini, P.; Yang, H.; Cassman, K.G. Limits to maize productivity in Western Corn-Belt: A simulation analysis for fully irrigated and rainfed conditions. Agric. For. Meteorol. 2009, 149, 1254–1265. [Google Scholar] [CrossRef] [Green Version]
  23. Asseng, S.; Anderson, G.C.; Dunin, F.X.; Fillery, I.R.P.; Dolling, P.J.; Keating, B.A. Use of the APSIM wheat model to predict yield, drainage, and NO3-leaching for a deep sand. Aust. J. Agric. Res. 1998, 49, 363–378. [Google Scholar] [CrossRef]
  24. Liu, Y.; Wang, E.L.; Yang, X.G.; Wang, J. Contributions of climatic and crop varietal changes to crop production in the North China Plain, since 1980s. Glob. Chang. Biol. 2010, 16, 2287–2299. [Google Scholar] [CrossRef]
  25. Liu, Z.J.; Yang, X.G.; Chen, F.; Wang, E.L. The effects of past climate change on the northern limits of maize planting in Northeast China. Clim. Chang. 2013, 117, 891–902. [Google Scholar] [CrossRef]
  26. Zhao, J.F.; Guo, J.P.; Mu, J. Exploring the relationships between climatic variables and climate-induced yield of spring maize in Northeast China. Agric. Ecosyst. Environ. 2015, 207, 79–90. [Google Scholar] [CrossRef]
  27. Wang, X.Y.; Yang, X.G.; Sun, S.; Xie, W.J. Comparison of potential yield and resource utilization efficiency of main food crops in three provinces of Northeast China under climate change. Ying Yong Sheng Tai Xue Bao J. Appl. Ecol. 2015, 26, 3091–3102. [Google Scholar]
  28. China Meteorological Data Network. Daily Observation Data of China Surface Meteorological Station; China Meteorological Administration: Beijing, China, 2021. Available online: http://data.cma.cn (accessed on 11 September 2021).
  29. Liu, B.H.; Chen, X.P.; Meng, Q.F.; Yang, H.S.; Wart, J.V. Estimating maize yield potential and yield gap with agro-climatic zones in China—Distinguish irrigated and rainfed conditions. Agric. For. Meteorol. 2017, 239, 108–117. [Google Scholar] [CrossRef]
  30. Zhao, J.; Yang, X.G. Distribution of high-yield and high-yield-stability zones for maize yield potential in the main growing regions in China. Agric. For. Meteorol. 2018, 248, 511–517. [Google Scholar] [CrossRef]
  31. Allen, R.G.; Pereira, L.S.; Raes, D.; Smith, M. Crop evapotranspiration: Guidelines for computing crop water requirements. United Nations Food and Agriculture Organization, Irrigation and Drainage Paper 56. FAO Rome 1998, 300, D05109. [Google Scholar]
  32. Wallach, D.; Goffinet, B. Mean squared error of prediction in models for studying ecological and agronomic systems. Biometrics 1987, 43, 561–573. [Google Scholar] [CrossRef]
  33. Willmott, C.J. Some comments on the evaluation of model performance. Bull. Am. Meteorol. Soc. 1982, 63, 1309–1313. [Google Scholar] [CrossRef]
  34. Seneviratne, S.; Nicholls, N.; Easterling, D.; Goodess, C.; Kanae, S.; Kossin, J.; Luo, Y.L.; Marengo, J.; McInnes, K.; Rahimi, M.; et al. Changes in climate extremes and their impacts on the natural physical environment. In Managing the Risks of Extreme Events and Disasters to Advance Climate Change Adaptation; A Special Report of Working Groups I and II of the Intergovernmental Panel on Climate Change (IPCC); Cambridge University Press: Cambridge, UK, 2012; p. 111. [Google Scholar] [CrossRef]
  35. Tingem, M.; Rivington, M.; Colls, J. Climate variability and maize production in Cameroon: Simulating the effects of extreme dry and wet years. Singap. J. Trop. Geogr. 2008, 29, 357–370. [Google Scholar] [CrossRef]
  36. Gampe, D.; Zscheischler, J.; Reichstein, M.; O’Sullivan, M.; Smith, W.K.; Sitch, S.; Buermann, W. Increasing impact of warm droughts on northern ecosystem productivity over recent decades. Nat. Clim. Chang. 2021, 11, 772–779. [Google Scholar] [CrossRef]
  37. Guo, E.L.; Zhang, J.Q.; Wang, Y.F.; Quan, L.; Zhang, R.J.; Zhang, F.; Zhou, M. Spatiotemporal variations of extreme climate events in Northeast China during 1960–2014. Ecol. Indic. 2019, 96, 669–683. [Google Scholar] [CrossRef]
  38. Greve, P.; Orlowsky, B.; Mueller, B.; Sheffield, J.; Reichstein, M.; Seneviratne, S.I. Global assessment of trends in wetting and drying over land. Nat. Geosci. 2014, 7, 716–721. [Google Scholar] [CrossRef]
  39. Muchow, R.C. Effect of high temperature on grain-growth in field-grown maize. Field Crops Res. 1990, 23, 145–158. [Google Scholar] [CrossRef]
  40. Khan, M.B.; Hussain, N.; Iqbal, M. Effect of water stress on growth and yield components of maize variety YHS 202. J. Res. Sci. 2001, 12, 15–18. [Google Scholar]
  41. Li, Y.; Guan, K.Y.; Schnitkey, G.D.; DeLucia, E.; Peng, B. Excessive rainfall leads to maize yield loss of a comparable magnitude to extreme drought in the United States. Glob. Chang. Biol. 2019, 25, 2325–2337. [Google Scholar] [CrossRef] [PubMed] [Green Version]
  42. Zhang, X.L.; Yan, X.D. Spatiotemporal change in geographical distribution of global climate types in the context of climate warming. Clim. Dyn. 2014, 43, 595–605. [Google Scholar] [CrossRef]
  43. Prasad, P.V.V.; Staggenborg, S.A.; Ristic, Z. Impacts of drought and/or heat stress on physiological, developmental, growth, and yield processes of crop plants. In Response of Crops to Limited Water: Understanding and Modeling Water Stress Effects on Plant Growth Processes; 2008; Volume 1, pp. 301–355. Available online: https://acsess.onlinelibrary.wiley.com/doi/abs/10.2134/advagricsystmodel1.c11 (accessed on 1 March 2023). [CrossRef] [Green Version]
  44. Schoper, J.B.; Lambert, R.J.; Vasilas, B.L. Pollen Viability, Pollen Shedding, and Combining Ability for Tassel Heat Tolerance in Maize1. Crop Sci. 1987, 27, 27–31. [Google Scholar] [CrossRef]
  45. Robertson, M.J.; Carberry, P.S.; Chauhan, Y.S.; Ranganathan, R.; O’Leary, G.J. Predicting growth and development of pigeonpea: A simulation model. Field Crops Res. 2001, 71, 195–210. [Google Scholar] [CrossRef] [Green Version]
  46. McWilliam, J.R. The national and international importance of drought and salinity effects on agricultural production. Funct. Plant Biol. 1986, 13, 1–13. [Google Scholar] [CrossRef]
  47. Smeets, E.M.W.; Faaij, A.P.C.; Lewandowski, I.M.; Turkenburg, W.C. A bottom-up asse, ssment and review of global bio-energy potentials to 2050. Prog. Energy Combust. Sci. 2007, 33, 56–106. [Google Scholar] [CrossRef] [Green Version]
  48. Pretty, J. Agricultural sustainability: Concepts, principles and evidence. Philos. Trans. R. Soc. B Biol. Sci. 2008, 363, 447–465. [Google Scholar] [CrossRef] [PubMed] [Green Version]
Figure 1. Study area and meteorological stations in Northeast China (the three provinces from north to south are Heilongjiang, Jilin, and Liaoning).
Agronomy 13 01050 g001
Figure 2. Classification of normal climate and climate extremes.
Agronomy 13 01050 g002
Figure 3. Validation results for the simulated number of days from sowing to flowering and from flowering to maturity as well as the maize grain yield after adjusting the parameters. ** Significant at p ≤ 0.05.
Agronomy 13 01050 g003
Figure 4. Annual changes in the incidence of normal climate years and 8 climate extremes at 62 meteorological stations in Northeast China from 1960 to 2019.
Agronomy 13 01050 g004
Figure 5. The difference in the frequencies of normal climate and climate extreme years in the two periods from 1960 to 2019 at 62 meteorological stations. ((a) Normal-normal; (b) warm-normal; (c) cold-normal; (d) normal-humid; (e) normal-dry; (f) warm-humid; (g) warm-dry; (h) cold-humid; (i) cold-dry).
Agronomy 13 01050 g005
Figure 6. The temporal and spatial distribution characteristics of yield changes under a normal climate. ((a) Spatial distribution of yield changes at 62 stations; (b) Comparison of the yield change in the two time periods (each box represents the yield of normal climate during the period). The red dots indicate the yield change of the stations under normal conditions. ** Significant at p ≤ 0.01.
Agronomy 13 01050 g006
Figure 7. The grain yield change degree under the climate extremes compared with the normal climate and a comparison of the yield change rate in the two time periods (each box represents the impact of the climate extremes on the yield relative to the normal climate during the period). The red dots indicate the yield change rate of the stations corresponding to extreme conditions. ((a) warm-normal; (b) cold-normal; (c) normal-humid; (d) normal-dry; (e) warm-humid; (f) warm-dry; (g) cold-humid; (h) cold-dry). * Significant at p ≤ 0.05; “NS” denotes no significance levels.
Agronomy 13 01050 g007
Table 1. Field experimental sites and years of data were used for model calibration and validation in each province.
ProvinceSiteYear
HeilongjiangHarbin1994, 2002, 2011, 2014
JilinSiping1985, 2009, 2011, 2013, 2014
Jiaohe1993, 1994, 2007, 2010, 2014
LiaoningShenyang1999, 2000, 2008, 2011
Table 2. Validation results of the APSIM-Maize model in the study region.
ItemValidation
R2RMSENRMSE (%)D
Number of days from sowing to flowering (d)0.799.7212.620.92
Number of days from flowering to maturity (d)0.759.917.690.92
Grain yield (kg ha−1)0.88503.667.360.96
Table 3. MSE values of yield changes between climatic extremes and normal climate during periods I and II.
Climate ExtremesNormal-Normal
Period IPeriod II
Warm-normal1046.36756.85 **
Cold-normal974.41 **470.52 *
Normal-humid884.02 **812.71
Normal-dry1380.27 **1203.62 **
Warm-humid969.50 **
Warm-dry1238.541235.71 **
Cold-humid1205.911541.12
Cold-dry1828.70 *
The asterisks indicate significant levels at * p-value ≤ 0.05 and ** p-value ≤ 0.01.
Disclaimer/Publisher’s Note: The statements, opinions and data contained in all publications are solely those of the individual author(s) and contributor(s) and not of MDPI and/or the editor(s). MDPI and/or the editor(s) disclaim responsibility for any injury to people or property resulting from any ideas, methods, instructions or products referred to in the content.