Article

Resilience to Terminal Drought, Heat, and Their Combination Stress in Wheat Genotypes

1
ICAR—Indian Institute of Wheat and Barley Research, Karnal 132001, India
2
ICAR—Indian Agricultural Statistics Research Institute, New Delhi 110012, India
3
JNKVV, Wheat Research Station, Powarkheda 461110, India
4
Wheat Research Unit, PDKV, Akola 444104, India
*
Author to whom correspondence should be addressed.
Agronomy 2023, 13(3), 891; https://doi.org/10.3390/agronomy13030891
Submission received: 11 January 2023 / Revised: 27 February 2023 / Accepted: 28 February 2023 / Published: 17 March 2023
(This article belongs to the Special Issue Cereal Breeding for Abiotic Stress Tolerance)

Abstract

:
Heat and drought stresses have negative impacts on wheat yield and growth worldwide, causing up to 60% and 40% yield losses, respectively, but their combined effect can cause severe losses. The present study aimed to identify the high-yielding genetic resources tolerant to drought and/or heat stresses under climate change scenarios. The field trials on 42 genotypes were conducted at three locations in four environments (normal TSIR-NS, drought TSRF-DR, heat LSIR-HT, and heat and drought combined LSRF-DHT) each for two consecutive years. Yield contributing traits were recorded in all the experiments and all the locations: SI (susceptibility index) and STI (stress tolerance index) were also estimated. GY (Grain yield) was severely affected by LSRF-DHT (48.6%), followed by TSRF-DR (23.6%) and LSIR-HT (16.8%). GY had a positive correlation with BM (biomass), HI (harvest index), and TGW (1000-grain weight) under all environments and negative with DH (days to heading) (LSIR-HT and LSRF-DHT). Stepwise regression analysis revealed a higher contribution of BM and HI towards GY under all environments. GW (grain weight/spike) contributed under LSIR-HT and LSRF-DHT, and GN (grain number/spike) under TSIR-NS and TSRF-DR. GFD (grain-filling duration), TGW, and PTL (productive tillers) contributed under all conditions except LSRF-DHT. WS 2016-4 was the only genotype that yielded high under all the conditions. WS 2016-12 and CNM 16-1 were tolerant to heat and drought stresses and high yielding. HINDI 62, HTW 11, and QBP 1606 were less sensitive to all the stresses but low yielding. Overall, out of 30 tolerant genotypes (10 of each category), 19 adapted to escape mechanism which is irrespective of their yielding level. The study demonstrated the potential of identified genotypes in wheat breeding for climate resilience and the traits imparting tolerance to these genotypes.

1. Introduction

Climate change and temperature fluctuations are affecting plant growth, yield, and distribution, worldwide [1,2]. Drought stress has a massive effect on crop growth and productivity and is counteracting the ‘zero hunger’ goal, with its strength and severity anticipated to increase in upcoming years [3]. Wheat is a staple food, which contributes 20% of calories and protein to 4.5 billion people [4]. The annual wheat production registered an all-time highest estimate of 780.3 million tonnes in 2021–2022 (Source: USDA; https://www.ers.usda.gov/webdocs/outlooks/102130/whs-21i.pdf, accessed on 8 August 2022). The steadily increasing human population and diverse dietary needs and preferences are estimated to require about a 50% increase in total wheat production by 2030 [5] and by 70% by 2050 [6]. Drought and heat are two major abiotic stresses constraining wheat productivity worldwide, causing yield losses of up to 86% and 69%, respectively [7]. Wheat production is likely to fall by 3.0 % in India due to heat stress during the grain-filling period in 2021–2022 [8]. The two stresses, drought and heat, are more likely to occur simultaneously rather than separately in semi-arid and hot growing regions. Global food security is at risk due to climate change and climate variability. The latter is responsible for yield variability in maize, rice, wheat, and soybean to the tune of 60% [6]. The uncertainty in climatic conditions, which has induced changes in patterns of rainfall, and temperature increase, will reduce wheat yield by 50% in South Asia in 2050, which is 7% of total global crop production [9]. A recent study estimated global crop yield loss by 7.4% due to a 1 °C increase in global temperatures [10]. A recent report on the effect of temperature increases on global yields used Using statistical regressions, global grid-based and local point-based models, and field-warming experiments, and yield losses in wheat were estimated up to 5.5% and 6% per 1 °C increase for the United States and France, respectively, on par with the global average of 6% yield loss [10]. Two major wheat-producing countries, namely India and Russia, will face wheat yield reduction by 9.1% and 7.8% for each 1 °C increase. China will face a lesser penalty of 2.6% [11]. Further, drought and heat stresses are intensified by rising air temperatures, radiation stress, high CO2 levels, and a rise in greenhouse gases [12,13]. Global temperatures are expected to continue to increase by a further 1.5 °C between 2030 and 2052 if current rates of global warming continue [14]. Generally, the drought stress or the rainfed conditions are complemented by high temperatures. Based on modelling, there will be a 4.0 to 6.5% decrease in global wheat production per 1 °C of temperature increase if no adaptation occurs [15,16]. Because of its low water requirement [17] and ability to survive substantial reductions in water availability over relatively extended periods [18], there is no replacement for wheat, even in drier areas. However, wheat production still depends on water availability during and before the crop-specific and typically unirrigated growing season [19]. According to [20], the rainfed wheat yield will lead to a 9–25% profit loss for every 2–3.5 °C rise in temperature. Heat and drought stresses have negative impacts on wheat yield and growth worldwide [21], causing up to 60% and 40% yield losses, respectively [18], but their combined effect can cause severe yield losses [22].
The adverse effects of heat and drought stress include decreased rate of photosynthesis coupled with abnormal respiration, closed stomata, and high leaf temperature [23]. These effects may be synergistic, antagonistic, or hypo-additive on yield or any other trait [7,24]. Concurrently occurring abiotic stress events result in complex responses and interacting signalling pathways that may inhibit each other [25]. The wheat plant has the potential to maintain its growth and development under individual or combined drought and heat stress by altering physiological and biochemical attributes [26]. Under heat stress, plants with adequate water supply keep their stomata open to enhance leaf cooling through transpiration, while under water scarcity, plants close their stomata to avoid excess water loss resulting in increased leaf temperature [27]. The drought stress causes changes in morphological, physiological, biochemical, and cellular mechanisms in plants so as to combat the stress. These changes alter the gene functions to accumulate osmolytes, upgrade antioxidant defence systems, reduce transpiration, and inhibit the growth of various plant organs such as roots, shoots, and leaves [28,29,30]. Thus, it may be possible to combine high yield potential with heat and drought tolerance through simultaneous selection in wheat germplasm [31]. The previous attempts to improve grain yield using conventional breeding strategies resulted in an increase in yield by about one per cent per year [32], which is far below the 2.4% required to satisfy the escalated demand. The present study is a further step in the same direction, aimed to identify the genetic resources which are tolerant to drought and/or heat stresses and also high yielding. Further, an attempt was made to identify the traits contributing to yield under stress conditions.

2. Materials and Methods

2.1. Experimental Site and Plant Materials

The field trials were conducted during 2017–18 and 2018–19 at three locations ICAR-IIWBR, Karnal (29°42′, 76°607) in North West Plain Zone (NWPZ), JNKVV Powarkheda (21°50′, 76°43) in Central Zone (CZ), and PDKV Akola (42°34, 59°53) in Peninsular Zone (PZ). Whereas the crop in NWPZ experiences terminal heat stress, in CZ and PZ, the crop is exposed to early and terminal heat stress. The experiments were undertaken in four environments at each location. Sowing was performed on two dates, i.e., the middle of November and the middle of December. For timely sowing conditions (the middle of November), two experiments were sown, of which one experiment received recommended irrigations, while no irrigation was given after sowing to the other experiment. November sowing with irrigation was considered normal or non-stress (TSIR-NS), whereas without irrigation was drought stress (TSRF-DR). Similarly, December sowing with irrigation was considered as late or heat-stress (LSIR-HT), and without irrigation, as combined drought-and-heat stress (LSRF-DHT). The drought experiments (TSRF-DR and LSRF-DHT) were conducted in an automatic rainout shelter at Karnal.
Plant material: Forty-two genotypes comprising 29 advanced breeding lines, 5 cultivars, and 8 registered genetic stocks (genotypes identified for drought and/or heat tolerance and registered at the National Bureau of Plant Genetic Resources, India) were used in the present study. The seed material was procured from ICAR-IIWBR, Karnal. The advanced breeding lines were selected from the initial multi-location trials of the varietal development program of India, targeted for stressed conditions, i.e., late sown (heat) and restricted irrigation (drought). Details of the pedigree and target conditions of these genotypes are given in Supplementary Table S1.

2.2. Field Experiments

Experiments were laid out following a rectangular lattice design in which each genotype was planted in a two-row plot of 2.0 m length, maintaining a row spacing of 23 cm. Seed rate was kept at 100 kg ha−1. Recommended package of practices for the agro-climatic zone was followed to raise the crop. The crop was protected from disease (rust) by spraying tilt (propiconazole), and weeds were removed manually. Standard agronomic practices were followed to raise healthy wheat crops, except for the number of irrigations. The meteorological data were generated by an automatic weather station (Watch Dog 2900). The daily mean maximum and mean minimum temperatures were recorded for the characterization of environments. Mean minimum and maximum temperatures before and after heading were calculated by taking into consideration the minimum number of days to heading (DH) and the maximum number of days to maturity (DM). Details of temperature and rainfall data of the post-heading period during crop season at three locations are presented in (Figure 1).

2.3. Data Collection

Data were recorded for the following yield contributing traits in all the experiments and all the locations: Days to heading (DH), Days to maturity (DM), grain-filling duration (GFD), plant height (PHT), productive tillers (PTL), biomass (BM), grain yield (GY), harvest index (HI), spike length (SPKL), spikelets /spike (SPKLT), grain number/ spike (GN), grain weight/spike (GW) and 1000-grain weight (TGW). Whereas PTL was recorded per one meter length, BM and GY were taken from the net plot for each genotype under all the environments.
Stress susceptibility and stress tolerance indices were estimated for grain yield following the formula given by [33,34], respectively.
Stress susceptibility index = [1 − (xs/xp)]/[1 − (Xs/Xp)]
Stress tolerance index = (xs × xp)/(Xp)2
where xs is the trait value (thousand-grain weight) of the genotype under stress and xp is the trait value of the genotype under non-stress conditions. Xs and Xp are the mean values of the trait of all the genotypes under stress and non-stress conditions, respectively.

2.4. Statistical Analysis

The proc GLM procedure of SAS statistical software version 9.3 [35] was used to analyse variance (ANOVA) to determine the significance of differences between treatments and genotypes. The ANOVA was also performed using locations as the main factor, along with the year, genotype, and treatments. ANOVA was also performed using irrigation and sowing time as factors. Details of descriptive statistics related to various traits and stress conditions were calculated. The correlation analysis between the traits under four different environments was generated using the “R” software package (corrplot) [36]. Using principal component analysis, the correlations between yield and other yield-attributing variables were further investigated. For principal component analysis, the “factoextra” package of “R” software was used. Further, biplots generated from each treatment’s first two principal components are used to display the findings of the principal component analysis.

3. Results

The present study was undertaken to find the effect of individual heat and drought treatments and their combination on grain yield and its components of diverse wheat germplasm.

3.1. Exposure to Stress

To determine the severity of stress, weather data were recorded at all the locations (Karnal, Powarkheda, and Akola) during both cropping seasons. Average minimum temperature (20.3 °C and 19.4 °C) and average maximum temperature (37.4 °C and 39.5 °C) were highest at Akola in 2017–2018 and 2018–2019 during the post-heading period under late sown trials (Figure 1). The average maximum temperature was more than 32.5 °C at all the locations under the late sown post-heading period for both the cropping seasons. It was observed that there was no rainfall at Akola centre during 2018–2019 and at Powarkheda during 2017–2018. Both these centres received scanty rains (<5.0 mm) during the other cropping season. Karnal centre received 15.2 mm of rainfall during 2017–2018 and 29.6 mm and 9.4 mm during timely and late sown conditions of 2018–2019. However, at Karnal centre, the drought experiments were conducted under an automatic rainout shelter.

3.2. Effects of Individual/Combined Heat and Drought Stress on Yield Components

Analysis of variance for the traits studied is presented in Table S2. The pooled ANOVA for all the environments (locations, sowing conditions, and years) showed significant variation (p < 0.05) among the genotypes for all the studied traits except BM. For sowing conditions also, genotypes differed significantly for all the traits except HI under LSRF-DHT, DM, and GFD under LSIR-HT, and GFD and BM under TSRF-DR (Table S2), indicating the presence of variation in the genotypes for measured traits. The centres were significantly different for all the traits. Similarly, all the traits except HI and SPKL were significantly different due to sowing time and GFD due to irrigation. The interaction between genotype and sowing time was significant for DH, GFD, HI, TGW, PHT, and GW; the interaction between genotype and irrigation was significant for DH, GN, and GW. The interaction between centres, genotype, sowing time, and irrigation was significant for DH, DM, GFD, BM, HI, and TGW.
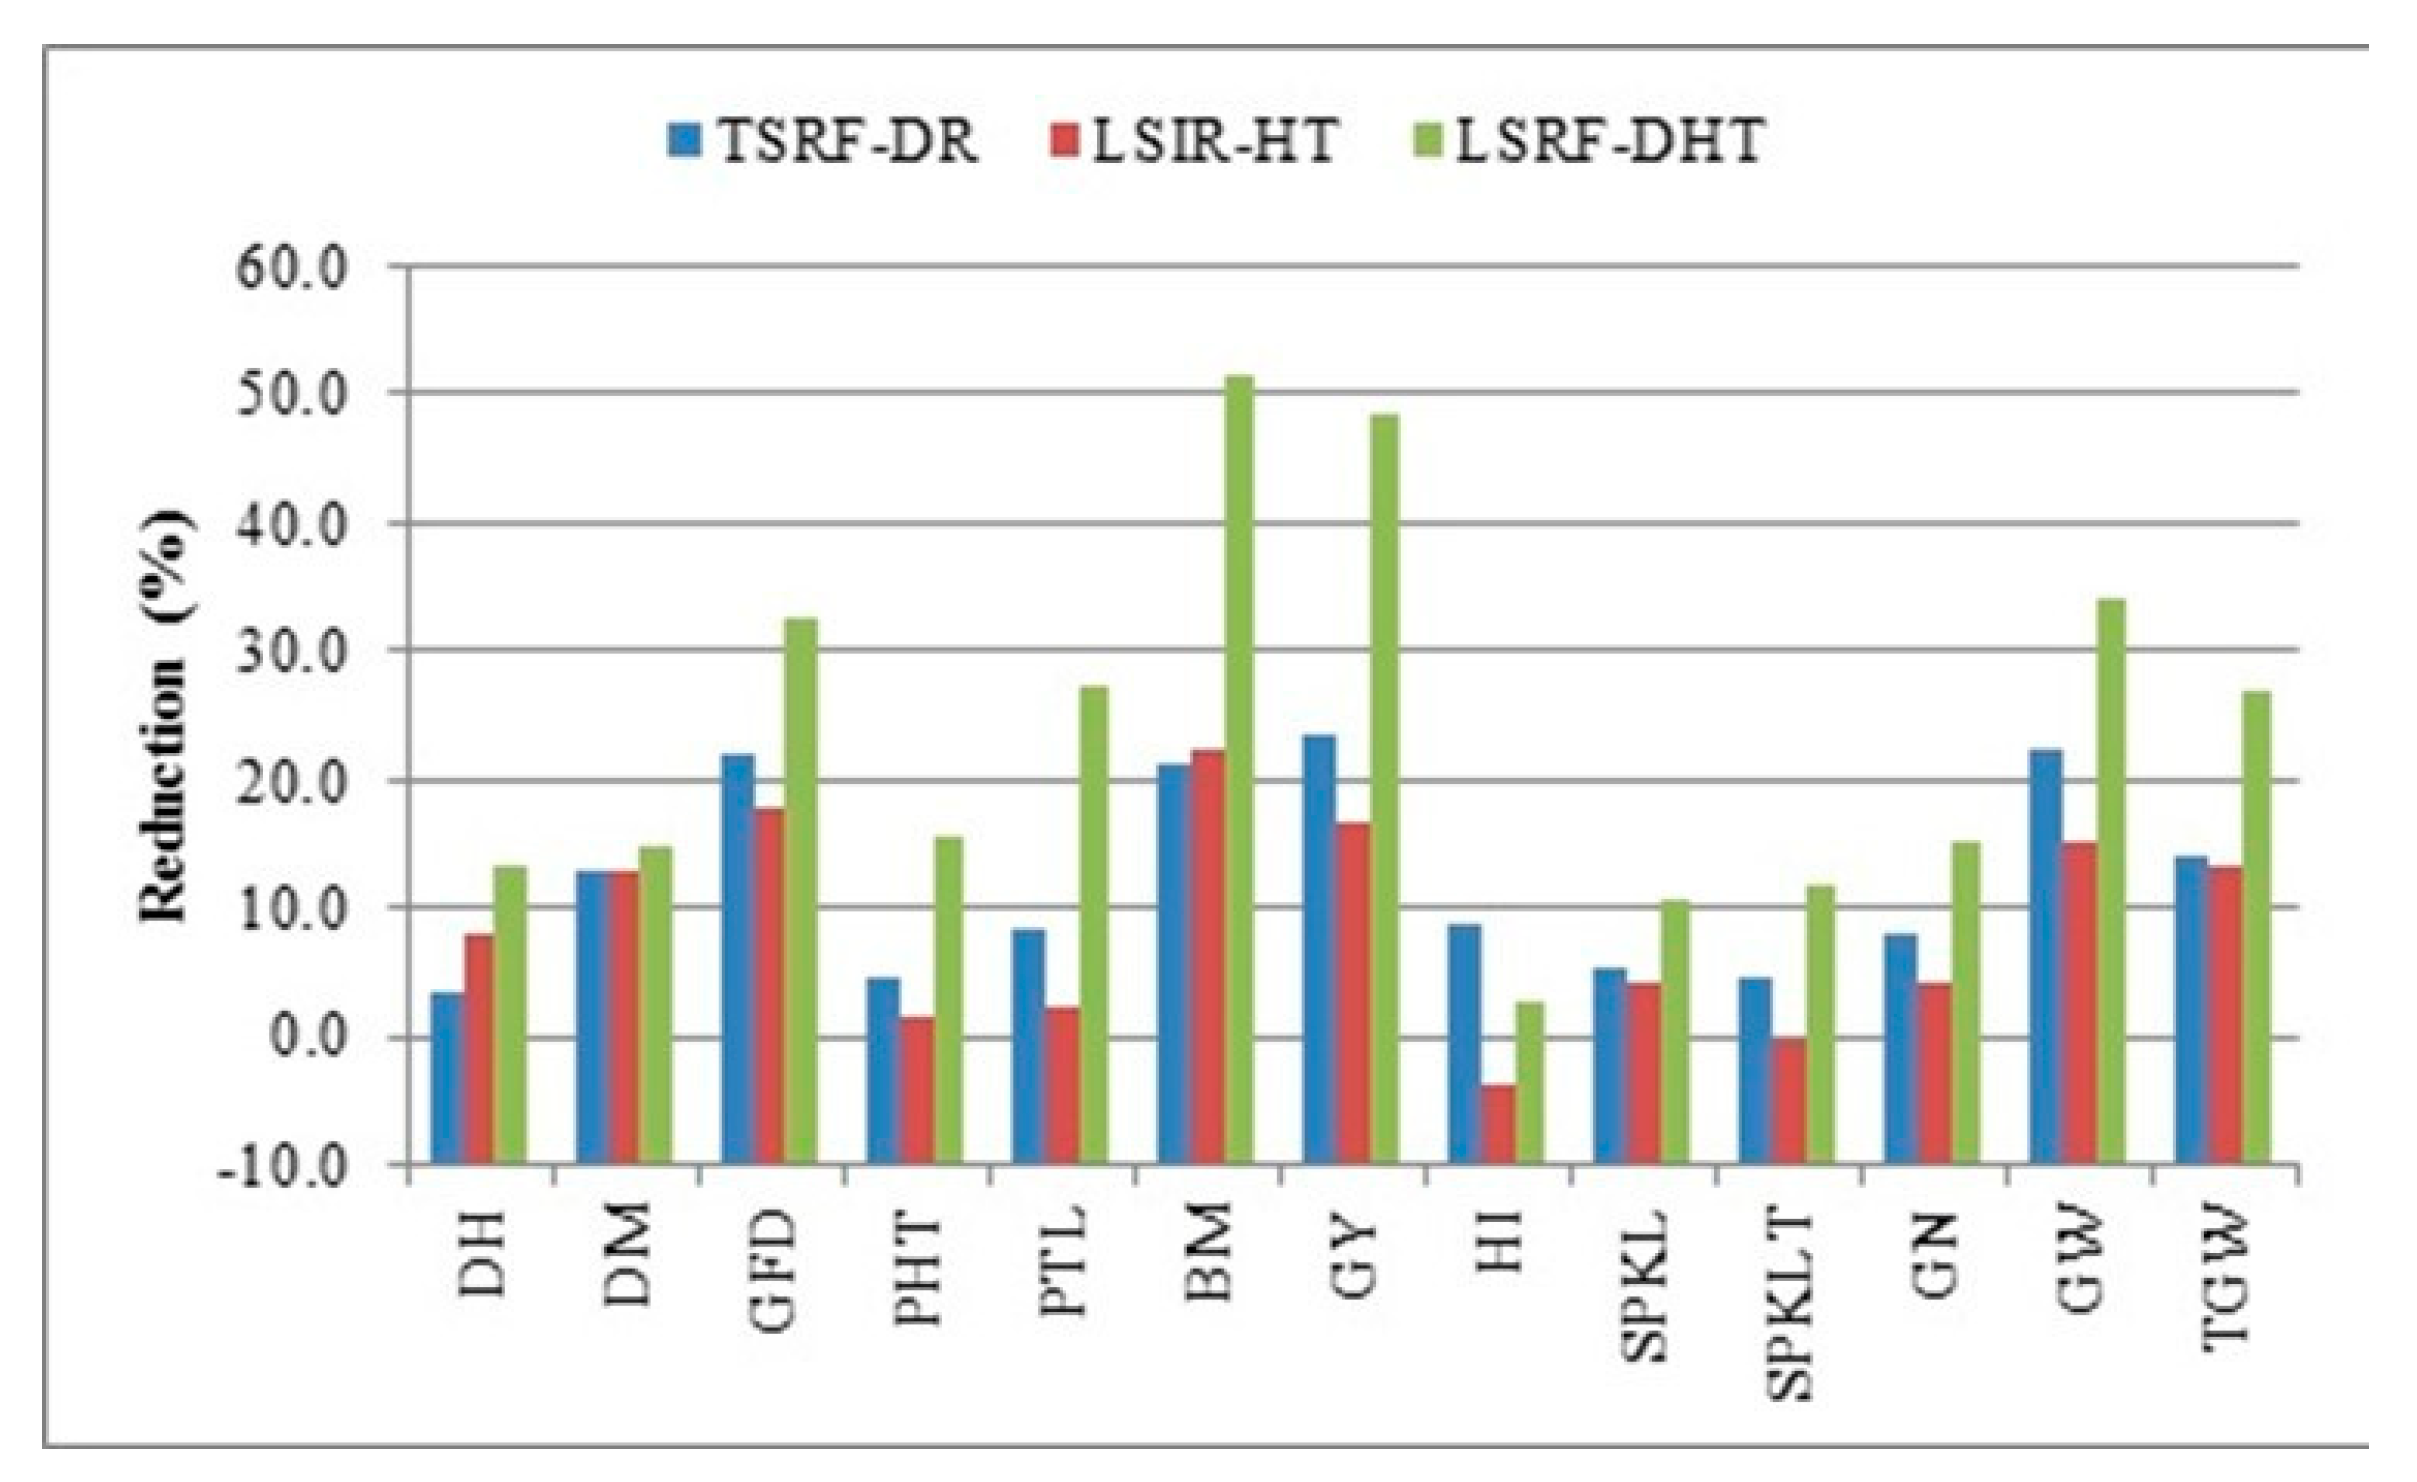
The average performance pooled over locations and years was higher under normal (TSIR-NS) as compared to stress for all the measured traits. The mean performance of the genotypes for grain yield and its component traits under normal, individual, and combined stress conditions are presented in Table S3. The mean values for the traits PHT and SPKLT were similar to that of control under individual heat and drought stress; however, under the combined heat and drought stress, these traits showed a substantial reduction. (Figure 2). Likewise, the performance of BM and GY was significantly reduced under all three stress conditions in comparison to control/normal conditions. Under combined stress, BM had a maximum reduction of 51.4% as compared to individual drought and heat stress (21.3% and 22.4%). Average GY reduced by 16.8%, 23.6%, and 48.6% under heat, drought, and combined stress. The average reduction in GW was 15.3%, 22.5%, and 33.9% due to heat, drought, and combined stresses, respectively. The individual heat and drought stress reduced TGW by 13.2% and 14.1%, respectively, but the combined treatment reduced it by 26.8%. Similarly, the reduction in GFD was 17.9% and 21.9% under heat and drought stress, but under combined stress, it reduced by 32.7%. Similarly, PTL, GN, and SPKL had a higher reduction of 27.2%, 15.1%, and 10.7% under combined stress. Overall, the combined stress was more detrimental to wheat genotypes than either heat or drought alone.
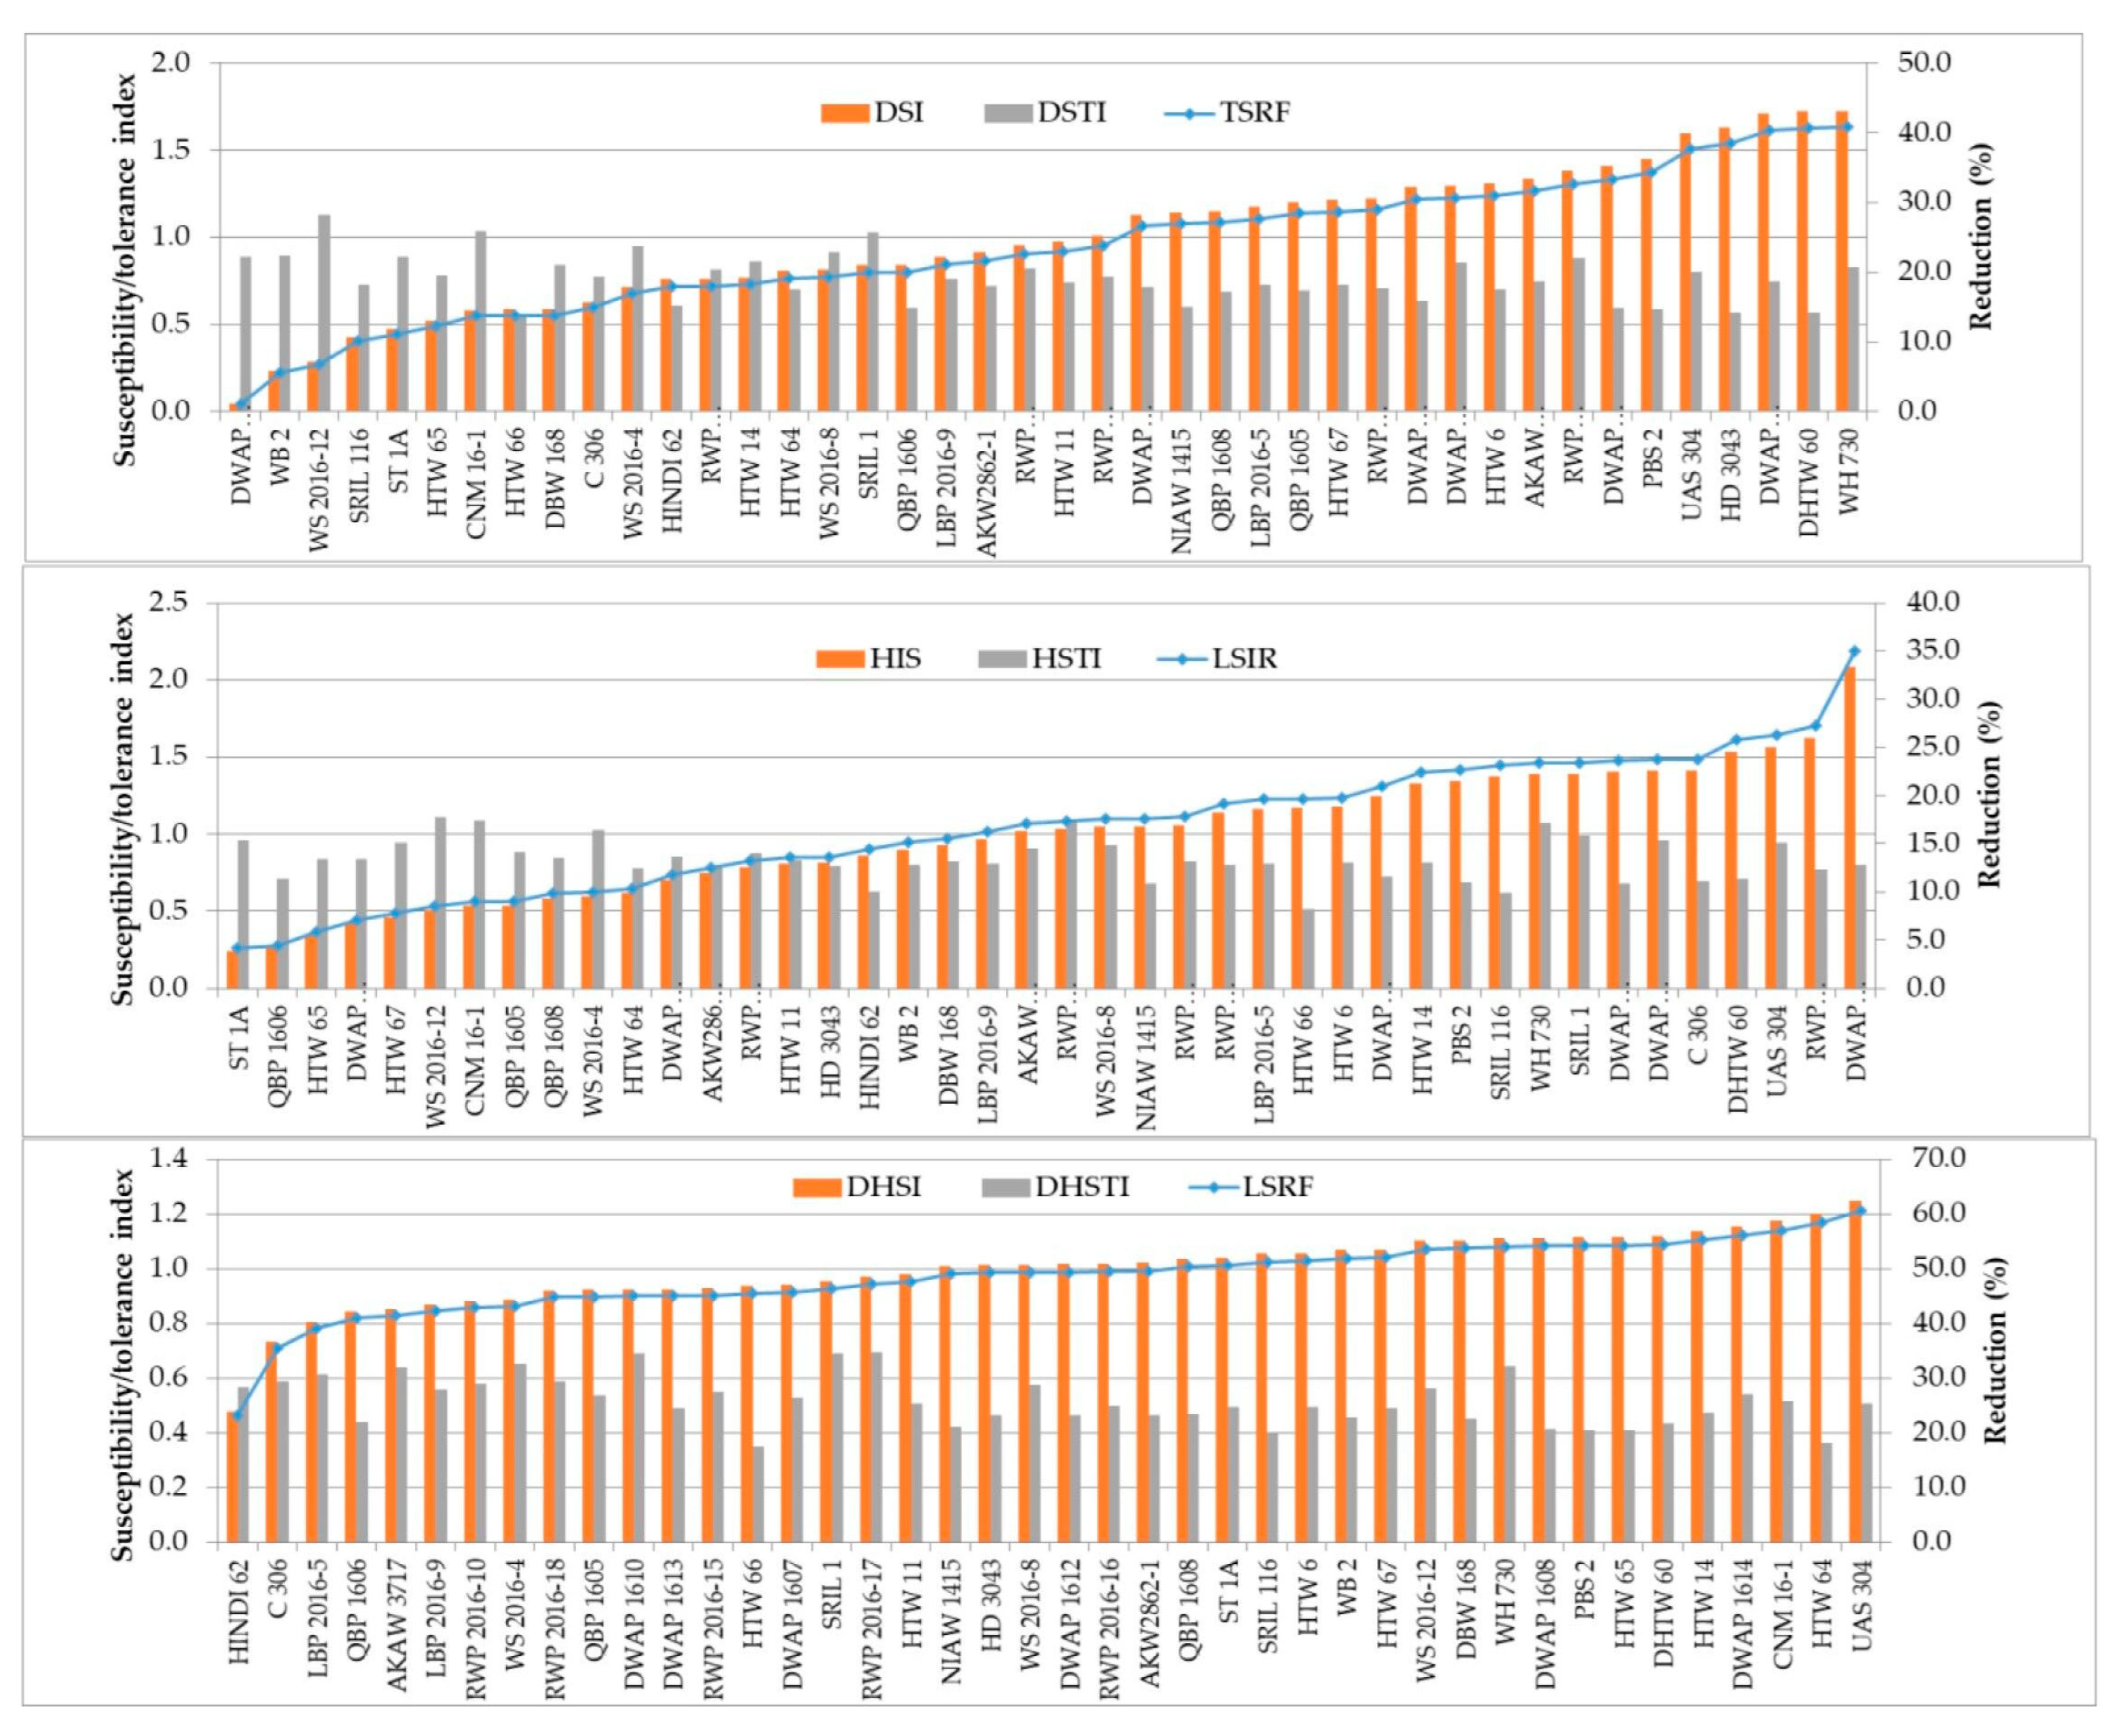
Genotypes QBP 1606, HTW 65, and HTW 67 suffered the minimum penalty in terms of reduced grain yield under LSIR-HT, DWAP 1608, WB 02, WS 2016-12, and HTW 65 under TSRF-DR and genotypes Hindi 62, C 306, AKAW 3717 and HTW 66 under combined stress (LSRF-DHT). All the genotypes except two suffered more than a 40% reduction in grain yield under combined stress (LSRF-DHT) (Figure 3).

3.3. Correlation among Measured Traits

To visualize the effects of individual and combined heat and drought stress on the relationships among the measured traits, Pearson’s correlation coefficients were calculated for all the conditions. The results are presented in Figure 4. Under the combined stress conditions (LSRF-DHT), a significant positive correlation was observed for DH with DM (0.79 ***) and SPKLT (0.55 ***) and a negative correlation with GFD (−0.56 ***) and TGW (−0.50 ***). DM was positively correlated with SPKLT (0.57 ***) and GN (0.40 **) and negatively with TGW (−0.44 **). PHT had a significant positive association with PTL (0.68 ***) and BM (0.45 **) and a negative association with HI (−0.39 **) and GN (−0.34 **). A significant positive correlation was observed between PTL and BM (0.46 **) and negative with GN (−0.46 **) and GW (−0.42 **). BM showed a highly significant correlation with GY (0.73 ***) and moderate with TGW (0.38 **). HI (0.65 ***), GW (0.60 ***) and TGW (0.51 ***) were positively associated with GY. SPKL showed a significant positive correlation with SPKLT (0.59 ***), GN (0.40 **), and GW (0.41 **).
Under drought stress, GY had a significant positive correlation with DH (0.54 ***), DM (0.52 ***), PHT (0.43 **), PTL (0.53 ***), and BM (0.74 ***) and a negative correlation with GFD (−0.32 *). Under heat stress, GY correlated with BM (0.61 ***) and HI (0.58 ***). Similarly, under normal conditions, GY had a positive correlation with BM (0.11 ***) and HI (0.54 ***) (Figure 4).

3.4. Principal Component Analysis

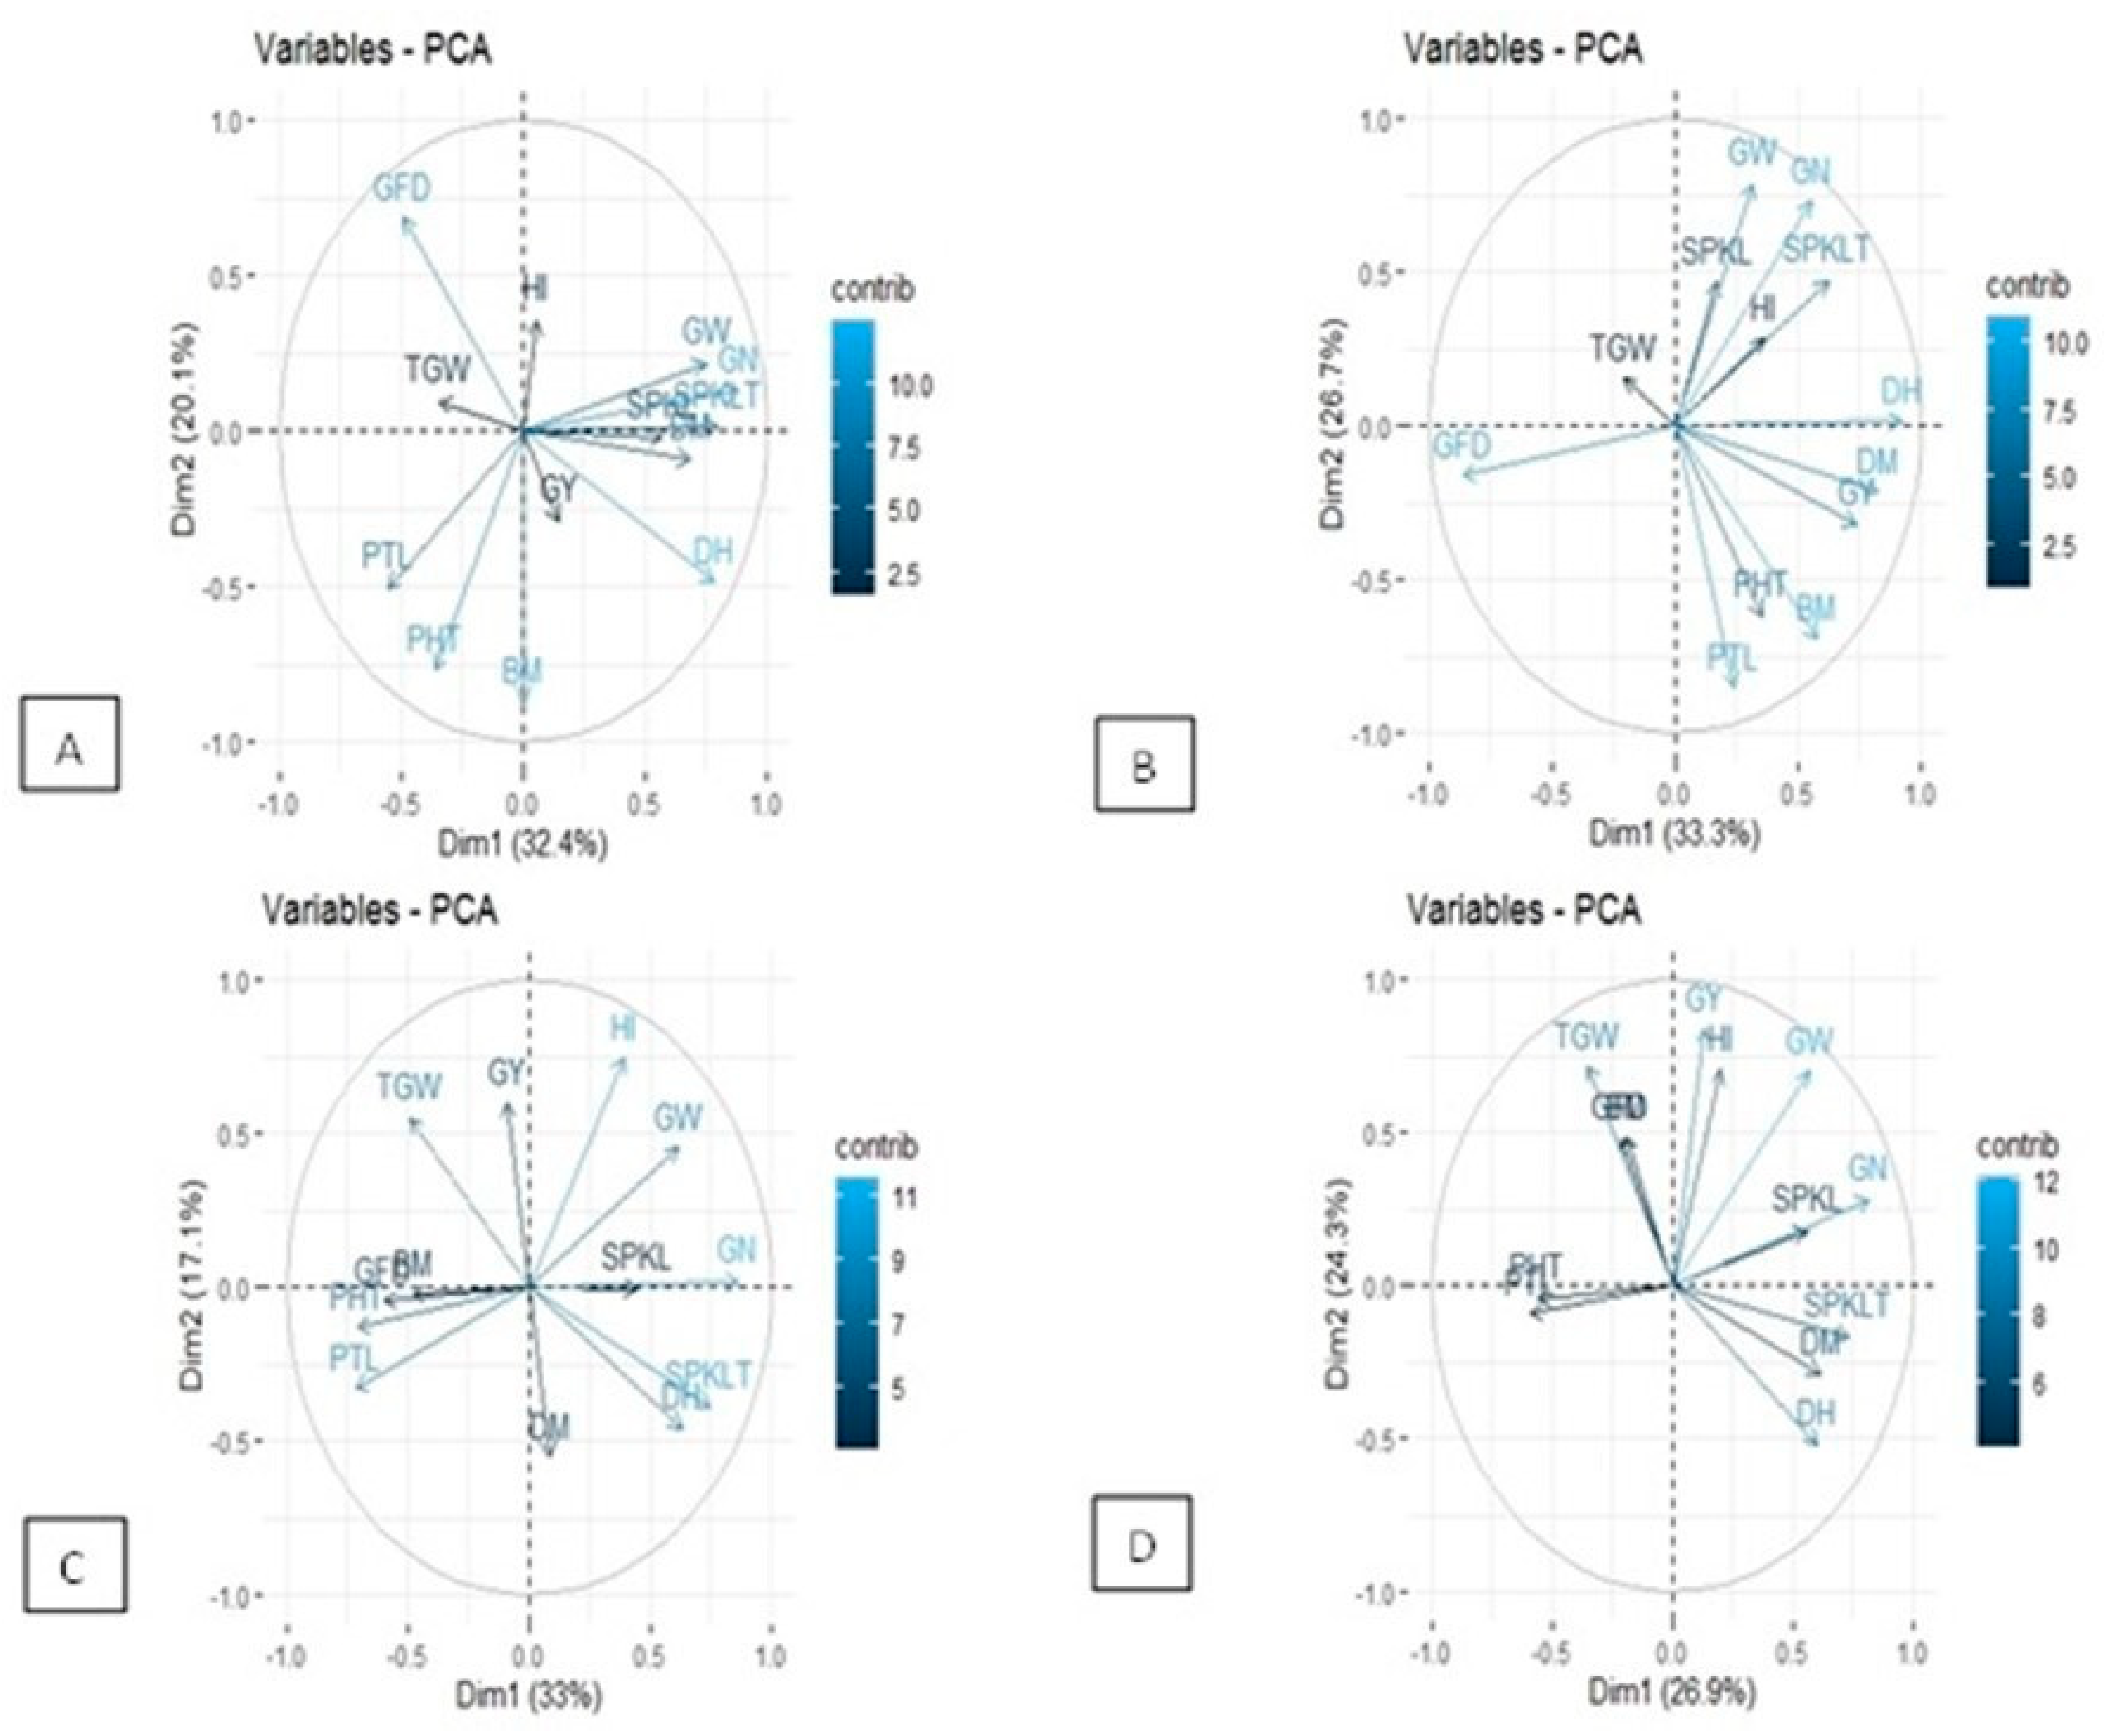
PCA showed Eigenvalues greater than 1 for the first three components in all the environments. For TSIR-NS, the first and second principal components (PC1 and PC2) explained 32.4% and 20.1% of phenotypic variation, respectively. Major contributor traits to these two PCs were GN, SPKLT, DH, GW, DM, BM, PHT, and GFD (Figure 5). Under the TSRF-DR condition, PC1 and PC2 explained 33.3% and 26.7% of the phenotypic variation, respectively, where major contributors were DH, DM, GFD, GY, PTL, GW, GN, BM, and PHT (Figure 4). Under LSIR-HT condition, PC1 and PC2 explained 33.0% and 17.1% of the phenotypic variation, respectively, where major contributors were GN, SPKLT, PTL, PHT, HI, GY, DM, and TGW (Figure 4) and under LSRF-DHT condition, traits DH, SPKLT, GN, GY, HI, GW, and TGW contributed to 26.9% and 24.3% variation explained by PC1 and PC2.

3.5. Contribution of Component Traits to Grain Yield

Stepwise regression analysis was carried out to assess the contribution of traits toward the final yield under normal and stress environments. Mean values for each genotype over the years and centres were used in the regression model, and traits BM (0.958), HI (0.656), GN (0.266), TGW (0.190), SPKL (0.185), SPKLT (0.177), and PTL (0.092) contributed towards grain yield under TSIR-NS, BM (0.807), HI (0.573), DH (0.512), GFD (0.239), TGW (0.120), GN (0.091), SPKLT (0.070), and PTL (0.012) under TSRF-DR, BM (0.793), HI (0.760), SPKL (0.068), GW (0.063), PTL (0.035), DH (0.030), GFD (0.026), and TGW (0.016) under LSIR-HT and BM (0.655), HI (0.524), and GW (0.197) under LSRF-DHT. There was a proportionately higher contribution of BM and HI towards GY under all sowing environments. However, GW contributed under late sown trials (LSIR and LSRF), and GN under timely sown trials (TSIR and TSRF). GFD, TGW, and PTL contributed under all conditions except combined heat and drought stress.

3.6. Stress Susceptibility and Tolerance Indices

Based on grain yield under normal and stress conditions, the stress susceptibility index and stress tolerance index were calculated. The top ten lines under heat stress had grain yield of 76.6% to 95.9% to their counterparts under normal conditions. The HSI of these lines ranged from 0.25 to 1.39, and the tolerance index was between 0.84 and 1.11 (Figure 3). The top ten lines under drought stress with grain yield of 80 to 91% had DSI between 0.04 and 0.84 and DSTI of 0.84 and 1.13. Under combined heat and drought stress, the grain yield of the top ten lines was significantly lower than their normal conditions (52.9–76.8%). These lines had a susceptibility index of 0.48 to 0.97 and a tolerance index of 0.57 to 0.69. Only one line, WS 2016-4, was among the top ten ranked under normal, single, and combined stress.
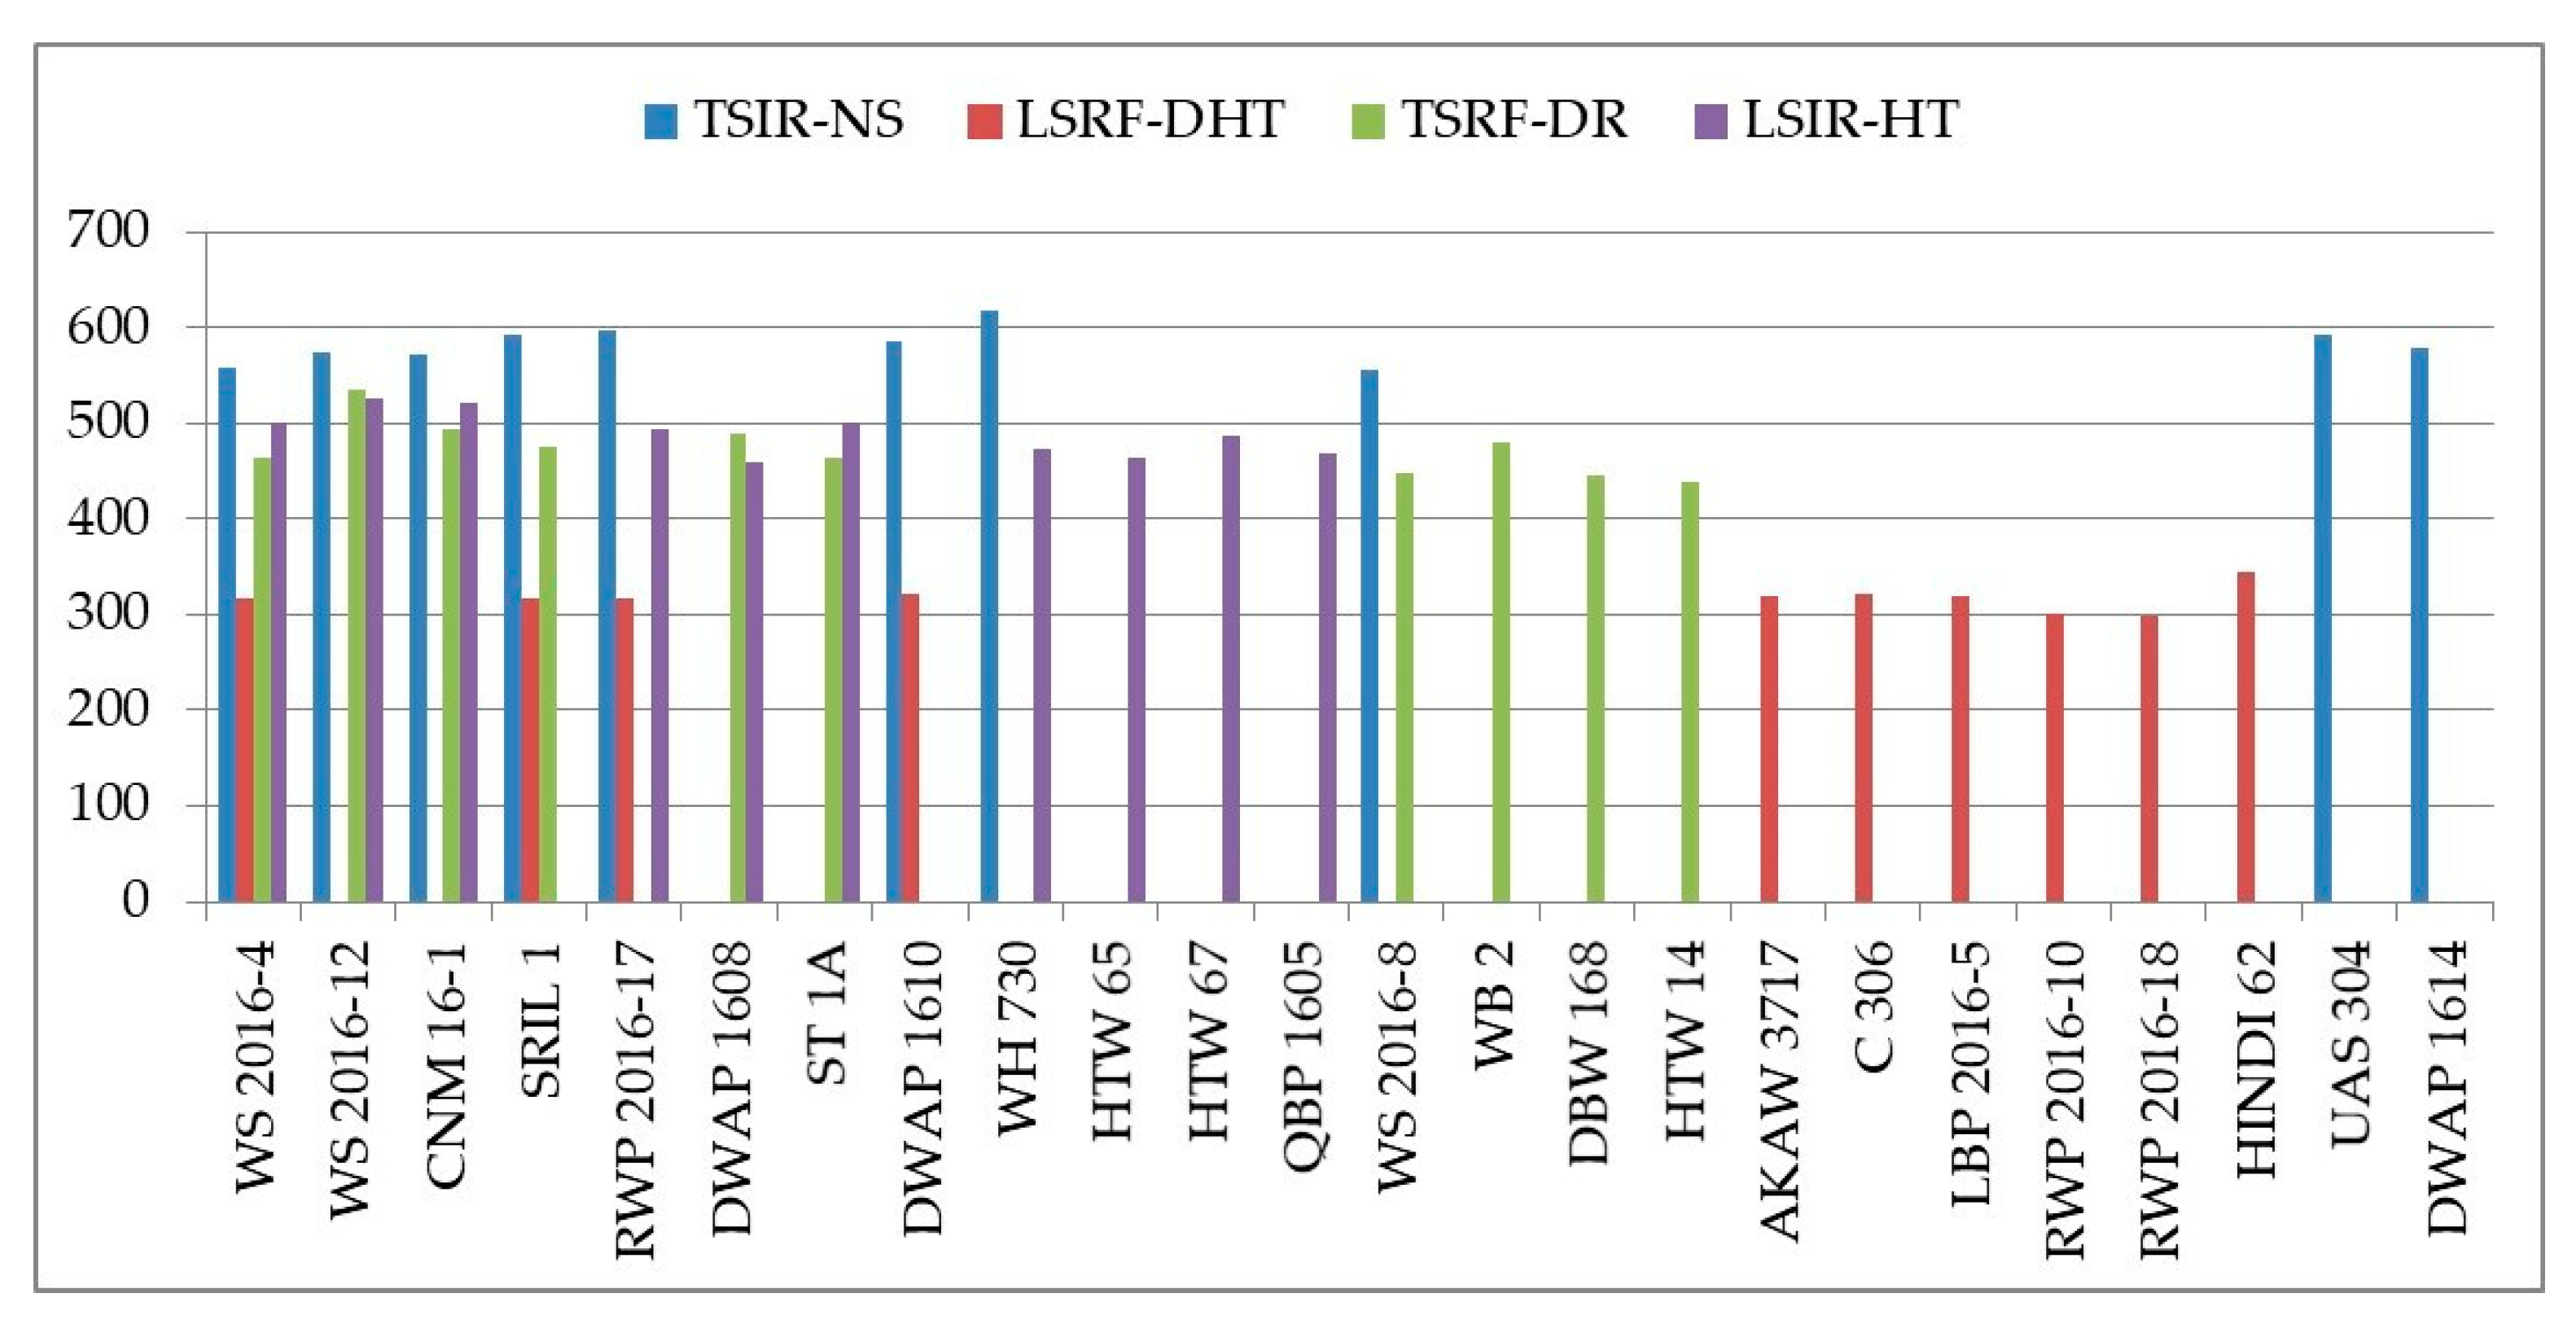
Genotypes WH 730, RWP 2016-17, SRIL 1, UAS 304, DWAP 1610, DWAP 1614, WS 2016-12, CNM 16-1, WS 2016-4, and WS 2016-8 were high yielders under TSIR-NS (Figure 6). Of these, RWP 2016-17 was a high yielder under LSRF-DHT and LSIR-HT also. The moderately tolerant genotype SRIL 1 was high-yielding under TSIR-NS, TSRF-DR, and LSRF-DHT. The highly tolerant WS 2016-12 and moderately tolerant CNM16-1 were high-yielding under TSIR-NS, TSRF-DR, and LSIR-HT. WS2016-4 under LSIR-HT and LSRF-DHT, DWAP1610 under LSRF-DHT, WS2016-8 under TSRF-DR and WH730 under LSIR-HT. Genotypes DWAP1608 and ST1A were high-yielding under single heat and drought stress, whereas WS2016-8 was among the top ten under normal and drought conditions.
There were 22 genotypes tolerant to drought stress with a DSI value less than 1.0. Fourteen of these were high yielding under at least one environment. Similarly, 12 out of 20 genotypes tolerant to heat stress with an HSI value less than 1.0 were high-yielding, and 11 out of 18 tolerant to combined stress were high-yielding.

4. Discussion

The present study was conducted to explore the individual and combinatorial heat and drought stress effect on grain yield and components. The weather data recorded for the period under study revealed that the post-heading average minimum and maximum temperature were higher by 1.1 °C to 2.3 °C and 1.6 °C to 2.8 °C, respectively, under late sown conditions for three centres. The average maximum temperature during grain filling was above 32.5 °C at all the centres. It means that the genotypes were exposed to terminal heat stress under late-sown conditions. The wheat crop is exposed to high-temperature stress during the grain-filling stage. An air temperature of about 20–25 °C is considered to be optimum for the growth and development of spring wheat and barley [37,38], and the maximum temperature requirement during grain filling of the wheat crop is 30 °C + 2.13 °C [39]. At Akola and Powarkheda centres, the drought experiments were conducted in the field and received no or scanty (<5.0 mm) rainfall during the study period. At Karnal centre, the drought experiments were conducted under an automatic rainout shelter (Supplementary Figure S1). Hence the genotypes were exposed to drought conditions at all the centres.
ANOVA revealed significant differences among the genotypes for most of the traits confirming that the genotypes used in this experiment were genetically diverse. The improvement in any crop depends on the relative importance of the genotypic effects [40]. Therefore, in the present study, the performance of genotypes under different stress environments corresponds to the fact that each genotype responded differently to different stresses [41]. Although the traits’ sensitivity to various environmental conditions can be improved, the polygenic nature and G–X–E interactions make the process slow, as only the genetic components of the trait respond to selection. The morpho-physiological traits have the greatest impact on the adaptation to the target environments so that maximum productivity is achieved. During the present study, significant phenotypic variation was recorded for most of the traits (Table S3). Under normal sown conditions, the coefficient of variation was maximum for GN (10.8%), followed by PHT (9.6%), GW (9.4%), and PTL (9.2%) whereas under stress conditions (drought, heat, and combined) maximum CV was observed for PTL (14.3, 10.7, and 13.4 %) and GY (12.8, 10.0, and 13.2%). Gahlaut et al. [5] also recorded maximum CV in productive tillers in Excalibur/Kukri DH population under rainfed conditions. Genotypic variability in GY and its components were reported in DharwarDry/Sitta RILs and Weebil × Bacanora DH population [42,43]. Various other studies have reported large variations in agronomical traits in the diverse germplasm lines of wheat under heat-stress conditions [44]. The variability in agro-morphological traits in stress and non-stress environments is desirable for the selection of ideal genotypes suited to the particular environment.
Diversity for DH and DM was relatively less compared to GY, PTL, and GW, which could be due to diverse environments exerting greater influence on these traits [45]. Phenotypic variance for phenological traits was mainly attributed to the conditions/growing environment in the present study. Although the variance in BM and GY was maximum due to sowing conditions and environment, the variance in grain yield components was attributed to the genotype effect. Fleitas et al. [46] also reported that the environment, as well as the genotypic factor, was the most important affecting GN, TKW, GY, and GPC, except grain yield, which was scarcely affected by interactions with other factors. In the present study also, only a 2.0% variation was explained by the interaction with the sowing condition.
Quite often, drought and heat stresses occur simultaneously [47], particularly in dry and semi-dry regions worldwide. The heat and water stress are related to decreased stomatal conductance and transpiration, which induces heat stress by increasing the leaves’ temperature [48]. According to Lobell et al. [49], variations in temperature and precipitation were to account for the 5.5% decline in worldwide wheat production from 1980 to 2008. Still, their interactive effects on crop yield and productivity have received little attention barring a few studies [7,50,51]. The effect of dual stresses is not always additive and is different from that of individual stress [52]. In the present study, GY was severely affected by combined heat and drought stress (48.6%), followed by individual drought (23.6%) and individual heat stress (16.8%). Similar trends in yield reduction were also reported in wheat [41]. As expected under combined stress, the reduction was of higher magnitude for all the yield components except GW and TGW, which was higher under drought conditions. The abiotic stresses, particularly drought and heat, reduce grain yield and contribute significantly to the low productivity of wheat [53]. The pollen abortion, sterile tillers, and reduction in food reserves cause a reduction in grain yield under drought stress [54]. The temperature stress, with or without other stresses, may trigger oxidative impairment in plants [55]. The sensitivity of metabolic processes to heat stress [56] and reduction in the development phase are responsible for reduced grain yield and biomass [57]. The combined stress has a detrimental impact on reproductive development, such as flowering, ovary, pollen development, and below-average fertilization, and subsequently results in losses due to reduced sinking capacity [47,54].
In the present study, GY had a positive correlation with BM, HI, and TGW under normal, individual heat, drought, and combined heat and drought stress environments. Yousaf et al. [58] found a significantly positive correlation between GY with GPS and TGW. The TGW is among the key traits that contribute to genetic gain in wheat breeding under drought [59,60]. However, this trait was not largely exploited to select heat tolerance [61]. The close association between GY and TGW under stressed environments suggests that selection for higher TGW can result in higher GY.
There was a negative association of DH with TGW (all stress conditions) and GY (LSIR-HT and LSRF-DHT). Pandey et al. [62] also reported similar findings under heat and spot blotch stress. The negative association supports the escape mechanism of stress tolerance [63]. Both stresses drought and heat after anthesis reduce the grain-filling period [64], which is responsible for the decline in yield [24,65]. Heat stress (35 °C) post-anthesis shortened the grain-filling duration and limited resource allocation to grain, decreasing wheat yields by 6–51% in a controlled environment and 2–27% in the field [66]. This decline is attributed to the reduction in photosynthesis, accelerated leaf senescence, and sink limitations [67,68,69]. The genotypes with a longer post-heading duration are more tolerant to heat stress [70]. However, in the present study, we found a negative correlation between GY and GFD under drought and heat stress. Under stress conditions, crop plants explore alternative sources of assimilates to remobilize into the grain, and therefore, stem reserves and their re-translocation to reproductive parts are crucial for developing wheat grain [71,72]. Genotypes tend to increase the grain growth rate to compensate for the reduction in duration and to maintain grain weight under high-temperature stress conditions [73].
Drought and heat tolerance is usually quantified by grain yield under stress conditions [45], but the selection for yield under stress conditions is complicated due to low heritability and large genotype–environment interactions. The selection for improved grain yield under different environments leads to the development of climate-resilient genotypes [74]. In the present study, we identified WS 2016-4 as the only genotype that yielded high under all the stress conditions as well as normal conditions. As a consequence, this genotype was less sensitive to stress and had a comparatively high tolerance, as evident from SI and STI values. Genotypes WS 2016-12 and CNM 16-1 were top performers under heat and drought stress. Both these genotypes were highly tolerant to these two stresses and also yielded equally high under normal conditions. It suggests that these genotypes are stable and can perform well under various environments, including stress conditions [41].
Mechanism/traits responsible for stress tolerance:
The top ten genotypes tolerant to drought stress had DSI ranging from 0.04 to 0.63. Six of them were high yielding under TSRF conditions. Four genotypes DWAP 1608, WS 2016-12, WB 02, and ST 1A, adapted to the escape mechanism either by entering the reproductive phase early or completing the phase early (Table 1). CNM 16-1 and DBW 168 were high-yielding under these conditions due to higher HI and GW. The remaining four genotypes, which were drought tolerant but not high-yielding, also adapted to escape mechanisms. The top ten genotypes tolerant to heat stress had HSI between 0.25 and 0.60, and eight were high-yielding under LSIR conditions. Four high-yielding genotypes, namely, HTW 65, WS 2016-12, WS 2016-4, and QBP 1605 and two low-yielding QBP 1606 and QBP 1608, adapted to escape mechanism. Two genotypes CNM 16-1 and DWAP 1608 had higher productive tillers under LSIR, and ST 1A and HTW 67 had higher HI and GN. DHSI range was higher for combined stress from 0.48 to 0.92. LBP 2016-5, RWP 2016-10, and WS 2016-4, along with QBP 1605 and QBP 1606, escaped the stress. Three genotypes, HINDI 62, AKAW 3717, and C 306, manifested tolerance through higher PTL and HI, whereas RWP 2016-18 and LBP 2016-9 had high HI and GN. Griffiths et al. [75] also reported that best performers under drought stress had higher grain numbers/spikes.
Overall, out of 30 tolerant genotypes (ten of each category), 19 adapted to escape mechanism which is irrespective of their yielding level. Escape is the most prevalent and foremost mechanism adopted by plants to overcome stress situations. The escape mechanism by earliness and short duration is considered the major criterion for breeding abiotic stress tolerance genotypes [63]. Cattivelli et al. [76] also considered earliness as an effective strategy for yield stability under terminal drought. The high-yielding genotypes among these are likely to have a higher grain-filling rate. High temperature is known to accelerate the grain-filling rate [15].
The identified genotypes can be used in the breeding program to transfer heat and drought stress into high-yielding elite cultivars. Genotypes WS 2016-4 and WS 2016-12 can be used directly in stressed environments. In addition, stable genotypes CNM 16-1, SRIL 1, and ST 1A can be utilized in wheat breeding.

5. Conclusions

The study demonstrated the potential of identified genotypes in wheat breeding for climate resilience and the traits imparting tolerance to these genotypes. WS 2016-4 yielded high under all the environments and was less sensitive to stress, and had a high tolerance. WS 2016-12 and CNM 16-1 were high-yielding under heat and drought stress and were highly tolerant to these two stresses. Escape is the most prevalent mechanism adopted by plants to overcome stress situations. The escape may be through earliness and/or short duration. These identified genotypes can be used in the breeding program to transfer heat and drought stress into high-yielding elite cultivars. Genotypes WS 2016-4 and WS 2016-12 can be used directly in stressed environments, whereas stable genotypes CNM 16-1, SRIL 1, and ST 1A can be utilized in wheat breeding.

Supplementary Materials

The following supporting information can be downloaded at: https://www.mdpi.com/article/10.3390/agronomy13030891/s1. Table S1 Pedigree details and target agroclimatic conditions of the genotypes used in study. Table S2 ANOVA for agronomical traits under TSIR NS, TSRF DR and LSIR HT. Table S3 Mean performance of genotypes under different environments. Figure S1 Rainout shelter where TSIR-DR (drought stress) and LSRF-DHT (combined drought and heat stress) trials were conducted at ICAR-IIWBR, Karnal.

Author Contributions

Conceptualization, S.S. and B.S.T.; Formal analysis, S.S. and N.B.; Funding acquisition, S.S.; Investigation, S.S., K.K.M., S.B. and N.R.P.; Project administration, S.S.; Writing—original draft, S.S.; Writing—review and editing, S.S., N.B., K.K.M., S.B., N.R.P., B.S.T. and G.P.S. All authors have read and agreed to the published version of the manuscript.

Funding

Financial support for the period (2015–2020) from Indian Council of Agricultural Research under Strategic Research Component of NICRA (National Innovations in Climate Resilient Agriculture) project (1006534) to conduct the study is acknowledged.

Institutional Review Board Statement

Not applicable.

Informed Consent Statement

Not applicable.

Data Availability Statement

Not applicable.

Conflicts of Interest

The authors declare no conflict of interest.

Abbreviations

DH: Days to heading, DM: Days to maturity, GFD: Grain-filling duration, PHT: plant height, PTL: productive tillers, BM: biomass, GY: grain yield, HI: harvest index, SPKL: spike length, SPKLT: spikelets /spike, GN: grain number/ spike, GW: grain weight/ spike, TGW: 1000-grain weight, TSIR-NS: Normal condition, TSRF-DR: Drought stress, LSIR-HT: Heat stress, LSRF-DHT: Drought and heat combined stress, SI: susceptibility index, STI: stress tolerance index, DSI: Drought susceptibility index, HSI: Heat susceptibility index, DHSI: Drought and and heat susceptibility index.

References

  1. Raza, A.; Razzaq, A.; Mehmood, S.S.; Zou, X.; Zhang, X.; Lv, Y.; Xu, J. Impact of Climate Change on Crops Adaptation and Strategies to Tackle Its Outcome: A Review. Plants 2019, 8, 34. [Google Scholar] [CrossRef] [Green Version]
  2. Raza, A.; Ashraf, F.; Zou, X.; Zhang, X.; Tosif, H. Plant Adaptation and Tolerance to Environmental Stresses: Mechanisms and Perspectives. In Plant Ecophysiology and Adaptation under Climate Change: Mechanisms and Perspectives I: General Consequences and Plant Responses; Hasanuzzaman, M., Ed.; Springer: Amsterdam, The Netherlands, 2020; pp. 117–145. [Google Scholar] [CrossRef]
  3. Raza, A.; Mubarik, M.S.; Sharif, R.; Habib, M.; Jabeen, W.; Zhang, C.; Chen, H.; Chen, Z.; Siddique, K.H.M.; Zhuang, W.; et al. Developing drought-smart, ready-to-grow future crops. Plant Genome 2022, e20279. [Google Scholar] [CrossRef] [PubMed]
  4. Shiferaw, B.; Smale, M.; Braun, H.-J.; Duveiller, E.; Reynolds, M.; Muricho, G. Crops that feed the world Past successes and future challenges to the role played by wheat in global food security. Food Secur. 2013, 5, 291–317. [Google Scholar] [CrossRef] [Green Version]
  5. Gahlaut, V.; Jaiswal, V.; Tyagi, B.S.; Singh, G.; Sareen, S.; Balyan, H.S.; Gupta, P.K. QTL mapping for nine drought-responsive agronomic traits in bread wheat under irrigated and rain-fed environments. PLoS ONE 2017, 12, e0182857. [Google Scholar] [CrossRef] [PubMed]
  6. Ray, D.K.; Ramankutty, N.; Mueller, N.D.; West, P.C.; Foley, J.A. Recent patterns of crop yield growth and stagnation. Nat. Commun. 2012, 3, 1293. [Google Scholar] [CrossRef] [Green Version]
  7. Prasad, P.V.V.; Pisipati, S.R.; Momcilovic, I.; Ristic, Z. Independent and combined effects of high temperature and drought stress during grain filling on plant yield and chloroplast protein synthesis elongation factor (EF-Tu) expression in spring wheat. J. Agron. Crop Sci. 2011, 197, 430–441. [Google Scholar] [CrossRef]
  8. ICAR-IIWBR. Director’s Report of AICRP on Wheat and Barley 2021–2022; Singh, G.P., Ed.; ICAR-Indian Institute of Wheat and Barley Research: Karnal, India, 2022; p. 83.
  9. Ali, S.; Liu, Y.; Ishaq, M.; Shah, T.; Abdullah; Ilyas, A.; Din, I.U. Climate Change and Its Impact on the Yield of Major Food Crops: Evidence from Pakistan. Foods 2017, 6, 39. [Google Scholar] [CrossRef]
  10. Zhao, C.; Liu, B.; Piao, S.; Wang, X.; Lobell, D.B.; Huang, Y.; Huang, M.T.; Yao, Y.T.; Bassu, S.; Ciais, P.; et al. Temperature increase reduces global yields of major crops in four independent estimates. Proc. Natl. Acad. Sci. USA 2017, 114, 9326–9331. [Google Scholar] [CrossRef] [Green Version]
  11. Hill, C.B.; Li, C. Genetic Improvement of Heat Stress Tolerance in Cereal Crops. Agronomy 2022, 12, 1205. [Google Scholar] [CrossRef]
  12. Atlin, G.N.; Cairns, J.E.; Das, B. Rapid breeding and varietal replacement are critical to adaptation of cropping systems in the developing world to climate change. Glob. Food Secur. 2017, 12, 31–37. [Google Scholar] [CrossRef]
  13. Cassia, R.; Nocioni, M.; Correa-Aragunde, N.; LaMattina, L. Climate Change and the Impact of Greenhouse Gasses: CO2 and NO, Friends and Foes of Plant Oxidative Stress. Front. Plant Sci. 2018, 9, 273. [Google Scholar] [CrossRef]
  14. IPCC. Summary for Policymakers. In Global Warming of 1.5 °C—An IPCC Special Report on the Impacts of Global Warming of 1.5 °C above Pre-Industrial Levels and Related Global Greenhouse Gas Emission Pathways; in the Context of Strengthening the Global Response to the Threat of Climate Change; Sustainable Development; and Efforts to Eradicate Poverty; Masson-Delmotte, V., Zhai, P., Pörtner, H.O., Roberts, D., Skea, J., Shukla, P.R., Pirani, A., Moufouma-Okia, W., Péan, C., Pidcock, R., et al., Eds.; World Meteorological Organization: Geneva, Switzerland, 2018; 32p. [Google Scholar]
  15. Asseng, S.; Ewert, F.; Martre, P.; Rötter, R.P.; Lobell, D.B.; Cammarano, D.; Kimball, B.A.; Ottman, M.J.; Wall, G.W.; White, J.W.; et al. Rising temperatures reduce global wheat production. Nat. Clim. Chang. 2015, 5, 143–147. [Google Scholar] [CrossRef]
  16. Liu, B.; Asseng, S.; Müller, C.; Ewert, F.; Elliott, J.; Lobell, D.B.; Martre, P.; Ruane, A.C.; Wallach, D.; Jones, J.W.; et al. Similar estimates of temperature impacts on global wheat yield by three independent methods. Nat. Clim. Chang. 2016, 6, 1130–1136. [Google Scholar] [CrossRef]
  17. Ortiz, R.; Sayre, K.D.; Govaerts, B.; Gupta, R.; Subbarao, G.V.; Ban, T.; Hodson, D.; Dixon, J.M.; Ortiz-Monasterio, J.I.; Reynolds, M. Climate change: Can wheat beat the heat? Agric. Ecosyst. Environ. 2008, 126, 46–58. [Google Scholar] [CrossRef]
  18. Daryanto, S.; Wang, L.; Jacinthe, P.-A. Global Synthesis of Drought Effects on Maize and Wheat Production. PLoS ONE 2016, 11, e0156362. [Google Scholar] [CrossRef] [PubMed] [Green Version]
  19. Zampieri, M.; Ceglar, A.; Dentener, F.; Toreti, A. Wheat yield loss attributable to heat waves, drought and water excess at the global, national and subnational scales. Environ. Res. Lett. 2017, 12, 064008. [Google Scholar] [CrossRef]
  20. Aggarwal, P.K. Global Climate Change and Indian Agriculture—Case Studies from the ICAR Network Project; Indian Council of Agricultural Research: New Delhi, India, 2009.
  21. El-Esawi, M.A.; Al-Ghamdi, A.A.; Ali, H.M.; Ahmad, M. Overexpression of AtWRKY30 Transcription Factor Enhances Heat and Drought Stress Tolerance in Wheat (Triticum aestivum L.). Genes 2019, 10, 163. [Google Scholar] [CrossRef] [Green Version]
  22. Toreti, A.; Cronie, O.; Zampieri, M. Concurrent climate extremes in the key wheat producing regions of the world. Sci. Rep. 2019, 9, 5493. [Google Scholar] [CrossRef] [Green Version]
  23. Bhusal, N.; Sarial, A.K.; Sharma, P.; Sareen, S. Mapping QTLs for grain yield components in wheat under heat stress. PLoS ONE 2017, 12, e0189594. [Google Scholar] [CrossRef] [Green Version]
  24. Pradhan, G.; Prasad, P.V.V.; Fritz, A.K.; Kirkham, M.B.; Gill, B.S. Effects of drought and high temperature stress on synthetic hexaploid wheat. Funct. Plant Biol. 2012, 39, 190–198. [Google Scholar] [CrossRef]
  25. Suzuki, N.; Rivero, R.M.; Shulaev, V.; Blumwald, E.; Mittler, R. Abiotic and biotic stress combinations. New Phytol. 2014, 203, 32–43. [Google Scholar] [CrossRef] [PubMed]
  26. Sattar, A.; Sher, A.; Ijaz, M.; Ul-Allah, S.; Rizwan, M.S.; Hussain, M.; Jabran, K.; Cheema, M.A. Terminal drought and heat stress alter physiological and biochemical attributes in flag leaf of bread wheat. PLoS ONE 2020, 15, e0232974. [Google Scholar] [CrossRef] [PubMed]
  27. Burke, J.J. Identification of genetic diversity and mutations in higher plant acquired thermotolerance. Physiol. Plant. 2001, 112, 167–170. [Google Scholar] [CrossRef]
  28. Alamri, S.; Hu, Y.; Mukherjee, S.; Aftab, T.; Fahad, S.; Raza, A.; Ahmad, M.; Siddiqui, M.H. Silicon-induced postponement of leaf senescence is accompanied by modulation of antioxidative defense and ion homeostasis in mustard (Brassica juncea) seedlings exposed to salinity and drought stress. Plant Physiol. Biochem. 2020, 157, 47–59. [Google Scholar] [CrossRef]
  29. Li, M.; Yang, Y.; Raza, A.; Yin, S.; Wang, H.; Zhang, Y.; Dong, J.; Wang, G.; Zhong, C.; Zhang, H.; et al. Heterologous expression of Arabidopsis thaliana rty gene in strawberry (Fragaria × ananassa Duch.) improves drought tolerance. BMC Plant Biol. 2021, 21, 57. [Google Scholar] [CrossRef]
  30. Wasaya, A.; Manzoor, S.; Yasir, T.; Sarwar, N.; Mubeen, K.; Ismail, I.; Raza, A.; Rehman, A.; Hossain, A.; EL Sabagh, A. Evaluation of Fourteen Bread Wheat (Triticum aestivum L.) Genotypes by Observing Gas Exchange Parameters, Relative Water and Chlorophyll Content, and Yield Attributes under Drought Stress. Sustainability 2021, 13, 4799. [Google Scholar] [CrossRef]
  31. Mondal, S.; Singh, R.P.; Huerta-Espino, J.; Kehel, Z.; Autrique, E. Characterization of Heat- and Drought-Stress Tolerance in High-Yielding Spring Wheat. Crop Sci. 2015, 55, 1552–1562. [Google Scholar] [CrossRef]
  32. Sukumaran, S.; Reynolds, M.P.; Sansaloni, C. Genome-Wide Association Analyses Identify QTL Hotspots for Yield and Component Traits in Durum Wheat Grown under Yield Potential, Drought, and Heat Stress Environments. Front. Plant Sci. 2018, 9, 81. [Google Scholar] [CrossRef] [Green Version]
  33. Fischer, R.A.; Maurer, R. Drought resistance in spring wheat cultivars. I. Grain yield responses. Aust. J. Agric. Res. 1978, 29, 897–912. [Google Scholar] [CrossRef]
  34. Fernandez, G.C.J. Effective Selection Criteria for Assessing PLant Stress Toerance. Adaptation of food crops to temperature and water stress. In Proceedings of the International Symposium on Adaptation of Vegetables and other Food Crops in Temperature and Water Stress, Shanhua, Taiwan, 13–16 August 1992; pp. 257–270. [Google Scholar]
  35. SAS Institute. SAS, Version 9; SAS Institute: Cary, NC, USA, 2014. [Google Scholar]
  36. R Core Team. Rstudio: Integrated Development for R; Rstudio, Pbc: Boston, MA, USA; Available online: http://www.rstudio.com (accessed on 9 September 2022).
  37. Acevedo, E.; Silva, P.; Silva, H. Wheat growth and physiology. In Bread Wheat: Improvement and Production; Curtis, B.C., Ed.; (FAO Plant Production and Protection Series No. 30); Food and agriculture organization of the United Nations: Rome, Italy, 2002; p. 567. [Google Scholar]
  38. Hakim, M.A.; Hossain, A.; Teixeira da Silva, J.A.; Zvolinsky, V.P.; Khan, M.M. Yield; protein and starch content of 20 wheat Triticum aestivum L. genotypes exposed to high temperature under late sowing conditions. J. Sci. Res. 2012, 4, 477–489. [Google Scholar] [CrossRef] [Green Version]
  39. Khan, M.A.; Tahir, A.; Khurshid, N.; Husnain, M.I.U.; Ahmed, M.; Boughanmi, H. Economic Effects of Climate Change-Induced Loss of Agricultural Production by 2050: A Case Study of Pakistan. Sustainability 2020, 12, 1216. [Google Scholar] [CrossRef] [Green Version]
  40. Aparicio, A.G.; Zuki, S.M.; Azpilicueta, M.M.; Barbero, F.Á.; Pastorino, M.J. Genetic versus environmental contributions to variation in seedling resprouting in Nothofagus obliqua. Tree Genet. Genomes 2015, 11, 23. [Google Scholar] [CrossRef]
  41. Qaseem, M.F.; Qureshi, R.; Shaheen, H. Effects of Pre-Anthesis Drought, Heat and Their Combination on the Growth, Yield and Physiology of diverse Wheat (Triticum aestivum L.) Genotypes Varying in Sensitivity to Heat and drought stress. Sci. Rep. 2019, 9, 6955. [Google Scholar] [CrossRef] [Green Version]
  42. García, G.A.; Hasan, A.K.; Puhl, L.E.; Reynolds, M.P.; Calderini, D.F.; Miralles, D.J. Grain Yield Potential Strategies in an Elite Wheat Double-Haploid Population Grown in Contrasting Environments. Crop Sci. 2013, 53, 2577–2587. [Google Scholar] [CrossRef]
  43. Kirigwi, F.M.; Van Ginkel, M.; Brown-Guedira, G.; Gill, B.S.; Paulsen, G.M.; Fritz, A.K. Markers associated with a QTL for grain yield in wheat under drought. Mol. Breed. 2007, 20, 401–413. [Google Scholar] [CrossRef]
  44. Qaseem, M.F.; Qureshi, R.; Shaheen, H.; Shafqat, N. Genome-wide association analyses for yield and yield-related traits in bread wheat (Triticum aestivum L.) under pre-anthesis combined heat and drought stress in field conditions. PLoS ONE 2019, 14, e0213407. [Google Scholar] [CrossRef] [Green Version]
  45. Sareen, S.; Tyagi, B.S.; Sarial, A.K.; Tiwari, V.; Sharma, I. Trait analysis, diversity, and genotype × environment interaction in some wheat landraces evaluated under drought and heat stress conditions. Chil. J. Agric. Res. 2014, 74, 135–142. [Google Scholar] [CrossRef] [Green Version]
  46. Fleitas, M.C.; Mondal, S.; Gerard, G.S.; Hernández-Espinosa, N.; Singh, R.P.; Crossa, J.; Guzmán, C. Identification of CIMMYT spring bread wheat germplasm maintaining superior grain yield and quality under heat-stress. J. Cereal Sci. 2020, 93, 102981. [Google Scholar] [CrossRef]
  47. Mittler, R. Abiotic stress, the field environment and stress combination. Trends Plant Sci. 2006, 11, 15–19. [Google Scholar] [CrossRef]
  48. Kro’l, A. The Growth and Water Uptake by Yellow Seed and Black Seed Rape Depending on the State of Soil Compaction. Ph.D. Thesis, Bohdan Dobrzański Institute of Agrophysics PAS, Lublin, Poland, 2013. [Google Scholar]
  49. Lobell, D.B.; Schlenker, W.; Costa-Roberts, J. Climate Trends and Global Crop Production Since. Science 2011, 333, 616–620. [Google Scholar] [CrossRef] [Green Version]
  50. Cohen, I.; Zandalinas, S.I.; Huck, C.; Fritschi, F.B.; Mittler, R. Meta-analysis of drought and heat stress combination impact on crop yield and yield components. Physiol. Plant. 2021, 171, 66–76. [Google Scholar] [CrossRef] [PubMed]
  51. Sehgal, A.; Sita, K.; Kumar, J.; Kumar, S.; Singh, S.; Siddique, K.H.; Nayyar, H. Effects of drought; heat and their interaction on the growth; yield and photosynthetic function of lentil Lens culinaris Medikus genotypes varying in heat and drought sensitivity. Front. Plant Sci. 2017, 8, 1776. [Google Scholar] [CrossRef] [PubMed] [Green Version]
  52. Liu, Z.; Qin, J.; Tian, X.; Xu, S.; Wang, Y.; Li, H.; Wang, X.; Peng, H.; Yao, Y.; Hu, Z.; et al. Global profiling of alternative splicing landscape responsive to drought; heat and their combination in wheat Triticum aestivum L. Plant Biotechnol. J. 2018, 16, 714–726. [Google Scholar] [CrossRef] [Green Version]
  53. Reynolds, M.P.; Pellegrineschi, A.; Skovmand, B. Sink-limitation to yield and biomass: A summary of some investigations in spring wheat. Ann. Appl. Biol. 2005, 146, 39–49. [Google Scholar] [CrossRef]
  54. Barnabás, B.; Jäger, K.; Fehér, A. The effect of drought and heat stress on reproductive processes in cereals. Plant Cell Environ. 2008, 31, 11–38. [Google Scholar] [CrossRef] [PubMed]
  55. Raza, A.; Charagh, S.; García-Caparrós, P.; Rahman, M.A.; Ogwugwa, V.H.; Saeed, F.; Jin, W. Melatonin-mediated temperature stress tolerance in plants. GM Crops Food 2022, 13, 196–217. [Google Scholar] [CrossRef]
  56. Reynolds, M.P.; Skovmand, B.; Trethowan, R.; Pfeiffer, W. Evaluating a Conceptual Model for Drought Tolerance in Molecular Approaches for Genetic Improvement of Cereals for Stable Production in Water-Limited Environments; Ribaut, J.-M., Poland, D., Eds.; CIMMYT: Veracruz, Mexico, 2000; pp. 49–53. [Google Scholar]
  57. Hossain, A.; da Silva, J.A.T.; Lozovskaya, M.V.; Zvolinsky, V.P. High temperature combined with drought affect rainfed spring wheat and barley in South-Eastern Russia: I. Phenology and growth. Saudi J. Biol. Sci. 2012, 19, 473–487. [Google Scholar] [CrossRef] [Green Version]
  58. Yousaf, M.I.; Maize, A.M.; Maize, W.A. Contribution of Spike-Related Traits for Grain Yield in Spring Wheat. J. Agric. Basic Sci. 2017, 2, 2710–2714. [Google Scholar]
  59. Leilah, A.; Al-Khateeb, S. Statistical analysis of wheat yield under drought conditions. J. Arid. Environ. 2005, 61, 483–496. [Google Scholar] [CrossRef]
  60. Mohammadi, R.; Farshadfar, E.; Amri, A. Path analysis of genotype × environment interactions in rainfed durum wheat. Plant Prod. Sci. 2016, 19, 43–50. [Google Scholar] [CrossRef]
  61. Lopes, M.S.; Reynolds, M.P.; Manes, Y.; Singh, R.P.; Crossa, J.; Braun, H.J. Genetic yield gains and changes in associated traits of CIMMYT spring bread wheat in a “Historic” set representing 30 years of breeding. Crop Sci. 2012, 52, 1123–1131. [Google Scholar] [CrossRef]
  62. Pandey, A.K.; Mishra, V.K.; Chand, R.; Navathe, S.; Budhlakoti, N.; Srinivasa, J.; Sharma, S.; Joshi, A.K. Crosses with spelt improve tolerance of South Asian spring wheat to spot blotch, terminal heat stress, and their combination. Sci. Rep. 2021, 11, 6017. [Google Scholar] [CrossRef]
  63. Mondal, S.; Singh, R.; Mason, E.; Huerta-Espino, J.; Autrique, E.; Joshi, A. Grain yield, adaptation and progress in breeding for early-maturing and heat-tolerant wheat lines in South Asia. Field Crop. Res. 2016, 192, 78–85. [Google Scholar] [CrossRef] [PubMed] [Green Version]
  64. Estrada-Campuzano, G.; Miralles, D.J.; Slafer, G.A. Genotypic variability and response to water stress of pre- and post-anthesis phases in triticale. Eur. J. Agron. 2008, 28, 171–177. [Google Scholar] [CrossRef]
  65. Yin, X.; Guo, W.; Spiertz, J.H. A quantitative approach to characterize sink–source relationships during grain filling in contrasting wheat genotypes. Field Crops Res. 2009, 114, 119–126. [Google Scholar] [CrossRef]
  66. Bergkamp, B.; Impa, S.; Asebedo, A.; Fritz, A.; Jagadish, S.K. Prominent winter wheat varieties response to post-flowering heat stress under controlled chambers and field based heat tents. Field Crop. Res. 2018, 222, 143–152. [Google Scholar] [CrossRef]
  67. Madani, A.; Rad, A.S.; Pazoki, A.; Nourmohammadi, G.; Zarghami, R. Wheat Triticum aestivum L grain filling and dry matter partitioning responses to source: Sink modifications under post-anthesis water and nitrogen deficiency. Acta Scientiarum. Agron. 2010, 32, 145–151. [Google Scholar]
  68. Shirdelmoghanloo, H.; Cozzolino, D.; Lohraseb, I.; Collins, N.C. Truncation of grain filling in wheat (Triticum aestivum) triggered by brief heat stress during early grain filling: Association with senescence responses and reductions in stem reserves. Funct. Plant Biol. 2016, 43, 919–930. [Google Scholar] [CrossRef]
  69. Wei, T.-M.; Chang, X.-P.; Min, D.-H.; Jing, R.-L. Analysis of Genetic Diversity and Trapping Elite Alleles for Plant Height in Drought-Tolerant Wheat Cultivars. Acta Agron. Sin. 2010, 36, 895–904. [Google Scholar] [CrossRef]
  70. Talukder, S.K.; Babar, A.; Vijayalakshmi, K.; Poland, J.; Prasad, P.V.V.; Bowden, R.; Fritz, A. Mapping QTL for the traits associated with heat tolerance in wheat (Triticum aestivum L.). BMC Genet. 2014, 15, 97. [Google Scholar] [CrossRef] [Green Version]
  71. Rehman, H.; Tariq, A.; Ashraf, I.; Ahmed, M.; Muscolo, A.; Basra, S.; Reynolds, M. Evaluation of Physiological and Morphological Traits for Improving Spring Wheat Adaptation to Terminal Heat Stress. Plants 2021, 10, 455. [Google Scholar] [CrossRef] [PubMed]
  72. Talukder, A.S.M.H.M.; McDonald, G.K.; Gill, G.S. Effect of short-term heat stress prior to flowering and at early grain set on the utilization of water-soluble carbohydrate by wheat genotypes. Field Crops Res. 2013, 147, 1–11. [Google Scholar] [CrossRef]
  73. Garg, D.; Sareen, S.; Dalal, S.; Tiwari, R.; Singh, R. Grain filling duration and temperature pattern influence on the performance of wheat genotypes under late planting. Cereal Res. Commun. 2013, 41, 500–507. [Google Scholar] [CrossRef]
  74. Mwadzingeni, L.; Shimelis, H.; Tesfay, S.; Tsilo, T.J. Screening of Bread Wheat Genotypes for Drought Tolerance Using Phenotypic and Proline Analyses. Front. Plant Sci. 2016, 7, 1276. [Google Scholar] [CrossRef] [Green Version]
  75. Griffiths, C.A.; Reynolds, M.P.; Paul, M.J. Combining yield potential and drought resilience in a spring wheat diversity panel. Food Energy Secur. 2020, 9, e241. [Google Scholar] [CrossRef] [PubMed]
  76. Cattivelli, L.; Rizza, F.; Badeck, F.-W.; Mazzucotelli, E.; Mastrangelo, A.M.; Francia, E.; Marè, C.; Tondelli, A.; Stanca, A.M. Drought tolerance improvement in crop plants: An integrated view from breeding to genomics. Field Crop. Res. 2008, 105, 1–14. [Google Scholar] [CrossRef]
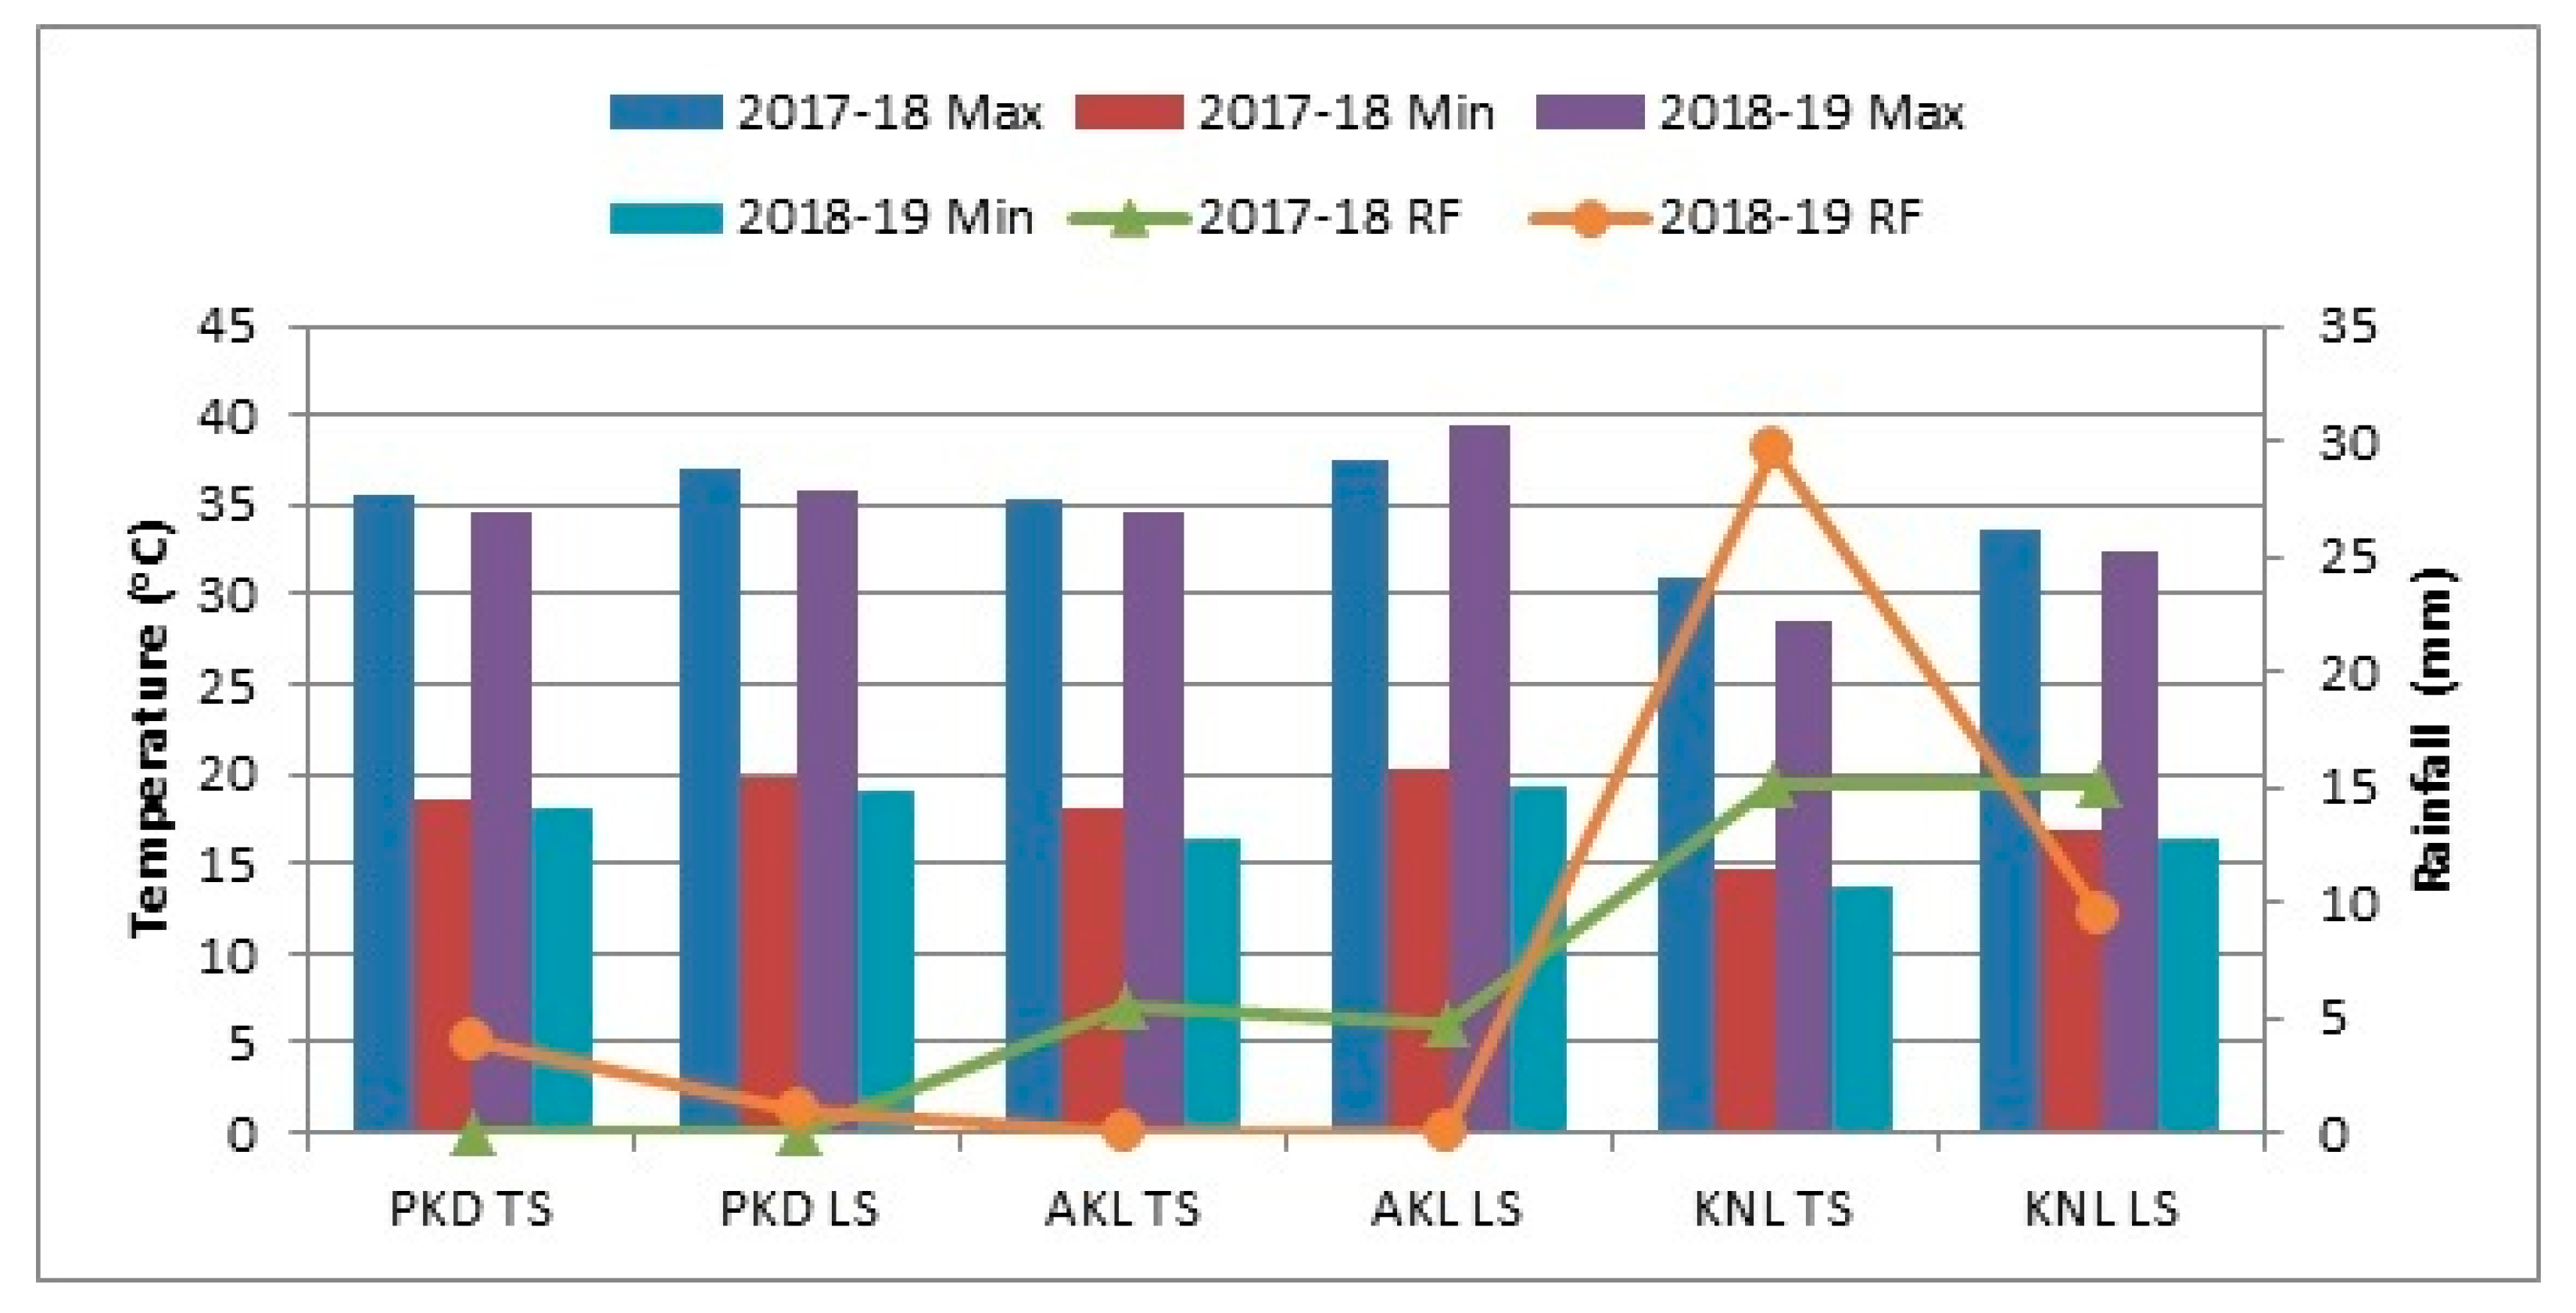
Figure 1. Average maximum (Max) and minimum (Min) temperature and total rainfall (RF) during post-heading period of timely and late sown experiments at three centres (Powarkheda = PKD, Akola = AKL, Karnal = KNL).
Agronomy 13 00891 g001
Figure 2. Reduction (%) in various traits due to drought (TSRF-DR), heat (LSIR-HT) and combined stress (LSRF-DHT). The combined stress caused maximum reduction in most of the traits as compared to individual stress.
Agronomy 13 00891 g002
Figure 3. Susceptibility index, tolerance index and reduction in grain yield under drought (TSRF-DR), heat (LSIR-HT) and combined stress (LSRF-DHT). DSI ranged from 0.04 to 1.73, HSI from 0.25 to 2.09, and DHSI from 0.48 to 1.25.
Agronomy 13 00891 g003
Figure 4. Correlation coefficients among various traits under TSIR-NS (A), TSRF-DR (B), LSIR-HT (C) and LSRF-DHT (D). Grain yield (GY) had a significant positive correlation with biomass (BM) under all conditions and BM had a significant positive correlation with plant height (PHT) and productive tillers (PTL). DH: Days to heading, DM: Days to maturity, GFD: Grain-filling duration, PHT: plant height, PTL: productive tillers, BM: biomass, GY: grain yield, HI: harvest index, SPKL: spike length, SPKLT: spikelets/spike, GN: grain number/spike, GW: grain weight/spike, TGW: 1000-grain weight. *, **, *** Significant at p < 0.05, 0.01, 0.001 respectively; empty cells represent non-significant correlation.
Agronomy 13 00891 g004
Figure 5. Principal Component Analysis Biplot for the studied traits; TSIR-NS (A), TSRF-DR (B), LSIR-HT (C) and LSRF-DHT (D). GN explained variation under all conditions, GY under stress conditions, PTL under single stress and DM under all conditions except combined stress. DH: Days to heading, DM: Days to maturity, GFD: Grain-filling duration, PHT: plant height, PTL: productive tillers, BM: biomass, GY: grain yield, HI: harvest index, SPKL: spike length, SPKLT: spikelets/spike, GN: grain number/spike, GW: grain weight/spike, TGW: 1000-grain weights.
Agronomy 13 00891 g005
Figure 6. Top ten high-yielding genotypes under TSIR-NS, LSRF-DHT, TSRF-DR and LSIR-HT. WS 2016-4 was high-yielding under all conditions, WS 2016-12, CNM 16-1, SRIL 1, RWP 2016-17 under three conditions, and DWAP 1608, ST1A, and DWAP 1610 under two conditions.
Agronomy 13 00891 g006
Table 1. Traits responsible for imparting tolerance to stress tolerant genotypes.
GenotypeStressSusceptibility IndexGrain Yield RankTrait
StressTSIR-NS
WS 2016-12TSRF-DR0.2917GFD, PTL, HI, GN, GW (Escape)
CNM 16-1TSRF-DR0.5828HI, GW
DWAP 1608TSRF-DR0.04333GFD, HI, GN, GW (Escape)
WB 2TSRF-DR0.23427DH, DM, PTL, HI, GN, GW (Escape)
ST 1ATSRF-DR0.47619DH, DM, PTL, GN, GW (Escape)
DBW 168TSRF-DR0.59921PTL, HI, GN, GW
HTW 65TSRF-DR0.521135DM, PTL, HI, GN, GW (Escape)
C 306TSRF-DR0.631332DH, DM, GFD, PTL, GN, GW (Escape)
SRIL 116TSRF-DR0.431439DH, DM, PTL, HI, (Escape)
HTW 66TSRF-DR0.593542DM, GFD, PTL, HI, GW (Escape)
WS 2016-12LSIR-HT0.5117GFD.GN (Escape)
CNM 16-1LSIR-HT0.5328PTL, TGW
WS 2016-4LSIR-HT0.6039DH, DM, (Escape)
ST 1ALSIR-HT0.25419HI, GN
HTW 67LSIR-HT0.46614HI, GN, TGW
QBP 1605LSIR-HT0.54822DH, PTL, GN, TGW (Escape)
HTW 65LSIR-HT0.35935DM, GFD, GN (Escape)
DWAP 1608LSIR-HT0.421028PTL, GN
QBP 1608LSIR-HT0.581228GFD, TGW (Escape)
QBP 1606LSIR-HT0.272540DH, (Escape)
HINDI 62LSIR-DHT0.48141PTL, HI
C 306LSIR-DHT0.73332PTL, HI, GN, GW
AKAW 3717LSIR-DHT0.85411PTL, HI,
LBP 2016-5LSIR-DHT0.80517DH, DM, GFD, HI (Escape)
WS 2016-4LSIR-DHT0.8969DH, DM, PTL, GN (Escape)
RWP 2016-10LSIR-DHT0.88916DH, DM, HI, GN, GW (Escape)
RWP 2016-18LSIR-DHT0.921012HI, GN, GW
LBP 2016-9LSIR-DHT0.871125HI, GN
QBP 1605LSIR-DHT0.921322DH, DM, PTL, GW (Escape)
QBP 1606LSIR-DHT0.842040DM, GFD, PTL, GN, GW (Escape)
Disclaimer/Publisher’s Note: The statements, opinions and data contained in all publications are solely those of the individual author(s) and contributor(s) and not of MDPI and/or the editor(s). MDPI and/or the editor(s) disclaim responsibility for any injury to people or property resulting from any ideas, methods, instructions or products referred to in the content.