Abstract
By 2022, the total area of super high-density (SHD) almond orchards worldwide had spread to 14,622 ha. As well as factors such as spacing, and tree architecture, proper row orientation should ensure a more efficient sun exposure, yield and harvesting. This research was conducted in an irrigated SHD almond orchard of cv. Lauranne® Avijor in Andria, Italy, in 2021 and 2022 (at 4th and 5th year from planting, respectively) to gain a deeper understanding on the effects of two row orientations on available Photosynthetic Active Radiation (PAR), Leaf Area Index (LAI), canopy growth, yield and harvesting efficiencies in this new planting system. The east-west row orientation in a SHD almond orchard negatively impacted LAI, canopy growth, yield, fruit quality and yield efficiencies, especially in the second year. The north-south row orientation allowed a better PAR distribution inside the whole canopy than east-west row orientation. This unevenness in PAR distribution inside the whole east-west oriented canopies could represent the driving engine of the effect on growth and yield parameters. Although some quality parameters differed between exposures, they all remained within the standard range of the cultivar. The results provide a scientific basis for improved SHD orchard management, helping to keep them as Sustainable and Efficient Systems (SES).
1. Introduction
Over the past decade, global nut production has grown steadily, reaching over 5.3 million tonnes in the 2020/2021 season. Almond (Prunus dulcis Mill. = Prunus amygdalus Batsch) is the most cultivated nut crop, representing 31% of the global share, followed by walnut and pistachio at 19%. In 2018 the global almond market revenue was enormous, with a production of 2.4 million tons, a year-on-year increase of 3.8%. The State of California is the world’s leading producer of almonds, representing 79.2% of the world production. Spain and Australia follow with around 7% each [1,2,3]. In Europe, the last 50 years have been crucial for the almond crop, changing production in terms of volume and producing countries. In the 20th century, the main almond producing countries were European countries, led by Italy and Spain. However, after the 1980s, European production declined significantly, while other countries increased their production significantly. Almond orchards continue to be converted to other crops in Italy, and the worst moment for Italian almond production was in 2013, which was 255,916 tons less than in 1961, −77.9% in 52 years, and 32,171 tons in 2000, −30.7% in 13 years. Since 2013, the situation has started to change, and production has increased by 9.7% over the past 5 years [4,5]. The traditional almond cropping system has a low density of old trees, making efficiency of inputs difficult [3,4,6,7,8]. The latest innovations in cultivation systems have been achieved by applying more than 20 years of experience in super high-density (SHD) olive groves and adapting them to almond trees [3,7,9,10,11,12]. The first SHD almond orchard was planted near Lleida (Spain) in 2010, and soon all almond growing countries started to establish SHD orchards [4,13,14]. In 2022, the global SHD almond orchard area has reached 14,622 ha, mainly planted in Spain and Portugal, followed by Italy and the USA (Iglesias et al. 2023, personal communications). This new SHD planting system, including plant material and orchard management, is also known as the “Sustainable Efficiency System” (SES) because it optimizes the use of natural resources such as soil and water and agronomic inputs such as fertilizers and chemical treatments associated with open orchards [3,7,15,16].
The choice of row orientation plays a key role in these new planting systems, improving sun exposure, affecting quantity and direction of the radiation on the canopies [17,18,19], influencing each species differently [20]. Vineyards were the first hedgerow model to be studied, from vegetative and reproductive points of view [21,22,23,24,25,26]. Some research supplied important evidence on the best row orientation, observing better results for a north-south orientation [21,27,28,29].
After vineyards, deep research was carried out on SHD olive orchards, observing a wide range of parameters [17,18,19,20,30,31,32]. Results have demonstrated that there are no differences among hedgerow orientations [17,20,33], although recent studies have negatively judged east-west orientation as worsening the status of the orchard over long periods [34,35].
Few publications have been produced on SHD almond orchards until now, giving insights on biometric characteristics [36], evaluating and improving row spacing and light interception [15,16] and comparing different cultivars [35,37,38]. Row orientation is also essential for successful production: indeed, 10% of a correct design in SHD almond orchard depends on it. Until now, only one research paper has been published on this topic, comparing different row orientations on cv. Guara Tuono [19]. Therefore, further insights are needed on other cultivars to better understand this important cultivation technique. Cv. Lauranne Avijor is now the most planted cultivar in SHD orchards, so deeper research is needed on it [39,40].
Based on previous studies, the influence of row orientation on this cultivar grown in SHD planting system is hypothesised, influencing a whole range of parameters and leading to relevant differences between east-west (EW) and north-south (NS) orientations.
The aim of this two-year field research was to gain deeper knowledge regarding the interaction of row orientation, almond tree age and available PAR on canopy growth, yield and harvesting efficiencies in this very new planting system.
2. Materials and Methods
2.1. Site and Orchard
The study was carried out during 2021 and 2022 in an irrigated Super High-Density (SHD) almond orchard, with a tree spacing of 3.8 m × 1.2 m (2,190 trees ha−1), planted in May 2018 in Andria, Italy (41°09′47″ N, 16°13′29″ E; 260 m a.s.l.). The soil, 40 cm depth, is classified as silty clay, with a pH of 7.8 and an organic matter content of 2.0%.
Cv. Lauranne® Avijor was planted grafted onto Rootpac-20®, a new patented size-controlling rootstock (Prunus besseyi × Prunus cerasifera), obtained by the Agromillora breeding program [4]. The site has a typical Mediterranean climate (Figure 1), characterized by an average annual rainfall of 565.9 mm/year; a lowest value of monthly rainfall was observed in June 2021 (0.6 mm) and May 2022 (13.0 mm), while in October 2021 and November 2022 the highest ones were observed (80.8 and 113.2 mm, respectively). The first production was obtained during 2020, while the full production was not reached yet. A hailstorm was also registered in August 2021, just before harvesting, while no other catastrophic events were registered during the period.
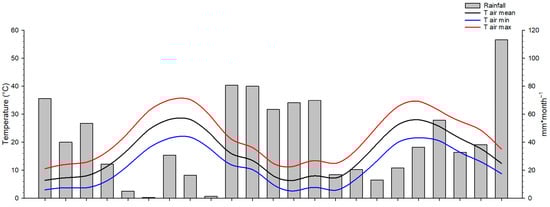
Figure 1.
Monthly rainfall and average (T air mean), minimum (T air min) and maximum (T air max) air temperatures in the almond orchard during 2021 and 2022 (Andria, Southern Italy).
The mean annual temperature is 15.3 °C, with June, July and August as the hottest months and January the coldest one. Two experimental plots of 1200 m2 each, separated by approximately 10 m, were established: one with north-south (N–S) and the other with east-west (E–W) row orientation. Each plot consisted of 5 rows, in which the 3 central rows were taken as the sampling area.
2.2. Cultural Practices
The orchard management was performed through the best common practices diffused in the area, following the integrated farming method. Drip lines, suspended at 0.7 m over the soil, were used, and seasonal average volumes of irrigation of approximately 5000 m3 ha−1 were applied as the mean. Every year, after harvesting, mechanical topping, hedging and trimming were carried out to control canopy growth. The harvest was operated by a continuous over-the-row harvester machine (Grégoire G167).
2.3. PAR and LAI Assessment
Measurements were recorded during 2021 and 2022 seasons with trees in the 4th and 5th leaf, respectively. Photosynthetic Active Radiation (PAR) above the canopy in full light (PAR-A, µmol m−2 s−1), inside the canopy (PAR-B, µmol m−2 s−1) and Leaf Area Index (LAI m2 m−2) were measured using a ceptometer (AccuPAR LP-80, METER Group, Inc., Pullman, WA, USA). Ten representative almond trees per row were randomly selected, and each one was also divided into two different layers: low (L; 0.5–1.4 m) and top (T; 1.4–2.3 m). PAR and LAI measurements were taken at midday in the middle part of each layer, at hull split fully completed (85 of BBCH scale [41]) when they reached the maximum values (seasonal data not shown): DOY (Day Of Year) 225 for 13 August 2021 and DOY 229 for 17 August 2022. To express the shading effect of row orientation, for each layer, available PAR (AP) was then calculated as:
AP = PAR B/PAR A
2.4. Canopy Growth Parameters
Canopy growth parameters were measured before pruning for fifty trees per row, on three different dates (July 2021, January 2022, June 2022): tree height (TH, cm), tree width (TT, cm) and trunk diameter (TD, cm). Trunk cross-sectional area (TCSA, cm2) was calculated as:
TCSA = п (TD2)/4
Canopy volume (CV, m3) was calculated considering the canopy as a parallelepiped shape, with 0.4 m subtracted to TH, representing the distance of the first branches from the ground:
CV = (TH − 0.4) × TW × 1.2
2.5. Yield and Efficiency Parameters
At harvesting time (85 BBCH stage [41]), hulled fruit yield (FY, g) and fruit number (FN, n) were recorded on five homogeneous, healthy trees per each row; hulled fruit average weight (AW, g) was calculated as
AW = FY/FN
Polar gauge (PG, mm) was measured on ten fruits per sample; shelling percentage (SP, %), hull-tight nuts (HT, %) and double seeds (DS, %) were calculated on all the fruits harvested. Yield efficiency on trunk cross-sectional area (YET, g cm−2) was calculated as:
YET = FY/TCSA
Yield efficiency on canopy volume (YEV, kg m−3) was calculated as:
YEV = FY/CV
Finally, mechanical harvesting efficiency (HE, %) was calculated as:
where PF is pending fruits (n) and FF fallen fruits (n), calculated on ten trees per row.
HE = 100% − [100 (PF + FF)]/FY
2.6. Data Analysis
The main factor of variance studied has been row orientation and how it affects the different parameters listed previously: PAR, LAI, yield, fruit quality, etc. The field data collected were analysed by one and two-way analysis of variance (ANOVA), followed by post hoc testing (SNK protected test) using the R 2.15.0 software (R Foundation for Statistical Computing); standard error (SE) was also reported. In the Supplementary file the interaction effects are shown.
3. Results
3.1. Available PAR and LAI
At hull split fully completed (85 of BBCH scale), the mean values of the PAR-A in 2021 (DOY 225) and in 2022 (DOY 229) were substantially the same, with 1880 µmol m−2 s−1 and 1896 µmol m−2 s−1, respectively.
No significant differences were found in 2021 (Table 1) for PAR-B among different expositions, while differences were observed among layers. In layer L, PAR-B was significantly higher in the W exposition (508.2 µmol m−2 s−1) than in the others (403.9, 441.4 and 455.9 µmol m−2 s−1 for E, N and S, respectively) (Table 1). The same was observed for layer T, in which W exposition showed the highest values (1299.8 µmol m−2 s−1) followed by E, S and N (1171.5, 1046.6 and 1013.5 µmol m−2 s−1 respectively) (Table 1). In 2022 (Table 1), it was significantly higher in the S (1268.1 µmol m−2 s−1) than in the other three expositions (765.4, 889.2 and 839.5 µmol m−2 s−1 for N, E and W, respectively). Comparing the same layers for different expositions, mean values of S exposition (1234.9 µmol m−2 s−1 in layer L and 1301.3 µmol m−2 s−1 in layer T) were significantly higher than the others (Table 1). Comparing different layers of the same exposition, no differences were found among the L and T layers in the N and S expositions, while there were significant differences in the W and E expositions for layer T (1030.0 and 1046.8 µmol m−2 s−1 for WT and ET, respectively), significantly higher than layer L (649.1 and 731.5 µmol m−2 s−1 for WL and EL respectively) (Table 1). A weak interaction expositions x layers was found for 2021, while a stronger one was found for 2022 (Table S1).

Table 1.
PAR inside the canopy of almond trees (µmol m−2 s−1) at DOY 225 for year 2021 and DOY 229 for 2022, in different expositions (E, W, S, N: East, West, North, South) into two different layers: low (L; 0.5–1.4 m) and top (T; 1.4–2.3 m). The first letters denote statistical differences among row expositions; the second letters denote statistical differences between layers (p = 0.05; SNK test).
LAI values varied slightly between the two research years, with a mean value of around 2. In 2021 LAI (Table 2) showed differences among expositions and layers. No statistical differences of mean values were found among the four different expositions. Layer L for the W and E expositions (2.9 and 3.1 respectively) showed LAI significantly higher than layer L and N (2.4 and 2.3, respectively) (Table 2). For layer T, W and E expositions (1.0 and 1.1, respectively) were significantly lower than N and S (1.5 and 1.5, respectively) (Table 2). Statistical differences were found for the four expositions between layers, with higher values for layer L than for layer T. LAI is statistically comparable in the W, E and N expositions in 2022, (1.9, 2.0 and 2.1, as mean) while it is significantly lower in the S exposition (1.2) (Table 2). Comparing the same layer in different expositions, we observed differences for the S exposition for the L (1.3) and T (1.0) layers, which presented a LAI significantly lower than the L and T layers in the other three expositions. Finally, comparing different layers in the same exposition, LAI seems to decrease from layer L to layer T in all the expositions. LAI showed differences among expositions and layers. No statistical differences of mean values were found among the four different expositions. Layer L for the W and E expositions (2.9 and 3.1, respectively) showed LAI significantly higher than layers for the S and N (2.4 and 2.3, respectively). For layer T, LAI values in the W and E expositions (1.0 and 1.1) were significantly lower than N and S (1.5 and 1.5, respectively). Statistical differences were found for the four expositions between layers, with higher values for layer L than for layer T. The expositions x layers showed a strong interaction in both years (Table S1).
Table 2.
LAI (m2 m−2) at DOYs 225 and 229, for years 2021 and 2022, respectively, in different expositions (E, W, S, N) for different layers: low (L; 0.5–1.4 m) and top (T; 1.4–2.3 m). The first letters denote statistical differences among row orientations; the second letters denote statistical differences between layers (p = 0.05; SNK test).
3.2. Canopy Growth
The mean values of TH (Figure 2) in the N–S row orientation (216.9 cm, 190.0 cm, 264.3 cm), were significantly higher than E–W (200.3 cm, 180.0 cm, 227.6 cm). The mean values of TW in the N–S row orientation (125.0 cm, 100.0 cm, 114.3 cm) were significantly higher than E–W (111.3 cm, 80.0 cm, 96.4 cm) (Figure 3).
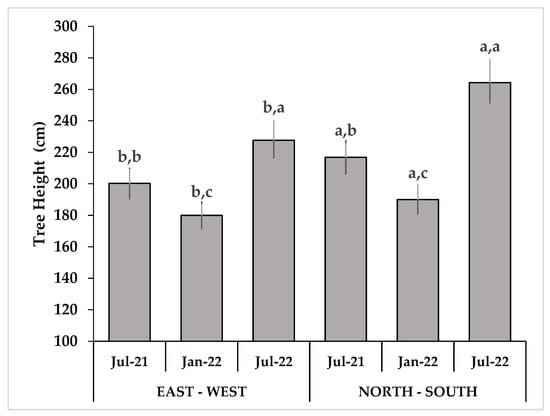
Figure 2.
Tree height (cm) values in E–W and N–S orientations of a SHD almond orchard in 2021 and 2022. First letters denote statistical differences between row orientations; second letters denote statistical differences among different moments of observations (p = 0.05; SNK test).
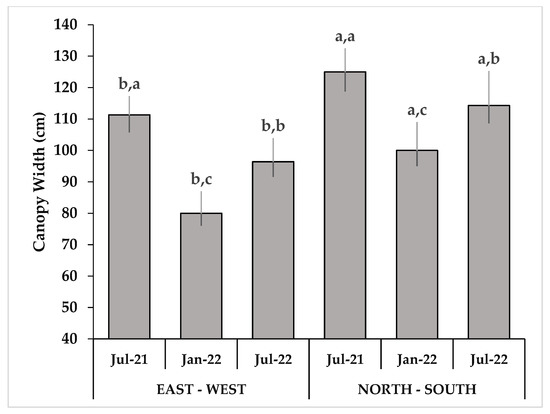
Figure 3.
Tree width (cm) values in E–W and N–S orientations of a SHD almond orchard. First letters denote statistical differences between different row orientations; second letters denote statistical differences among different moments of observations (p = 0.05; SNK test).
Both the TH and TW mean values were significantly lower in Jan-22 (190.0 cm and 180.0 cm for TH and 100.0 cm and 80.0 cm for TW, respectively, for N–S and E–W) because of topping and hedging operations. TCSA and CV followed the trend of data previously analysed. Both were significantly higher, on all three dates, in the N–S (Figure 4 and Figure 5). Strong interactions of year x orientation were found for TH and TCSA, while weaker interaction and no interaction were found for TT and VC, respectively (Table S2).
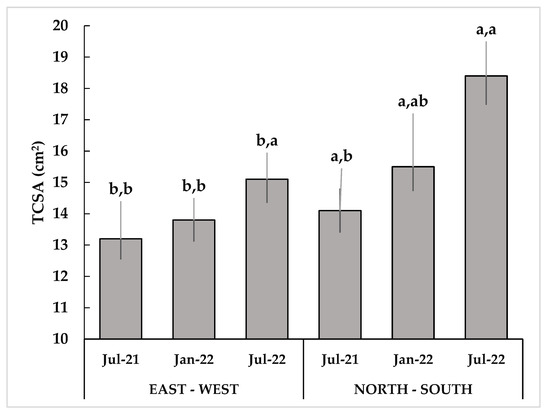
Figure 4.
Trunk cross-sectional area (TCSA; cm2) values in E–W and N–S orientations of a SHD almond orchard. First letters denote statistical differences between different row orientations; second letters denote statistical differences among times (p = 0.05; SNK test).
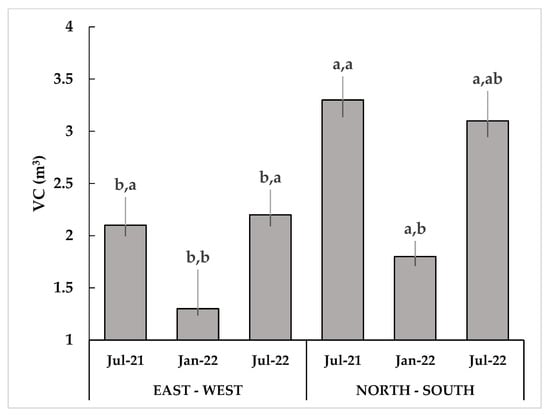
Figure 5.
Canopy volume (CV; m3) values in E–W and N–S orientations of a SHD almond orchard. First letters denote statistical differences between different row orientations; second letters denote statistical differences among different moments of observations (p = 0.05; SNK test).
3.3. Yield and Efficiencies
In 2021, FY (Table 3) in all the expositions was significantly higher in layer L (361.4, 352.1, 382.1, 260.0 g for E, N, S, W, respectively) than in layer T (143.6, 236.2, 258.1, 100.8 g for E, N, S, W, respectively) (Table 3). In 2022 (Table 3), no differences were found for FY among the different layers for the four expositions. Only in the E exposition was FY in layer L (433.6 g) significantly higher than in layer T (287.3 g). Statistical differences were also found for FY between years (Table 3). In 2021 (Table 3), FY for expositions S (320.1 g) and N (285.9) were significantly higher than E (239.4 g) and W (180.4 g). In 2022 (Table 3), situation was clearly different. FY in the E (369.2 g) and W (310.9 g) expositions were significantly higher than in the N (247.6 g) and S (218.3 g). No statistical difference between the two years was found (260.0 and 285.1 g for 2021 and 2022, respectively) (Table 3). Significant differences were found between layers.
Table 3.
Hulled fruit yield of almonds for each layer (g) in 2021 and 2022 in different expositions (E, W, S, N) for different layers: low (L; 0.5–1.4 m) and top (T; 1.4–2.3 m). The first letters denote statistical differences between years for an exposition and a layer; the second letters denote statistical differences among expositions for a year and a layer; the third letters denote statistical differences between layers for a year and an exposition (p = 0.05; SNK test).
Statistical differences were found for the FN parameter between the four expositions during the two years of study. In 2021 (Table 4), FN for N (119.9) and S (125.1) was significantly higher than for E (72.4) and W (55.3) expositions. As we observed for the FY data, in 2022 a clear change of trend was registered. In 2022, FN values (Table 4) in E (111.9), W (91.8) and N (98.2) expositions were significantly higher than FN in the S (81.8) exposition. There were not any significant statistical differences among the FN mean values of 2021 and 2022 (Table 4). In 2021, in all the expositions, FN was significantly higher in layer L (108.6, 151.3, 151.1 and 78.2 for E, N, S and W, respectively) than in layer T (43.9, 96.5, 99.2 and 32.4 for E, N, S and W, respectively). There were significant differences of FN among layers only in the E exposition. FN in layer L (135.2) was significantly higher than in layer T (82.4). Strong interactions of year x exposition, year x layer and exposition x layer were found for FY. Weaker interaction was found only for the exposition x layer for FN (Table S3).
Table 4.
Fruit number (n) in 2021 in different expositions (E, W, S, N) for different layers: low (L; 0.5–1.4 m) and top (T; 1.4–2.3 m). The first letters denote statistical differences between different years for an exposition and a layer; the second letters denote statistical differences between different expositions for a year and a layer; the third letters denote statistical differences among different layers for a year and an exposition (p = 0.05; SNK test).
In 2021, AW was significantly higher in E (3.2 g) and W (3.2 g) expositions than in N (2.5 g) and S (2.6 g) (Table 5). In 2022, this data trend was confirmed, with AW higher in E and W (3.4 and 3.5 g, respectively) than in N and S (2.7 and 2.76 g, respectively) (Table 5). PG was statistically higher in 2022 (35.4 mm) than in 2021 (30.0 mm). No Statistical differences were found in 2021 for PG among different expositions. Among the expositions, in 2022, PG was statistically higher in E (36.9 mm) and W (37.2 mm) than in N (33.6 mm) and S (34.1 mm). SP mean value in 2021 (34.3%) was significantly higher than in 2022 (30.3%) (Table 5). The same relation was observed for every exposition. In 2021, SP was the highest in S (35.2%) and the lowest in E and W (33.4 and 33.6%, respectively) (Table 5). In 2022, no statistical differences were found among the different expositions. No statistical differences were found for HT in the two years of study (2021 and 2022). In 2021, HT value in the N (4.3%) exposition was significantly higher than in the other three expositions. In 2022, no significant differences were observed among different expositions. In 2021, DK mean value was significantly higher (3.2%) than in 2022 (2.1%) (Table 5). In 2021, N and S (4.9 and 3.5% respectively) expositions showed statistically higher DK values than in E and W (1.8 and 2.4%, respectively) (Table 5). DK values did not vary among the different expositions. The exposition x year interaction was strong for PG, HT and DK, while no significance was found for AW and SP (Table S4).
Table 5.
Almonds’ quality parameters for 2021 and 2022 in different expositions (E, W, S, N). The first letters denote statistical differences between years for an exposition; second letters denote statistical differences among expositions for a year (p = 0.05; SNK test).
YET was significantly higher in 2021 (78.4 g cm−2) than in 2022 (55.4 g cm−2) (Table 6). Considering the differences observed among two different row orientations, we could affirm that the mean value of the E–W (70.4 g cm−2) orientation is significantly higher than the N–S (63.6 g cm−2) (Table 6). No statistical difference was found between mean values for YEV. E–W showed higher values than N–S (0.4 and 0.3 kg m−3, respectively) (Table 6). In addition, the mean of 2021 (0.4 kg m−3) was significantly higher than in 2022 (0.3 kg m−3). For both years, N–S orientation showed higher YEV values (2021, 0.4 kg m−3; 2022, 0.4 kg m−3) than E–W (2021, 0.4 kg m−3; 2022, 0.2 kg m−3) (Table 6). No significant interactions were found between year and orientation for the two efficiencies (Table S5).
Table 6.
Yield and harvesting efficiencies for 2021 and 2022, in E–W and N–S row orientations. The first letters denote statistical differences among years for an orientation; the second letters denote statistical differences between orientations for a year (p = 0.05; SNK test).
PF mean values were significantly higher in 2022 (4.6) than in 2021 (0.7) (Table 6). The same relation was observed for the orientations, in which E–W and N–S of 2022 (5.6 and 3.7%, respectively) were statistically higher than the E–W and N–S of 2021 (1.0 and 0.36%, respectively) (Table 6). No differences were found between orientations in 2021, while, in 2022 E–W showed the highest value (5.6%). FF mean values were significantly higher in 2021 (2.4 and 4.43% for E–W and N–S, respectively) than in 2022 (0.45 and 0.76% for E–W and N–S, respectively). N–S showed higher values than E–W for 2021 (4.4 and 2.4%, respectively), while no differences were found in 2022. No statistical differences were found for HE between orientations and years, obtaining results always close to 95%. A relevant difference was found for the E–W orientation between the two years, with higher values in 2021 (96.58% vs. 93.97%, respectively) (Table 6).
4. Discussion
Due to the scarcity in the bibliography regarding the effects of row orientation in almond SHD orchard, we also compared our results with studies performed on olive SHD orchards, vineyards and other deciduous species.
Optimal PAR interception is one of the features required in a SHD orchard and solar radiation has a key role in flower bud differentiation, as reported for olive, acting via photosynthesis in the availability of assimilate for bud induction and flowering [17]. It is crucial to not allow shaded areas in the canopy, to avoid less efficiently involved areas in the photosynthesis process [42]. On the other hand, net photosynthesis rises with PAR up until light saturation, after that extra photosynthetic photon flux density does not promote carboxylation, rendering around half of the available light excessive [43]. The saturation point for almond cultivars should be fixed around 1300 µmol m−2 s−1 as the average [43]. Moreover, for maximum productivity, all the foliage must be illuminated in a threshold range between 20% and 30% of incident radiation, especially for the critical phase of fruit growth and ripening [44]. At this stage, both row orientations received equal quantities of PAR above the canopy (between 1880 and 1896 µmol m−2 s−1 as mean, for 2021 and 2022, respectively), thus allowing non-limiting light saturation external conditions, as expected. In all expositions, in both layers and for both years, the available PAR values were always over the threshold range of 20–30% of the incident radiation. This is due to the limited/controlled volume of the canopy compared with other training systems, such as open vase. Even if the trees worked at non-limiting light saturation internal conditions, N–S row orientation allowed the same PAR distribution between the E and W sides, with a mean of 37% and 55% for L and T layers, respectively (Figure 6). On the contrary, the E–W row orientation lead to a strong asymmetry in available PAR values between the N and S sides. Indeed, while S exposition presented the maximum available PAR values (65% and 70% for the L and T layers, respectively), N exposition showed the minimum ones (29% and 52% for the L and T layers, respectively). This unevenness in PAR distribution inside the whole E–W oriented canopies could represent the driving engine of the effect on growth and yield parameters. The same results were found in almond, for cv. Guara Tuono [19], and in olive [33].
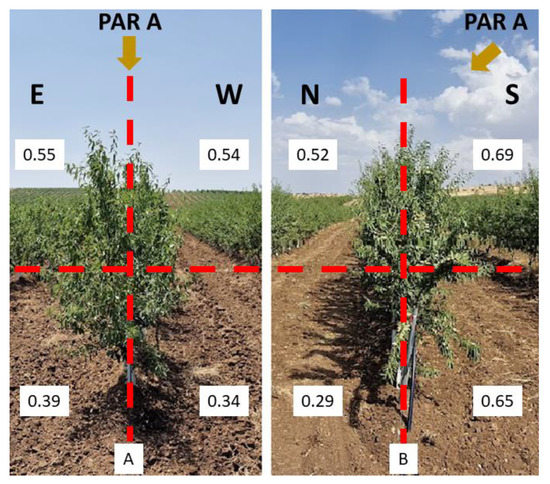
Figure 6.
Available PAR (% of incident PAR) at DOY 229 for year 2022, in different expositions (E, W, S, N) into two different layers: low (L; 0.5–1.4 m) and top (T; 1.4–2.3 m). (A): hedgerows N–S oriented; (B): hedgerows E–W oriented.
Thus, in these conditions, LAI variations represent the first consequence. LAI showed a general decline from layer L to layer T in all the expositions. These data are in line with previous studies [15,19]. LAI was higher in N–S row orientation in the bottom part of the canopy for both years; in the E–W row orientation, LAI was highest at the 4th year in the top of the canopy, but it was the worst in the following year. The row orientation effect on LAI parameter decrease when latitude increases: if at 55° latitude N LAI is highest with N–S orientation during the summer months and with E–W orientations for the rest of the year, at 41° it is very similar [45].
All canopy growth parameters observed in the N–S row orientation were significantly higher than E–W. TH showed between 5 and 14% higher values (Figure 2); an even higher difference was found for TW (11–20%) (Figure 3) and, consequently, for CV (27–36%). TCSA values increased by 28% and 15% for N–S and E–W orientations, respectively (Figure 5). No comparison can be performed with other SHD almond orchards, but in a previous work [19], it was hypothesized that, for the E–W orientation, the more available PAR on the S side could lead to over-excitation of chlorophyll, leading to the production of reactive oxygen species (ROS), increasing the risk of photo-inhibition (i.e., photo-damage) [46]. Through direct and indirect impacts on cell structure, radiation can seriously harm almond trees, resulting in a drop in chlorophyll content and photosynthetic rate [33,47,48,49]. In olive tree, contrarily, no significant differences for tree height, tree width or trunk diameter of the canopy were found in different row orientations [17]. Canopy size in January 2022 decreased by 10% for both row orientations (Figure 3), due to hedging and topping operations, made in order to restrain the canopy at the optimal size required by SHD orchards [19], and to adapt it to the harvester machine: indeed, canopy dimensions must not exceed 0.7–0.8 m in width and 2.75 m in height [36].
A gradual yield increase in terms of hulled almonds in the N–S orientation (from 1890 to 2930 kg ha−1) and a sharp decrease in the E–W orientation (from 2680 to 2190 kg ha−1) were observed, moving from the 4th to the 5th year. According to Trentacoste et al. [17] in an olive orchard, rows with N–S orientation are the most common and are promoted because the two expositions intercept the same quantity of solar irradiation, in both sunny and cloudy conditions. For this reason, they produced more. Moreover, according to Tous et al. [49], in an SHD olive orchard with E–W rows orientation, a 40% lower average production was observed compared with N–S. In almond SHD orchards, at the 4th year from planting (2021), an opposite trend was observed, with a higher yield for N and S expositions (E–W orientation) (Table 3). These data appeared anomalous and in disagreement with the ones found for cv. Guara Tuono [19]. As for biometric parameters, light distribution could have influenced more N–S bud induction. This could be related to the biological phase of the orchard; rows with E–W orientation seemed to undergo a strong exit from the unproductive phase, with a greater production of fruits. The situation changed in 2022 (5th year from planting), with significantly higher values of FY in the N–S orientation (Table 3). Therefore, in the N–S row orientation, a gradual rise was observed, while, in the E–W a sharp decrease was detected. These results are in line with the one in the bibliography, in which N–S orientation trees produced 15% higher FY than E–W [19]. However, FY values are lower than reported [38], because of the younger age of the orchard. Moreover, fruit number seemed to follow production trend, as for previous research [19]. FN was higher in the E–W orientation in 2021 and in N–S orientation in 2022 (Table 4).
Average almond weight values were significantly higher in both years and in E and W expositions (N–S orientation) (Table 5). These data were strictly related to FY and FN and, for this, lower FN values in 2021 offset low FY values. These results are not in line with a previous study on cv. Guara, in which AW showed no differences among expositions [19]. The polar gauge of fruits was significantly higher in the N–S orientation for 2022 and, in general, was not significant in previous year (Table 5). These results are in contrast with a previous study, in which higher values were observed in the E–W orientation [19]. According to our study, shelling percentage was influenced by row orientation in 2021, with the highest mean value in E–W orientation, while in 2022 no significant differences were found among the four expositions (Table 5). These results are in contrast with a previous study, in which N and S expositions (E–W orientation) showed the higher SP. All these different behaviours could be related to the varietal and age effect [19]. However, cv. Lauranne SP mean values ranged around 30–37%, 38%, in line with another study on SHD almond orchards [38] and with other cropping systems [50,51,52]. As with SP, hull tight nut percentage seemed not to be influenced by row orientation in 2022, but in 2021 this parameter is significantly higher in the E–W orientation, with an average percentage of 2.5% (Table 5). Double kernel data strongly direct production to certain types of market, excluding it from others. In two years, an average percentage of double kernels close to 2.5% was observed. Hull tight nuts and double kernel parameters are strongly influenced by genotype and the external factors of the cultivated area [50,53,54,55,56]. Furthermore, double kernel percentage mean values always ranged in the varietal standard interval (0–10%) [50,51,56], with the same trends of SP and HT.
Yield efficiencies were also higher in N–S orientation in the 5th year, while no differences were detected in the previous year (Table 6). These results are strictly dependent on canopy growth, as in previous research, in which, during the second year, a severe pruning was made to reduce the cv. Lauranne canopy [38]. Greater sizes of the canopy in 2021 led to no differences, while after pruning, the higher yield of the N–S oriented almond trees gave significantly higher efficiency values in the subsequent year (Table 6).
A mechanical harvesting efficiency higher than 95% was found over the years and between the orientations. The goal is to have values as close as possible to 100%, with values higher than 90% as acceptable [57,58,59,60,61,62]. No statistical differences were found for this parameter between row orientations in both years. Differences were found in 2021, in which fallen fruits were significantly higher than pending fruits, for both row orientations, due to some meteoric events, such as a hailstorm that hit the area (Table 6, Figure 1). Meteoric events can cause a strong reduction in production [63] and are a limiting factor for all harvest systems, except when almonds are picked up from the ground. In 2022, however, an opposite trend was found for the delayed harvesting time due to the forecast of an adverse meteoric event, causing the non–detachment of some fruits (12%).
5. Conclusions
The E–W row orientation in an SHD almond orchard negatively impacted LAI, canopy growth, yield, some fruit quality traits and yield efficiencies. The N–S row orientation allowed a better PAR distribution inside the whole canopy, while the E–W row orientation caused important shading for the N exposition. Although some quality parameters differed between exposures, they all remained within the standard range of the cultivar. No mechanical harvesting efficiency was affected by row orientation. The results of this research provide a scientific basis for improved SHD orchard management, helping to keep them as Sustainable and Efficient Systems. To further improve this almond production, more long-term research is needed to evaluate the influence of cultivar (branching habit), tree age (mature trees), canopy management (pruning options), climate and soil. Additional information regarding seasonal and daily available PAR, ecophysiological response and canopy architecture are required to continually improve almond production in an increasingly sustainable and efficient manner.
Supplementary Materials
The following supporting information can be downloaded at: https://www.mdpi.com/article/10.3390/agronomy13030874/s1, Table S1: Effects of the exposition, layer and its interactions on the photosynthetic active radiation (PAR) and leaf area index (LAI) for 2021 and 2022; Table S2: Effects of the orientation, year and its interactions on the tree height (TH), tree thickness (TT), trunk cross-sectional area (TCSA) and canopy volume (VC); Table S3: Effects of the year, exposition, and layer and its interactions on the fruit yield (FY) and number (FN); Table S4: Effects of the year, exposition and its interactions on the average weight (AW), polar gauge (PG), shelling percentage (SP), hull-tight-nuts (HT), and double kernels (DK); Table S5: Effects of the year, exposition and its interactions on the efficiency on the trunk cross-sectional area (ET) and canopy volume (VC).
Author Contributions
Conceptualization, S.C. and F.M.; methodology, S.C.; software, G.A.V.; validation, S.C. and I.I.C.; data curation, V.C. and F.M.; writing—original draft preparation, V.C. and F.M.; writing—review and editing, S.C., G.A.V. and I.I.C.; supervision, S.C. All authors have read and agreed to the published version of the manuscript.
Funding
This research received no external funding.
Data Availability Statement
The data that support the findings of this study are available from the corresponding authors upon reasonable request.
Acknowledgments
We would like to thank the “Azienda Agricola Alfonso Di Pietro” in Andria for availability of almond orchards and logistic support.
Conflicts of Interest
The authors declare no conflict of interest.
References
- Food and Agriculture Organization of the United Nations—FAOSTAT. Available online: http://www.fao.org/faostat/en/#home (accessed on 30 December 2022).
- Global Almond Market 2019—After Five Years of Robust Growth of In-Shell Nut Imports, India Emerges at the Most Promising Market. Available online: https://www.globaltrademag.com/global-almond-market-2019-after-five-years-of-robust-growth-of-in-shell-nut-imports-india-emerges-as-the-most-promising-market/ (accessed on 30 December 2022).
- Iglesias, I.; Torrents, J. Developing high-density training systems in Prunus tree species for an efficient and sustainable production. Acta Hortic. 2022, 1346, 219–228. [Google Scholar] [CrossRef]
- Iglesias, I.; Foles, P.; Oliveira, C. El almendro en España y Portugal: Situación, innovación tecnológica, costes, rentabilidad y perspectivas. Rev. De Frutic. 2021, 81, 6–49. [Google Scholar]
- Fadón, E.; Herrera, S.; Guerrero, B.I.; Guerra, M.E.; Rodrigo, J. Chilling and Heat Requirements of Temperate Stone Fruit Trees (Prunus spp.). Agronomy 2020, 10, 409. [Google Scholar] [CrossRef]
- Iglesias, I. Costes de producción, sistemas de formación y mecanización en frutales, con especial referencia al melocotonero. Rev. De Frutic. 2019, 69, 50–59. [Google Scholar]
- Iglesias, I. Sistemas de plantación 2D. Una novedad en almendro, una realidad en frutales. Hacia una alta eficiencia. Rev. Frutic. 2019, 67, 22–44. [Google Scholar]
- Iglesias, I.; Echeverría, G. Current situation, trends and challenges for efficient and sustainable peach production. Sci. Hortic. 2022, 296, 110899. [Google Scholar] [CrossRef]
- Expósito, A.; Berbel, J. The Economics of Irrigation in Almond Orchards. Application to Southern Spain. Agronomy 2020, 10, 796. [Google Scholar] [CrossRef]
- Camposeo, S.; Palasciano, M.; Vivaldi, G.A.; Godini, A. Effect of increasing climatic water deficit on some leaf and stomatal parameters of wild and cultivated almonds under Mediterranean conditions. Sci. Hortic. 2011, 127, 234–241. [Google Scholar] [CrossRef]
- Caruso, T.; Campisi, G.; Marra, F.P.; Camposeo, S.; Vivaldi, G.A.; Proietti, P.; Nasini, L. Growth and yields of the cultivar Arbequina in high density planting systems in three different olive growing areas in Italy. Acta Hortic. 2014, 1057, 341–348. [Google Scholar] [CrossRef]
- Pellegrini, G.; Ingrao, C.; Camposeo, S.; Tricase, C.; Contò, F.; Huisingh, D. Application of Water Footprint to olive growing systems in the Apulia region: A comparative assessment. J. Clean. Prod. 2016, 112, 2407–2418. [Google Scholar] [CrossRef]
- Roca, J.M.; Gòmez, J.M.; Lòpez, M. El almendro en seto SHD. La recolecciòn con màquinas cabalgantes. Olint 2014, 25, 35–45. [Google Scholar]
- Rodas, A. SHD en el mundo. Paìses con presencia de plantaciones en sistema superintensivo de almendro. Olint 2015, 28, 24–25. [Google Scholar]
- Casanova-Gascòn, J.; Figueras-Panillo, M.; Iglesias-Castellarnau, J.; Martin-Ramos, P. Comparison of SHD and Open-Center Training Systems in Almond Tree Orchards cv. “Soleta”. Agronomy 2019, 9, 874. [Google Scholar] [CrossRef]
- Iglesias, I.; Torrents, J. Diseño de nuevas plantaciones adaptadas a la mecanización en frutales. Horticulturae 2020, 346, 60–67. [Google Scholar]
- Trentacoste, E.R.; Connor, D.J.; Goméz-del-Campo, M. Effect of olive hedgerow orientation on vegetative growth, fruit characteristics and productivity. Sci. Hortic. 2015, 192, 60–69. [Google Scholar] [CrossRef]
- Trentacoste, E.R.; Connor, D.J.; Goméz-del-Campo, M. Effect of row spacing on vegetative structure, fruit characteristics and oil productivity of N-S and E-W oriented olive hedgerows. Sci. Hortic. 2015, 193, 240–248. [Google Scholar] [CrossRef]
- Maldera, F.; Vivaldi, G.A.; Iglesias-Castellarnau, I.; Camposeo, S. Row Orientation and Canopy Position Affect Bud Differentiation, Leaf Area Index and Some Agronomical Traits of a Super High-Density Almond Orchard. Agronomy 2021, 11, 251. [Google Scholar] [CrossRef]
- Trentacoste, E.R.; Moreno-Alìas, I.; Goméz-del-Campo, M.; Beyà-Marshall, V.; Rapoport, H.F. Olive floral development in different hedgerow positions and orientations as affected by irradiance. Sci. Hortic. 2017, 225, 226–234. [Google Scholar] [CrossRef]
- Hunter, J.J.; Volschenk, C.G.; Booyse, M. Vineyard row orientation and grape ripeness level effects on vegetative and reproductive growth characteristics of Vitis vinifera L. cv. Shiraz/101-14 Mgt. Eur. J. Agron. 2017, 84, 47–57. [Google Scholar] [CrossRef]
- Grifoni, D.; Carreras, G.; Zipoli, G.; Sabatini, F.; Dalla Marta, A.; Orlandini, S. Row orientation effect on UV-B, UV-A and PAR solar irradiation components in vineyards at Tuscany, Italy. Int. J. Biometeorol. 2008, 52, 755–763. [Google Scholar] [CrossRef]
- Hunter, J.J.; Volschenk, C.G.; Mania, E.; Castro, A.V.; Booyse, M.; Guidoni, S.; Pisciotta, A.; Di Lorenzo, R.; Novello, V.; Zorer, R. Grapevine row orientation mediated temporal and cumulative microclimatic effects on grape berry temperature and composition. Agric. For. Meteorol. 2021, 310, 108660. [Google Scholar] [CrossRef]
- Strack, T.; Schmidt, D.; Stoll, M. Impact of steep slope management system and row orientation on canopy microclimate. Comparing terraces to downslope vineyards. Agric. For. Meteorol. 2021, 307, 108515. [Google Scholar] [CrossRef]
- Strack, T.; Stoll, M. Implication of row orientation changes on fruit parameters of Vitis vinifera L. cv. Riesling in steep slope vineyards. Foods 2021, 10, 2682. [Google Scholar] [CrossRef] [PubMed]
- Wang, Z.; Yin, H.; Yang, N.; Cao, J.; Wang, J.; Wang, X.; Xi, Z. Effect of vineyard row orientation on microclimate, phenolic compounds, individual anthocyanins, and free volatile compounds of Cabernet Sauvignon (Vitis vinifera L.) in a high-altitude arid valley. Eur. Food Res. Technol. 2022, 248, 1365–1378. [Google Scholar] [CrossRef]
- Giacosa, S.; Marengo, F.; Guidoni, S.; Rolle, L.; Hunter, J.J. Anthocyanin Yield and skin softening during maceration, as affected by vineyard row orientation and grape ripeness of Vitis vinifera. Food Chem. 2015, 174, 8–15. [Google Scholar] [CrossRef] [PubMed]
- Hunter, J.J.; Volschenk, C.G.; Zorer, R. Vineyard row orientation of Vitis vinifera L. cv. Shiraz/101-14 Mgt: Climatic profiles and vine physiological status. Agric. For. Meteorol. 2016, 228–229, 104–119. [Google Scholar] [CrossRef]
- Gutiérrez-Gamboa, G.; Zheng, W.; Martinez de Toda, F. Strategies in vineyard establishment to face global warming in viticulture: A mini review. J. Sci. Food Agric. 2021, 101, 1261–1269. [Google Scholar] [CrossRef]
- Lo Bianco, R.; Proietti, P.; Regni, L.; Caruso, T. Planting systems for modern olive growing: Strengths and weaknesses. Agriculture 2021, 11, 494. [Google Scholar] [CrossRef]
- Cherbiy-Hoffmann, S.U.; Hall, A.J.; Rousseaux, M.C. Fruit, yield, and vegetative growth response to photosynthetically active radiation during oil synthesis in olive trees. Sci. Hortic. 2013, 150, 110–116. [Google Scholar] [CrossRef]
- Connor, D.J.; Goméz-del-Campo, M.; Trentacoste, E.R. Relationships between olive yield components and simulated irradiance within hedgerows of various row orientations and spacings. Sci. Hortic. 2016, 198, 12–20. [Google Scholar] [CrossRef]
- Trentacoste, E.R.; Connor, D.J.; Goméz-del-Campo, M. Row orientation: Applications to productivity and design of hedgerows in horticultural and olive orchards. Sci. Hortic. 2015, 187, 15–29. [Google Scholar] [CrossRef]
- Gómez-del-Campo, M.; Trentacoste, E.R.; Connor, D.J. Long-term effects of row orientation on oil yield and oil yield components of hedgerow olive orchards cv. Arbequina. Sci. Hortic. 2022, 294, 110770. [Google Scholar] [CrossRef]
- Trentacoste, E.R.; Connor, D.J.; Gómez-Del-campo, M. Response of oil production and quality to hedgerow design in super-high-density olive cv. Arbequina orchards. Agronomy 2021, 11, 1632. [Google Scholar] [CrossRef]
- Dias, A.B.; Caeiro, L.; Félix, G.; Falcao, J.M. Evaluation of biometric parameters of ‘Belona’, ‘Guara’ and ‘Lauranne’ cultivars in a super high density orchard. Acta Hortic. 2018, 1219, 73–78. [Google Scholar] [CrossRef]
- Felipe, A.J.; Rius, X.; Rubio-Cabetas, M.J. El Cultivo del Almendro; Araconsa: Zaragoza, Spain, 2017; p. 86. ISBN 978-0-646-97816-1. [Google Scholar]
- Maldera, F.; Vivaldi, G.A.; Iglesias-Castellarnau, I.; Camposeo, S. Two almond cultivars trained in a super-high density orchard show different growth, yield efficiencies and damages by mechanical harvesting. Agronomy 2021, 11, 1406. [Google Scholar] [CrossRef]
- Legave, J.M.; Richard, J.C.; Thermoz, J.P.; Duval, H. Lauranne Avijor dans la course. Fruits Légumes 1997, 155, 36–38. [Google Scholar]
- Grasselly, C.; Olivier, G.; Niboucha, A. Le caractère autocompatibilité de l’Amandier dans le programme de 1’I.N.R.A. In Proceedings of the 8th Colloque du Programme de Recherche Agrimed, Amélioration Génétique de deux Espèces de Fruits secs Méditerranéens: L’amandier et le Pistachier, Nîmes, France, 26–27 June 1990; pp. 9–17, ISBN 92-826-4878-8. [Google Scholar]
- Sakar, E.H.; El Yamani, M.; Boussakouran, A.; Rharrabti, Y. Codification and description of almond (Prunus dulcis) vegetative and reproductive phenology according to the extended BBCH scale. Sci. Hortic. 2019, 247, 224–234. [Google Scholar] [CrossRef]
- Gradziel, T.M.; Curtis, R.; Socias, I.; Company, R. Production and growing regions, Botany, Production and Uses. CABI Int. 2017, 1, 70–86. [Google Scholar] [CrossRef]
- Ranjbarfordoei, A.; Samson, R.; Van Damme, P. Photosynthesis performance in sweet almond [Prunus dulcis (Mill) D. Webb] exposed to supplemental UV-B radiation. Photosynthetica 2011, 49, 107–111. [Google Scholar] [CrossRef]
- Lampinen, B.D.; Udompetaikul, V.; Browne, G.T.; Metcalf, S.G.; Stewart, W.L.; Contador, L.; Negrón, C.; Upadhyaya, S.K. A mobile platform for measuring canopy photosynthetically active radiation interception in orchard systems. HortTechnology 2012, 22, 237–244. [Google Scholar] [CrossRef]
- De Herralde, F.; Biel, C.; Savé, R. Leaf photosynthesis in eight almond tree cultivars. Biol. Plant. 2003, 46, 557–561. [Google Scholar] [CrossRef]
- Losciale, P.; Pierpaoli, E.; Corelli Grappaldelli, L. Gestione dell’energia radiante nelle piante da frutto: Utilizzazione, foto- protezione e foto-danno. Quali implicazioni per la produttività? Italus Hortus 2009, 16, 1–22. [Google Scholar]
- Ranjbarfordoei, A.; van Damme, P.; Samson, R. Elevated ultraviolet-B radiation influences photosynthetic pigments and soluble carbohydrates of sweet almond (Prunus dulcis (Miller) D. Webb). Electr. J. Environ. Agric. Food Chem. 2009, 8, 1078–1084. [Google Scholar] [CrossRef]
- Mutsaers, H. The effect of row orientation, date and latitude on light absorption by row crops. J. Agric. Sci. 1980, 95, 381–386. [Google Scholar] [CrossRef]
- Tous, J.; Romero, A.; Hermoso, J.F.; Msallem, M.; Larbi, A. Olive orchard design and mechanization: Present and future. Acta Hortic. 2014, 1057, 231–246. [Google Scholar] [CrossRef]
- Kester, D.E.; Hansche, P.E.; Beres, W.; Asay, R.N. Variance components and heritability of nut and kernel traits in almond. J. Am. Soc. Hortic. Sci. 1977, 102, 264–266. [Google Scholar] [CrossRef]
- Sottile, F.; Barone, E.; Barbera, G.; Palasciano, M. The Italian almond industry: New perspectives and ancient tradition. Acta Hortic. 2014, 1028, 401–406. [Google Scholar] [CrossRef]
- Lovicu, G.; Pala, M.; de Pau, L.; Satta, D.; Farci, M. Bioagronomical behaviour of some almond cultivars in Sardinia. Acta Hortic. 2001, 591, 487–491. [Google Scholar] [CrossRef]
- Dicenta, F.; García, J.E. Inheritance of self-compatibility in almond. Heredity 1993, 70, 313–317. [Google Scholar] [CrossRef]
- Spiegel-Roy, P.; Kochba, J. The inheritance of bitter and double kernel characters in the almond. Z. Pflanz. 1974, 71, 319–329. [Google Scholar]
- Arteaga, N.; Socias i Company, R. Heritability of fruit and kernel traits in almond. Acta Hortic. 2002, 591, 269–274. [Google Scholar] [CrossRef]
- Duval, H.; Grasselly, C. Behaviour of Some Self-Fertile Almond Selections in the Southeast of France. Acta Hortic. 1994, 373, 69–74. [Google Scholar] [CrossRef]
- Camposeo, S.; Vivaldi, G.A. Yield, harvesting efficiency and oil chemical quality of cultivars Arbequina and Arbosana harvested by straddle machine in two Apulian growing areas. Acta Hortic. 2018, 1199, 397–402. [Google Scholar] [CrossRef]
- Connor, D.J.; Goméz-del-Campo, M.; Rousseaux, M.C.; Searles, P.S. Structure, management and productivity of hedgerow olive orchards: A review. Sci. Hortic. 2014, 169, 71–93. [Google Scholar] [CrossRef]
- Hammami, S.; Mimoun, M.B. New Challenges in Olive Orchard Management. Available online: https://www.researchgate.net/profile/Mehdi-Ben-Mimoun/publication/315448526_New_challenges_in_olive_orchard_management/links/58e12ef1a6fdcc41bf944b44/New-challenges-in-olive-orchard-management.pdf (accessed on 13 January 2023).
- Morales-Sillero, A.; Rallo, P.; Jiménez, M.R.; Casanova, L.; Suárez, M.P. Suitability of two table olive cultivars (“Manzanilla de Sevilla” and ’Manzanilla Cacereña’) for mechanical harvesting in super high-density hedgerows. HortScience 2014, 49, 1028–1033. [Google Scholar] [CrossRef]
- Pérez-Ruiz, M.; Rallo, P.; Jiménez, M.R.; Garrido-Izard, M.; Suárez, M.P.; Casanova, L.; Valero, C.; Martínez-Guanter, J.; Morales- Sillero, A. Evaluation of over-the-row harvester damage in a super-high-density olive orchard using on-board sensing techniques. Sensors 2018, 18, 1242. [Google Scholar] [CrossRef]
- Tous, J. Olive production systems and mechanization. Acta Hortic. 2011, 924, 169–184. [Google Scholar] [CrossRef]
- Dorfman, J.; Dorfman, M.; Heien, D. Causes of almond yield variations. Calif. Agric. 1988, 42, 27–28. [Google Scholar]


Disclaimer/Publisher’s Note: The statements, opinions and data contained in all publications are solely those of the individual author(s) and contributor(s) and not of MDPI and/or the editor(s). MDPI and/or the editor(s) disclaim responsibility for any injury to people or property resulting from any ideas, methods, instructions or products referred to in the content. |
© 2023 by the authors. Licensee MDPI, Basel, Switzerland. This article is an open access article distributed under the terms and conditions of the Creative Commons Attribution (CC BY) license (https://creativecommons.org/licenses/by/4.0/).