Article

Effects of Long-Term Organic–Inorganic Nitrogen Application on Maize Yield and Nitrogen-Containing Gas Emission

1
Yinshanbeilu Grassland Eco-Hydrology National Observation and Research Station, China Institute of Water Resources and Hydropower Research, Beijing 100038, China
2
Institute of Water Resources for Pastoral Area, Ministry of Water Resources, Hohhot 010020, China
3
Key Laboratory of Agricultural Soil and Water Engineering in Arid and Semiarid Areas, Ministry of Education, Northwest A&F University, Yangling 712100, China
4
College of Water Conservancy and Civil Engineering, Inner Mongolia Agricultural University, Hohhot 010018, China
*
Author to whom correspondence should be addressed.
Agronomy 2023, 13(3), 848; https://doi.org/10.3390/agronomy13030848
Submission received: 27 January 2023 / Revised: 2 March 2023 / Accepted: 13 March 2023 / Published: 14 March 2023

Abstract

:
A sustainable model of combined organic–inorganic fertilizer application for high maize yields and environmental health is important for food security. The short-term combined application of organic and inorganic fertilizers can improve crop yields; however, the effect of different proportions of organic and inorganic fertilizers on the maize yield and nitrogen gas emissions in a long time series has not been reported. In this study, field experiments and DeNitrification-DeComposition (DNDC) model simulations were used to study the long-term effects of substituting inorganic fertilizers with organic fertilizers on crop yields and nitrogen-containing gas emissions. Six treatments were included: no nitrogen (CK); urea (U1); and 25%, 50%, 75%, and 100% of the urea N substituted by organic fertilizers (U3O1, U1O1, U1O3, and O1, respectively). The DNDC model was calibrated using the field data from the U1 treatment from 2018 to 2020 and was validated for the other treatments. The results showed that this model could effectively simulate crop yields (e.g., nRMSE < 5%), soil NH3 volatilization, and N2O emissions (nRMSE < 25%). In addition, long-term (26 years) simulation studies found that the U1O1 treatment could considerably increase maize yields and ensure yield stability, which was 15.69–55.31% higher than that of the U1 treatment. The N2O, NH3, and NO emissions were in the descending order of U1 > U3O1 > O1 > U1O3 > U1O1, and the total nitrogen-containing gas emissions from the U1O1 treatment decreased by 53.72% compared with the U1 treatment (26 years). Overall, substituting 50% of inorganic nitrogen with organic nitrogen could maintain the high yield of maize and reduce emissions of nitrogen-containing gases, constituting a good mode for the combined application of organic–inorganic nitrogen in this area.

1. Introduction

In recent decades, due to the rapid growth of China’s population, high crop yields have been the primary target of agricultural production [1]. The total maize cultivation area in China is 35 million hectares, and the production is 216 million tons [2]. Increased crop production is at the cost of a large amount of nitrogen fertilizer. The annual nitrogen fertilizer application in China has reached 59.8 million tons [3]. However, the nitrogen utilization efficiency in China is only around 30%, which is far lower than the global average [4]. Approximately 15 million tons of nitrogen are lost through leaching, NH3 volatilization, and N2O emissions [5]. Therefore, the rational use of nitrogen fertilizer resources is important in ensuring food security and environmental security.
Ammonia volatilization is the main route of nitrogen loss [6]. In the atmosphere, NH3 is easily neutralized by acidic substances in the precursors of sulfur dioxide and nitrogen oxides, has long been considered as an important factor in forming the sol of secondary sulfate and nitrate gas [7], and can also cause acidification and the eutrophication of water [8]. N2O is naturally produced in the soil through microbial-mediated nitrification and denitrification processes and is one of the main greenhouse gases that cause global warming [9]. N2O contributes around 6% of the global greenhouse effect [10]. Agricultural production is undoubtedly the main source of nitrogen loss, and approximately 47% of nitrogen enters the atmosphere in the form of NH3 volatilization and N2O emissions [11]. Therefore, in farmland production, reducing nitrogen gas emissions and improving food production efficiency is an issue that needs to be addressed urgently.
China is a major producer of organic waste in the world. Applying a large amount of organic waste to the soil as fertilizer after processing is an effective measure for the sustainable development of agricultural production [12]. The combined application of organic–inorganic fertilizers has a fast and lasting effect and can improve soil fertility and alleviate environmental degradation [13]. In recent years, research on the combined application of organic–inorganic fertilizers has become a rapidly growing field. Based on previous studies, compared with the single application of chemical fertilizers, the combined application of organic–inorganic fertilizers can achieve increased or stabilized yields [14,15,16,17]. However, the research conclusions on the main pathways of soil nitrogen loss under the combined application of organic–inorganic fertilizers, especially the effects of NH3 volatilization and N2O emissions, are not consistent. Some studies report that the application of organic fertilizers can increase soil organic acid content and reduce soil pH, thereby reducing soil NH3 volatilization losses [18]. However, some studies have shown that the high organic matter content in farmlands where organic fertilizer is applied causes the soil to have high urease activity, thereby increasing soil NH3 volatilization [19]. In addition, Li et al. [20] found that the application of organic fertilizers can provide energy for microbial activities, promote nitrification and denitrification processes, and increase N2O emissions. It has also been reported that under equal nitrogen content, the N2O emissions of a single application of chemical fertilizer treatment are significantly higher than under the treatment of organic–inorganic combined application [21]. The differences in the above research results may be due to the types of organic fertilizers used, the ratio of applied organic–inorganic fertilizers, the number of years of fertilizer application, and the climatic conditions and soil conditions [22,23,24]. Therefore, according to the soil conditions in the Hetao Irrigation District, adjusting the ratio of organic fertilizer to chemical fertilizer should be an effective measure for ensuring crop yields and reducing nitrogen loss.
Maize is one of the main food crops in the Hetao Irrigation District. Short-term experiments show that the combined application of organic–inorganic fertilizers can increase crop yields and soil fertility. However, after long-term fertilization, soil fertility may no longer be a factor limiting crop growth, and may lead to a large amount of nitrogen gas emissions [25]. At present, the effects of different ratios of applied organic–inorganic fertilizer on maize yields and nitrogen-containing gases (N2O, NO, N2, and NH3) on a long-term scale (such as 26 years) have rarely been reported. This is mainly due to space and time limitations, especially when more observational indicators and a long experimental period are required, posing difficulties for field trials. Therefore, predicting production or nitrogen loss on a larger scale must rely on some mathematical models [26]. The DeNitrification-DeComposition (DNDC) model is a process-based biogeochemical model that can combine nitrogen conversion and hydrological processes in detail to simulate crop yields, nitrogen leaching, and greenhouse gas emissions [27,28]. It is considered to be a useful tool for evaluating the effects of management and practice on nitrogen loss in agricultural ecosystems and has been applied to different countries and ecosystems around the world [29,30,31]. Therefore, this study used the DNDC model to quantify the effects of long-term combined organic–inorganic fertilizer management on crop yields and nitrogen-containing gas emissions, and determine sustainable fertilization management that can improve crop yields and reduce environmental pollution, which are important for the sustainable development of organic agriculture.
Our research team carried out a 3-year field experiment in the Hetao Irrigation District of Inner Mongolia to study the effects of different ratios of applied organic–inorganic fertilizers on spring maize yields, NH3 volatilization, N2O emissions, and topsoil nitrate–nitrogen content. This study integrated the results of field experiments to calibrate the DNDC model, and meteorological data from 1995 to 2020 in the Jiefangzha irrigation area of Hetao Irrigation District were used to simulate the responses of spring maize yields and farmland nitrogen-containing gas emissions under the long-term combined application of different organic–inorganic fertilizers. The stability of crop yields and environmental effects under the combined application of different organic–inorganic fertilizers was comprehensively analyzed.

2. Materials and Methods

2.1. Overview of the Experimental Area and Experimental Design

The experiment was carried out at Shahaoqu Experimental Station in the Jiefangzha Irrigation Area of Hetao Irrigation District from 2018 to 2020. The experimental area is cold in winter and receives little snow, and it is hot in summer and experiences high temperatures. It has a typical temperate continental monsoon climate. The annual average temperature is 7.7 °C, the annual average rainfall is 143 mm, and the frost-free period is 135–150 days. The annual accumulated temperature above 10 °C is 3551 °C, the annual average sunshine duration is 3200 h, and the annual freezing and thawing period is around 180 d. There is plenty of sunshine, the annual total solar radiation is around 6000 MJ m−2, the heat is sufficient, and it has excellent agricultural development conditions. In the experimental field, the 0–20 cm soil layer was silt loam, the 20–40 cm soil layer was silty clay loam, the 40–60 cm soil layer was silty loam, and the 60–120 cm soil layer was sandy loam. The initial soil properties of different soil layers (0–20 cm) are listed in Table 1.
The tested maize cultivar was ‘Neidan 314′. It was bred by the Inner Mongolia Academy of Agricultural Sciences and is suitable for local cultivation. The total number of leaves was 19–21, the plant habit was semi-compact, the plant height was 275 cm, the ear height was 110 cm, the ear length was 20.5 cm, and the growth period was 135 days. The three-year sowing dates were 25 and 27 April, and 5 May, and the harvest dates were 13 September, 13 September, and 19 September. According to the irrigation quota of the local optimal border irrigation, 750 m3 ha−1 was used as the irrigation amount. The nitrogen application rate was optimized, and 240 kg ha−1 was set as the total nitrogen application [32]. The amount of nitrogen applied represented the converted pure nitrogen amount. Six treatments were included: no nitrogen (CK); urea (U1); and 25%, 50%, 75%, and 100% of the urea N substituted by organic fertilizers U3O1, U1O1, U1O3, and O1, respectively. There were three replicates, and a total of 18 plots with a plot area of 30 m2 (6 m × 5 m). There was a 1-m-wide isolation belt and a 15-cm-high ridge between each plot, and the space between each plot was 1 m. The organic fertilizer was a commercial organic fertilizer (prepared by spray granulation of maize stalks after decomposing, containing N 2.5%, P2O5 1%, K2O 1%, organic matter mass fraction greater than or equal to 45%, humic acid mass fraction greater than or equal to 17%, and S mass fraction greater than or equal to 8%). Organic fertilizer and phosphate fertilizer (amount of applied super phosphoric acid 50 kg ha−1, and the same amount of phosphate fertilizer applied in each treatment) were applied as a base fertilizer once, before tillage (uniform spreading and rotary tillage 20 cm), and urea was applied at a ratio of 1:1 when irrigation was performed during the maize sowing stage and jointing stage.

2.2. Measurement Items and Methods

2.2.1. Soil Physicochemical Properties and Yield Measurement

Climate variables, such as air temperature and precipitation, were obtained from an automatic weather station near the experimental site. Soil temperature at 10 cm depth and soil water content at 20 cm depth (WFPS) were measured at the same time as gas sampling. Soil nitrate–nitrogen content at 0–20 cm depth was determined every week from each plot. Fresh soil (10 g) was extracted with KCl solution (40 mL, 1 mol L−1) and analyzed by a continuous flow analyzer [33]. During maize harvest, 20 m2 (4 m × 5 m) was selected in each plot for air drying and threshing, and the grain yield was measured.

2.2.2. Measurement of Soil Ammonia Volatilization

The venting method was adopted in the experiment [34]. A venting method device with a height of 10 cm and an inner diameter of 15 cm, made of a polyvinyl chloride (PVC) rigid plastic tube, and two sponges with a thickness of 2 cm and a diameter of 16 cm, pre-soaked in 15 mL of glycerol phosphate solution (50 mL H3PO4 + 40 mL C3H8O3, diluted in water to 1000 mL), were placed in the device. The bottom sponge layer was 5 cm from the bottom of the tube, and the top sponge layer was level with the top of the tube, and the device was inserted into the soil to a depth of 1 cm. A rain cover was supported at 20 cm from the top of each device to prevent rain from affecting the device.
Capture of the volatilized ammonia started on the day after fertilizer application. Three ammonia capture devices were installed on the diagonal of each plot, and the samples were collected at 8:00 the next morning. The lower layer of the sponge was quickly removed and placed into a sealed bag. Then, another pre-soaked sponge was placed inside, and the upper sponge was replaced every 2–4 d. The removed sponge was cut into pieces and placed into a 500 mL plastic bottle, in which 300 mL of 1.0 mol L−1 KCl solution was added to completely immerse the sponge. After the system was shaken for 1 h, the content of ammonium nitrogen in the leaching solution was measured with a continuous flow analyzer (Aquakem 250). In the first week after fertilizer application, a sample was collected every day, and then a sample was collected every 2–5 d to monitor the amount of volatilized ammonia until no ammonia could be detected.
The soil ammonia volatilization rate was calculated by the following equation:
V = M A × D × 10 2
where V is the ammonia volatilization rate (kg·ha−1 d−1), M is the average (NH3-N, mg) measured by a single device using the venting method, A is the cross-sectional area of the capture device (m2), and D is the time (d) of each continuous capture.

2.2.3. Measurement of N2O Emissions

The static dark box method was used for gas collection, and the box size was 0.5 m × 0.5 m × 0.5 m. The sampling site was set between the maize ridges and was randomly determined after sowing. The sealing groove of the base of the box was buried in the soil, and water was added to the sealing groove to prevent the gas in the box from leaking. A thermometer was placed in the box to measure the temperature level in the box. When sampling, a three-port valve was used for air intake, and a 100-mL syringe was used to draw approximately 100 mL of gas from the sampling port of the sampling box for each sample. The gas collection interval was 10 min, and four samples were collected for each sampling. The collected gas was measured and analyzed in the laboratory with an Agilent 6820 gas chromatography system (Agilent 6820D, Agilent corporation, Santa Clara, CA, USA). For the gas collection, continuous sampling was performed after irrigation, fertilizer application, and rainfall, and the sampling frequency at other times was roughly once a week and was appropriately adjusted according to crop growth and seasonal changes.
The N2O gas emission flux was calculated by the following method [35]:
K = ρ × H × d c d t × 273 273 + T
where K is the N2O emission flux (μg (m2 h)−1); ρ is the N2O gas density under standard conditions, and its value is 1.997 g L−1; H is the static dark box height (cm); dc/dt is the slope of the N2O concentration change with time during sampling; T is the average temperature (°C) in the sampling box; and 273 is the gas equation constant.
The equation for calculating the total N2O gas emissions was as follows [35]:
K t = K i + 1 + K i 2 ( D i + 1 D i ) × 24 × 10 3
where Kt is the total amount of emitted N2O (mg m−2); Ki and Ki+1 are the N2O emission fluxes during the ith sampling and i+1th sampling (μg (m2 h)−1), respectively; and Di and Di+1 are the ith and i+1th sampling times (d), respectively.

2.3. DNDC Model

In this study, the latest version 9.5 of the DNDC model was adopted, and it was developed by the Institute for the Study of Earth, Oceans and Space, University of New Hampshire, USA. The model is mainly composed of two parts and six sub-modules: (1) in the soil climate, crop growth, and soil organic matter decomposition sub-models, various ecological driving factors (such as soil, climate, vegetation, and human activities) are used to simulate soil environmental factors (soil temperature, humidity, pH, redox potential, and various substrate concentrations); (2) the nitrification, denitrification, and fermentation sub-models are used to simulate the influence of soil environmental factors on microorganisms and calculate the emissions of CH4, CO2, N2O, NO, NH3, and other greenhouse gases in the biogeochemical process.
The input parameters needed by the DNDC model include meteorology (average daily temperature, daily rainfall, wind speed, and humidity), soil (type, soil bulk density, clay ratio, field water holding rate, porosity, pH value, surface soil nitrate–nitrogen content, and ammonium nitrogen content), and farmland management (growth, tillage, fertilizer application, organic fertilizer application, irrigation of planted crops) data. The model uses a daily time step, and the information is integrated to simulate the interaction between different environmental conditions, crop growth, and soil chemical changes and can perform the simulation for one to many years [1]. Model output parameters include crop indicators (e.g., growth indicators, yield, absorption of water and nutrients), soil physicochemical indicators (e.g., soil temperature and humidity, soil carbon pool content, nitrogen pool content and their changes, C and N loss), gas (e.g., NO, N2O, N2, NH3, CH4, CO2) emissions, and nitrogen leaching amount [2,3].

2.4. Establishment of the DNDC Model Database

The input parameters of the model included the geographical location, climatic conditions, soil indicators, and field management data of the experimental area. The key parameters were comprehensively determined by various methods, such as experimental measurement, literature collection, and model default values. The meteorological data were all from the automatic observation data of the Shahaoqu Meteorological Station (around 500 m from the experimental site), and the soil indicator data were obtained through field experimental measurement. The field management parameters were obtained based on the three-year experimental farming situation. The total precipitation during the three-year growth period of spring maize for 2018, 2019, and 2020 was 111.00 mm, 54.97 mm, and 131.20 mm, respectively. The average daily temperature and rainfall are shown in Figure 1.
In order to allow the model to more accurately simulate the growth of crops in this area, the above-mentioned crop parameters were calibrated based on the U1 treatment. For the initial run of the model, the default model physiological parameters for the crop (optimal yield, accumulated temperature, C/N ratio of roots, stems, leaves and grains, water consumption per kilogram of dry matter and N fixation coefficient) were used. Data of crop yield, soil temperature, soil WFPS, nitrate–nitrogen content, NH3 volatilization, and N2O emissions observed in the 2018–2020 experiment were used to calibrate the crop parameters until the simulated crop yield and other indicators showed reasonable consistency with the measured values. The calibrated crop parameters are shown in Table 2. Afterward, the calibrated crop parameters were used for the model verification of different organic–inorganic fertilizer treatments and the control treatment.
The statistical methods for evaluating model simulation effects included four indicators: coefficient of determination (R2), mean bias error (MBE), root mean square error (RMSE), and normalized root mean square error (NRMSE). An R2 value closer to 1 indicates the better fit of the simulated values to the actual measurements and higher accuracy of the model. MBE represents the average error between the measured value and the simulated value, and an MBE greater than 0 means that the simulated value is higher than the measured value, whereas an MBE less than 0 means that the simulated value is less than the measured value. RMSE is a commonly used statistic indicator, and a smaller RMSE indicates a smaller deviation between the simulated and measured data. NRMSE represents the relative magnitude of the average deviation; an NRMSE less than or equal to 10% indicates the excellent performance of the model, a value between 10% and 20% indicates good performance, a value between 20% and 30% indicates fair performance, and a value greater than 30% indicates poor performance and poor applicability [36].
R 2 = [ i = 1 n ( M i M m ) ( S i M m ) i = 1 n ( M i S i ) 2 i = 1 n ( S i S m ) 2 ]
MBE = i = 1 n ( S i M i ) n
RMSE = i = 1 n ( M i S i ) 2 n
NRMSE = i = 1 n ( M i S i ) 2 n M m

2.5. Effects of Long-Term Combined Application of Organic–Inorganic Nitrogen on Crop Yield and Nitrogen-Containing Gas Emissions

The long-term simulated meteorological data were meteorological data from 1995 to 2020 published by the Jiefangzha Irrigation Area Administration of Hetao Irrigation District, which is approximately 5 km away from the experimental area. The average temperature during the spring maize-growing season was between 8.5 °C and 28.4 °C, and the average temperature was 17.6 °C. The rainfall distribution in the spring maize-growing season was between 54.26 mm and 191.26 mm, and the average rainfall was 103.59 mm.
The actual field operation time in this area was used as the reference for the sowing and harvesting times of maize. The sowing time was maintained at the end of April or the beginning of May each year, and the harvest was in mid-September of that year. The irrigation times during the maize-growing season were based on the actual conditions of the farmland operations in this experiment. Three irrigation treatments were designed during the maize-jointing stage, the big trumpet stage, and the tasseling stage, and the irrigation volume was maintained at 50 mm each time. The DNDC model was run according to the preliminarily designed irrigation time and irrigation amount, and then the output of the model was used to determine if water stress was present during crop growth and to adjust the irrigation time to reduce the crop yield loss caused by water stress that could affect the nitrogen application result.

2.6. Statistical Analysis of Data

SPSS 20.0 (IBM Corp., Armonk, NY, USA) and Origin (ver. 9.5; OriginLab Corp., Northampton, MA, USA) were used for analysis and chart plotting. Mean comparisons were performed for significant effects with the least significant difference (LSD) test at α = 0.05. The differences between the treatments were considered significant at p < 0.05.

3. Results

3.1. Model Evaluation

3.1.1. Yield

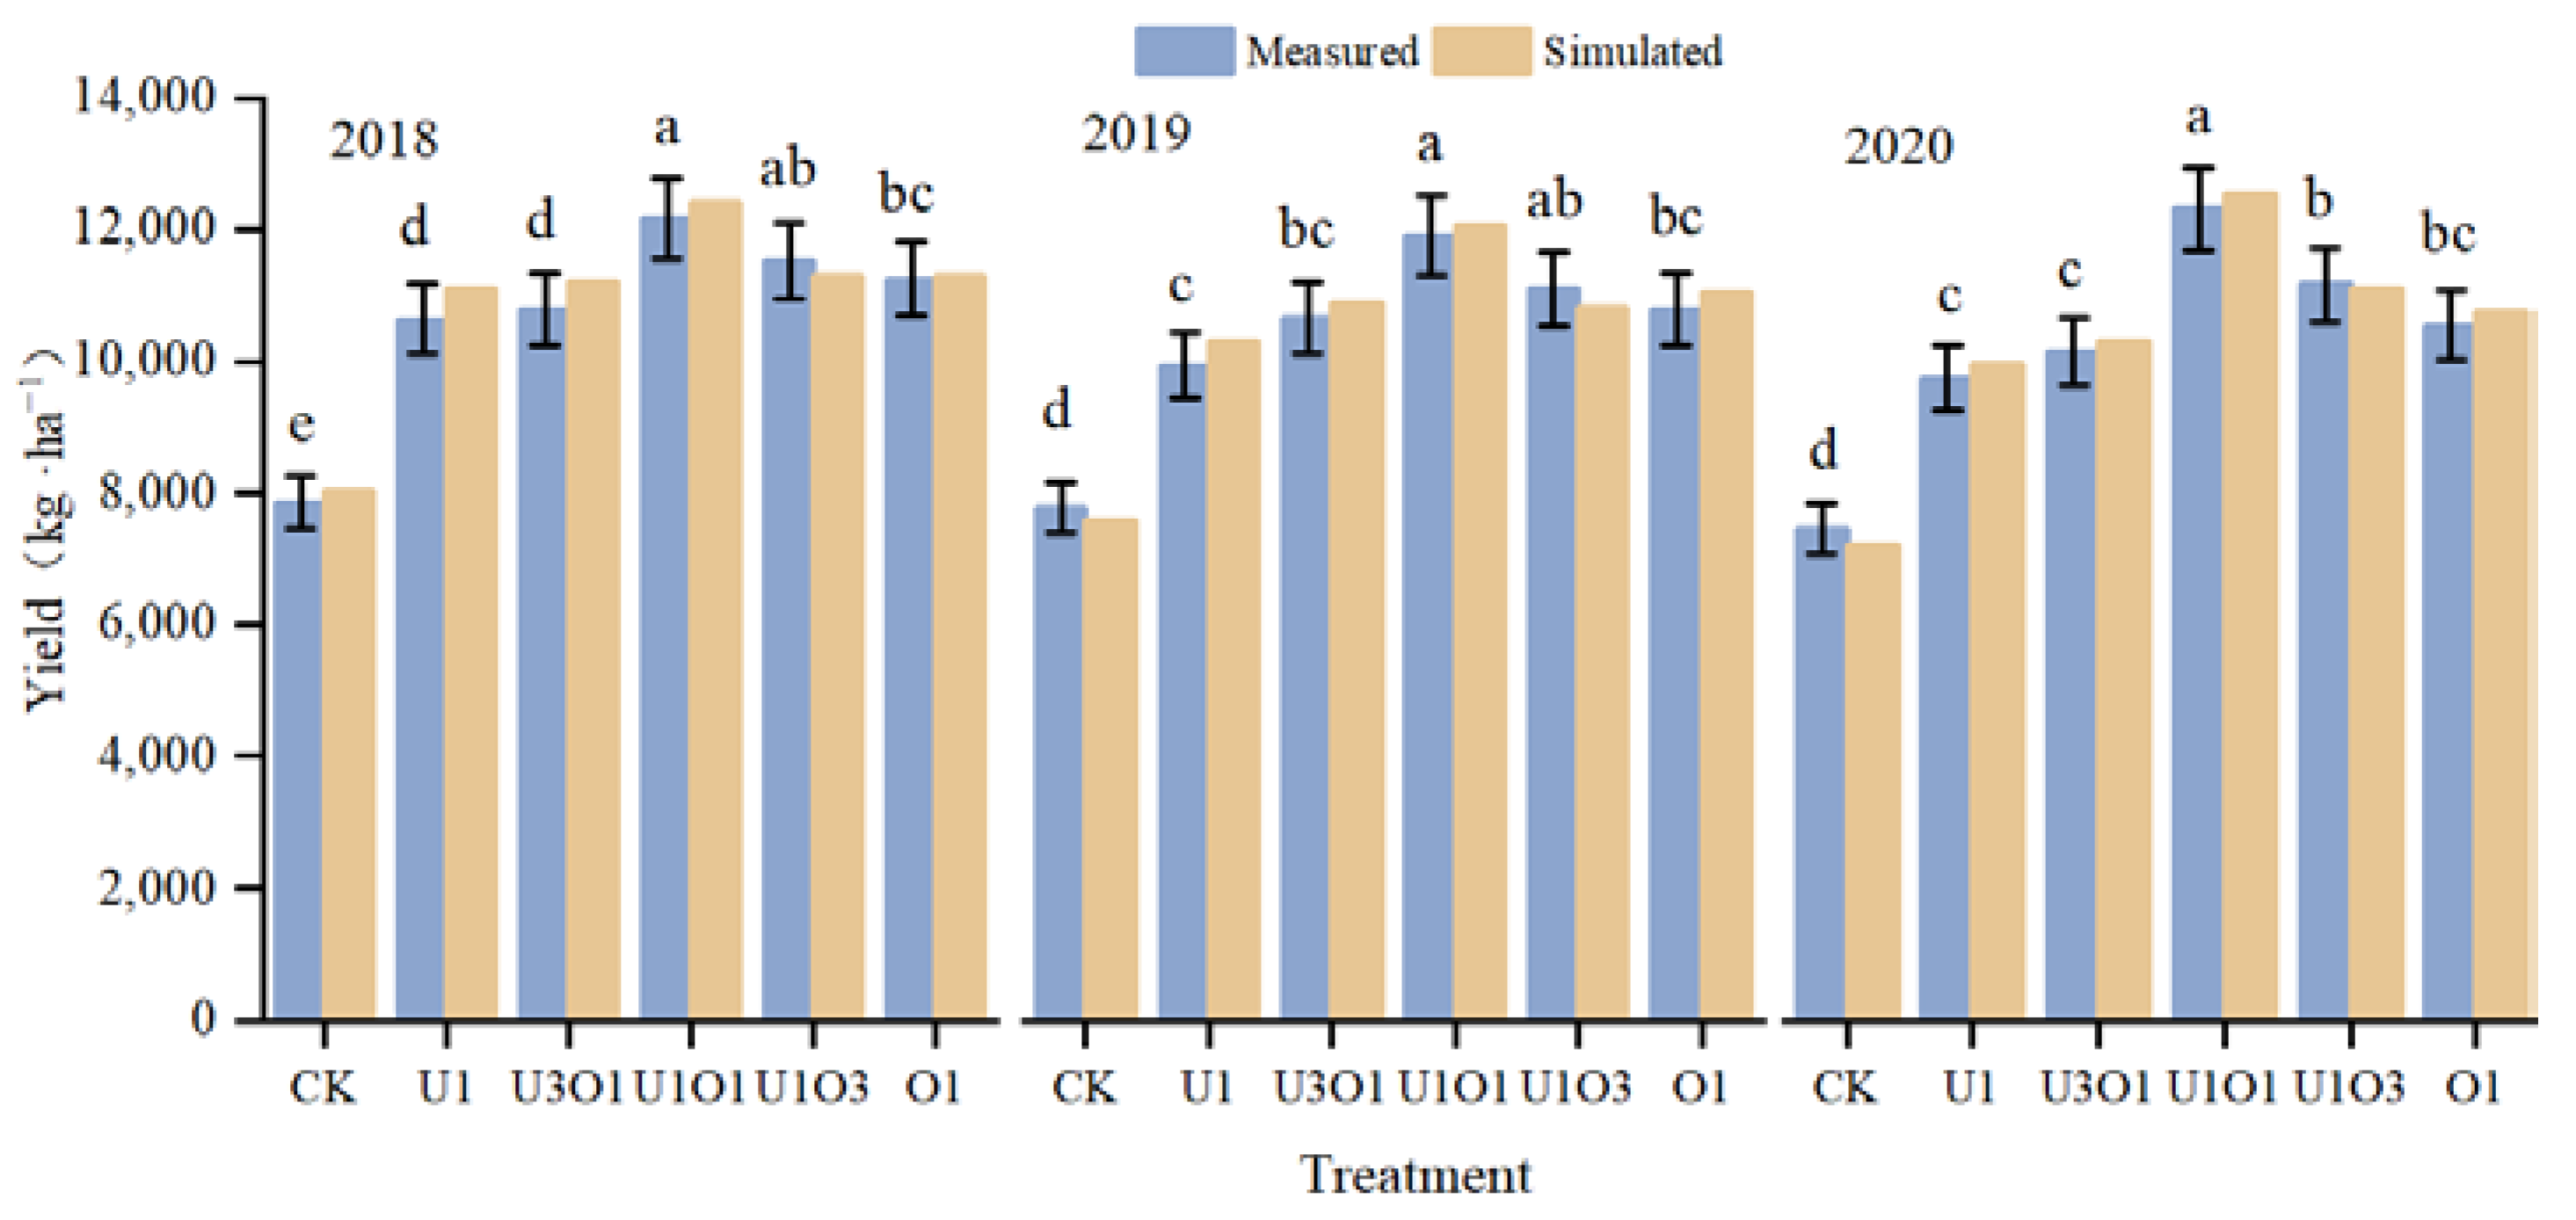
The parameters of the DNDC model were calibrated via the U1 treatment. As shown in Figure 2, under the three consecutive years of the spring maize planting system in 2018–2020, the measured crop yields were consistent with the values simulated by the model. The simulated statistical analysis of maize yield under this treatment showed that R2 reached 0.99, MBE was 192.10 kg ha−1, RMSE was 185.47 kg ha−1, and NRMSE was 2.63% (Table 2). The above statistical analysis results indicated that the parameters of the DNDC model based on the U1 treatment had been effectively calibrated.
The DNDC model simulation effect was verified by comparing the measured and simulated values of crop yields in other fertilizer application treatments and the CK treatment. The statistical analysis results showed that the R2 of each treatment was above 0.97, and the MBE value was within the range of −97.17–352.10 kg ha−1. The RMSE value was within the range of 289.56–367.53 kg ha−1, and the NRMSE value was below 5% (Table 3). The variation ranges of the abovementioned evaluation indicators for the simulation effect were all within the range of good and excellent simulation performance, which also showed that the model parameter settings were reasonable and could effectively simulate crop yields in different treatments.
Both the measured and simulated values of maize yield indicated that fertilizer application could considerably increase maize yields (Table 3). The three-year measured average value of the maize yield of each fertilizer application treatment was 31.19–57.28% higher than that of the CK treatment, and the simulated average value was 37.42–62.05% higher. Among the various fertilizer application treatments, the maize yield increased first and then decreased as the proportion of organic fertilizer increased. The U1O1 treatment showed the largest yield value, and the measured and simulated average values were 17.92% and 19.89% higher than that of U1, respectively.

3.1.2. Soil Nitrate–Nitrogen Content

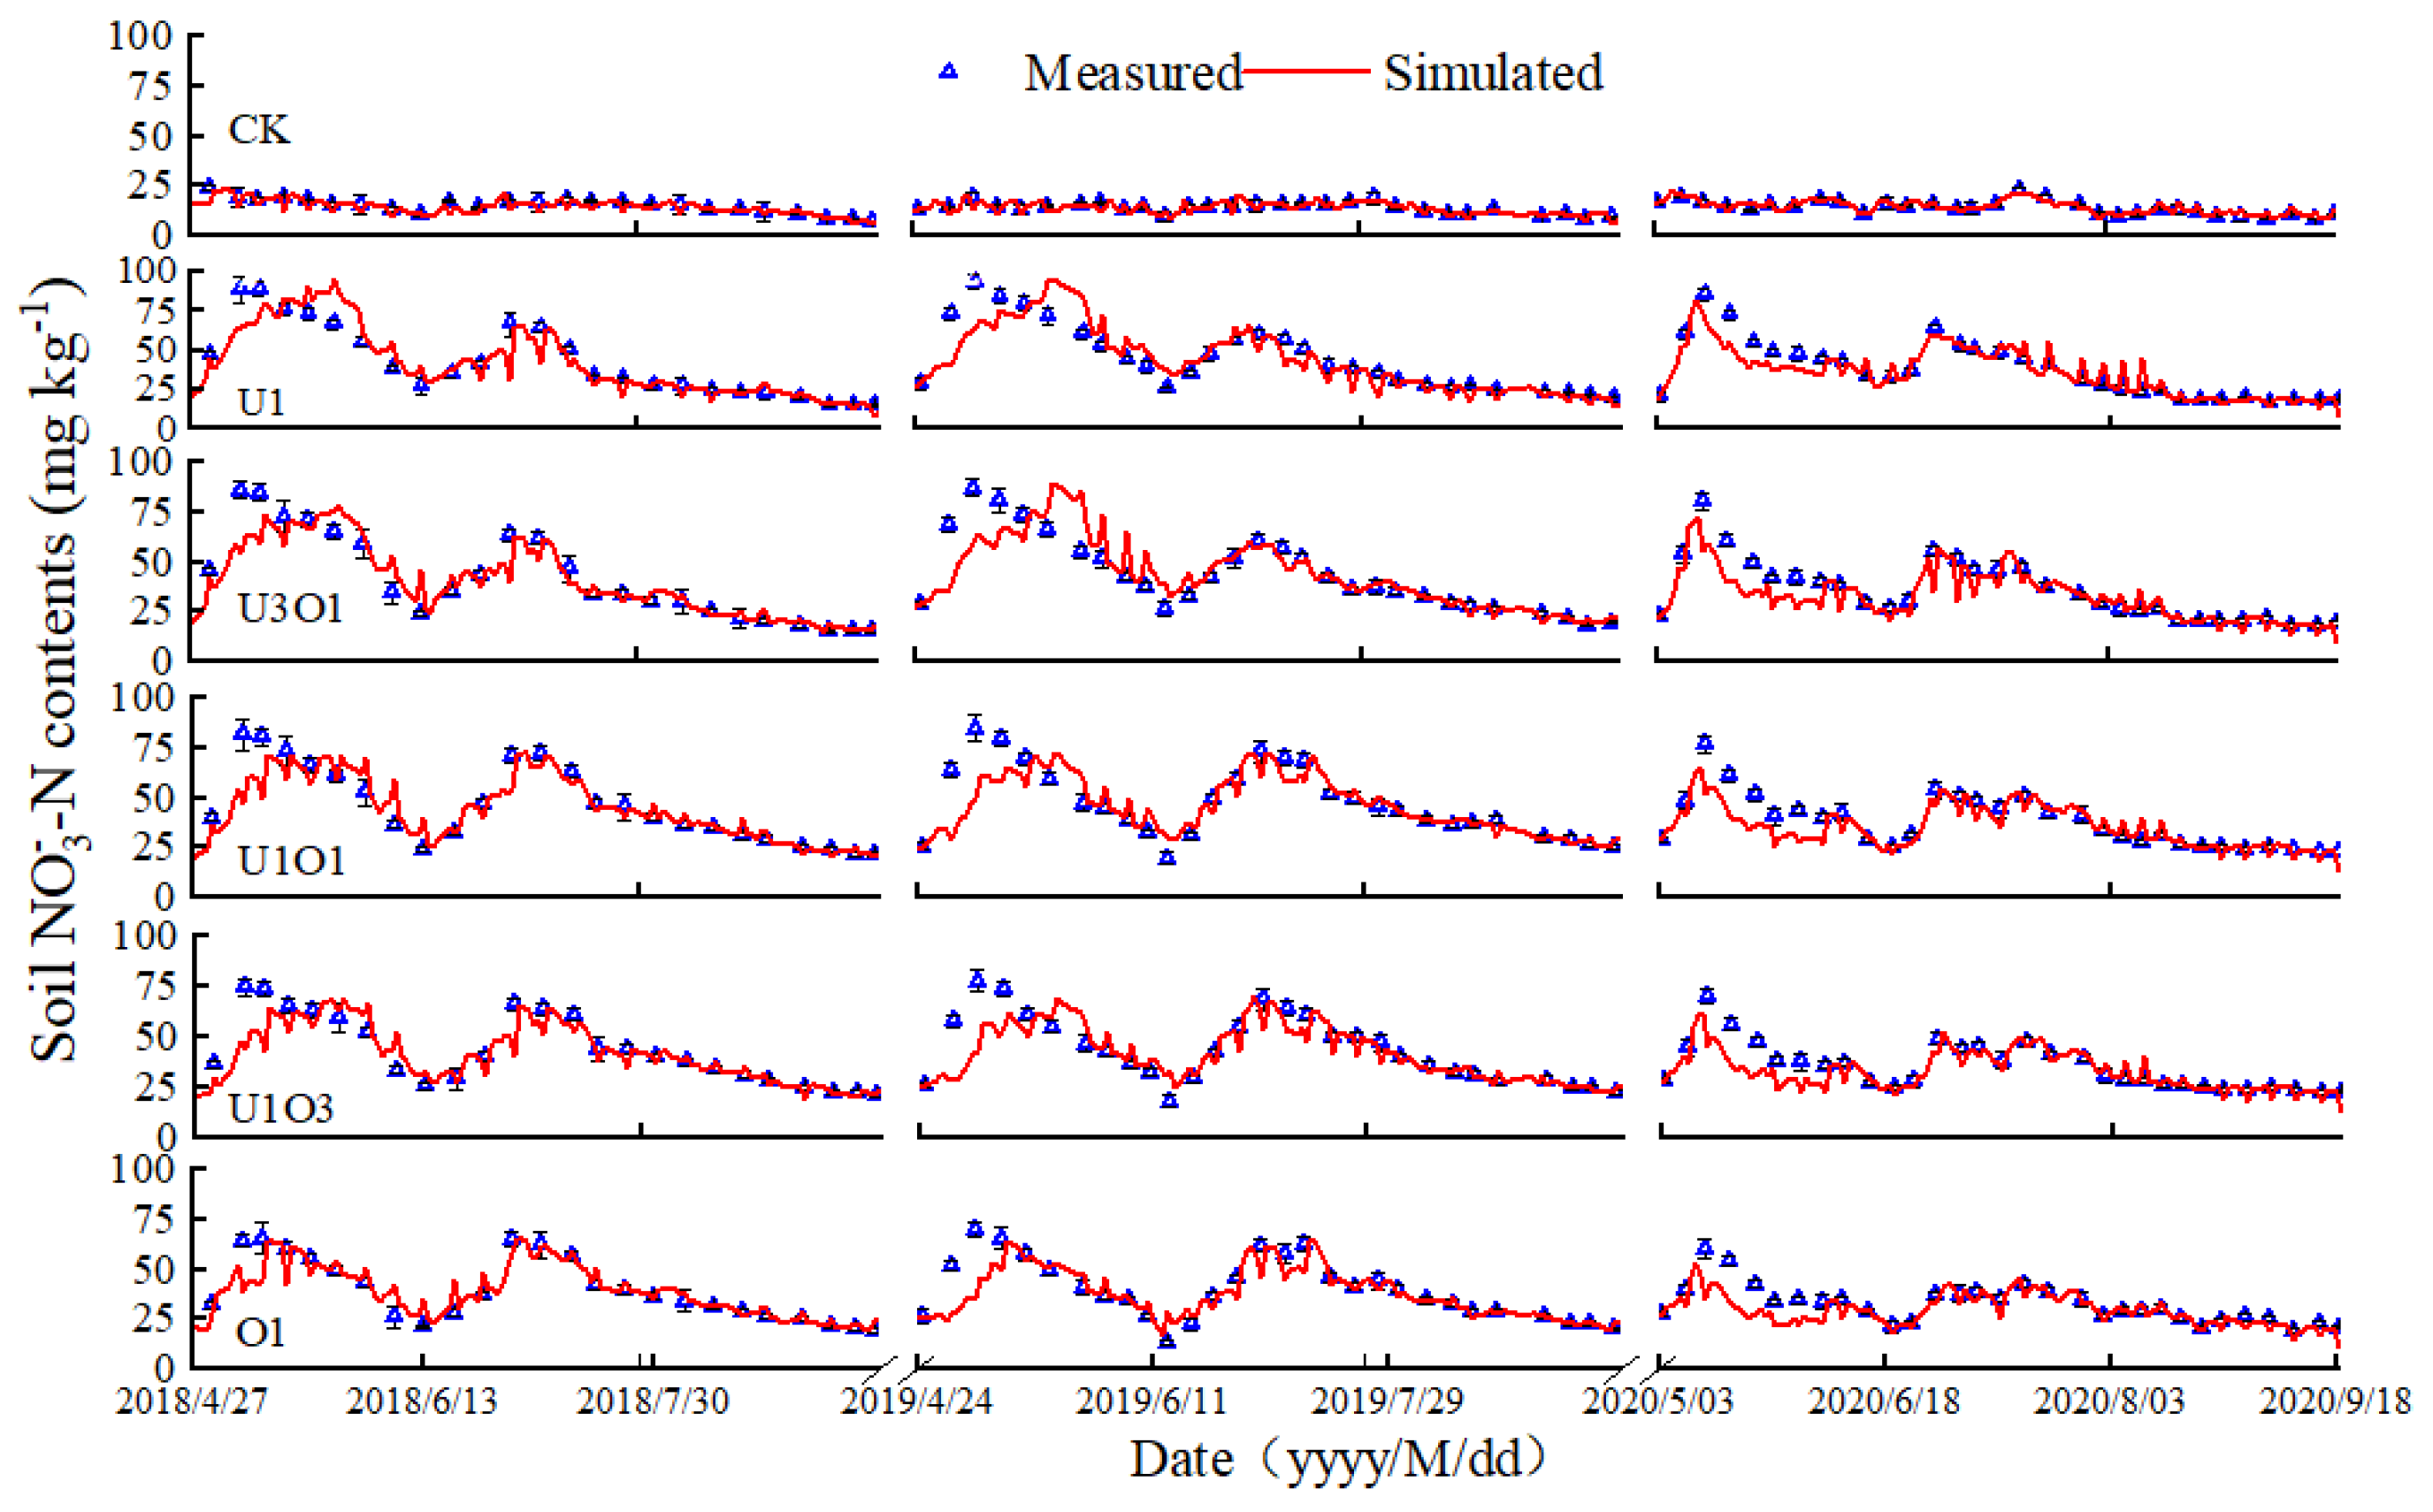
As shown in Figure 3, the DNDC model could simulate the dynamic change and magnitude of nitrate–nitrogen in the surface soil (0–20 cm) during the growth period. However, compared with the soil temperature and humidity results, the simulation accuracy decreased to some extent, and the model-simulated value of each fertilizer application treatment underestimated the soil nitrate–nitrogen content. Statistical analysis showed (Table 4) that the R2 values of the different treatments were in the range of 0.69–0.72; the MBE values were −4.55–1.91 mg kg−1; the RMSE values were in the range of 12.19–13.80 mg kg−1; the NRMSE values were in the range of 18.82–22.58%; and the performance was fair. The above statistical analysis results showed that the performance of the DNDC model simulation on the soil nitrate–nitrogen content in the spatial and temporal dimensions was relatively poor.
Both the simulated value and the actual measured value indicated that after the basal fertilizer was applied, the NO3-N content of each fertilizer application treatment first decreased and then increased as the proportion of organic nitrogen increased. First, this is because inorganic nitrogen has quick fertilizer efficiency and can rapidly produce a large number of inorganic nutrients. Second, the one-off application of organic nitrogen during the sowing period led to a large amount of mineralization. After topdressing, the advantages of applying organic nitrogen treatment with a long-lasting fertilizer began to appear. The content of NO3-N was in the descending order of U1O1, U1O3, O1, U3O1, and U1.

3.1.3. Soil Ammonia Volatilization

It can be seen from Figure 4 that the DNDC model had a good simulation effect on the emission flux and cumulative emissions of soil ammonia volatilization, but the simulated value underestimated the soil ammonia volatilization. Statistical analysis showed (Table 5) that the emission flux and cumulative emission R2 values of each treatment were in the ranges of 0.62–0.83 and 0.75–0.91, respectively; the MBE values were in the ranges of −0.52–0.15 kg ha−1 and −6.42–1.58 kg ha−1, respectively; the RMSE values were in the ranges of 0.15–0.65 and 1.2–5.15 kg ha−1, respectively; the NRMSE values were in the ranges of 16.57–20.43% and 10.69–17.33%, respectively; and the model simulation performance was fair.
From the measured and simulated values (Figure 4a), it can be seen that nitrogen application could considerably increase the soil ammonia volatilization, and the soil ammonia volatilization of each fertilizer application treatment was significantly higher than that of the CK treatment. From 2018 to 2020, the measured ammonia volatilization rate of each treatment varied from 0.032 to 1.975 kg ha−1 d−1, and the range of the simulated ammonia volatilization rate was 0.002–1.756 kg ha−1 d−1. In addition, the model could effectively capture the emission peak of ammonia volatilization. The emission peaks of each treatment quickly appeared 1–2 days after the application of the basal fertilizer and topdressing, and then gradually entered the low volatilization stage. According to the total ammonia volatilization emissions (Figure 4b), the cumulative ammonia volatilization emissions of each fertilization treatment increased first and then decreased as the proportion of organic nitrogen increased. Additionally, the U1O1 treatment always exhibited the lowest value, and the measured and simulated values of the three-year U1O1 treatment were 8.13–62.12% and 6.34–90.89% lower than those of the other fertilization treatments, respectively.

3.1.4. Nitrous Oxide Emissions

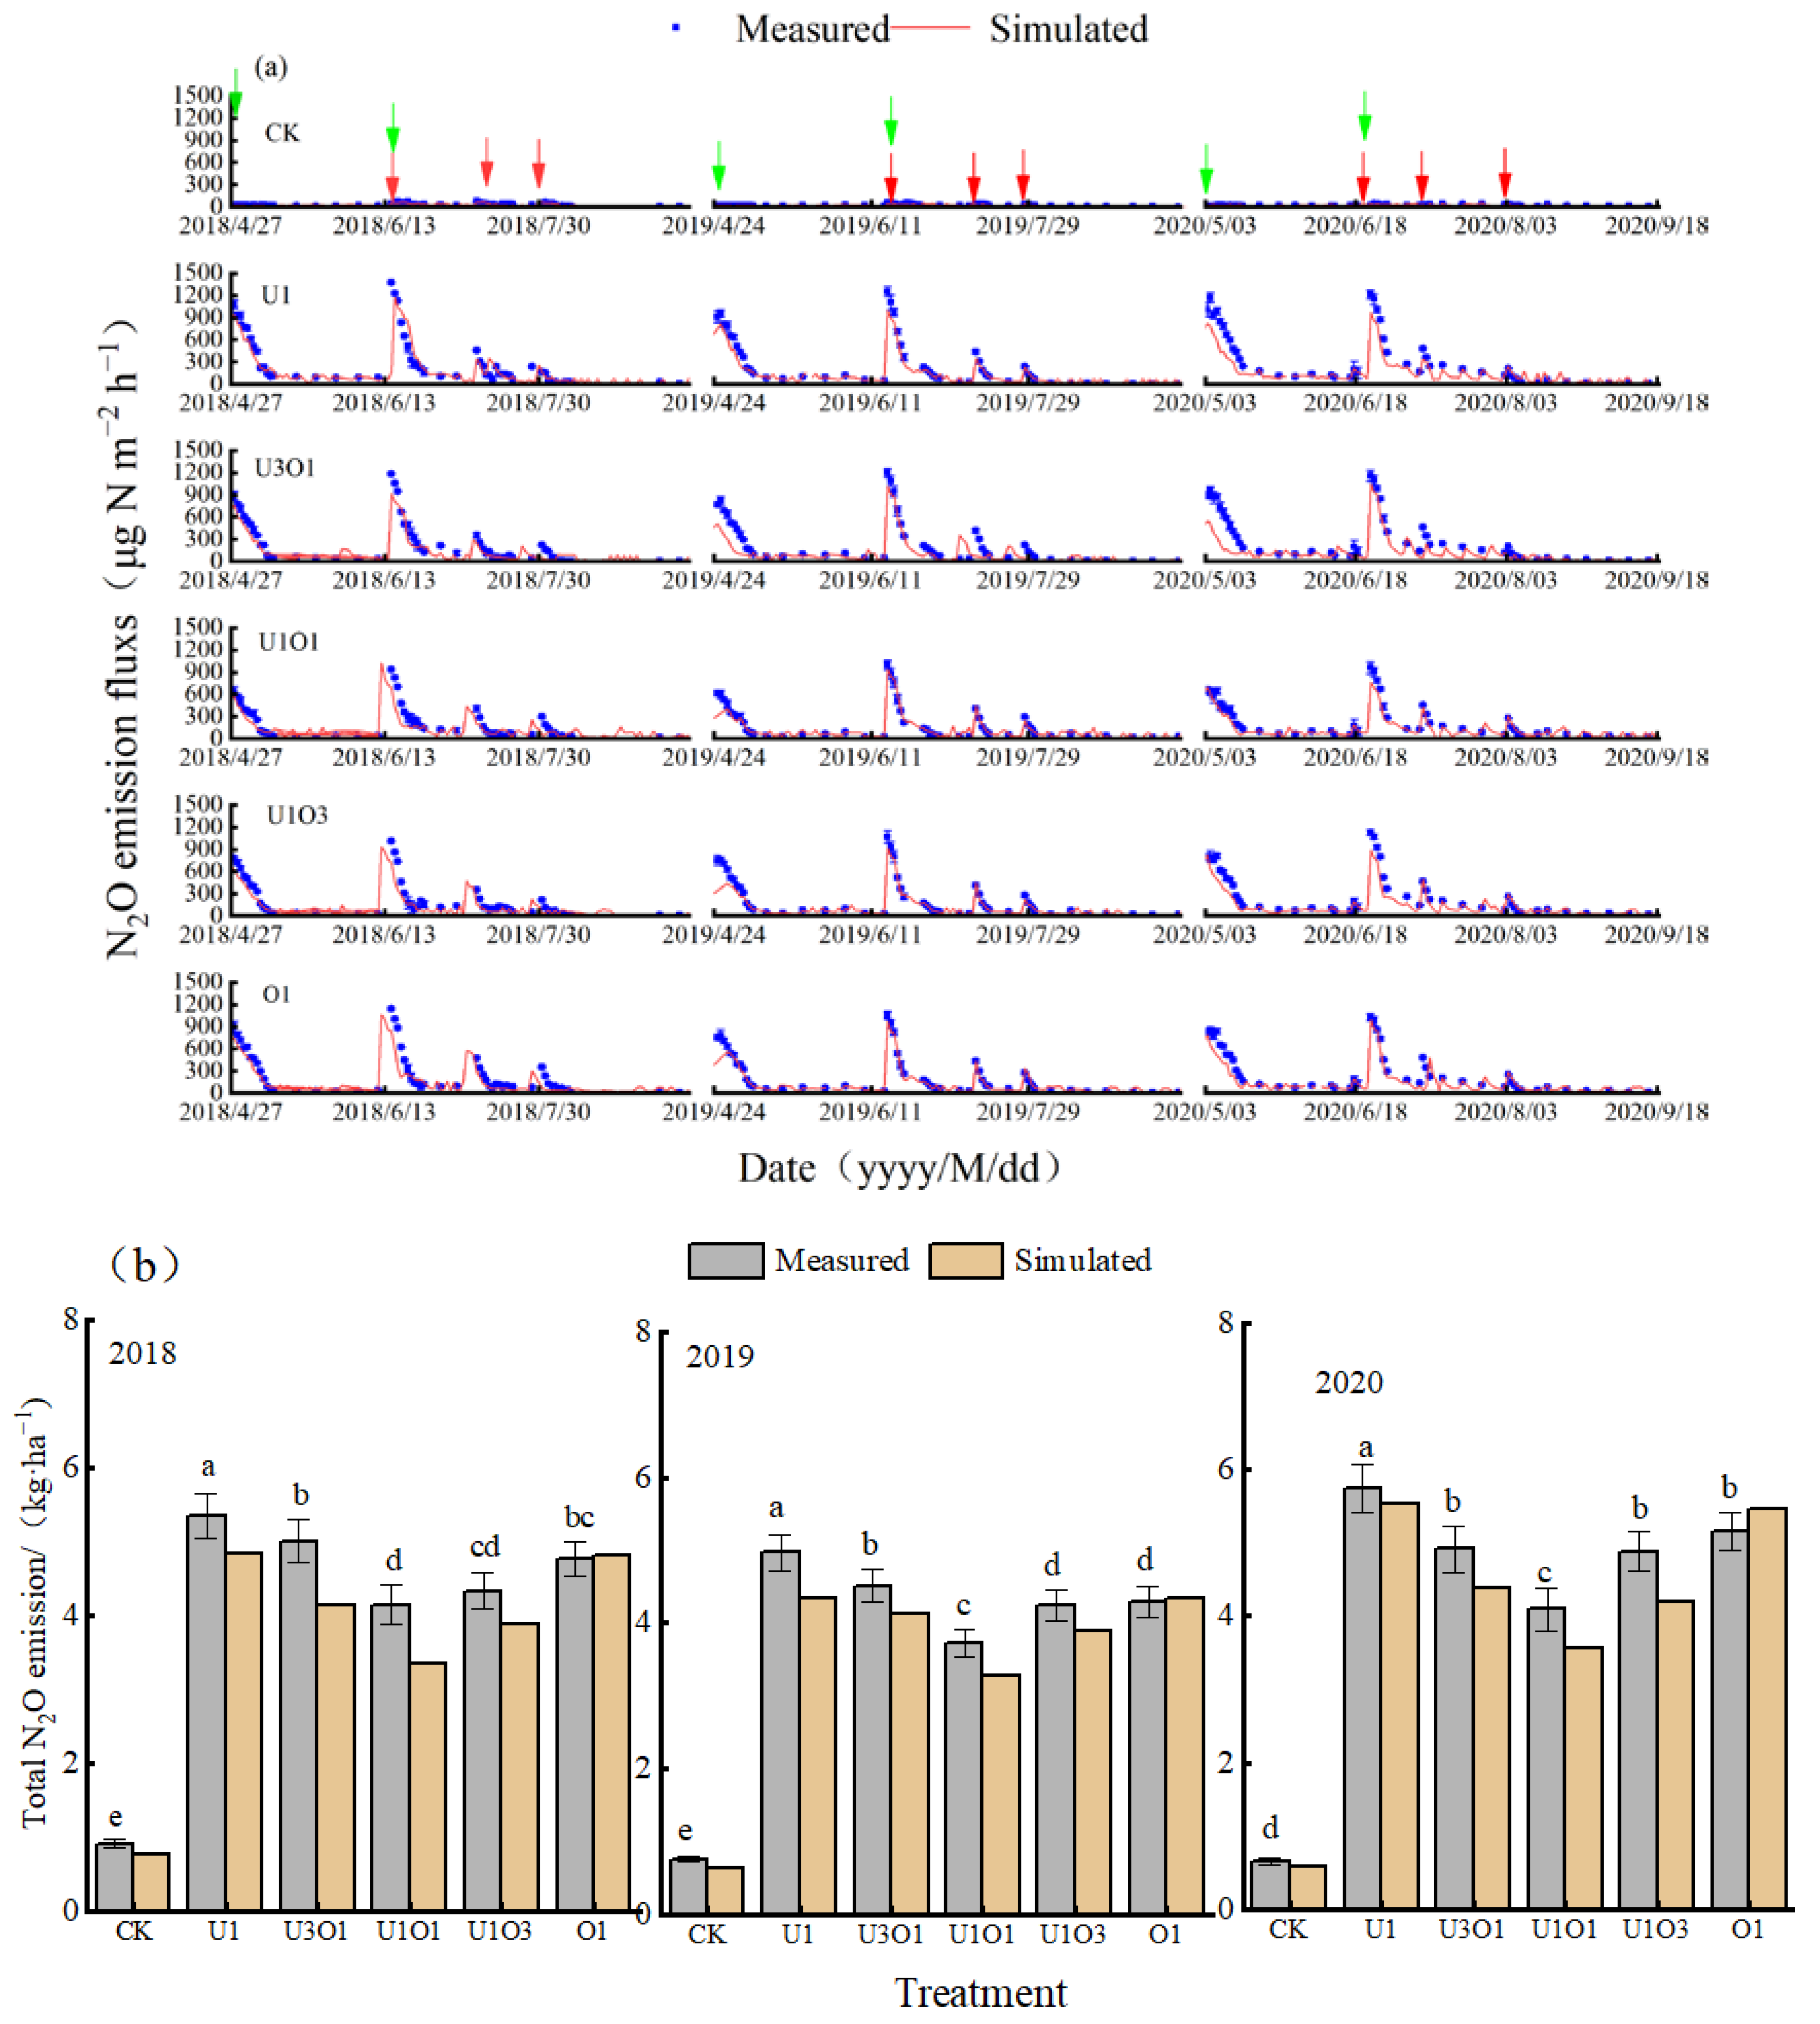
The N2O emission simulation results of the calibrated DNDC model are shown in Figure 5. Overall, the model had a good effect on the N2O emissions simulation. Statistical analysis showed (Table 6) that the R2 values of the N2O emission flux and cumulative emission of each treatment were in the ranges of 0.64–0.73 and 0.71–0.82, respectively; the MBE values were in the ranges of −235.39–50.56 μg (m2 h)−1 and −0.69–0.28 kg ha−1, respectively; the RMSE values were in the ranges of 2.4–65.56 and 0.8–4.33, respectively; the NRMSE values were in the ranges of 20.41–25.13% and 12.53–15.60%, respectively; the model simulation of N2O emission performance reached an acceptable level, and the simulation performance was fair.
Both the measured and simulated values indicated that during the entire maize-growing season (Figure 5a), there were two large emission peaks of N2O in each fertilizer application treatment, and they appeared after the application of the basal fertilizer and topdressing, respectively. The trend of change in emission flux was basically the same; that is, after the fertilizer was applied for 1–2 d, the emission peak was reached rapidly and then began to gradually decline. In the rest of the crop growth stage, the N2O emission flux of each treatment was maintained at a low level. The cumulative amount of N2O decreased first and then increased as the proportion of applied organic nitrogen increased (Figure 5b). The U1 treatment showed the largest value, and the three-year measured and simulated values were in the ranges of 4.97–6.03 kg ha−1 and 5.65–5.84 kg ha−1, respectively. The U1O1 treatment showed the lowest total N2O emissions, and the three-year measured and simulated values were in the ranges of 3.72–4.15 kg ha−1 and 3.28–4.36 kg ha−1, respectively. The measured value and simulated value of N2O accumulation in the U1O1 treatment of the three-year period decreased by 12.36%~34.25% and 17.69%~55.62%, respectively, compared with other fertilization treatments.

3.2. Maize Yield and Nitrogen-Containing Gas Emissions under Long-Term Combined Application of Organic–Inorganic Nitrogen

3.2.1. Maize Yield

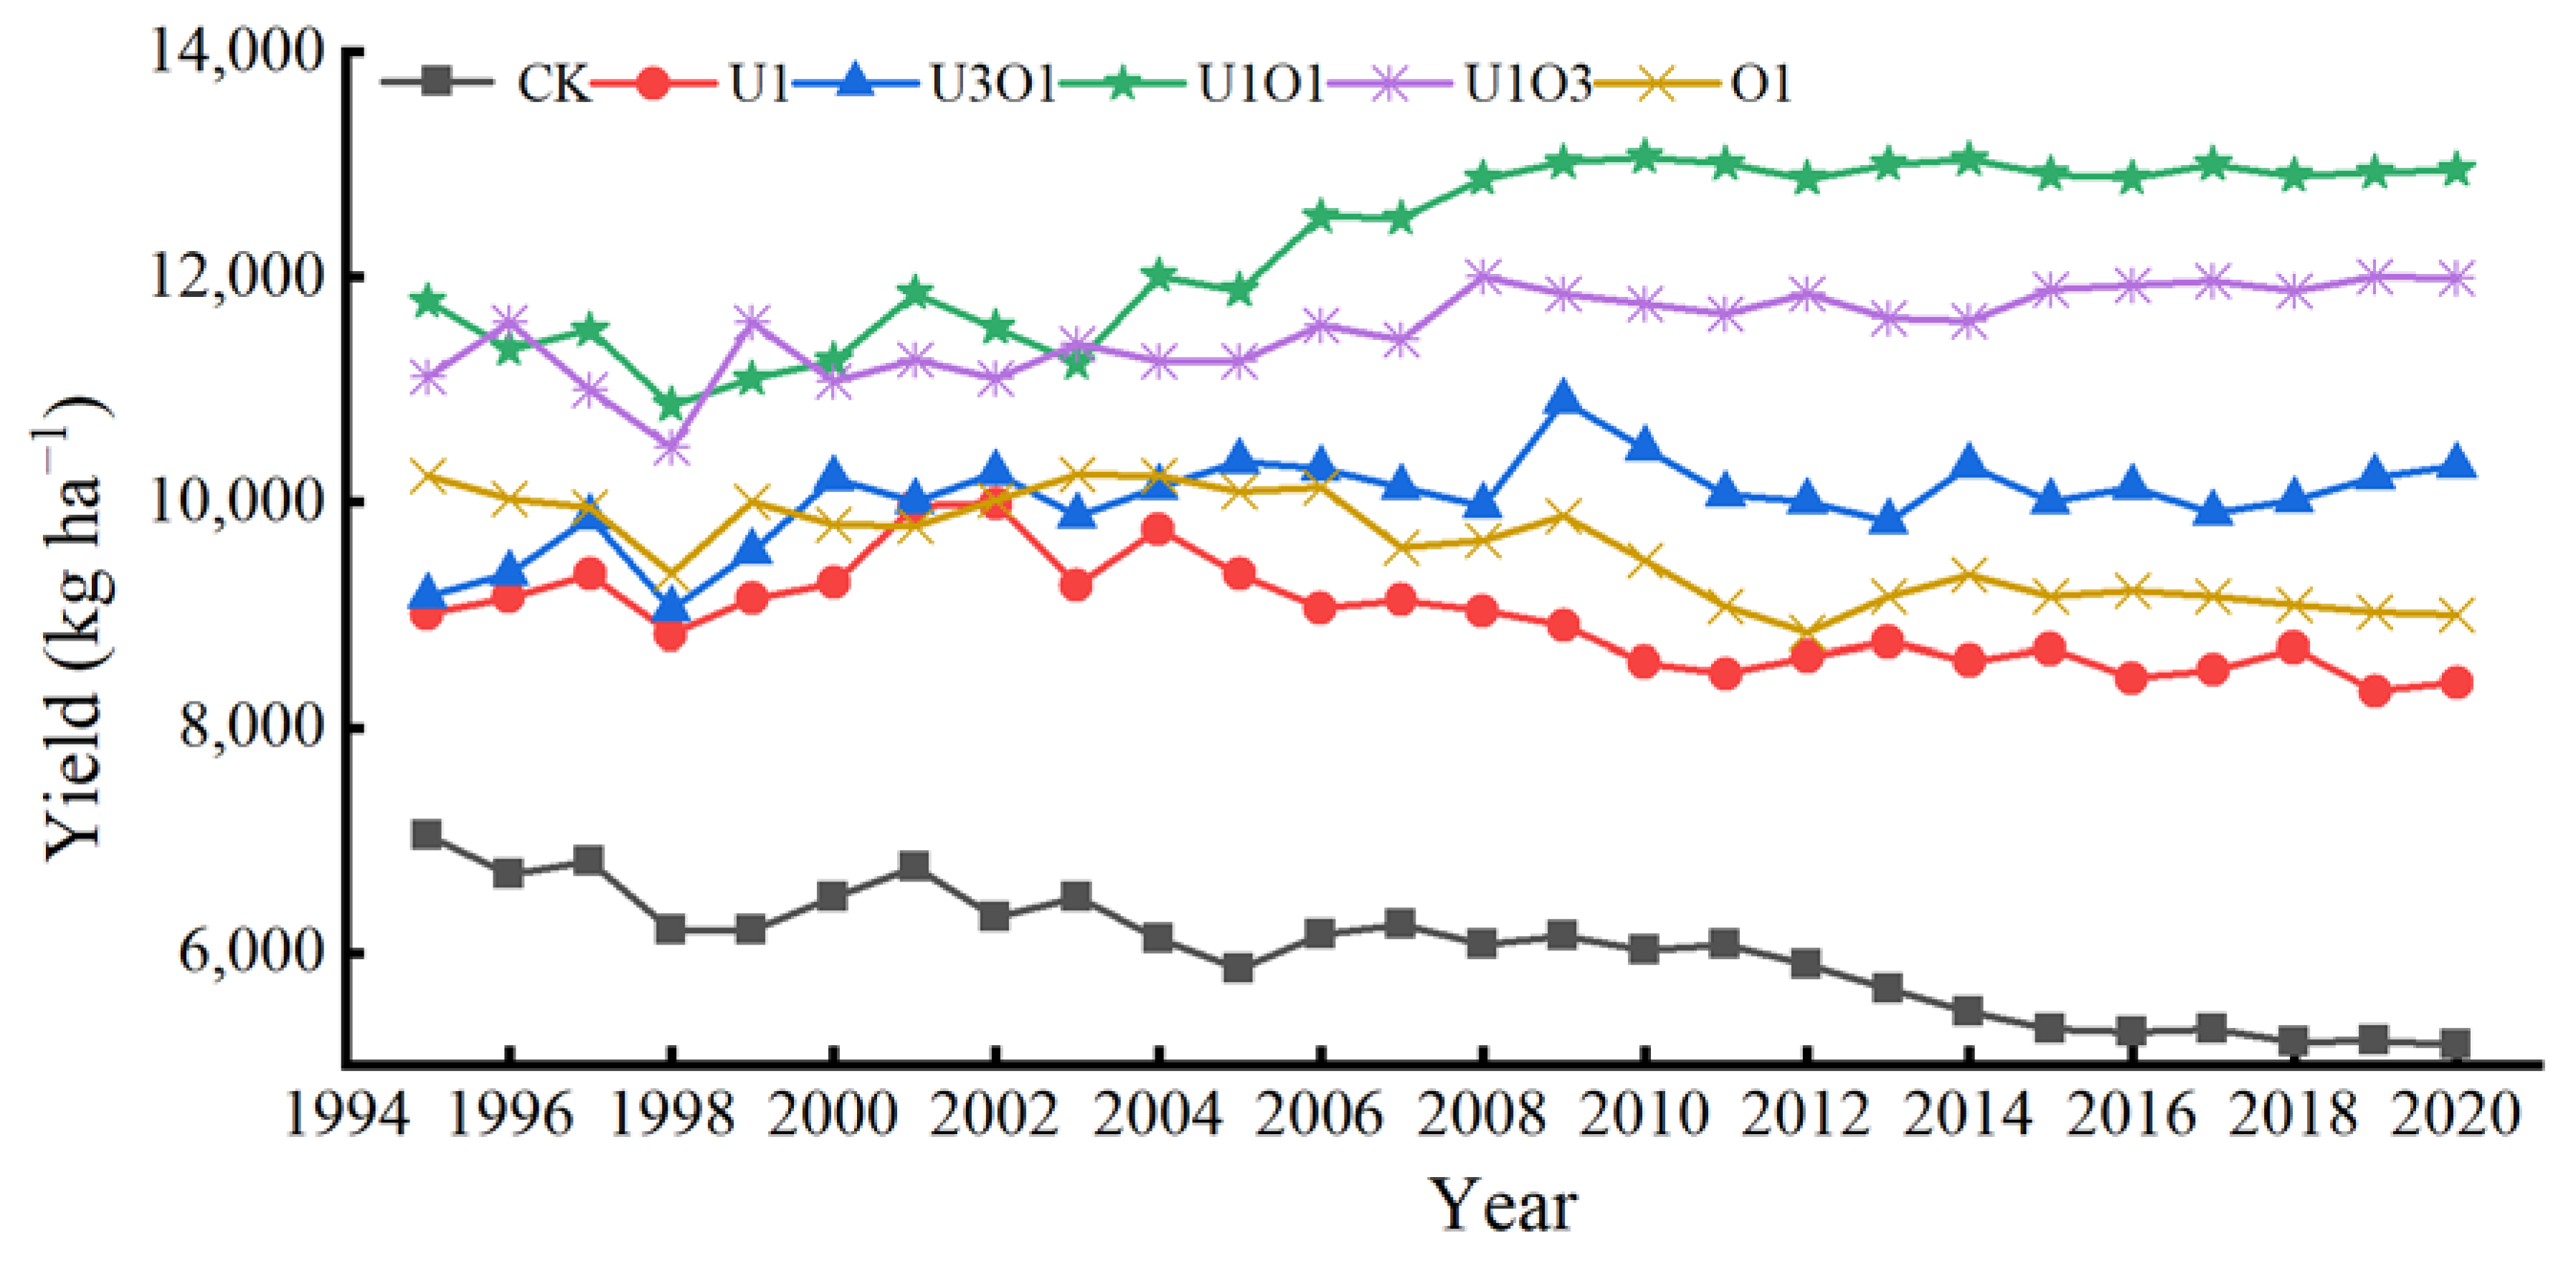
Through 26 consecutive years of spring maize cultivation, it was found that compared with the CK treatment, nitrogen application could considerably increase the maize yield (Figure 6). As shown from the dynamic changes in yield, the values of all treatments remained stable during the simulation period. The maize yield of the CK treatment was in the range of 5182.56–7046.84 kg ha−1. The annual dynamic changes varied across different nitrogen application treatments, and the maize yield ranged from 8480.64 to 13,063.54 kg ha−1. In general, the 25%, 50%, and 75% organic nitrogen substitution treatments showed a gradual upward trend with increasing years of fertilizer application, while the yields of the U1 and O1 treatments showed a gradual decline. In addition, this study also found that the combined application of organic nitrogen could increase the maize yield, and the yields of all treatments were in the descending order of U1O1 > U1O3 > O1 > U3O1 > U1 during the entire simulation period. The U1O1 treatment considerably increased the maize yield and ensured yield stability, obtaining values that were 15.69–55.31% higher than those of the U1 treatment.
Due to the slow effect of fertilizer application on crop growth, this study used an approximately five-year cycle and divided 1995–2020 into five periods to analyze yield changes (Table 7). It was found that the CK treatment could maintain crop yields in the first and second periods, but dropped to a low level in the subsequent third, fourth, and fifth periods. Among the various fertilizer application treatments, the yields of the U1O1 and U1O3 treatments were considerably higher than those of the other treatments throughout the simulation stage, which was 37.13% and 28.66% higher than that of the U1 treatment, respectively. The U3O1 treatment remained at basically the same level during the simulation period, in the range of 9396.81–10,326.48 kg ha−1. The maize yield of the O1 treatment was significantly higher than that of the U1 treatment in the first three periods, but both fell to the same level in the fourth and fifth periods. According to the average yields of many years, the appropriate ratio of organic–inorganic fertilizer nitrogen application (U1O1 and U1O3) could achieve the effect of increasing and stabilizing the yield, while the effect of a single application of organic nitrogen was minimal.

3.2.2. Emissions of Nitrogen-Containing Gases

The dynamic changes in nitrogen-containing gas (N2O, NH3, NO, and N2) emissions under different fertilizer application treatments simulated by the DNDC model are shown in Figure 7. It can be seen that nitrogen application could substantially increase the emissions of nitrogen-containing gases. N2O, NH3, and NO showed a trend of U1 > U3O1 > O1 > U1O3 > U1O1, and N2 showed an increasing trend as the proportion of organic nitrogen increased. The total emissions of nitrogen-containing gas from the U1O1 treatment decreased by 53.72% compared with the U1 treatment (26 years). For the annual variation in N2O emissions, with increasing years of fertilizer application, the values of the U1 treatment and U3O1 treatment showed a gradually increasing trend, and the fluctuation range was large (6.68–14.80 kg ha−1). The values of the other fertilizer application treatments showed a minor fluctuation in different years, and the variation range was 4.2–6.9 kg ha−1. The NH3 volatilization of various organic–inorganic nitrogen treatments changed slightly in different years, but the difference between different fertilizer application treatments was obvious. Overall, the U1 treatment showed the largest values at 18.22–22.42 kg ha−1, and the U1O1 treatment showed the smallest values at 11.49–16.97 kg ha−1. The trend of change in NO was similar to that of N2O. The value of the U1 treatment showed a gradual upward trend, and the inter-annual fluctuations were large, with the values in the range of 6.50–16.54 kg ha−1. The values of the organic nitrogen substitution treatments showed small fluctuations, with values in the range of 4.29–11.09 kg ha−1, and the U1O1 treatment in particular had the lowest emissions. Among the N2 emissions, the emissions of the CK treatment were relatively low, ranging from 0.50 to 0.92 kg ha−1. The inter-annual variability of the fertilizer application treatments was also small, with N2 emission values in the range of 2.34–6.15 kg ha−1, and the N2 emissions of the treatments showed a trend of increasing as the proportion of organic nitrogen increased.

4. Discussion

4.1. Model Performance

The DNDC model is based on the process mechanism and has been verified and applied in different agricultural ecosystems. For example, the DNDC model can effectively simulate maize yields and nitrate-nitrogen leaching [37], soil environmental factors under different management measures [36], and carbon and nitrogen emissions [37,38]. However, before using the DNDC model, the model needs to be verified. Different planting systems, due to differences in soil, climate, environment, and crop types, have great differences in soil nitrogen and carbon cycle parameters and hydrodynamic characteristics. Therefore, it is necessary to adjust the model parameters according to the characteristics of specific locations and calibrate and validate the model, thereby improving the accuracy of the model for the chemical conversion process of soil carbon and nitrogen [39,40]. In this study, U1 treatment data were used to verify the DNDC model. In other studies, most of the models have also been verified based on the measured data by optimal treatment, which is related to the model that is originally developed under optimized treatment [41]. The results of this study showed that the DNDC model had good overall consistency between the measured and simulated values of crop yield, soil temperature, WFPS, soil nitrate–nitrogen content, NH3 volatilization, and N2O emissions under different treatments (Figure 2, Figure 3, Figure 4 and Figure 5, Figures S1 and S2). However, there were still differences between the daily changes in the simulated values and measured values (Tables S1 and S2).
In this study, the DNDC model showed poor simulation performance for NO3-N in the soil surface (Figure 3). Overall, the model underestimated the NO3-N content in the 0–20 cm layer in each treatment. The control treatment did not have any nitrogen replenishment, so the soil nitrate–nitrogen mainly came from the decomposition of crop residues and the mineralized nitrogen of the soil itself. The reason for the underestimation of the measured value by the DNDC model is that this effect is not well predicted [36], and this is also the reason that the simulated value of fertilizer application treatment was lower than the measured value.
There is an apparent drive–response relationship of rainfall and fertilizer application with soil ammonia volatilization and N2O emission peaks, and seasonal changes can effectively reflect the dynamic change process of ammonia volatilization and N2O emission flux [42]. This paper used the DNDC model to simulate the ammonia volatilization and N2O emission fluxes of spring maize in the Hetao Irrigation District. The simulation results basically captured the large ammonia volatilization and N2O emission peaks caused by field irrigation/heavy rainfall and nitrogen fertilizer application. Both were relatively close to the peak value and appearance time of the main soil ammonia volatilization and N2O emission peaks. The model provided an effective fit for the changes in the field N2O emission fluxes during the growth period, which is consistent with the results of previous studies [1,35]. It should be pointed out that although the ammonia volatilization and N2O emissions from the soil in this area could be simulated accurately in general, the model still had some deviations. The amounts of simulated soil ammonia volatilization loss and soil N2O emission were generally low. One possible reason is that the depth of the groundwater of the Hetao Irrigation District is relatively shallow, and the depth of the groundwater during the three-year growth period was between 0.52 and 2.41 m. Phreatic water evaporation creates suitable soil environmental conditions for nitrogen volatilization and N2O emissions, and the model fails to predict this effect well. In addition, combined with the results of soil mineralized nitrogen content, it can be seen that the DNDC model ignored the decomposition effect of crop residues, and, as a result, the simulated total emissions of each fertilizer application treatment underestimated the measured value.

4.2. Maize Yield under Long-Term Combined Application of Organic–Inorganic Nitrogen

The sustainability of crop yields is an important component of sustainable agricultural production. Studying the characteristics of changes in crop yields under long-term fertilizer application can provide theoretical support for the sustainable development of agriculture. This study showed that the yield of crops without nitrogen application treatment could be maintained at a high level within 10 years. This is because, under high soil fertility, crop yields can be maintained at a high level in a short period of time even without fertilizer application [17], and the subsequent crop yields may be reduced due to insufficient fertility. Manna et al. [16] found that the yield of a single application of inorganic nitrogen treatment was considerably higher than that of a single application of organic nitrogen treatment at the beginning of the experiment. After long-term fertilizer application, the yield of a single application of organic nitrogen treatment could reach or exceed that of a single application of inorganic nitrogen treatment [16]. However, this study found that even at the initial stage of the experiment, the yield of a single application of organic nitrogen was higher than that of a single application of inorganic nitrogen. The reasons may be as follows. (1) The background value of soil nitrogen at this experimental site is relatively high, allowing for the production of a large number of available nutrients. (2) The organic nitrogen content selected in this study was 10%, and the mineralization process will produce more inorganic nitrogen for crops to absorb. However, this study also found that with the extension of the fertilizer application time, the yields of a single application of organic nitrogen and a single application of inorganic nitrogen showed a downward trend, which also confirms that the reasonable combined application of organic–inorganic nitrogen can increase the sustainability of crop yields.
Through 30 consecutive years of the combined application of organic–inorganic fertilizers, Lv et al. [36] showed that a substitution ratio of 25–75% could ensure high crop yields. Similarly, research by Brilli et al. [29] also showed that the substitution of 25% and 50% of chemical fertilizers by organic fertilizers could ensure high and stable crop yields, but continuing to increase the substitution ratio would result in reduced production. The present study revealed that when the proportion of organic nitrogen was 50%, it was the most conducive to increasing and stabilizing crop yields. The reason can be attributed to the fact that in the early stage of maize growth, inorganic fertilizers are needed to supply appropriate amounts of quick-acting nutrients to meet the growing needs of crops, but the excessive application of inorganic fertilizer will cause wastage. Therefore, the use of organic nitrogen to replace part of the inorganic nitrogen can reduce the loss of volatilization and leaching caused by the excessive accumulation of mineral nitrogen in the early stage. In the late stage of crop growth, the continuous mineralization of organic fertilizer can stably release inorganic nitrogen for crop absorption and utilization. The U1O1 treatment could better regulate and control the soil nitrogen retention and release, and coordinate the soil nitrogen supply [17], which not only meets the nutrient requirements of the crop growth period but also maintains soil fertility for a long time. In previous studies, we found that the U1O1 treatment could better promote the absorption and utilization of nitrogen, thereby increasing production [43]. The difference in the test results may be related to the soil fertility status and climatic conditions. Therefore, fertilizer application, especially the reasonable combined application of organic–inorganic nitrogen, can substantially improve the sustainability of crop yields [44].

4.3. Emissions of Nitrogen-Containing Gas under Long-Term Combined Application of Organic–Inorganic Nitrogen

Generally, it is believed that the application of organic fertilizers can improve soil characteristics as well as adjust the mineralization and fixation of soil nitrogen. These processes can change the nitrification and denitrification reaction processes in the soil [45,46]. This study indicated that, compared with the application of inorganic nitrogen alone, the combined application of organic nitrogen could reduce soil N2O and NO emissions. This is consistent with the results of other experiments on the effect of the combined application of organic–inorganic fertilizers on N2O [47,48] and NO [49] emissions. The reason may be that the application of appropriate amounts of organic fertilizers can improve the physicochemical properties of the soil and promote nitrogen retention by soil microorganisms. In the middle and late stages of crop growth, the death of microorganisms is accompanied by the release of nitrogen in the body, which can better meet the nitrogen demand of crops during the growing season of maize, so that the conversion of nitrogen to N2O can be effectively reduced under the same nitrogen application rate [50,51]. The present study also indicated that a single application of organic nitrogen could also considerably reduce the N2O emissions compared with a single application of inorganic nitrogen. First, the application of organic fertilizer improved the inorganic process of heterotrophic nitrification [52]; second, the application of organic fertilizer provided energy for denitrifying bacteria and promoted the reduction of N2O to N2, thereby reducing N2O emissions [53].
N2 is the final product of the denitrification reaction. Due to the high background value of atmospheric N2 and the high temporal and spatial variability of the denitrification process itself, the existing techniques to measure N2 are limited. Currently, there is no report on the N2 emissions of farmland soil under the combined application of organic–inorganic fertilizers. Via model simulation, this paper found that N2 emissions increased as the proportion of applied organic nitrogen increased. This may be because the long-term application of organic fertilizer not only increases the copy numbers of nirS and nosZ genes, but also has obvious effects in increasing the copy number of nirK genes [54]. Therefore, increasing the proportion of organic nitrogen will make the denitrification process more complete, leading to an increase in the amount of final product N2 emitted, which further proves that the combined application of organic fertilizers can reduce N2O emissions.
The results of this study showed that ammonia volatilization loss from the combined application of organic–inorganic nitrogen was substantially lower than that of a single application of inorganic nitrogen, while a single application of organic nitrogen could not effectively inhibit soil ammonia volatilization. This is mainly due to the different reactions that urea and organic fertilizers undergo. Under the action of soil urease, urea is hydrolyzed to NH4HCO3 and then quickly converted to NH4+-N, which provides a sufficient substrate for ammonia volatilization, resulting in the ammonia volatilization loss of pure inorganic nitrogen treatment being higher than that of other treatments [55]. Meanwhile, during the decomposition process of the organic matter in the organic fertilizer, a large number of organic acids are released and humus is formed, which inhibits the increase in soil pH during the hydrolysis of urea, thereby considerably inhibiting the volatilization of soil ammonia [56]. In addition, the combined application of organic fertilizers and inorganic fertilizers can promote soil microbial activities, fix soil inorganic nitrogen in the organic nitrogen pool, and reduce the amount of inorganic nitrogen that produces ammonia, thereby reducing the ammonia volatilization loss [57]. Under the single application of organic nitrogen with an equal amount of nitrogen, various forms of organic nitrogen are converted into NH4+-N through mineralization. Except for those being absorbed and used by crops and adsorbed by soil, most of the remaining NH4+-N is volatilized in the form of ammonia [58], which cannot effectively reduce ammonia volatilization loss.
In general, nitrogen-containing gas emissions are not only related to fertilization but are also affected by general climate trends and inter-annual variability. Previous studies have shown that increases in temperature lead to an increase in N2O emissions, and rain-fall patterns also have a significant impact on nitrogen-containing gas emissions [36]. In this study, the emissions of nitrogen-containing gas changed dynamically with time, and there was no significant correlation with temperature or rainfall (Figure 7). This was mainly related to the climatic conditions and soil properties in the study area, as the study area belongs to an arid area, and the average annual rainfall during the simulation period was only 103.59 mm. Furthermore, the soil nitrogen was relatively low. Therefore, the water and nitrogen conditions strongly limited the soil nitrogen emissions (Figure 4 and Figure 5), and so the impact of temperature and rainfall on nitrogen-containing gas emissions was limited. Additionally, soil nitrogen gas emissions are affected by the soil pH value, and an alkaline pH value is more conducive to soil nitrification and denitrification. The soil pH value in this study area was 8.2, which also led to higher nitrogen gas loss in this study compared with other acidic pH soils [59].
Although the model fully simulated the emissions of nitrogen-containing gases, the reliability of the simulated N2 emissions was still uncertain due to the technical limitations of the measurement, which hindered the comprehensive evaluation of the model performance [30]. Therefore, further research and technological innovation are needed to obtain more reliable data of N2O, NH3, NO, and N2 to better estimate the loss of nitrogen-containing gases in the soil. In this study, we only selected the local representative variety ‘Neidan 314′ for the experiment. However, the use of different varieties has played a key role in improving maize productivity [60]. Currently, many varieties of maize have been produced, each with specific management practices and climatic requirements that are needed for them to reach their full genetic potential. Therefore, a comparison of varieties for growth and nitrogen utilization characteristics under various nutrient management regimes is necessary [61]. In this study, we only used long-term historical meteorological data to simulate the yield and nitrogen gas loss under the combined application of organic and inorganic fertilizers. However, the physiological processes of crops are strongly influenced by environmental changes, and future climate change will bring great challenges to food security [62]. Therefore, the applicability of organic–inorganic fertilizers in the Hetao Irrigation District under future climate change should be further studied.

5. Conclusions

The verified DNDC model could be successfully applied to the Hetao Irrigation Dis-trict to simulate the complex interaction between different processes in the soil–plant–atmosphere system. Long-term simulations found that 50% substitution of urea fertilizer with organic fertilizer could maintain high and stable crop yields. In addition, the annual NH3, N2O, and NO emissions under organic fertilizer substitution were lower than those under urea fertilization alone during the 26-year simulation period. Based on crop yield and nitrogen-containing gas emission parameters, organic nitrogen substitution of 50% urea nitrogen is reasonable for maize cropping systems under the recommended fertilization management in the tested environment. This may help the government to set up rational policies for sustainable crop production in China and other similar regions.

Supplementary Materials

The following supporting information can be downloaded at: https://www.mdpi.com/article/10.3390/agronomy13030848/s1, Figure S1: The modeled and measured soil temperature under different treatments; Figure S2: The modeled and measured soil WFPS under different treatments; Table S1: Statistical evaluation of model simulation of soil temperature from different treatments in 2018–2020; Table S2: Statistical evaluation of model simulation of WFPS from different treatments in 2018–2020.

Author Contributions

H.Z. and J.W. designed the research and prepared the manuscript. The data were prepared by H.Z., Y.W. and H.L. (Hu Liu); H.L. (Hongfang Li), J.W. and J.G. helped to revise the manuscript. The manuscript was checked by J.W., H.L. (Hu Liu), Y.W. and H.L. (Hongfang Li). All authors have read and agreed to the published version of the manuscript.

Funding

This research was funded by the Yinshanbeilu Grassland Eco-Hydrology National Observation and Research Station, China Institute of Water Resources and Hydropower Research (MK2023J03), the Science and Technology Plan Program of Inner Mongolia Autonomous Region (2021GG0060, 2020GG0181, 2019GG027), and the Natural Science Foundation of Inner Mongolia Autonomous Region, China (2022QN04003).

Data Availability Statement

The data presented in this study are available on request from the corresponding author.

Conflicts of Interest

The authors declare no conflict of interest.

References

  1. Li, G.; Zhao, B.; Dong, S.; Zhang, J.; Liu, P.; Vyn, T.J. Interactive effects of water and controlled release urea on nitrogen metabolism, accumulation, translocation, and yield in summer maize. Sci. Nat. 2017, 72, 2–12. [Google Scholar] [CrossRef] [PubMed]
  2. Zhu, S.; Vivanco, J.M.; Manter, D.K. Nitrogen fertilizer rate affects root exudation, the rhizosphere microbiome and nitrogen-use-efficiency of maize. Appl. Soil Ecoll. 2016, 7, 324–333. [Google Scholar] [CrossRef] [Green Version]
  3. Ahmed, M.; Rauf, M.; Mukhtar, Z.; Saeed, N.A. Excessive use of nitrogenous fertilizers: An unawareness causing serious threats to environment and human health. Environ. Sci. Pollut. R. 2017, 24, 26983–26987. [Google Scholar] [CrossRef]
  4. Huang, Y.; Tang, Y. An estimate of greenhouse gas (N2O and CO2) mitigation potential under various scenarios of nitrogen use efficiency in Chinese croplands. Glob. Chang. Biol. 2010, 16, 2958–2970. [Google Scholar] [CrossRef]
  5. Liu, H.M.; Pang, F.J.; Lan, X.; Yang, D.L. Effects of nitrogen fertilizer rate and combined application of organic manure and chemical fertilizer on soil ammonia volatilization in winter-wheat field. J. Anhui Agric. Sci. 2012, 40, 7119–7122. [Google Scholar]
  6. Ting, L.; He, X.Q.; Wang, Q.; Deng, O.P.; Zhou, W.; Luo, L.; Chen, G.D.; Zeng, J.; Yuan, S.; Zeng, M.; et al. Synergistic effects of biological nitrification inhibitor, urease inhibitor, and biochar on NH3 volatilization, N leaching, and nitrogen use efficiency in a calcareous soil–wheat system. Appl. Soil Ecol. 2022, 174, 104412. [Google Scholar]
  7. Seinfeld, J.H.; Pandis, S.N. Atmospheric Chemistry and Physics: From Air Pollution to Climate Change; John Wiley & Sons, Inc.: New York, NY, USA, 2006. [Google Scholar]
  8. Feng, Y.Y.; Feng, Y.F.; Liu, Q.; Chen, S.; Hou, P.F.; Gerrard, P.; Jiang, Z.T.; Derek, F.; Xue, L.H.; Su, S.L.; et al. How does biochar aging affect NH3 volatilization and GHGs emissions from agricultural soils? Environ. Pollut. 2021, 294, 118598. [Google Scholar] [CrossRef]
  9. Rosa, M.C.B.; Óscar, V.G.; Emilio, J.; Rafaela, O.F.; Manuel, M.G.; Miguel, A.; Repullo-Ruibérriz, D.T. Soil management, irrigation and fertilisation strategies for N2O emissions mitigation in mediterranean agricultural systems. Agronomy 2022, 12, 104412. [Google Scholar]
  10. Davidson, E.A. The contribution of manure and fertilizer nitrogen to atmospheric nitrous oxide since 1860. Nat. Geosci. 2009, 2, 659–662. [Google Scholar] [CrossRef]
  11. Erisman, J.W.; Sutton, M.A.; Galloway, J.; Klimont, Z.; Winiwarter, W. How a century of ammonia synthesis changed the world. Nat. Geosci. 2008, 1, 636–639. [Google Scholar] [CrossRef]
  12. Smith, L.E.D.; Siciliano, G.A. Comprehensive review of constraints to improved management of fertilizers in China and mitigation of diffuse water pollution from agriculture. Agr. Ecosyst. Environ. 2015, 1, 15–25. [Google Scholar] [CrossRef] [Green Version]
  13. Li, S.; Li, Y.B.; Li, X.S.; Zhao, A.Q.; Wang, S.J. Effect of straw management on carbon sequestration and grain production in a maize-wheat cropping system in Anthrosol of the Guanzhong Plain. Soil Till. Res. 2016, 157, 43–51. [Google Scholar] [CrossRef]
  14. Baruah, A.; Baruah, K.K.; Bhattacharyya, P. Comparative Effectiveness of Organic Substitution in Fertilizer Schedule: Impacts on Nitrous Oxide Emission, Photosynthesis, and Crop Productivity in a Tropical Summer Rice Paddy. Water Air Soil Poll. 2016, 227, 410–416. [Google Scholar] [CrossRef]
  15. Guo, L.Y.; Wu, G.L.; Li, Y.; Li, C.H.; Liu, W.J.; Meng, J.; Liu, H.; Fan, X.Y.; Jiang, G.M. Effects of cattle manure compost combined with chemical fertilizer on topsoil organic matter, bulk density and earthworm activity in a wheat-maize rotation system in Eastern China. Soil Till. Res. 2016, 156, 140–147. [Google Scholar] [CrossRef]
  16. Manna, M.C.; Swarup, A.; Wanjari, R.H.; Ravankar, H.N.; Mishra, B.; Saha, M.N.; Singh, Y.V.; Saha, D.K.; Sarap, P.A. Long-term effect of fertilizer and manure application on soil organic carbon storage, soil quality and yield sustainability under sub-humid and semi-arid tropical India. Field Crop. Res. 2005, 93, 264–280. [Google Scholar] [CrossRef]
  17. Yadav, R.L.; Dwivedi, B.S.; Prasad, K.; Tomar, O.K.; Shurpali, N.J.; Pandey, P.S. Yield trends, and changes in soil organic-C and available NPK in a long-term rice-wheat system under integrated use of manures and fertilisers. Field Crop. Res. 2000, 68, 219–246. [Google Scholar] [CrossRef]
  18. Duncan, E.W.; Dell, C.J.; Kleinman, P.J.A.; Beegle, D.B. Nitrous oxide and ammonia emissions from injected and broadcast-applied dairy slurry. J. Environ. Qual. 2017, 46, 36–44. [Google Scholar] [CrossRef]
  19. Matsushima, M.; Lim, S.; Kwak, J.; Park, H.; Lee, S.; Lee, D.; Choi, W. Interactive effects of synthetic nitrogen fertilizer and composted manure on ammonia volatilization from soils. Plant Soil. 2009, 325, 187–196. [Google Scholar] [CrossRef]
  20. Li, L.; You, M.; Shi, H.; Ding, X.; Qiao, Y.; Han, X. Soil CO2 emissions from a cultivated Mollisol: Effects of organic amendments, soil temperature, and moisture. Eur. J. Soil Biol. 2013, 55, 83–90. [Google Scholar] [CrossRef]
  21. Yang, Q.L.; Liu, P.; Dong, S.T.; Zhang, J.W.; Zhao, B. Combined application of organic and inorganic fertilizers mitigates ammonia and nitrous oxide emissions in a maize field. Nutr. Cycl. Agroecosyst. 2020, 117, 13–27. [Google Scholar] [CrossRef]
  22. Cui, F.; Yan, G.X.; Zhou, Z.X.; Zheng, X.H.; Deng, J. Annual emissions of nitrous oxide and nitric oxide from a wheat–maize cropping system on a silt loam calcareous soil in the North China Plain. Soil Biol. Biochem. 2012, 48, 10–19. [Google Scholar] [CrossRef]
  23. Jain, N.; Arora, P.; Tomer, R.; Mishra, S.V.; Bhatia, A.; Pathak, H.; Chakraborty, D.; Kumar, V.; Dubey, D.S.; Harit, R.C.; et al. Greenhouse gases emission from soils under major crops in Northwest India. Sci. Total Environ. 2016, 542, 551–561. [Google Scholar] [CrossRef]
  24. Van Groenigen, J.W.; Velthof, G.L.; Oenema, O.; Van Groenigen, K.J.; Van Kessel, C. Towards an agronomic assessment of N2O emissions: A case study for arable crops. Eur. J. Soil Sci. 2010, 61, 903–913. [Google Scholar] [CrossRef]
  25. Liu, X.M.; Gu, W.R.; Li, C.F.; Li, J.; Wei, S. Effects of nitrogen fertilizer and chemical regulation on spring maize lodging characteristics, grain filling and yield formation under high planting density in Heilongjiang Province, China-ScienceDirect. J. Integr. Agric. 2021, 20, 511–526. [Google Scholar] [CrossRef]
  26. Qiu, J.J.; Li, H.; Wang, L.G.; Tang, H.J.; Li, C.S.; Van Ranst, E. GIS-model based estimation of nitrogen leaching from croplands of China. Nutr. Cycl. Agroecosyst. 2011, 90, 243–252. [Google Scholar] [CrossRef]
  27. Cui, M.; Sun, X.; Hu, C.; Di, H.; Tan, Q.; Zhao, C. Effective mitigation of nitrate leaching and nitrous oxide emissions in intensive vegetable production systems using a nitrification inhibitor, dicyandiamide. J. Soils Sediments 2011, 11, 722–730. [Google Scholar] [CrossRef]
  28. Li, H.; Wang, L.; Qiu, J.; Li, C.; Gao, M.; Gao, C. Calibration of DNDC model for nitrate leaching from an intensively cultivated region of Northern China. Geoderma 2014, 223–225, 108–118. [Google Scholar] [CrossRef]
  29. Brilli, L.; Bechini, L.; Bindi, M.; Carozzi, M.; Cavalli, D.; Conant, R.; Dorich, C.D.; Doro, L.; Ehrhardt, F.; Farina, R.; et al. Review and analysis of strengths and weaknesses of agro-ecosystem models for simulating C and N fluxes. Sci. Total Environ. 2017, 598, 445–470. [Google Scholar] [CrossRef] [Green Version]
  30. Butterbach-Bahl, K.; Baggs, E.M.; Dannenmann, M.; Kiese, R.; Zechmeister-Boltenstern, S. Nitrous oxide emissions from soils: How well do we understand the processes and their controls? Philos. Trans. R. Soc. B Biol. Sci. 2013, 368, 20130122. [Google Scholar] [CrossRef]
  31. Giltrap, D.L.; Li, C.; Saggar, S. DNDC: A process-based model of greenhouse gas fluxes from agricultural soils. Agric. Ecosyst. Environ. 2010, 136, 292–300. [Google Scholar] [CrossRef]
  32. Li, Z.; Shi, H.B.; Li, X.Y.; Yan, J.W. Ammonia volatilization in soil and grain yield of the spring maize under different water-nitrogen management regimes. J. Agro-Environ. Sci. 2017, 36, 799–807. [Google Scholar]
  33. Diacono, M.; Montemurro, F. Long-term effects of organic amendments on soil fertility (A review). Agron. Sustain. Dev. 2010, 30, 401–422. [Google Scholar] [CrossRef] [Green Version]
  34. Wang, Z.H.; Liu, X.J.; Ju, X.T.; Zhang, F.S. Field in situ determination of ammonia volatilization from soil: Venting method. Plant Nutr. Fertil. Sci. 2002, 8, 205–209. [Google Scholar]
  35. Hutchinson, G.L.; Livingston, G.P. Use of Chamber Systems to Measure Trace Gas Fluxes; ASA Special Publication: Madison, WI, USA, 1993; Volume 41, pp. 63–78. [Google Scholar]
  36. Lv, F.L.; Song, J.S.; Giltrp, D.; Feng, Y.T.; Yang, X.Y.; Zhang, S.L. Crop yield and N2O emission affected by long-term organic manure substitution fertilizer under winter wheat-summer maize cropping system. Sci. Total Environ. 2020, 732, 9684–9697. [Google Scholar] [CrossRef]
  37. Zhang, W.; Liu, C.Y.; Zheng, X.H.; Zhou, Z.X.; Cui, F. Comparison of the DNDC, Landscape DNDC and IAP-N-GAS models for simulating nitrous oxide and nitric oxide emissions from the winter wheat-summer maize rotation system. Agr. Syst. 2015, 140, 1–10. [Google Scholar] [CrossRef]
  38. Chirinda, N.; Kracher, D.; Mette, L.; Porter John, R.; Olesen, J.E.; Petersen, B.M.; Doltra, J.K.; Klaus, B. Simulating soil N2O emissions and heterotrophic CO2 respiration in arable systems using FASSET and Mo Bi LE-DNDC. Plant. Soil. 2011, 343, 139–160. [Google Scholar] [CrossRef]
  39. Li, C.F.; Zhou, D.N.; Kou, Z.K.; Zhang, Z.S.; Wang, J.P.; Cai, M.L.; Cao, C.G. Effects of tillage and nitrogen fertilizers on CH4 and CO2 emissions and soil organic carbon in paddy fields of central China. PLoS ONE 2012, 7, e34642. [Google Scholar]
  40. Yang, J.M.; Yang, J.Y.; Liu, S.; Hoogenboom, G. An evaluation of the statistical methods for testing the performance of crop models with observed data. Agr. Syst. 2014, 127, 81–89. [Google Scholar] [CrossRef]
  41. Shaukat, M.; Muhammad, S.; Maas, E.; Khaliq, T.; Ahmad, A. Predicting methane emissions from paddy rice soils under biochar and nitrogen addition using dndc model. Ecol. Model. 2022, 466, 10896. [Google Scholar] [CrossRef]
  42. Babu, Y.J.; Li, C.; Frolking, S.; Adhya, T.K. Field validation of DNDC model for methane and nitrous oxide emission from rice-based production systems of India. Nutr. Cycl. Agroecosyst. 2006, 74, 157–174. [Google Scholar] [CrossRef]
  43. Zhou, H.; Shi, H.B.; Xu, Z.; Guo, J.W.; Fu, X.J.; Li, Z.Z. Effects of combined application of organic and inorganic fertilizers on nitrogen supply and crop water and nitrogen utilization in salinized soils. Trans. Chin. Soc. Agric. Mach. 2020, 51, 299–307. [Google Scholar]
  44. Xu, F.; Liu, Y.; Du, W.; Li, C.L.; Xu, M.L.; Xie, t.c.; Ying, Y.; Guo, H.G. Response of soil bacterial communities, antibiotic residuals, and crop yields to organic fertilizer substitution in North China under wheat-maize rotation. Sci. Total Environ. 2021, 785, 147248. [Google Scholar] [CrossRef]
  45. Cheng, H.G.; Zhang, D.Q.; Huang, B.; Song, Z.X.; Ren, L.R.; Hao, B.Q.; Liu, J.; Zhu, J.H.; Fang, W.S.; Yan, D.D.; et al. Organic fertilizer improves soil fertility and restores the bacterial community after 1,3-dichloropropene fumigation. Sci. Total Environ. 2020, 738, 140345. [Google Scholar] [CrossRef] [PubMed]
  46. Dimkpa, C.O.; Fugice, J.; Singh, U.; Lewis, T.D. Development of fertilizers for enhanced nitrogen use efficiency—Trends and perspectives. Sci. Total Environ. 2020, 731, 139113. [Google Scholar] [CrossRef] [PubMed]
  47. Shan, J.; Yan, X.Y. Effects of crop residue returning on nitrous oxide emissions in agricultural soils. Atmos. Environ. 2013, 71, 170–175. [Google Scholar] [CrossRef]
  48. Yao, Z.S.; Zheng, X.H.; Xie, B.H.; Mei, B.L.; Wang, R.; Butterbach-Bahl, K.; Zhu, J.G.; Yin, R. Tillage and crop residue management significantly affects N-trace gas emissions during the non-rice season of a subtropical rice-wheat rotation. Soil Biol. Biochem. 2009, 41, 2131–2140. [Google Scholar] [CrossRef]
  49. Zhang, H.M.; Yang, X.Y.; He, X.H.; Xu, M.G. Effect of long-term potassium fertilization on crop yield and potassium efficiency and balance under wheat-maize rotation in China. Pedosphere 2011, 21, 154–163. [Google Scholar] [CrossRef]
  50. Ding, W.X.; Lei, M.; Cai, Z.C.; Han, F.X. Effects of long-term amendment of organic manure and nitrogen fertilizer on nitrous oxide emission in a sandy loam soil. J. Environ. Sci. 2007, 19, 185–193. [Google Scholar] [CrossRef]
  51. Zhang, Y.L.; Zhang, J.; Shen, Q.R.; Wang, J.C. Effect of combined application of bioorganic manure and inorganic nitrogen fertilizer on soil nitrogen supplying characteristics. J. Appl. Ecol. 2002, 13, 1575–1578. [Google Scholar]
  52. Muller, C.; Stevens, R.J.; Laughlin, R.J. Evidence of carbon stimulated N transformations in grassland soil after slurry application. Soil Biol. Biochem. 2003, 35, 285–293. [Google Scholar] [CrossRef]
  53. Azam, F.; Muller, C.; Weiske, A.; Benckiser, G.; Ottow, J.C.G. Nitrification and denitrification as sources of atmospheric nitrous oxide-role of oxidizable carbon and applied nitrogen. Biol. Fert. Soils 2002, 35, 54–61. [Google Scholar]
  54. Tatti, E.; Goyer, C.; Zebarth, B.J.; Viti, C.; Burton, D.L. Short-term effects of mineral and organic fertilizer on denitrifiers, nitrous oxide emissions and denitrification in long-term amended vineyard soils. Soil Sci. Soc. Am. J. 2013, 77, 113–122. [Google Scholar] [CrossRef] [Green Version]
  55. Kira, O.; Shaviv, A.; Dubowski, Y. Direct tracing of NH3 and N2O emissions associated with urea fertilization approaches, using static incubation cells—ScienceDirect. Sci. Total Environ. 2019, 661, 75–85. [Google Scholar] [CrossRef] [PubMed]
  56. Zheng, F.X.; Dong, S.T.; Liu, P. Effects of combined application of manure and chemical fertilizers on ammonia volatilization loss and yield of winter wheat. J. Plant Nutr. Fert. 2017, 23, 567–577. [Google Scholar]
  57. Dong, W.X.; Hu, C.S.; Zhang, Y.M.; Cui, J.F. Ammonia Volatilization from Urea Incorporation with Wheat and Maize Straw on a Loamy Soil in China: The Proceedings of the International Plant Nutrition Colloquium XVI; University of California: Davis, CA, USA, 2009. [Google Scholar]
  58. Bhattarai, N.; Wang, S.; Xu, Q.; Dong, Z.X.; Chang, X.; Jiang, Y.Q.; Zheng, H.T. Sources of gaseous NH3 in urban Beijing from parallel sampling of NH3 and NH4+, their nitrogen isotope measurement and modeling. Sci. Total Environ. 2020, 747, 141361. [Google Scholar] [CrossRef] [PubMed]
  59. Guo, Y.J.; Ji, Y.Z.; Zhang, J.; Liu, Q.; Han, J.; Zhang, L.J. Effects of water and nitrogen management on N2O emissions and NH3 volatilization from a vineyard in North China. Agric. Water Manag. 2022, 266, 107601. [Google Scholar] [CrossRef]
  60. Chen, G.; Liu, H.; Zhang, J.; Liu, P.; Dong, S. Factors affecting summer maize yield under climate change in Shandong Province in the Huanghuaihai Region of China. Int. J. Biometeorol. 2012, 56, 621–629. [Google Scholar] [CrossRef]
  61. Dangi, K.; Singh, S.; Malviya, D.; Gautam, A.; Kanapuriya, N.; Kumar, B. Effect of Rice Varieties on Growth, Yield and Economics at Varying Levels of Nitrogen under Direct Seeded Upland Condition Rewa Region. Int. J. Curr. Microbiol. Appl. Sci. 2017, 6, 2313–2318. [Google Scholar] [CrossRef] [Green Version]
  62. Watson, J.; Zheng, B.Y.; Chapman, S.; Chenu, K. Projected impact of future climate on water-stress patterns across the Australian wheatbelt. J. Exp. Bot. 2017, 68, 5907–5921. [Google Scholar] [CrossRef] [Green Version]
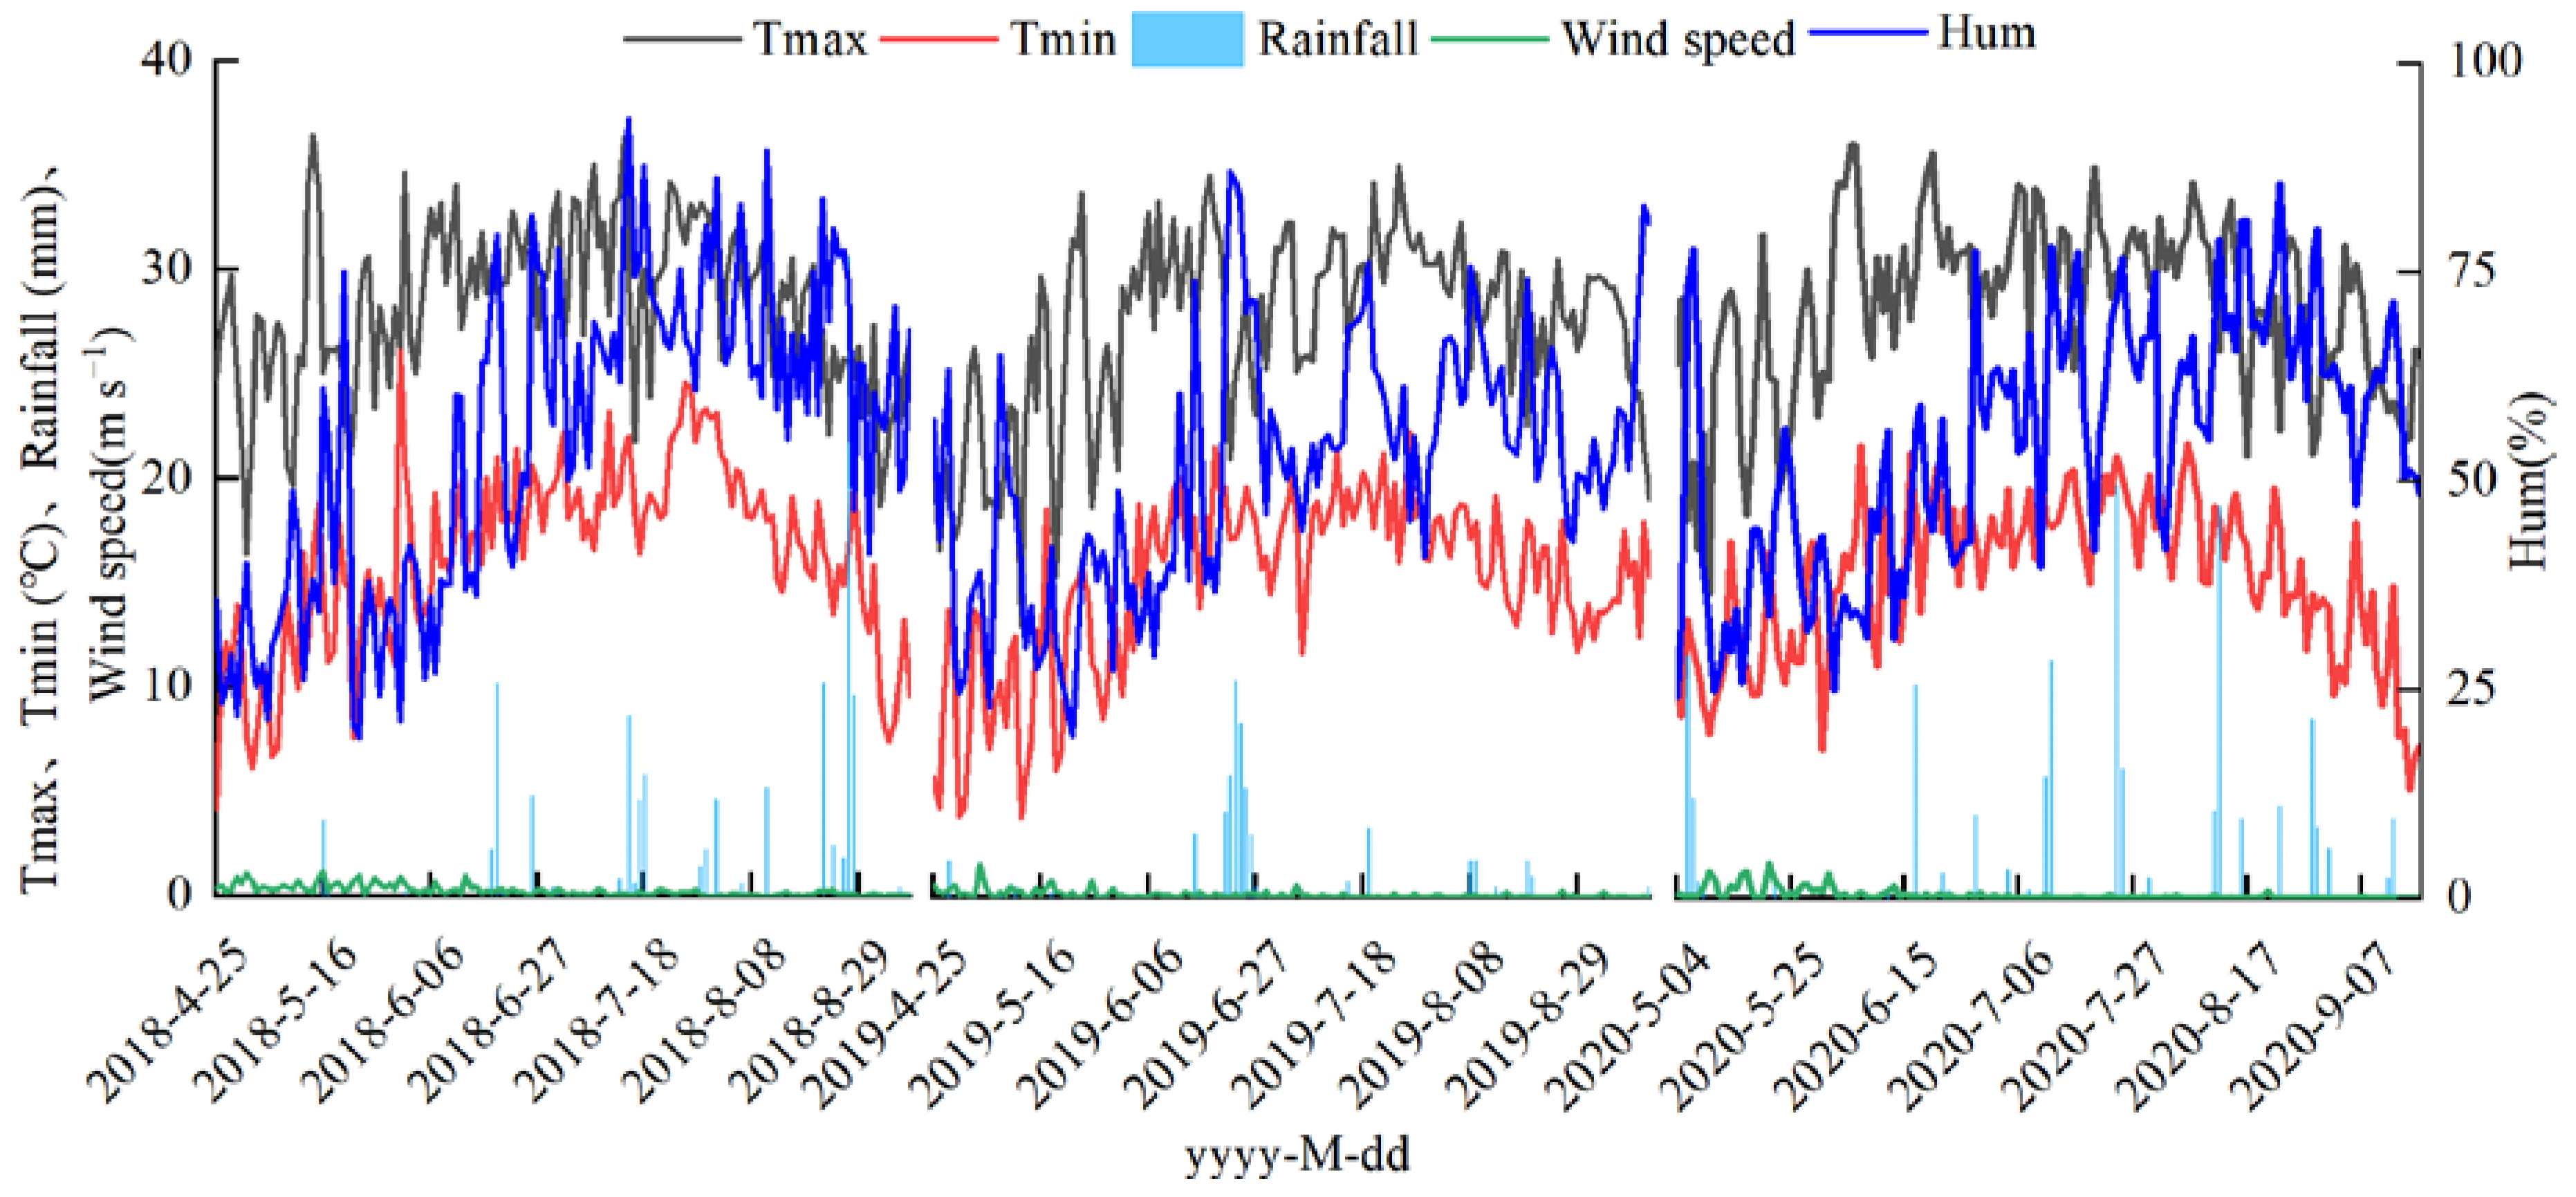
Figure 1. Daily air temperature, precipitation, wind speed, and humidity from 2018 to 2020.
Agronomy 13 00848 g001
Figure 2. The modeled and measured grain yield under different treatments. Bars are the standard deviation of the measured values. Different small letters indicate significant differences (p < 0.05) between treatments.
Agronomy 13 00848 g002
Figure 3. The modeled and measured soil NO3-N content (0–20 cm) under different treatments. The measured data are the means of three replicates and vertical bars indicate standard errors of replicates.
Agronomy 13 00848 g003
Figure 4. Simulated and measured values of soil ammonia volatilization rate (a) and cumulative emissions (b). Note: red and pink arrows indicate basal dressing and topdressing events, respectively. The measured data are the means of three replicates, and vertical bars indicate standard errors of replicates. Different small letters indicate significant differences (p < 0.05) between treatments.
Agronomy 13 00848 g004
Figure 5. Simulated and measured values of soil N2O emission rate (a) and total emissions (b). Note: green and red arrows indicate fertilization and irrigation events, respectively. The measured data are the means of three replicates, and vertical bars indicate standard errors of the replicates. Different small letters indicate significant differences (p < 0.05) between treatments.
Agronomy 13 00848 g005
Figure 6. DNDC model of the dynamics of maize yield under different treatments.
Agronomy 13 00848 g006
Figure 7. DNDC model of the dynamics of nitrogen-containing gas emissions under different treatments.
Agronomy 13 00848 g007
Table 1. Basic properties of the tested soils.
Soil LayerOrganic Matter
(g kg−1)
Total N
(g kg−1)
Alkaline Hydrolysis N
(mg kg−1)
Available P
(mg kg−1)
Available K
(mg kg−1)
pH
0–20 cm14.041.4354.6837.78199.678.2
20–40 cm5.250.3610.256.52102.258.0
40–60 cm1.520.158.158.1530.367.8
60–100 cm0.380.102.531.3210.327.6
Table 2. Crop parameters simulated by the DNDC model.
ParameterValue
Target yield (kg·C−1)4800
Grains/stems and leaves/roots0.4/0.42/0.15
Total nitrogen demand (kg ha−1)220
Accumulated temperature (°C)2400
Water requirement (g g−1)350
Bulk density (g cm3)1.37
Clay content (%)9.86
Nitrogen fixation coefficient1
Table 3. Statistical evaluation of the model simulation of grain yield from different treatments in 2018–2020.
Treatment Measured Value
(kg ha−1)
MBE
(kg ha−1)
RMSE
(kg ha−1)
nRMSE
(%)
R2
Calibration
U110,120.82 ± 506.04 192.1185.472.630.99
Validation
CK7714.69 ± 385.73 133.25289.564.050.97
U3O110,544.61 ± 527.23 253.63315.293.840.98
U1O112,133.81 ± 606.69 352.1300.253.120.98
U1O311,275.39 ± 563.77 −97.17332.652.980.97
O110,872.25 ± 543.61 −59.63367.533.740.98
Note: measured values, mean ± standard deviation.
Table 4. Statistical evaluation between the modeled and measured daily NO3-N content (mg kg−1).
Treatment Measured Value
(kg ha−1)
MBE
(mg kg−1)
RMSE
(mg kg−1)
nRMSE
(%)
R2
CK14.48 ± 1.17−4.5512.9922.580.69
U141.29 ± 2.54−3.2912.1918.820.72
U3O140.25 ± 2.53−3.6912.5918.890.70
U1O143.54 ± 2.68−2.8113.3619.360.71
U1O340.60 ± 2.410.2613.8021.050.71
O137.00 ± 2.301.9112.5820.570.69
Note: measured values, mean ± standard deviation.
Table 5. Statistical evaluation between the modeled and measured daily NH3 fluxes (kg N ha−1 d−1) and annual NH3 fluxes (kg N ha−1).
Treatment Measured ValueMBERMSEnRMSE
(%)
R2
Daily NH3
Flux
CK0.07 ± 0.01 0.150.2116.570.62
U10.20 ± 0.02 −0.520.1517.260.83
U3O10.87 ± 0.04 −0.330.2218.010.75
U1O10.78 ± 0.05 −0.410.3118.250.79
U1O30.65 ± 0.05 −0.280.6520.430.71
O10.73 ± 0.07 −0.100.2520.210.66
Annual
NH3 Flux
CK3.45 ± 0.56 1.581.2011.020.79
U115.54 ± 0.80 −6.422.0610.690.91
U3O113.85 ± 0.78 −4.593.5613.520.83
U1O111.66 ± 0.82 −5.164.2113.790.75
U1O313.03 ± 0.70 −3.294.0217.330.77
O113.40 ± 0.76 −4.125.1515.890.74
Note: measured values, mean ± standard deviation.
Table 6. Statistical evaluation between the modeled and measured daily N2O fluxes (g N ha−1 d−1) and annual N2O fluxes (kg N ha−1).
TreatmentMeasured ValueMBERMSEnRMSE
(%)
R2
Daily N2O FluxCK29.61 ± 1.5450.562.4023.120.65
U1329.19 ± 18.83−253.5919.2120.410.73
U3O1285.55 ± 17.25 −200.9850.2524.150.71
U1O1224.35 ± 18.00 −214.2549.9825.190.68
U1O3256.53 ± 15.29 −109.6565.5623.460.64
O1274.68 ± 14.60 −191.9156.3222.410.69
Annual N2O FluxCK0.78 ± 0.05 0.280.8012.530.72
U15.36 ± 0.30−0.691.1513.250.71
U3O14.81 ± 0.27 −0.522.3113.580.75
U1O13.99 ± 0.25 −0.553.0214.590.81
U1O34.48 ± 0.24 −0.123.8515.000.80
O14.74 ± 0.24 −0.624.3315.600.82
Note: measured values, mean ± standard deviation.
Table 7. DNDC model of the multi-year average maize grain yield (kg ha−1) under different fertilization treatments.
Treatment1995–19992000–20042005–20092010–20142015–2020Average
CK6592.54 ± 45 d6440.38 ± 31 d6097.32 ± 24 e5829.91 ± 19 d5257.74 e6013.35 e
U19093.02 ± 26 c9345.82 ± 38 c9092.784 ± 31 d8605.20 ± 31 c8512.68 d8971.55 d
U3O19396.81 ± 45 c10,091.34 ± 39 b10,326.48 ± 16 c10,133.69 ± 40 b10,096.23 c10,012.27 c
U1O111,322.79 ± 46 a11,578.47 ± 25 a12,564.75 ± 41 a12,996.62 ± 72 a12,927.54 a12,303.02 a
U1O311,154.61 ± 67 a11,214.91 ± 55 a11,622.89 ± 39 ab11,703.25 ± 43 a11,939.81 ab11,542.96 ab
O19912.11 ± 55 b10,014.44 ± 39 b9468.832 ± 26 c8777.41 ± 32 c9101.92 cd9595.21 cd
Note: different letters in each column indicate a mean significant difference at the 0.05 level.
Disclaimer/Publisher’s Note: The statements, opinions and data contained in all publications are solely those of the individual author(s) and contributor(s) and not of MDPI and/or the editor(s). MDPI and/or the editor(s) disclaim responsibility for any injury to people or property resulting from any ideas, methods, instructions or products referred to in the content.