Article

Mineralization and Fixed Stable Carbon Isotopic Characteristics of Organic Carbon in Cotton Fields with Different Continuous Cropping Years

Key Laboratory of Oasis Ecological Ministry of Education, College of Ecology and Environment, Xinjiang University, Urumqi 830017, China
*
Author to whom correspondence should be addressed.
Agronomy 2023, 13(3), 804; https://doi.org/10.3390/agronomy13030804
Submission received: 8 February 2023 / Revised: 4 March 2023 / Accepted: 6 March 2023 / Published: 9 March 2023
(This article belongs to the Section Grassland and Pasture Science)

Abstract

:
The oasis carbon pool in arid zones is an important part of the global carbon pool. There is a soil organic carbon (SOC)–soil–CO2–soil inorganic carbon (SIC) balanced system in the soil, which facilitates the change from soil organic carbon to soil inorganic carbon. A small change in the soil carbon pool can affect the overall global carbon balance, thus affecting the conversion of soil carbon in terrestrial ecosystems. In this study, the change from soil organic carbon to soil inorganic carbon (SIC) was obtained by measuring the δ13C values of SIC and CO2 in combination with stable carbon isotope techniques in cotton fields with different continuous cropping years, in the Alar Reclamation Area. Additionally, this was combined with redundancy analysis to reveal the effects of different physicochemical factors on the change amount. The results showed that the soil inorganic carbon content along the soil profile showed an increasing trend, while the soil organic carbon content was the opposite; the δ13C of SIC in the 0–20 and 60–80 cm soil layers were the highest in the 10a continuous cotton field soil, which were −22.24 and −21.86‰, respectively, and significantly different to other types (p < 0.05). The fixed carbon values in the barren, 5a, 10a, 20a, and 30a continuous cotton fields were 0.53, 0.17, 0.11, 0.13 and 0.33 g·kg−1, respectively; the corresponding amounts of CO2 fixed from soil respiration were 0.33, 0.11, 0.08, 0.05, and 0.25 g·kg−1; the amounts of CO2 from the atmosphere were 0.20, 0.06, 0.03, 0.02, and 0.09 g·kg−1; and the oxidative decomposition of CO2 by SOC were 0.17, 0.06, 0.04, 0.26, and 0.12 g·kg−1, respectively, indicating that the contribution of SOC was more in the barren field and 30a cotton field. Comparing the sources of fixed CO2, we found that the amount of fixed soil from barren fields and 30a was high from atmospheric CO2, while the contribution of SOC was low. Furthermore, the amount of fixed CO2 of 20a from SOC was high, and the atmospheric contribution was low. The main physicochemical factors that affecting the amount of soil SOC changed to SIC were soil water content, readily available carbon dioxide, and microbial biomass carbon.

1. Introduction

Oases are a key component in determining the structure and function of arid zone ecosystems. As the main storage site of carbon in the arid zone, the oasis soil carbon pool links the material cycles within and outside the ecosystem [1]. The oasis soil carbon pool contains a soil organic carbon pool and a soil inorganic carbon pool, which play important roles in the soil carbon cycle in arid zones [2]. Among them, the content and composition of soil organic carbon can reflect the level of soil organic matter, which is closely related to the sustainable development of oasis agriculture. Soil inorganic carbon storage capacity is huge in the arid zone and has good stability [3]. Along with oases processes, due to human agricultural activities such as tillage, irrigation, and fertilization, the original desert soil gradually evolves into irrigated desert soil, which is suitable for crop growth. This directly affects the migration and transformation of soil carbon pools [4]. The study of the transformation of oasis soil carbon pools is important for an in-depth understanding of the carbon cycle mechanism of oasis soils in arid zones and the assessment of the nutrient supply capacity and carbon sequestration potential of oasis soils.
The conversion of soil organic carbon to inorganic carbon is an important biochemical process in soils, in which the reaction “SOC → CO2(g) → CO2(aq) → HCO3(aq) → CaCO3(s)” forms pedogenic carbonate (PC), which will sequester the carbon released from soil organic matter into inorganic carbon. The carbon released from soil organic matter is sequestered in inorganic carbon, which transforms the soil carbon pool and may promote soil carbon sequestration [5]. The process of conversion of soil organic carbon to inorganic carbon is influenced by climate, soil, and human activities, especially the influence of land use change, which is the most significant [6]. Studies in the subtropics found that the conversion of naturally vegetated land (e.g., grassland) to agricultural land resulted in increasing CO2 emissions and decreasing soil organic carbon stocks [7]. Studies in temperate zones showed that the organic and inorganic carbon contents of farmland were significantly higher than those of other land use types (e.g., grassland, scrub, and desert), and the change from soil organic carbon to inorganic carbon increased after the conversion of oasis barren land to farmland in arid zones [8,9]. The conversion process of organic carbon to inorganic carbon is facilitated by the rich input of organic carbon sources such as straw and root stubble and the strong decomposition of microorganisms in agricultural soils. Moreover, it has been found that anthropogenic factors such as irrigation, tillage, and fertilization drove carbonate transport from the soil surface to the deeper layers, and the organic-inorganic carbon transformation of agricultural soils varied with the depth of the profile [10]. Although there are some studies focusing on the effects of agricultural activities on soil organic and inorganic carbon fractions, research on the relationship between the conversion of soil organic carbon to inorganic carbon and the mechanisms affecting it is still relatively limited, which greatly limits our understanding of the effects of carbon cycling in oasis farmland ecosystems.
Stable carbon isotope techniques can be used to quantitatively study the source, turnover, decomposition, and migration of soil carbon, and 13C-based stable isotopes are effective means of tracing soil carbon transformation processes [11]. The slope of the linear regression between soil δ13C and the logarithm of soil organic carbon content was defined as the β value to reflect the rapidity of organic carbon turnover and decomposition in the study [12]. The stable carbon isotope technique was applied to determine the amount of organic carbon mineralization in agricultural soils in a study of typical agricultural fields in the North China Plain [13]. The carbon stable isotope technique facilitates the distinction between primary and secondary carbonates, as well as the quantification of soil CO2 fixed during the formation and recrystallization of secondary carbonates, effectively elucidating the process of carbon transport and conversion in soils [14]. Magaritz et al. studied carbonate stable isotopes in irrigated soil and adjacent non-irrigated soil; the result showed that a net carbon loss appeared in the total carbonate layer of the cultivated soil section after irrigation for 40a, but a net increase in carbonate carbon occurred in the core soil layer [15]. An et al. studied the distribution and dynamics of organic and inorganic carbon in different soil types [16]. Based on the occurrence carbonate model and the principle of stable carbon isotope fractionation equilibrium, the relationships between soil organic carbon, soil CO2, and inorganic carbonate can be established, which allows researchers to study the conversion of soil organic carbon to inorganic carbon [17].
Located at the northern edge of the Tarim Basin, the Aral Reclamation Area is a typical artificial oasis in the arid zone of Northwest China and is an important cotton base in Xinjiang. Continuous crop cultivation in large fields is the main mode of cultivation. The area has been developed since the 1950s, and with the process of oases, barren grassland was transformed into arable land, and cotton fields with different successive crop years were formed [18]. Due to the influence of human activities such as tillage, irrigation, and fertilization, soil organic and inorganic carbon fractions have changed. In this study, the following scientific questions will be addressed: (1) to reveal the change pattern of soil organic carbon to inorganic carbon in different crop years and (2) to clarify the driving factors in the change from soil organic carbon to inorganic carbon by combining isotope techniques.

2. Materials and Methods

2.1. Study Area Overview

The Aral Reclamation Area is located at the northern edge of the Tarim Basin and the southern foot of the middle section of Tianshan Mountain (40°27′~40°56′ N, 80°36′~81°58′ E) (Figure 1), formed in the alluvial fine soil plain of the Aksu River and Yarkant River, slightly elevated along the river bank and both sides of the alluvial ditch. The terrain slopes from northwest to southeast, with an altitude of approximately 1012 m. The summer is hot, the winter is cold, and the annual difference in temperature is large, which could reach 62.3 °C. The annual average precipitation is 40.1~82.5 mm, and the annual average evaporation is 1876.6~2558.9 mm; thus, this is a typical warm temperate continental arid desert climate. Soil types include irrigated desert soil and wind-sand soil (Chinese classification system, 1992).

2.2. Field Sampling

Field sampling was conducted in June–July 2020. The sampling site was a farmland near the 12th regiment of the Alar Reclamation Area, where the local cultivar was “Xinluzhong 82”, using drip irrigation 5–7 times during the reproductive period, and the base fertilizer was diammonium phosphate, urea, potassium sulfate, and mixed organic fertilizer. Four types of cotton fields with different successive crop years were selected in the region, namely, 5-year (5a) cotton fields, 10-year (10a) cotton fields, 20-year (20a) cotton fields and 30-year (30a) cotton fields, with no irrigation for 15 d before sampling; meanwhile, barren grassland (H) was set as the control group, and the dominant plant species were mainly Alhagi sparsifolia, Tamarix spp., and Karelinia caspica. Each sample plot was approximately 0.12 hm2, and three typical sample squares of 1 m × 1 m were selected from cotton fields of different cropping years. Five soil samples were collected in the five layers of 0~20, 20~40, 40~60, 60~80, and 80~100 cm by a five-point sampling method; the obvious root stubble, stones, and other debris were removed, and the soil was crushed and mixed thoroughly. After air drying, the soil samples were sieved and bagged for storage for future analysis. A total of 60 gas samples were collected in sample bags using the gas well method for 5 types of continuous cropping year soil gas and brought back to the laboratory for analysis.

2.3. Measurement Method

The content of soil organic carbon (SOC) was determined by the external heating method of potassium dichromate [19]; the content of soil inorganic carbon (SIC) was determined by the gas volume method [19]; the δ13C value of SIC and carbonate was determined by the phosphoric acid method. The determination of soil CO2 gas [20] involved connecting the sample bag with the PreCon gas preconcentration system cold trap separation CO2, collecting purified CO2, and directly placing the sample into the DELTA-V isotopic ratio mass spectrometer to determine the δ13C value. Soil physicochemical factors included soil water content, soil bulk weight, pH, total salt, total nitrogen, effective phosphorus, fast-acting potassium, readily available carbon, water soluble carbon, and microbial biomass carbon. The soil water content was measured by drying [19]; soil bulk weight adopted ring knife method [19]; soil pH is directly measured from soil sample to water ratio 5:1 by pH meter (PHS-3 AW) [19]; total salt is derived from 8 ions of CO32−, HCO3, Cl, SO42−, Ca2+, Mg2+, Na+, and K+ [19]; total nitrogen was measured by half-Kjeldahl method [19]; effective phosphorus by sodium bicarbonate extraction-molybdenum antimony resist color method [19]; fast-acting potassium by ammonium acetate extraction-flame photometer method [19]; readily available carbon was determined by the potassium permanganate oxidation method [19]; water-soluble carbon was extracted from samples of fresh soil using distilled water (soil samples by distilled water: soil ratio 1:30, shaking for 30 min at 25 °C); and the extract was centrifuged (4000 r min−1, 10 min) after filtration and measured on a TOC-VCPH analyzer [19]; microbial biomass carbon was measured by carbon chloroform fumigation-extraction method [19].

2.4. Carbon Isotope Calculation Method

The expression of carbon stability isotope ratio is as follows [21]: the δ13C value indicates the relative thousandth difference of two carbon isotope ratios in the sample relative to a standard corresponding ratio, which is an indicator used to describe the degree of variation in 13C natural abundance when the sample is compared with the standard sample. The δ13C value has an error of ±0.2‰, and its calculation formula is as follows:
δ C 13 = [ ( C 13 / C 12 ) s a m p l e ( C 13 / C 12 ) s tan d a r d 1 ] × 1000
In this case, the standard sample is generally an American pseudodiorite (PDB) from the Pee Dee Formation of the South Carolina Cretaceous, USA, defined by its δ13C = 0.01124.

2.5. Calculation of Change from SOC to SIC

In an open soil system, the relationship between carbon isotope fractionation from CO2 to CaCO3 and temperature is in accordance with the following equation [22]:
1000 ln α = 3.63 + 1.194 × 10 6 / T 2
where α is the isotopic fractionation factor between CO2 and the CaCO3 phase, and T is the temperature in Kelvin. During the plant growing season, the average temperature in the area is 30 °C. Substituting the above equation to obtain the α value produces a value of 3.75. From the soil δ13C-CO2 value and α, the δ13C value of PC (pedogenic carbonate) is calculated according to the following equation:
δ 13 C PC = δ 13 C CO 2 + α
The following isotope mass balance equation is commonly used to quantify the ratio of PC to SIC [23]:
PC ( % ) = ( δ 13 C SIC δ 13 C pm ) ( δ 13 C PC δ 13 C pm ) × 100
where PC (%) is the proportion of PC to soil inorganic carbon in a certain soil layer; δ13C-SIC is the δ13C determination value of inorganic carbon in a certain soil layer; δ13C-PC is the δ13C value of occurring carbonate; δ13Cpm is the δ13C determination value of parent material, and this study area is irrigated desert soil, whose δ13C determination value is 0.20‰. From the SIC content and the proportion of PC to SIC, the PC content was calculated according to the following equation:
mPC = mSIC × PC ( % )
where mPC is the amount of PC (g·kg−1), and mSIC is the amount of SIC (g·kg−1). From the stoichiometric equilibrium relationship of soil CO2 to CaCO3 and the accumulated amount of PC, the amount of soil CO2 fixed during the formation or recrystallization of soil PC was obtained according to the following equation [24]:
Y = 1 2 mPC × N CO 2 / M PC
where Y is the fixed soil CO2 content (g·kg−1); 1/2 is half of the carbon in the HCO3 phase from soil CO2; MPC is the molar mass of PC (100 g·mol−1), and NCO2 is the molar mass of CO2 (44 g·mol−1). Soil δ13C-CO2 values are mainly determined by a combination of soil respiration and atmospheric mixed CO2, and the proportion of CO2 from soil respiration and the atmosphere in soil gases was calculated based on the occurrence carbonate carbon isotope abundance method as follows [24]:
C 13 C O 2 = C 13 S O C × a + C 13 a i r × b
where 13C-CO2 is the soil δ13C-CO2 value, 13C-SOC is the pure CO2 value released by oxidative decomposition, plant root respiration, and microbial respiration in the absence of atmospheric mixing (generally taken as −23.3‰); 13Cair is the δ13C value of modern atmospheric CO2 (generally taken as −8‰); a is the proportion of soil respiratory CO2 to total soil CO2; and b indicates the proportion from atmospheric CO2. In addition, microbial root respiration accounts for approximately 50% of soil respiration, so SOC oxidative decomposition accounts for 1/2 of the CO2 released from soil respiration.

2.6. Data Analysis

Data were organized and calculated using Excel 2019 and analyzed using SPSS 27. One-way ANOVA and multiple comparisons (LSD, α = 0.05) were conducted for SOC, SIC, δ13C-SIC, δ13C-CO2, and soil organic carbon change to inorganic carbon in soils with different continuous cropping years. The response of different soil carbon contents to other soil physicochemical factors was analyzed by CANOCO 5 software. Plotting was performed using Origin 2018 software.

3. Results

3.1. Characteristics of Soil SOC and SIC Distributions in Cotton Fields with Different Continuous Cropping Years

The SOC and SIC contents of the soil profiles of cotton fields with different years of continuous cropping were variable (Figure 2). Except for the 80–100 cm soil layer, the SOC content of each soil layer was the highest in the 20a continuous crop cotton field soil and the lowest in the barren grass field soil, and the difference with other types was significant (p < 0.05). The SOC content of different continuous crop years cotton fields decreased with the deepening of soil layer, and the values reached the maximum in the 0–20 cm layer; moreover, the 10a and 30a continuous crop cotton fields were significantly higher in the 0–20 cm soil layer than in the other soil layers (p < 0.05). The SIC content of each soil layer was the highest in the 30a crop year cotton field soil and the lowest in the barren grass field soil, and the differences between the 60–80 and 80–100 cm soil layers and other continuous crop year cotton field soils were significant (p < 0.05). The SIC content of different continuous crop year cotton field increased with the deepening of the soil layer and reached the maximum in the 80–100 cm soil layer, and the SIC content of the 20a and 30a continuous crop cotton fields was significantly higher in the 60–80 and 80–100 cm soil layers than in the other soil layers (p < 0.05). The SIC content was significantly higher in the 60–80 and 80–100 cm soil layers than in the other soil layers (p < 0.05).

3.2. δ13C Values of Soil SIC and Soil CO2 in Cotton Fields with Different Continuous Crop Years

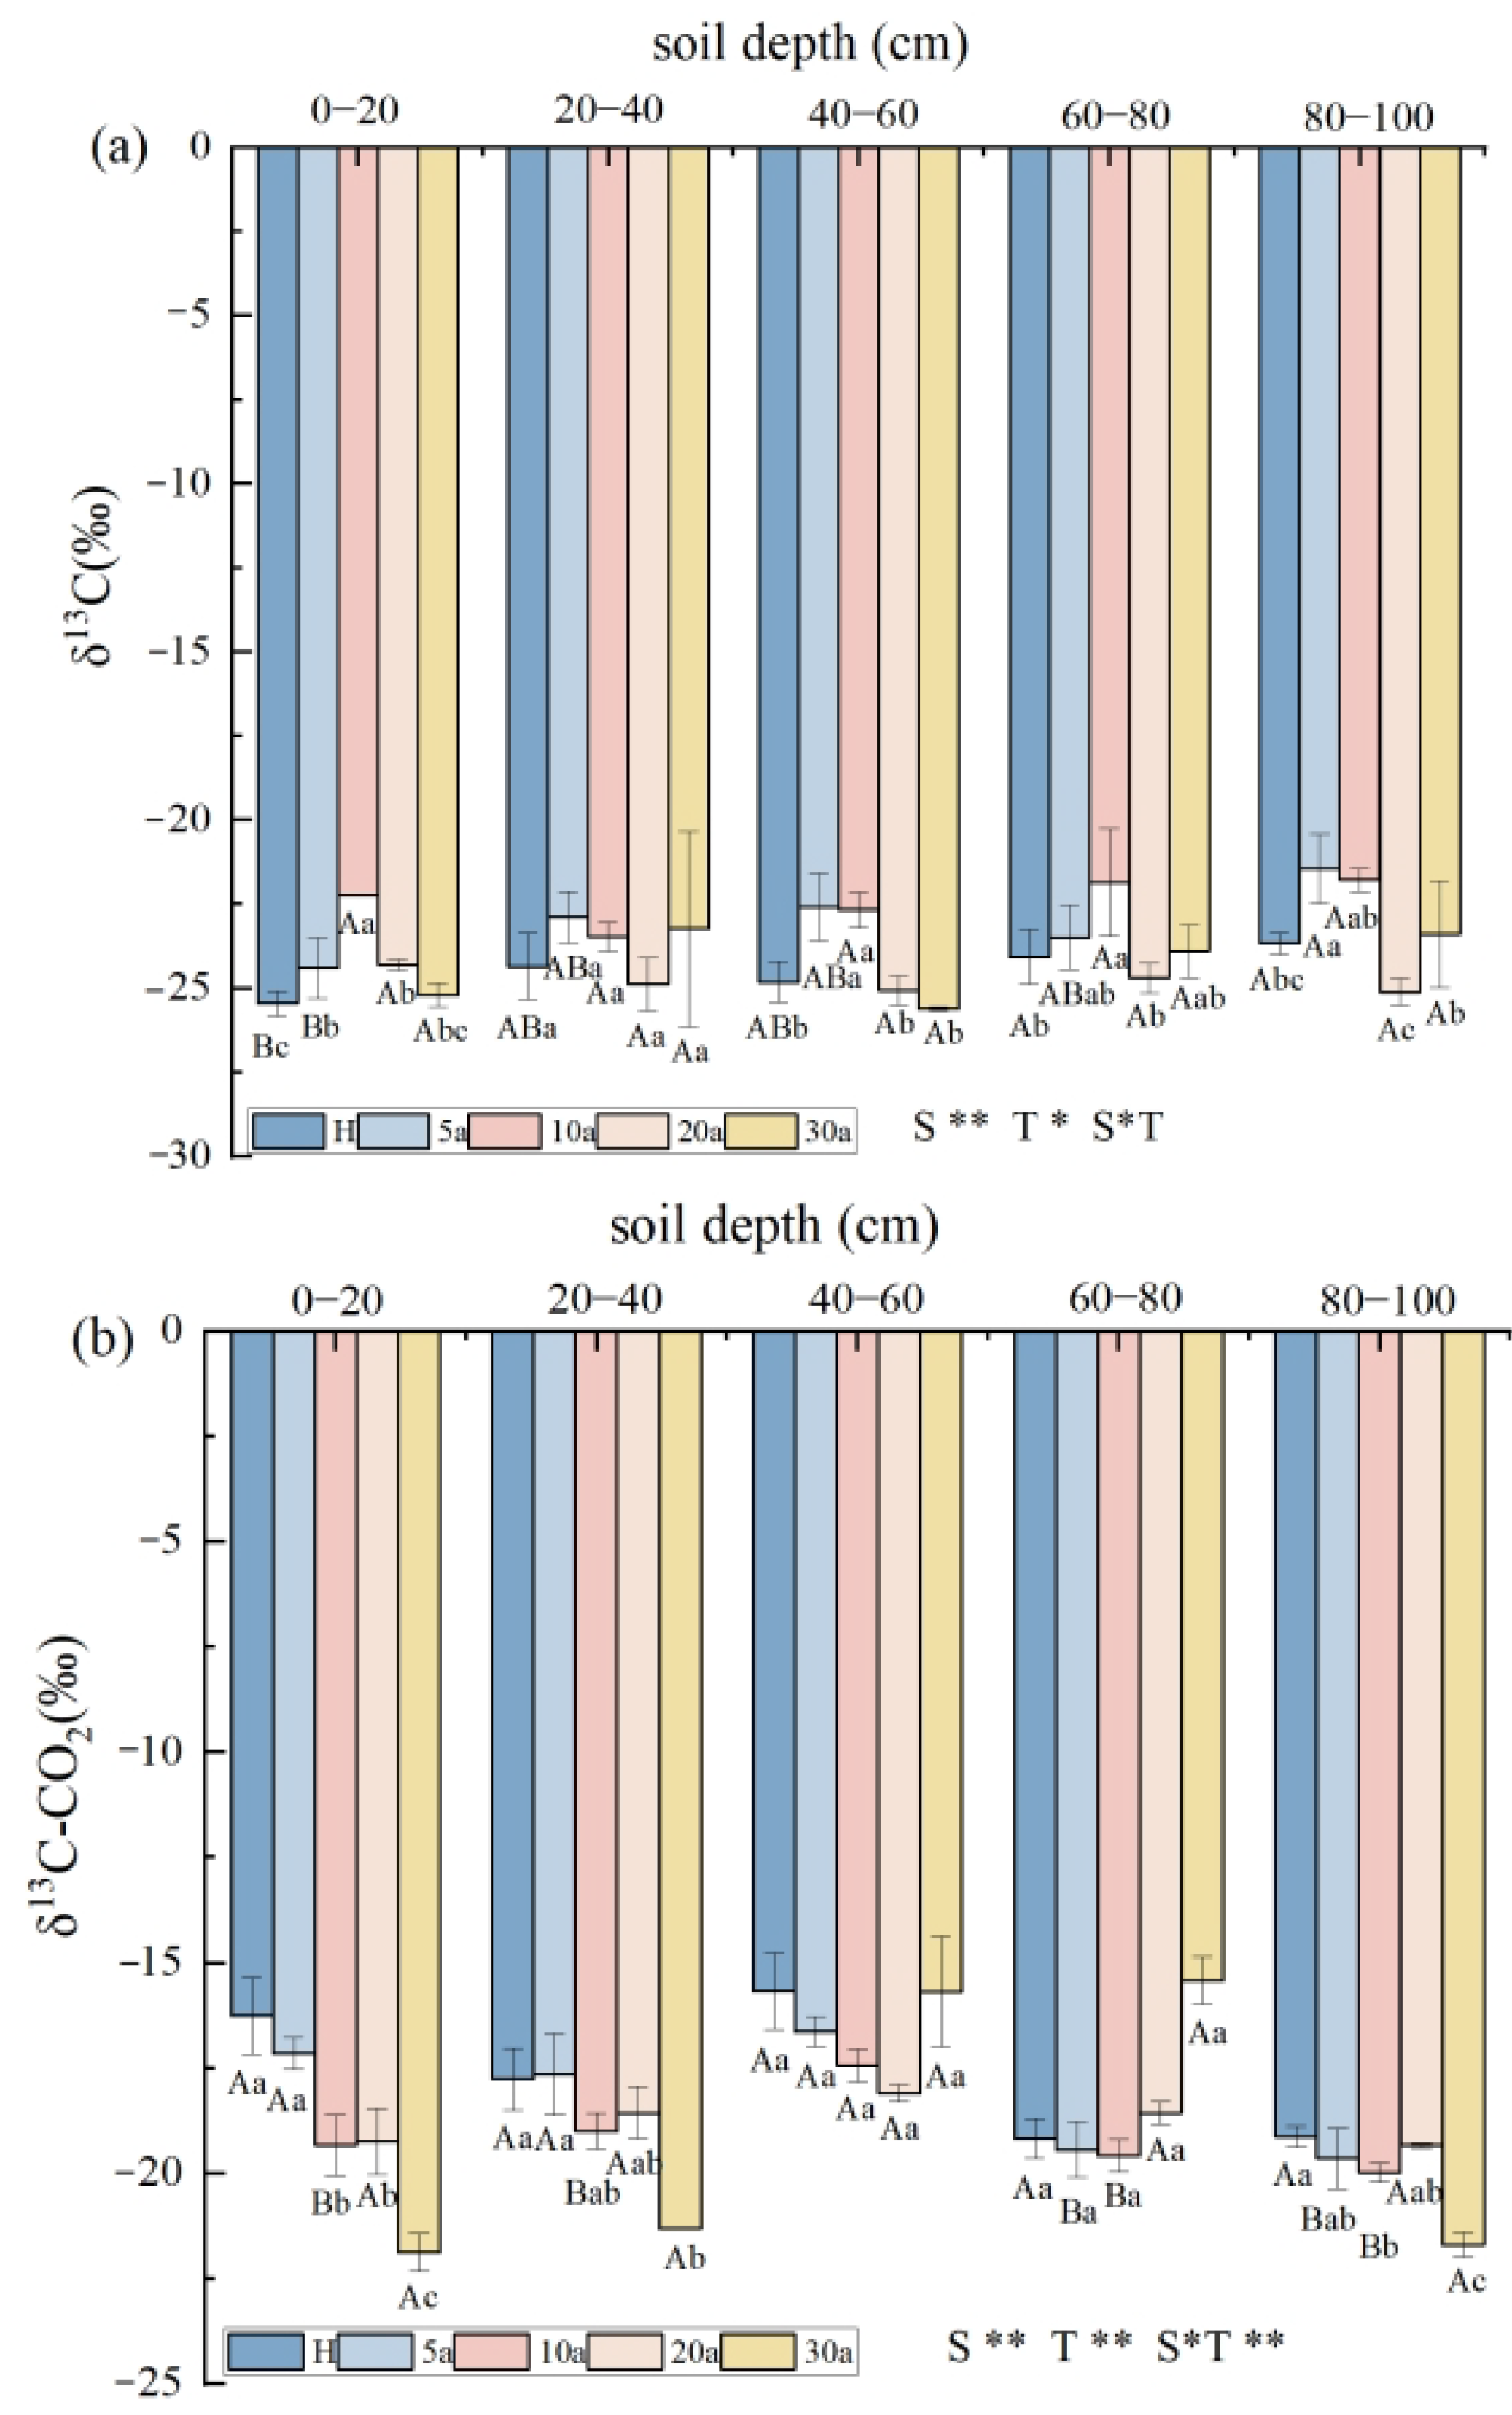
The δ13C values of SIC and CO2 in the soil profiles of cotton fields with different years of succession showed some variability (Figure 3). The δ13C values of SIC in the 0–20 and 60–80 cm soil layers were the highest in the 10a succession cotton field soils and were significantly different from those in the other types, while the δ13C values of SIC in the 5a succession cotton fields in the 80–100 cm soil layer were significantly higher than those in the other types (p < 0.05). The δ13C values of SIC in different continuous cropping years were not significantly different in each soil layer, and the δ13C values of SIC in the 5a succession cotton fields were significantly higher in the 80–100 cm than in the other soil layers (p < 0.05). Except for the 20–40 and 60–80 cm soil layers, the δ13C values of soil CO2 in each soil layer were highest in the barren grass field and lowest in the 30a continuous crop year cotton field, and the δ13C values of CO2 in the barren grass field were significantly higher than those in all types of cotton fields in the 80–100 cm soil layer (p < 0.05). The δ13C values of soil CO2 in different continuous crop years varied regularly with soil layers, mostly in the 40–60 cm soil layer. The δ13C values of soil CO2 in different years of continuous cropping were not significant, but most reached the maximum value in the 40–60 cm soil layer, among which the δ13C values of soil CO2 in the 10a continuous crop cotton fields were significantly higher than those in the other soil layers (p < 0.05).

3.3. Soil PC Content of Cotton Fields with Different Continuous Crop Years

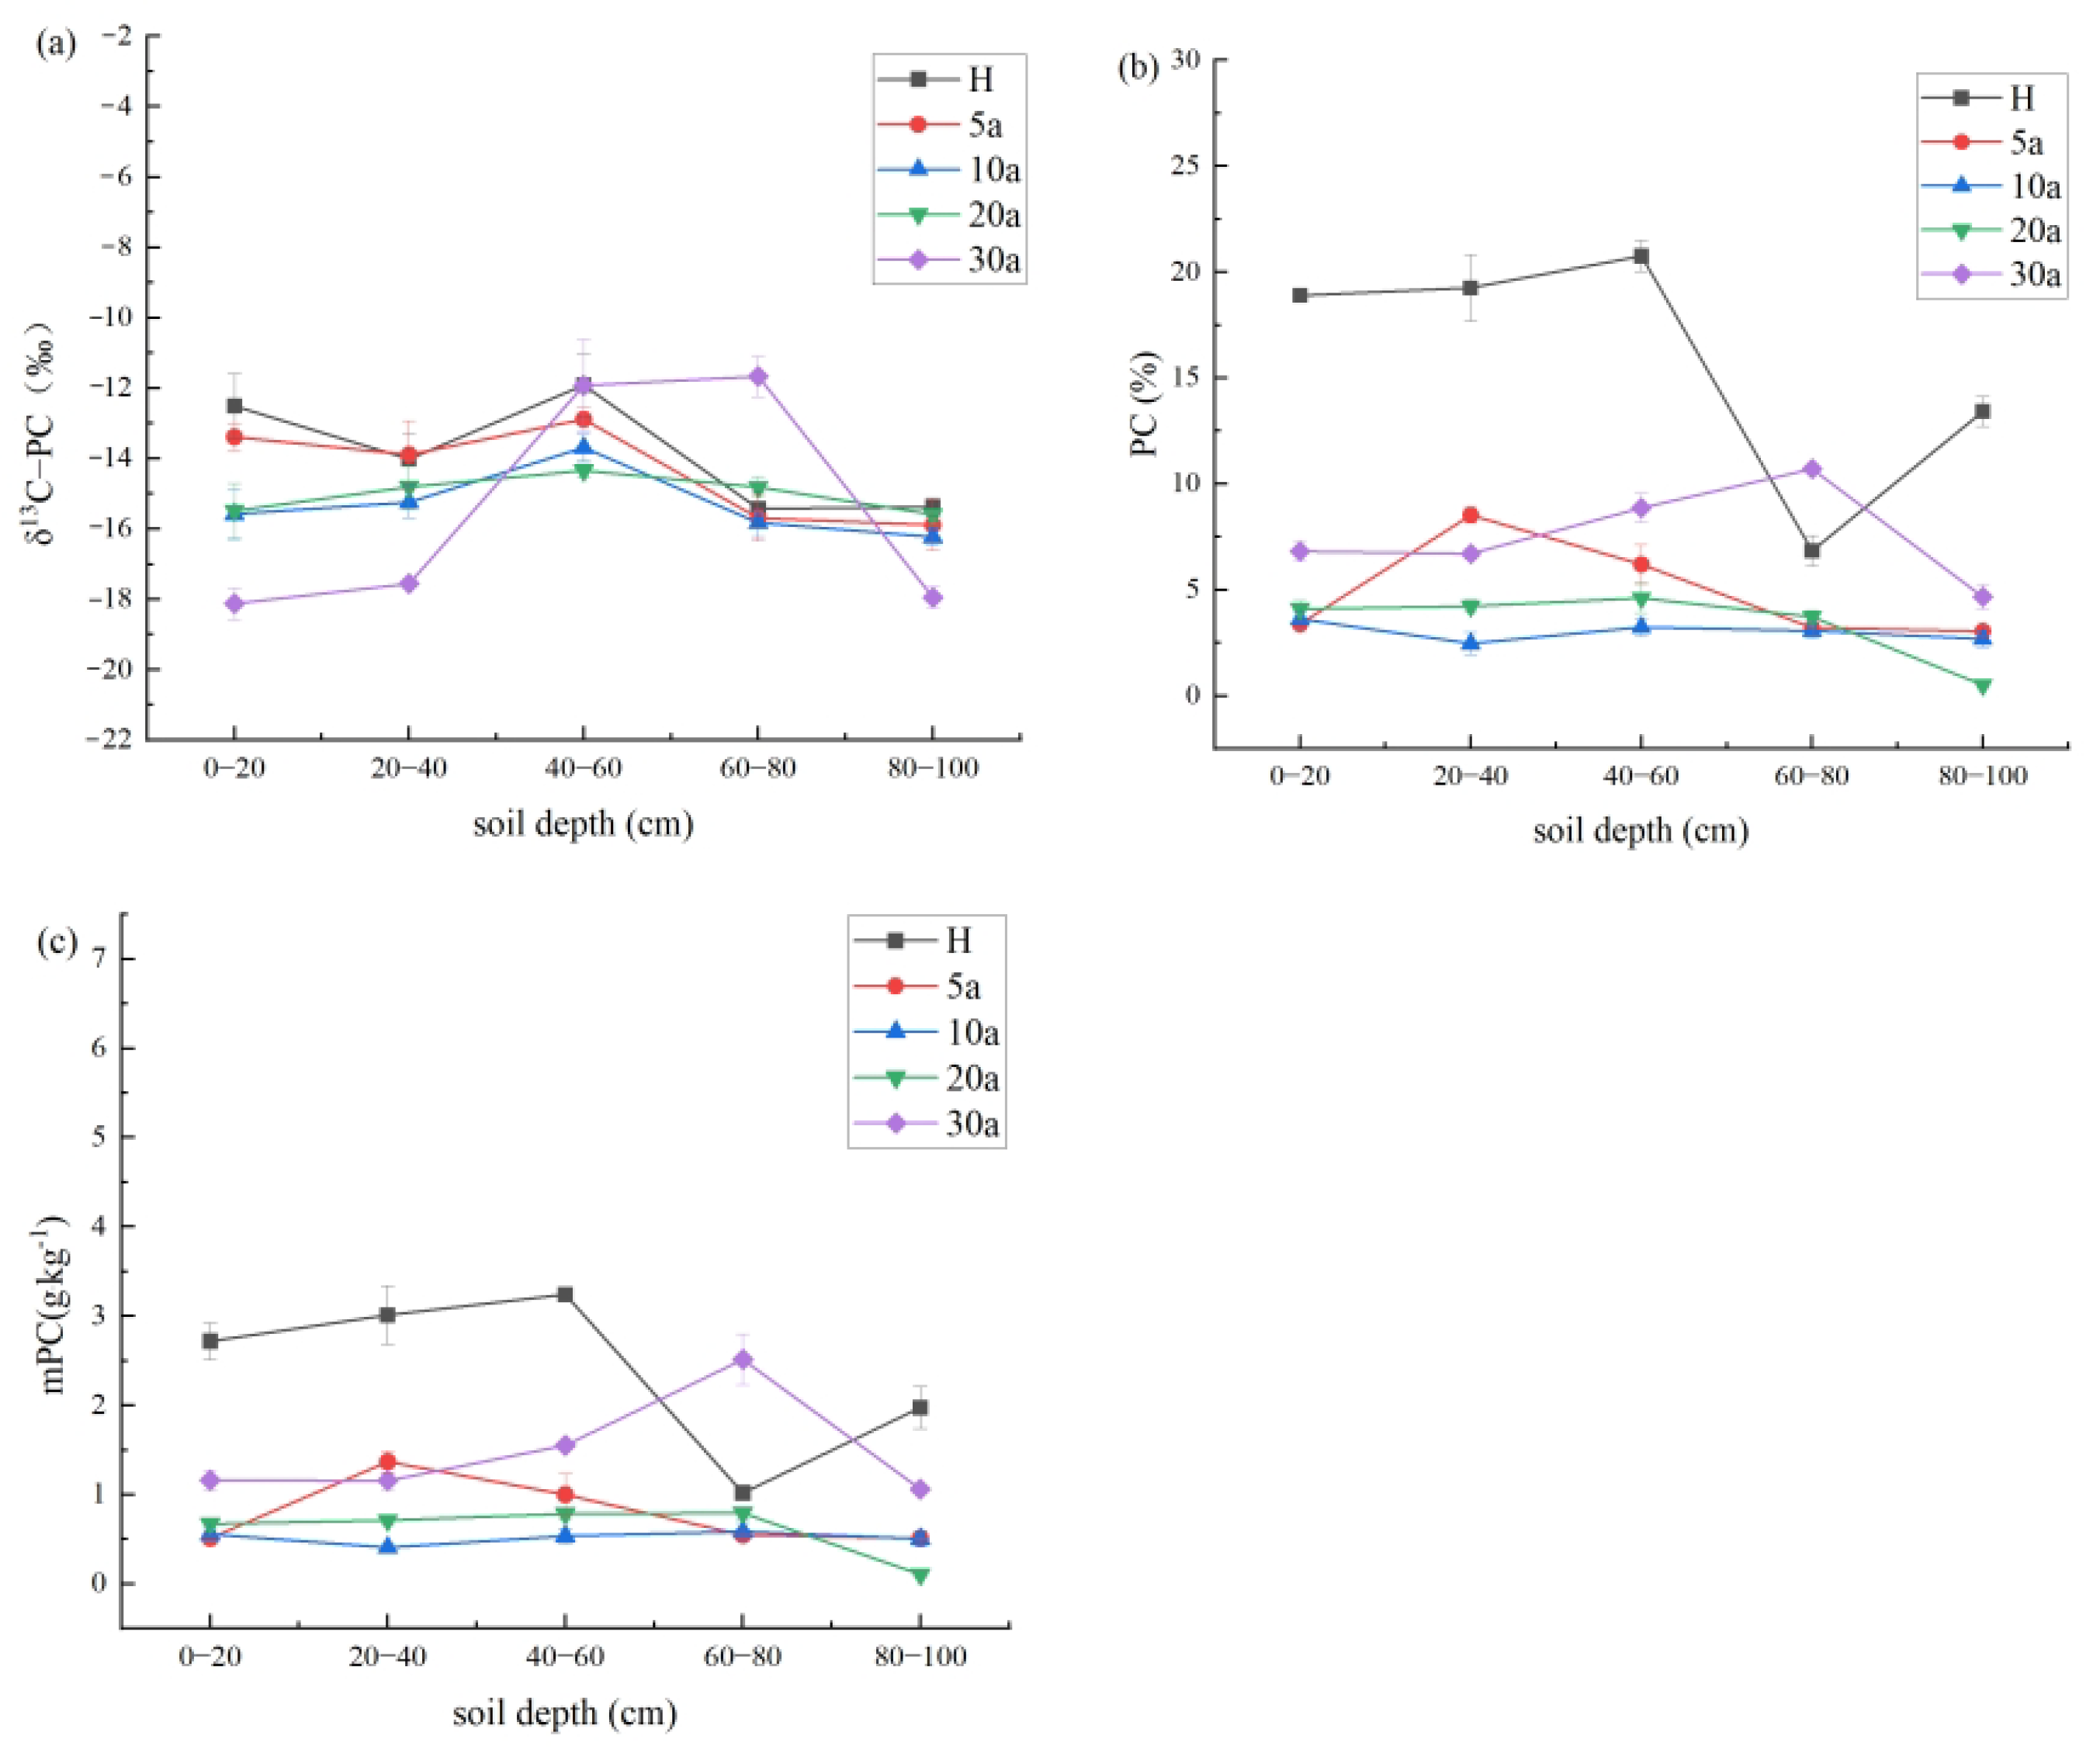
Based on the δ13C-CO2 values and Equations (3)–(5), the δ13C-PC, PC (%) and mPC values were obtained (Figure 4). Except for the 60–80 cm soil layer, the soil mPC values of each soil layer were the highest in the barren grass field and were significantly different from the other continuous crop years, followed by the higher soil mPC values in the 30a continuous cotton field and the highest soil mPC values in the 60–80 cm soil layer in the 30a continuous cotton field, while the differences in the soil mPC values of the other continuous crop years were not significant. Most of the soil mPC values showed a trend of first increasing and then decreasing with the depth of soil layer. The 10a, 20a, and 30a continuous crop cotton fields had the maximum soil mPC values in the 60–80 cm soil layer, which were 0.59, 0.79, and 3.63 g·kg−1, respectively.

3.4. Change from Soil SOC to SIC in Cotton Fields with Different Continuous Crop Years

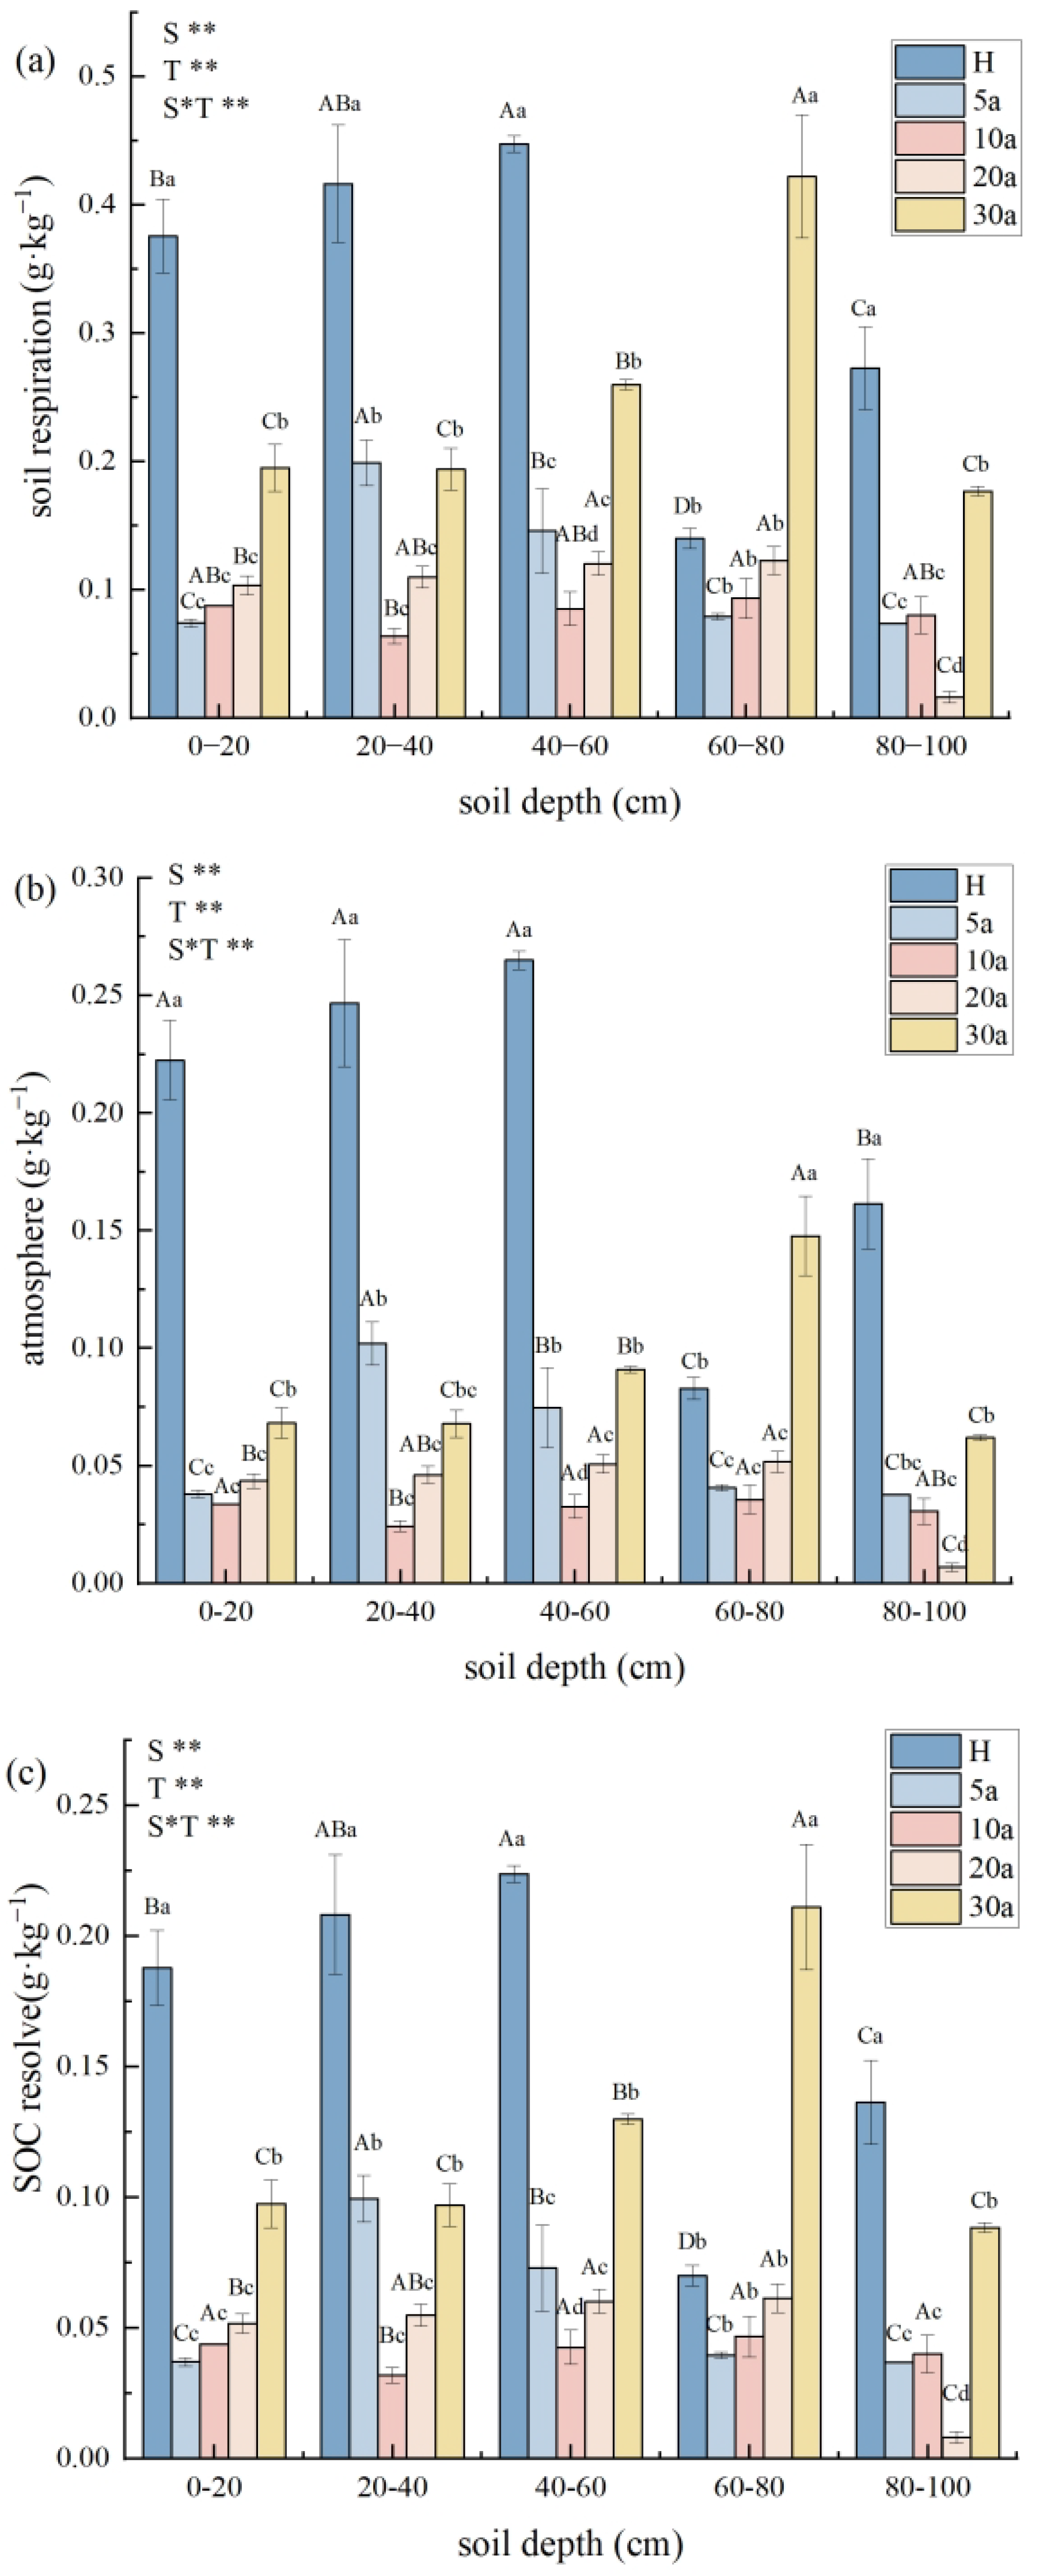
Using Equation (6) to obtain the content of soil CO2 fixed during PC formation or recrystallization, the average carbonate in the barren land, 5a, 10a, 20a, and 30a continuous cotton fields was approximately 0.53, 0.17, 0.11, 0.13, and 0.33 g·kg−1 of soil from fixed soil CO2, respectively. Equation (7) was used to calculate the proportion of carbonate in the barren land, 5a, 10a, 20a, and 30a continuous cotton fields in the 0–100 cm soil layer, and the values were 62.76, 66.03, 72.33, 70.35, and 73.29%, respectively, and the sources of CO2 fixed by soil SIC were soil respiration, atmosphere, and SOC decomposition (Figure 5). Except for the 60–80 cm soil layer, the amount of CO2 fixed from soil respiration was the highest in all soil layers, and the difference was significant with other continuous crop years (p < 0.05). The amount of CO2 fixed from soil respiration in different continuous crop years mostly reached the maximum in the 60–80 cm soil layer, among which the difference between the 10a and 30a continuous cotton fields and other soil layers was significant in the 60–80 cm soil layer (p < 0.05). The amount of CO2 fixed from the atmosphere in all soil layers except for the 60–80 cm soil layer was the highest in the barren grass field, and the difference with other continuous crop years was significant (p < 0.05). The amount of CO2 fixed from the atmosphere in cotton fields of different continuous crop years showed a trend of increasing and then decreasing with the deepening of soil layers. The amount of CO2 fixed from the atmosphere was significantly higher in the 20–40 cm soil layer and in the 60–80 cm soil layer (p < 0.05) in the 30a continuous crop cotton field. Except for the 60–80 cm soil layer, the amount of CO2 fixed from SOC decomposition in all soil layers was the highest in the barren grass field, and it was significantly different from the other continuous crop year cotton fields (p < 0.05). The amount of CO2 fixed from SOC decomposition in different continuous crop years mostly reached the maximum in the 60–80 cm soil layer, and the amount of CO2 fixed from SOC decomposition in the 30a continuous cotton field was significantly higher in the 60–80 cm soil layer than in the other soil layers (p < 0.05).

3.5. Factors Influencing the Change from SOC to SIC in Soils of Cotton Fields with Different Continuous Crop Years

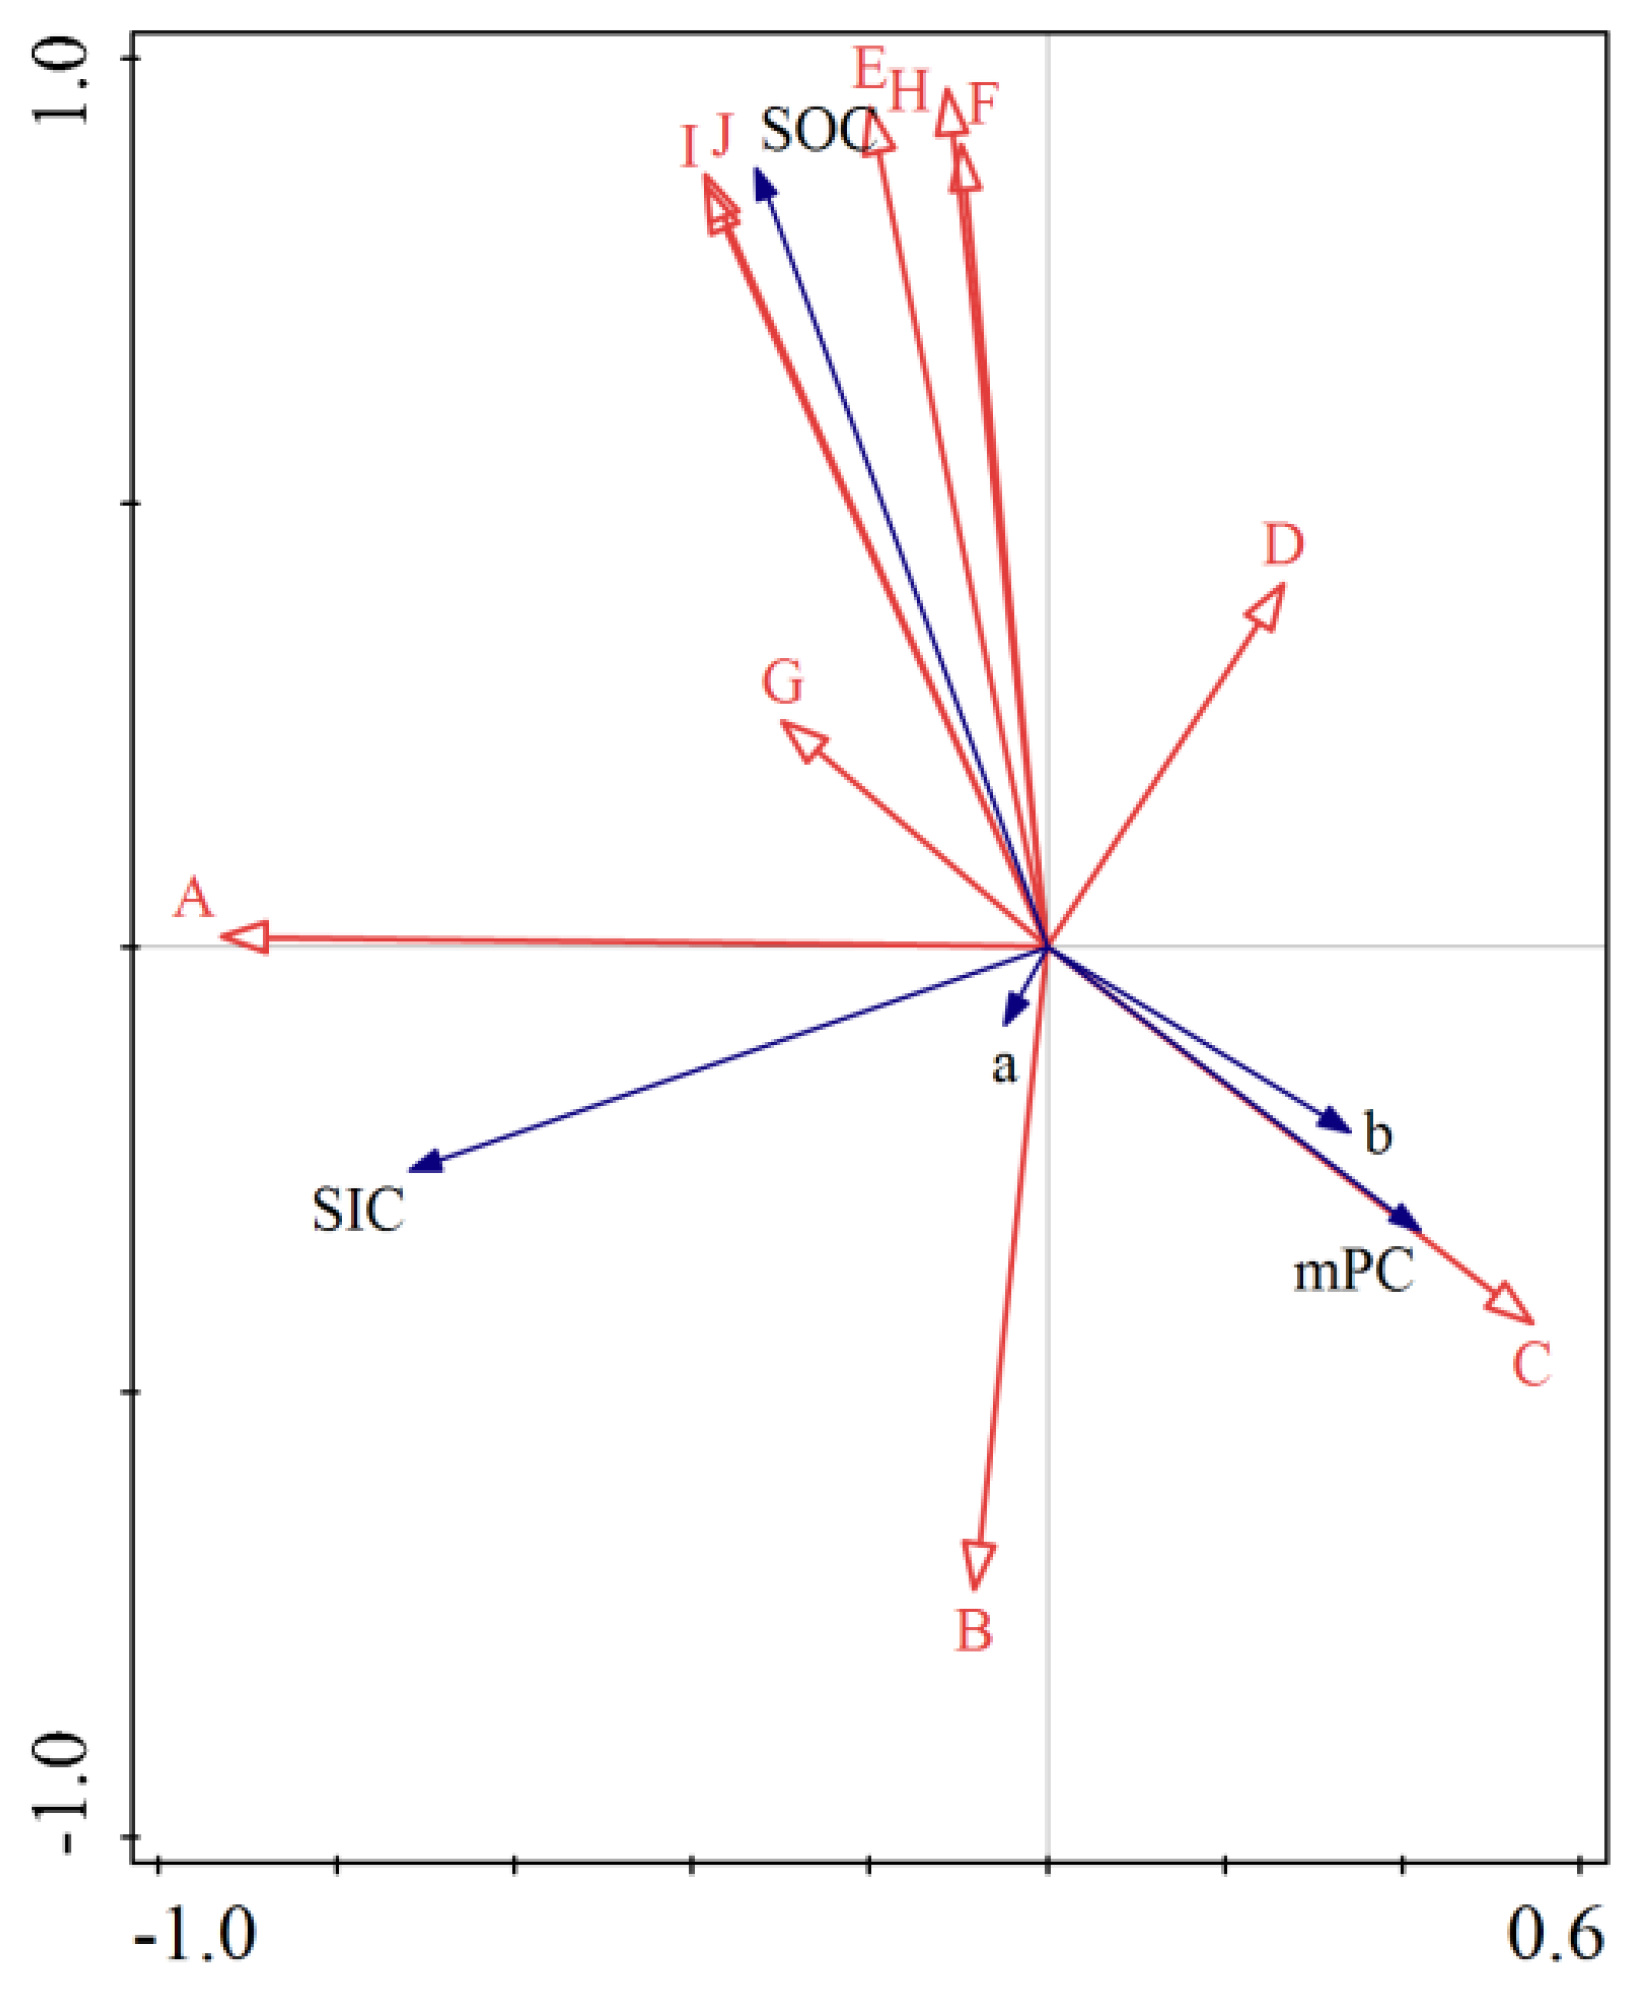
The redundancy analysis was used to better describe the correlation between the amount of soil SOC changed to SIC and soil physicochemical factors in cotton fields with different continuous cropping years, resulting in a two-dimensional ranking plot (Figure 5). From the above explained amounts, it can be seen that the 10 selected soil physicochemical factors explained 100% of the total characteristic values, indicating that they had significant effects on the change from SOC to SIC in soils of cotton fields with different continuous cropping years (Table 1). Among them, soil water content, readily available carbon, and microbial carbon were the main physicochemical factors affecting the change from soil SOC to SIC. The mPC and soil δ13C-CO2 values were negatively correlated with soil water content, readily available carbon, and microbial carbon. The soil δ13C-SIC values were positively correlated with soil water content and negatively correlated with readily available carbon and microbial carbon. The soil SIC was positively correlated with soil water content and microbial carbon and negatively correlated with readily available carbon. The soil SOC was positively correlated with soil water content, readily available carbon, and microbial carbon.
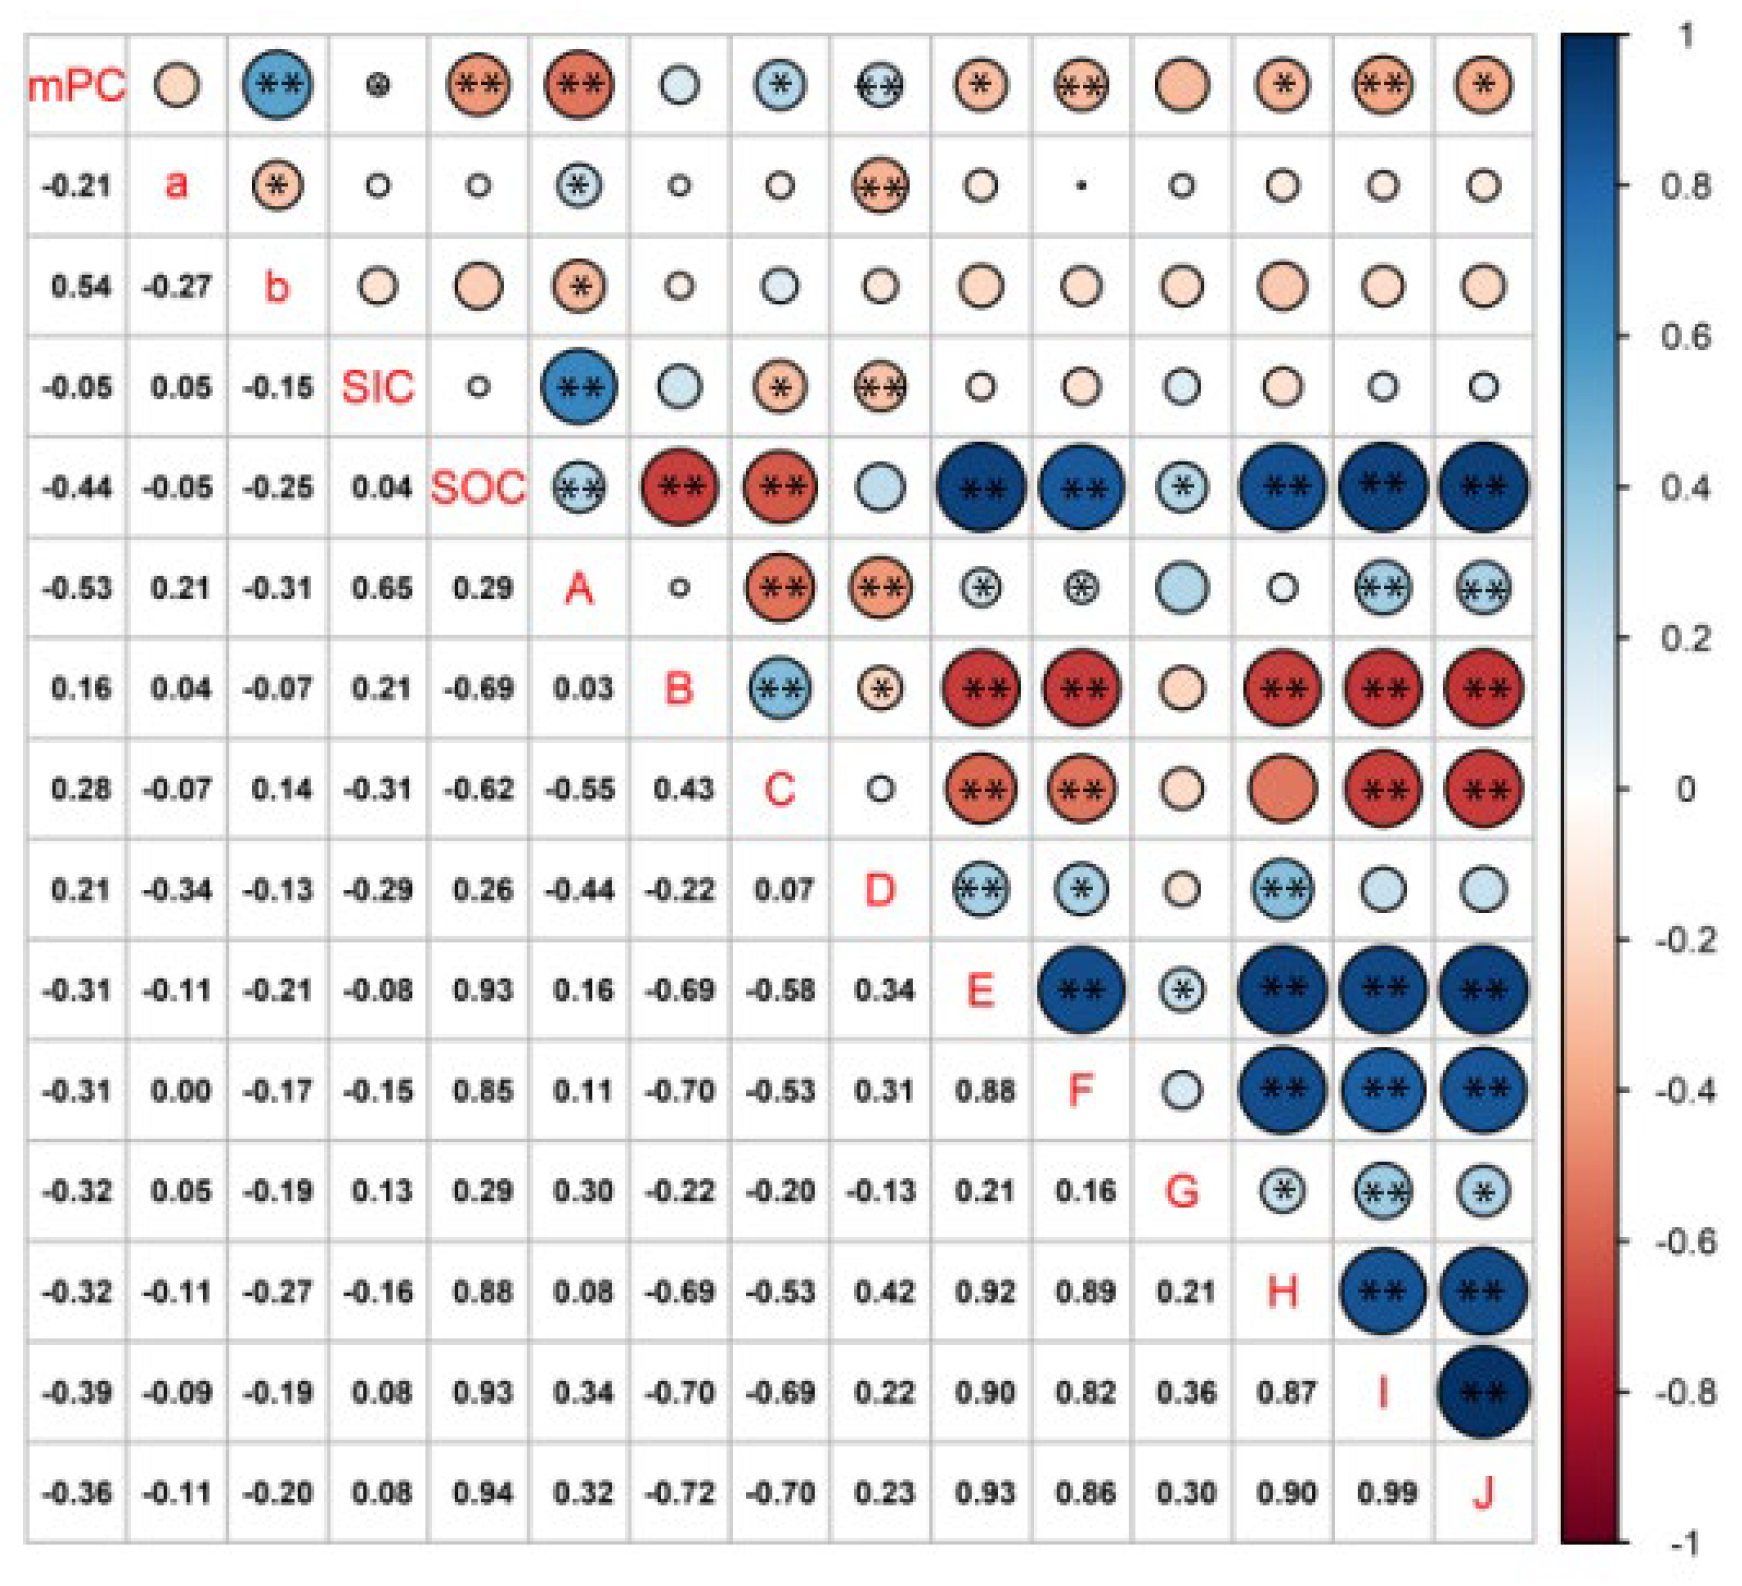
The correlation coefficient matrix of soil SOC to SIC change and soil physicochemical factors is shown in Figure 6. The results showed that the soil mPC values were moderately correlated with soil δ13C-CO2 and soil water content, with correlation coefficients of 0.54 and 0.53, respectively, and poorly correlated with readily available carbon dioxide and microbial quantity carbon. The soil SIC was moderately correlated with soil water content, with a correlation coefficient of 0.65. Soil organic carbon was highly correlated with readily available carbon and microbial carbon, with correlation coefficients of 0.88 and 0.94.

4. Discussion

4.1. Effects of Different Cropping Years on Organic and Inorganic Carbon in Cotton Field Soils

The increasing intensity of human land exploitation during the oasis process has resulted in the formation of cotton fields with different years of continuous cropping, leading to changes in the organic and inorganic carbon contents of soils. This study found that the organic carbon content of soil in most soil layers was highest in the 20a continuous crop cotton field soil and lowest in the barren grass field soil. The low bioaccumulation in the arid zone desert kept the initial value of organic carbon at a low level. In the process of continuous cropping, the application of fertilizer improves the crop yield, and there is a continuous input of crop straw and other exogenous organic materials into the soil, which provides a sufficient carbon source for the growth and reproduction of soil microorganisms and makes them show high activity; therefore, the organic carbon gradually accumulates with the years of continuous cropping and play a role of carbon sink. However, meanwhile, the crop itself needs to absorb a large amount of organic matter and nutrients from the soil during the growth process so that the nutrients returned to the soil gradually decrease, and thus, the organic carbon in the soil tends to level off along the increased continuous cropping years [25]. This result is consistent with the results of Mustafa et al. [26] for continuous maize and Majhi et al. [27] for continuous rice, where the soil organic carbon content mostly peaked at 20a of continuous cropping. The organic carbon content of 30a crop years decreased slightly compared with 20a, which may be related to soil consolidation, increased soil capacity due to the residual mulch in the continuous crop soils, and reduced aboveground and belowground biomass of the crop due to the restricted root growth. However, it has been suggested that the continuous input of organic matter to the soil layer will have a negative impact on the organic carbon content of the soil [28]. Furthermore, some scholars [29,30] have suggested that the continuous input of organic material to the soil layer will have an excitation effect on the original organic carbon in the soil, thus accelerating the decomposition of organic carbon, and the decomposition rate may be greater than that of synthesis. The results showed that the soil organic carbon content was the lowest and the soil inorganic carbon content was the highest in each soil layer in the 30a soil (Figure 1). After the transformation of desert soil into irrigated farmland, different years of succession led to different processes of leaching and precipitation of soil inorganic carbon. With irrigation and fertilization, the salt ion content of soil changed, which increased the activity of HCO3 and CO32− and made it easier to be combined with salt ions to form carbonate, then accumulated in the soil [31]. However, in this study, SIC was positively correlated with soil capacity, which indicates that the soil slabbing phenomenon caused by long-term continuous cropping has, to some extent, prevented the downward transport of carbonate under leaching and accumulated in the cultivated layer, so that soil inorganic carbon has increased continuously with continuous cropping [32]. Song et al. [33] also found that the soil inorganic carbon content was higher in cropland than in other types. In this study, the soil organic carbon content along the soil profile of cotton fields with different years of continuous cropping showed a decreasing trend, while the soil inorganic carbon content showed an increasing trend. Other scholars [10,34] have found the same pattern in studies of gray desert soils at the edge of the Gurbantunggut Desert and gray calcium soils on the Loess Plateau in Longzhong. Organic matter accumulated in the soil surface layer first after the input of exogenous materials, forming a soil humus layer containing more organic carbon. Leaching has a driving effect on the surface soil inorganic carbon, which is mainly in the form of carbonate, and with the movement of water, some soil inorganic carbon migrates to the deeper layers of the soil, which is similar to the results of Guo et al. [35], who found that soil inorganic carbon increases with the deepening of the soil layer in their study on the dynamics of carbon storage in the soil profile of the arid zone. Moreover, fertilizer, straw regrading, and tillage will increase the porosity of the upper soil layer and reduce its capacitance, making carbonate subject to stronger leaching during irrigation [31].

4.2. Change from Organic Carbon to Inorganic Carbon in Soils with Different Continuous Crop Years

An inorganic carbon balance system of CO2(g)–CO2(aq)–HCO3(aq)–CaCO3(s) is commonly found in soils [36]. The change from organic carbon to inorganic carbon in soils varies among successive crop years. The amount of soil CO2 fixed by each soil layer was highest in the barren grass field and lowest in the cotton field with 5a/10a continuous crop years [37]. Scholars have found that barren grass field is more likely than other soil types to fix soil CO2. Barren grass field is mainly developed from wind-formed sandy parent soil at the northern edge of the Tarim River, with larger soil pore spaces, higher soil biological activity, enhanced permeability, and full contact with the atmosphere. The soil is rich in Ca2+, forming a large amount of carbonate, and there is an obvious accumulation of calcium carbonate in the soil formation process, which promotes the accumulation of soil inorganic carbon, the accumulation of inorganic carbon in the soil has been promoted [38]. At the same time, the significant CO2 flow in the barren grass field soils has caused significant changes in soil inorganic carbon δ13C values, which promoted soil plant and microbial respiration, digestion reactions, decomposition reactions and other processes, thus improving soil biological activities, increasing the source of inorganic carbon components, and promoting the conversion process of soil organic carbon to inorganic carbon [39] in the 5a and 10a continuous crop years of cotton fields due to the strengthening of continuous crops, soil microorganisms, and agglomerates. The increase in the number of years of apoplastic mulch has led to the formation of stable aggregates in the soil, which have a protective effect on inorganic carbon and make it difficult to dissolve [40]; carbon dioxide and carbonate have been exchanging carbon stable isotopes, and the δ13C value of soil inorganic carbon will change from mainly depending on parent material to mainly depending on soil carbon dioxide with time [41]. This process depends mainly on soil carbon dioxide, making the δ13C value of soil inorganic carbon in the 5a continuous cotton fields significantly different from the other types, which in turn leads to a lower change from organic to inorganic carbon in the soil.
The amount of fixed soil CO2 in the soil profile tended to increase and then decrease in different continuous cropping years. In the surface layer of arid soils in Xinjiang, the decomposition rate of plant residues was 80–90% per year, and its mineralization rate was 5–10 times higher than that in moist soils, especially in the 30–60 cm soil layer, where the soil moisture decreased extremely fast, and the water leaching process promoted the carbon change from soil organic carbon, accompanied by the phenomenon of evapotranspiration, which made the native calcium carbonate precipitate again to form new calcium carbonate and thus accumulate [42]. As the soil layer deepened, the soil organic matter content, crop root length, and microbial activity all decreased, thus reducing the fixation effect. This was consistent with the findings of Xue-Ni Zhang et al. [43], who found that the conversion of soil organic carbon to inorganic carbon at the plant root system showed a fluctuating trend of increasing inorganic carbon with increasing soil depth.

4.3. Correlation between the Change from Organic Carbon to Inorganic Carbon and Physicochemical Factors in Soils with Different Continuous Cropping Years

Soil physicochemical and biological properties affect the contents of soil organic and inorganic carbon at a local scale between successive years of crop [44]. Physicochemical factors indirectly influence soil carbon pool characteristics by affecting soil structure and vegetation, which in turn affect the amount of soil organic carbon changed to inorganic carbon. In this study, we found that the main physicochemical factors affecting the change from soil organic carbon to inorganic carbon were soil water content, readily available carbon, and microbial biomass carbon, with a significant negative correlation between different years of succession. The increase in water content was conducive to the decomposition of apoplankton, mineralization of organic carbon, and microbial activity and could improve the oxygen condition of the soil environment, thus affecting microbial activity and promoting the accumulation of soil organic carbon [45]. The total amount of precipitation in the oasis at the northern edge of the Tarim River was relatively low, and its distribution was uneven between and within years. The study by Yu et al. [46] in degraded grasslands of Inner Mongolia found that soil water content was closely related to the amount of soil organic carbon conversion. Readily available carbon and microbial quantity of carbon are directly involved in the transformation process of soil biochemistry, which is the reserve of effective plant nutrients in soil, promoting the effective soil nutrients and significantly contributing to the accumulation of soil organic carbon in agricultural ecosystems; the increase in soil water content caused by agricultural irrigation can inhibit the activity of aerobic microorganisms in soil, and the decomposition rate of organic carbon decreases, which results in the accumulation of readily available carbon [47]. The microbial population of soil topsoil is higher than that of deep soil, so different soil aggregation leads to different distributions of microbial amounts of carbon in soil layers. With the extension of continuous crop years, the accumulated apoplastic material in the soil surface layer significantly elevates the active organic carbon content and stimulates an increase in microbial quantity carbon, which in turn promotes the release of Ca2+ and Mg2+ by biochemical weathering of calcium/magnesite minerals; furthermore, the Ca2+ and Mg2+ released by crops, minerals or other sources coprecipitated with the large amount of CO2 produced by microbial respiration to form carbonates, thus increasing the soil organic carbon content. At the same time, there was a conversion of soil organic carbon to inorganic carbon [48]. Jagadamma et al. [49] found that soil active organic carbon has a significant contribution to the process of soil organic carbon mineralization. The results of this study are contrary to this, which may be due to the differences in vegetation type and soil type. The enrichment of soil salts in the surface layer will lead to poor plant growth, thus limiting the input and accumulation of soil organic carbon; the higher salinity will have a certain inhibitory effect on carbonate deposition, while unfavorable plant root growth will reduce the activity of soil organisms and slow the decomposition rate of soil organic matter, which in turn will reduce the partial pressure of soil CO2 and inhibit the formation of carbonate, indirectly affecting the change from soil organic carbon [24]. Zhao et al. showed that soil salinity has a significant effect on soil inorganic carbon content, and the higher soil salt content was adverse to the formation and accumulation of inorganic carbon, which in turn affects the distribution and transformation of carbon pools in soil [50].

5. Conclusions

The inorganic carbon content of soil in different continuous crop years was the highest in the 30a continuous cotton field soil and the lowest in the barren grass field soil; the organic carbon content was the highest in the 20a continuous cotton field soil and the lowest in the barren grass field soil; and the difference compared to other continuous crop years was significant (p < 0.05). The inorganic carbon content of soil along the soil profile showed an increasing trend, and the organic carbon content of soil was the opposite. The amount of soil CO2 fixed by different successions of cotton fields was highest in the moorland and lowest in the cotton fields with the 5a/10a continuous cropping years; the significant CO2 flow in the barren grass field soils has caused significant changes in soil inorganic carbon δ13C values, promoting the conversion process of soil organic carbon to inorganic carbon. The results of the redundancy analysis of the factors showed that soil water content, readily available carbon dioxide, and microbial amount of carbon were the main physicochemical factors affecting the amount of soil organic carbon changed to inorganic carbon.

Author Contributions

Conceptualization, L.G.; methodology, X.M. and L.G.; software, X.M.; validation, X.M. and L.G.; formal analysis, X.M.; investigation, X.M.; Resources, L.G. and X.M.; data curation, X.L.; writing—draft preparation and review, X.M. and L.G.; writing contributions, L.G., Y.Y., Z.D. and X.M.; visualization, X.M.; supervision, L.G.; project administration, L.G.; funding acquisition, L.G. All authors have read and agreed to the published version of the manuscript.

Funding

Natural Science Foundation of Xinjiang Uygur Autonomous Region of China (2020D01C035); the Scientific Research Program of the Higher Education Institution of Xinjiang (XJEDU2021I1005).

Data Availability Statement

Not applicable.

Conflicts of Interest

The authors declare no conflict of interest.

References

  1. Wang, Y.L.; Zhao, C.Y.; Ma, Q.L.; Li, Y.K.; Jing, H.J.; Sun, T.; Milne, E.; Easter, M.; Keith, P.; Au, Y.H.W.; et al. Carbon benefitsof wolfberry plantation on secondary saline land in Jingtai oasis, Gansu-a case study on application of the CBP model. J. Environ. Manag. 2015, 157, 303–310. [Google Scholar] [CrossRef] [Green Version]
  2. Bhattacharya, S.S.; Kim, K.H.; Das, S.; Uchimiya, M.; Jeon, B.H.; Kwon, E.; Szulejko, J.E. A review on the role of organic inputs in maintaining the soilcarbon pool of the terrestrial ecosystem. J. Environ. Manag. 2016, 167, 214–227. [Google Scholar] [CrossRef]
  3. Liao, Y.; Wu, W.L.; Meng, F.Q.; Smith, P.; Lal, R. Increase in soil organic carbon by agricultural intensification in northern China. Biogeosciences 2015, 12, 1403–1413. [Google Scholar] [CrossRef] [Green Version]
  4. Tong, J.H.; Hu, J.H.; Lu, Z.; Sun, H.R.; Yang, X.F. The impact of land use and cover change on soil organic carbon and total nitrogen storage in the Heihe River Basin: A meta-analysis. J. Geogr. Sci. 2019, 29, 1578–1594. [Google Scholar] [CrossRef] [Green Version]
  5. Nyachoti, S.; Jin, L.; Tweedie, C.E.; Ma, L. Insight into factors controlling formation rates of pedogenic carbonates: A combined geochemical and isotopic approach in dryland soils of the US Southwest. Chem. Geol. 2019, 527, 118503. [Google Scholar] [CrossRef]
  6. Zhang, Y.J.; Wang, J.P.; Wang, Y.; Zhang, X.C.; Zhen, Q.; Li, P.F. Spatial patterns of nitrogen and phosphorus in soil andtheir influencing factors in a typical agro-pastoral ecotonel. Environ. Sci. 2021, 42, 3010–3017. [Google Scholar]
  7. Srivastava, R.; Mohapatra, M.; Latare, A. Impact of land use changes on soil quality and species diversity in theVindhyan dry tropical region of India. J. Trop. Ecol. 2020, 36, 72–79. [Google Scholar] [CrossRef]
  8. Wang, J.P.; Wang, X.J.; Zhang, J.; Zhao, C.Y. Soil organic and inorganiccarbon and stable carbon isotopes in the Yanqi Basin of northwestern China. Eur. J. Soil Sci. 2015, 66, 95–103. [Google Scholar] [CrossRef]
  9. Su, Y.Z.; Wang, X.F.; Yang, R.; Jaehoon, L. Effects of sandy desertified land rehabilitation on soil carbon sequestration and aggregation in an arid region in China. J. Environ. Manag. 2010, 91, 2109–2116. [Google Scholar] [CrossRef]
  10. Zhang, L.H.; Xie, Z.K.; Wang, Y.J.; Guo, Z.H. The impact of land use changeon soil organic carbon and inorganic carbon contents at Loess Plateauin Longzhong. Chin. J. Soil Sci. 2013, 44, 119–125. [Google Scholar]
  11. Jin, X.X.; Wang, J.K.; Sun, L.J.; Yu, S.; Pei, J.B.; An, T.T.; Ding, F.; Gao, X.D.; Xu, Y.D. Progress of carbon cycle in farmlanoand sequestration in soil aggregates revealed by stable 13C isotope. Soils 2017, 49, 217–224. [Google Scholar]
  12. Zhao, Y.F.; Wang, X.; Ou, Y.S.; Jia, H.X.; Li, J.; Shi, C.M.; Liu, Y. Variations in soil δ13C with alpine meadow degradation on the eastern Qinghai-Tibet Plateau. Geoderma 2019, 338, 178–186. [Google Scholar] [CrossRef]
  13. Wei, Y.Y.; Cui, L.J.; Zhang, M.Y.; Liu, W.W.; Wang, D.A.; Yang, S.; Xiao, H.Y. Effect of exogenous carbon input on organic carbon mineralization and its temperature sensitivity in farmland and wetland soil in the North China Plain. Chin. J. Ecol. Agric. 2019, 27, 1463–1471. [Google Scholar]
  14. Zhang, Y.H.; Liu, F.; Zhong, S. Progress on soil inorganic carbon. Hubei Agric. Sci. 2021, 60, 5–9, 14. [Google Scholar]
  15. Magaritz, M.; Amiel, A. Influence ofintense cultivation and irrigation on soilpropertiesin the Jordon Valley, Israel: Recrystalli-zation ofcarbonate minerals. Soil Sci. 1986, 45, 201–205. [Google Scholar]
  16. An, S.; Mentler, A.; Mayer, H.; Blum, W.E. Soil aggregation, aggregate stability, organic carbon and nitrogen in different soil aggregate fractions under forest and shrub vegetation on the Loess Plateau, China. Catena 2010, 81, 226–233. [Google Scholar] [CrossRef]
  17. Rovira, P.; Aranjuelo, I.; Nowak, R.S.; Nogués, S. Limited carbon inputs from plants into soils in arid ecosystems: A study of changes in the δ13C in the soil-root interface. Plant Soil 2019, 443, 307–322. [Google Scholar] [CrossRef]
  18. An, S.Q.; Gong, L.; Li, Y.M.; Chen, X.; Sun, L. Soil organic carbon components and their correlation with soil physicochemical factors in four different land use types of the northern TarimBasin. Environ. Sci. 2018, 39, 3382–3390. [Google Scholar]
  19. Lv, Y.Z.; Li, B.G. Soil Science Experiment; China Agricultural Press: Beijing, China, 2010. [Google Scholar]
  20. Bucha, M.; Jidrysek, M.O.; Kufka, D.; Pleśniak, L.; Marynowski, L.; Kubiak, K.; Błaszczyk, M. Methanogenic fermentation of lignite with carbon- bearing additivesinferred from stable carbon and hydrogen isotopes. Int. J. Coal Geol. 2018, 186, 65–79. [Google Scholar] [CrossRef]
  21. Breecker, D.O.; Bergel, S.; Nadel, M.; Tremblay, M.M.; Orozco, R.O.; Larson, T.E.; Sharp, Z.D. Minor stablecarbon isotope fractionation between respired carbon dioxide and bulk soil organic matter during laboratory incubation of topsoil. Biogeochemistry 2015, 123, 83–98. [Google Scholar] [CrossRef]
  22. Bughio, M.A.; Wang, P.L.; Meng, F.Q.; Qing, C.; Kuzyakov, Y.; Wang, X.J.; Junejo, S.A. Neoformation of pedogenic carbonates by irrigation and fertilizationand their contribution to carbon sequestration in soil. Geoderma 2016, 262, 12–19. [Google Scholar] [CrossRef]
  23. Huang, Q.B.; Qin, X.Q.; Liu, P.Y.; Zhang, L.K.; Su, C.T. Proportion of pedogenic carbonates and the impact on carbonsink calculation in karst area with semiarid environment. Carsologica Sin. 2016, 35, 164–172. [Google Scholar]
  24. Zhang, L.; Sun, X.Y.; Cao, J.; Gao, C.D.; Bao YH, X.G. Transfer of soil organic carbon to soil inorganic carbon in carbonate rocksoil of desert grassland. Arid. Land Geogr. 2010, 33, 732–739. [Google Scholar]
  25. Li, X.G.; Li, F.M.; Rengel, Z.; Bhupinderpal, S.; Wang, Z.F. Cultivation effects on temporal Changes of organic carbon and aggregate stability in desert soils of Hexi Corridor region in China. Soil Tillage Res. 2006, 91, 22–29. [Google Scholar] [CrossRef]
  26. Mustafa, A.; Hu, X.; Abrar, M.M.; Shah SA, A.; Nan, S.; Saeed, Q.; Kamran, M.; Naveed, M.; Cid, M.C.; Gao, H.J.; et al. Long-term fertilization enhanced carbon mineralization and maize biomassthrough physical protection of organic carbon in fractions under continuous maize cropping. Appl. Soil Ecol. 2021, 165, 103971. [Google Scholar] [CrossRef]
  27. Majhi, P.; Rahman, F.H.; Bhattacharya, R. Continuous rice cropping system with integrated use of inorganic andorganic sources of nutrients for soil quality improvement. Int. J. Environ. Clim. Chang. 2021, 11, 109–123. [Google Scholar] [CrossRef]
  28. Du, M.Y.; Feng, H.Y.; Fan, S.H.; Su, W.H.; Mao, C.; Tang, X.L.; Liu, G.L. Effects of fertilization on vertical distribution and seasonal dynamics of soil organic carbon in Phyllostachys edulis forests, western Fujian province. Sci. Silvae Sin. 2017, 53, 12–20. [Google Scholar]
  29. Wang, Y.Q.; Shao, M.A.; Zhang, C.C.; Liu, Z.P.; Zou, J.L.; Xiao, J.F. Soil organic carbon in deep profiles under Chinese continental monsoon climate and its relations with land uses. Ecol. Eng. 2015, 82, 361–367. [Google Scholar] [CrossRef]
  30. Kuzyakov, Y. Priming effects: Interactions between living and dead organic matter. Soil Biol. Biochem. 2010, 42, 1363–1371. [Google Scholar] [CrossRef]
  31. Tan, W.F.; Zhang, R.; Cao, H.; Huang, C.Q.; Yang, Q.K.; Wang, M.K.; Koopal, L.K. Soil inorganic carbon stock under different soil types and land uses on the Loess Plateau region of China. Catena 2014, 121, 22–30. [Google Scholar] [CrossRef]
  32. Edwards, K.R.; Čížková, H.; Kateřina, M.Z.; Alžbětá, S. Nutrient addition effects on carbon fluxes in wet grasslands with either organic or mineral soil. Wetlands 2015, 35, 55–68. [Google Scholar] [CrossRef]
  33. Song, X.D.; Yang, F.; Wu, H.Y.; Zhang, J.; Li, D.C.; Liu, F.; Zhao, Y.G.; Yang, J.L.; Ju, B.; Cai, C.F.; et al. Significant loss of soil inorganic carbon at the continental scale. Natl. Sci. Rev. 2022, 9, 13–20. [Google Scholar] [CrossRef] [PubMed]
  34. Rong, J.R.; Li, C.H.; Wang, Y.G.; Tang, L.S.; Chen, X.M. Effects of long-term fertilization on organic and inorganic carbon in oasis farmland. Study Arid. Areas 2012, 29, 593–597. [Google Scholar]
  35. Guo, Y.; Li, X.L.; Wang, X.J.; Wang, J.P.; Wang, X.F.; Ma, M.G.; Xie, X.H.; Sun, M.M. Study on the vertical profile of soil in arid and semi-arid areas. J. Soil 2016, 53, 1433–1443. [Google Scholar]
  36. Bai, S.G. Characteristics of Inorganic Carbon Profile Distribution and Carbon Sequestration Potential in Soil with Different Salinity Levels; Inner Mongolia Normal University: Hohhot, China, 2018. [Google Scholar]
  37. Andrew, T.N.; Benjamin, L.T.; Andrew, W.S.; Edmund VJ, T. Nitrogen and phosphorus constrain labile and stable carbonturnover in lowland tropical forest soils. Soil Biol. Biochem. 2015, 80, 826–839. [Google Scholar]
  38. Su, Y.Z.; Zhang, K.; Liu, T.N.; Fan, G.P.; Wang, T. Changes in soil properties and accumulation of soilcarbon after cultivation of desert sandy land in a marginal oasis in Hexi corridor reqion Northwest China. Sci. Agric. Sin. 2017, 50, 1646–1654. [Google Scholar]
  39. Zhang, L.; Sun, X.Y.; Gao, C.D.; Qiao, Y.; Li, S.Y. lisuyan Study on CO2 sequestration during the formationand turnover of soil secondary carbonate in desert steppe. J. Soil 2011, 48, 578–586. [Google Scholar]
  40. Yan, M.F.; Fan, L.N.; Wang, L. Restoration of soil carbonwith different tree species in a post-mining land in eastern Loess Plateau, China. Ecol. Eng. 2020, 158, 106025. [Google Scholar] [CrossRef]
  41. Zhu, S.F.; Liu, C.Q.; Tao, F.X.; Wang, Z.L.; Pu, H.C. Stable carbon isotope geochemical characteristics of soil organic matter in karst areas. Earth Environ. 2006, 34, 51–58. [Google Scholar]
  42. Lei, W.J.; Gu, G.A. Aridsoil pedogenesis and the main diagnosis layer division basis inChina[C]//GONG Zitong. In The Study of the Soil Classification System B Series: Exploration of Chinese Soil Taxonomy; Science Press: Beijing, China, 1992; pp. 73–98. [Google Scholar]
  43. Zhang, X.N.; Lv, G.H.; Gong, L.; Qin, L.; Li, C.J.; Sun, J.X.; Ren, M.L. Distribution characteristics of inorganic carbon of different soil types in Aibi Lake Wetland Nature Reserve in Xinjiang. J. Desert Res. 2013, 33, 1084–1090. [Google Scholar]
  44. Li, Z.W.; Liu, C.; Dong, Y.T.; Chang, X.F.; Nie, X.D.; Liu, L.; Xiao, H.B.; Lu, Y.M.; Zeng, G.M. Response of soil organic carbon and nitrogen stocks to soilerosion and land use types in the Loess hilly-gully region of China. Soil Tillage Res. 2017, 166, 1–9. [Google Scholar] [CrossRef]
  45. Gritsch, C.; Egger, F.; Zehetner, F.; Sophie, Z.B. The effect of temperature and moisture on trace gas emissions from deciduous and coniferous leaf liter. J. Geophys. Res. Biogeosciences 2016, 121, 1339–1351. [Google Scholar] [CrossRef] [Green Version]
  46. Yu, Z.H.; Lv, G.Y.; Wang, X.Y.; Xu, X.B.; Jia, D.X.; Wang, C.J. Effect of intensity on soil carbon and nitrogen and its stable isotopes in Inner Mongolia. J. Meadow 2022, 30, 544–552. [Google Scholar]
  47. Cao, Z.P.; Hu, C.; Ye, Z.N.; Wu, W.L. Effect of different soil fertilizer measures on microbial biomass carbon in high-yield farmland in North China. J. Ecol. 2006, 26, 1486–1493. [Google Scholar]
  48. Basile, D.L.; Balesdent, J.; Pellerin, S. Reviews and syntheses:the mechanisms underlying carbon storage in soil. Biogeosciences 2020, 17, 5223–5242. [Google Scholar] [CrossRef]
  49. Jagadamma, S.; Mayes, M.A.; Steinweg, J.M.; Schaeffer, S.M. Substrate quality alters microbial mineralization of added substrate and soil organic carbon. Biogeosciences Discuss. 2014, 11, 4451–4482. [Google Scholar] [CrossRef] [Green Version]
  50. Zhao, W.; Zhang, R.; Huang, C.Q.; Huang, C.Q.; Wang, B.Q.; Cao, H.; Koopal, L.K.; Tan, W.F. Effect of different vegetation cover on the vertical distribution of soil organic and inorganic carbon in the Zhifanggou Watershed on the loess plateau. Catena 2016, 139, 191–198. [Google Scholar] [CrossRef]
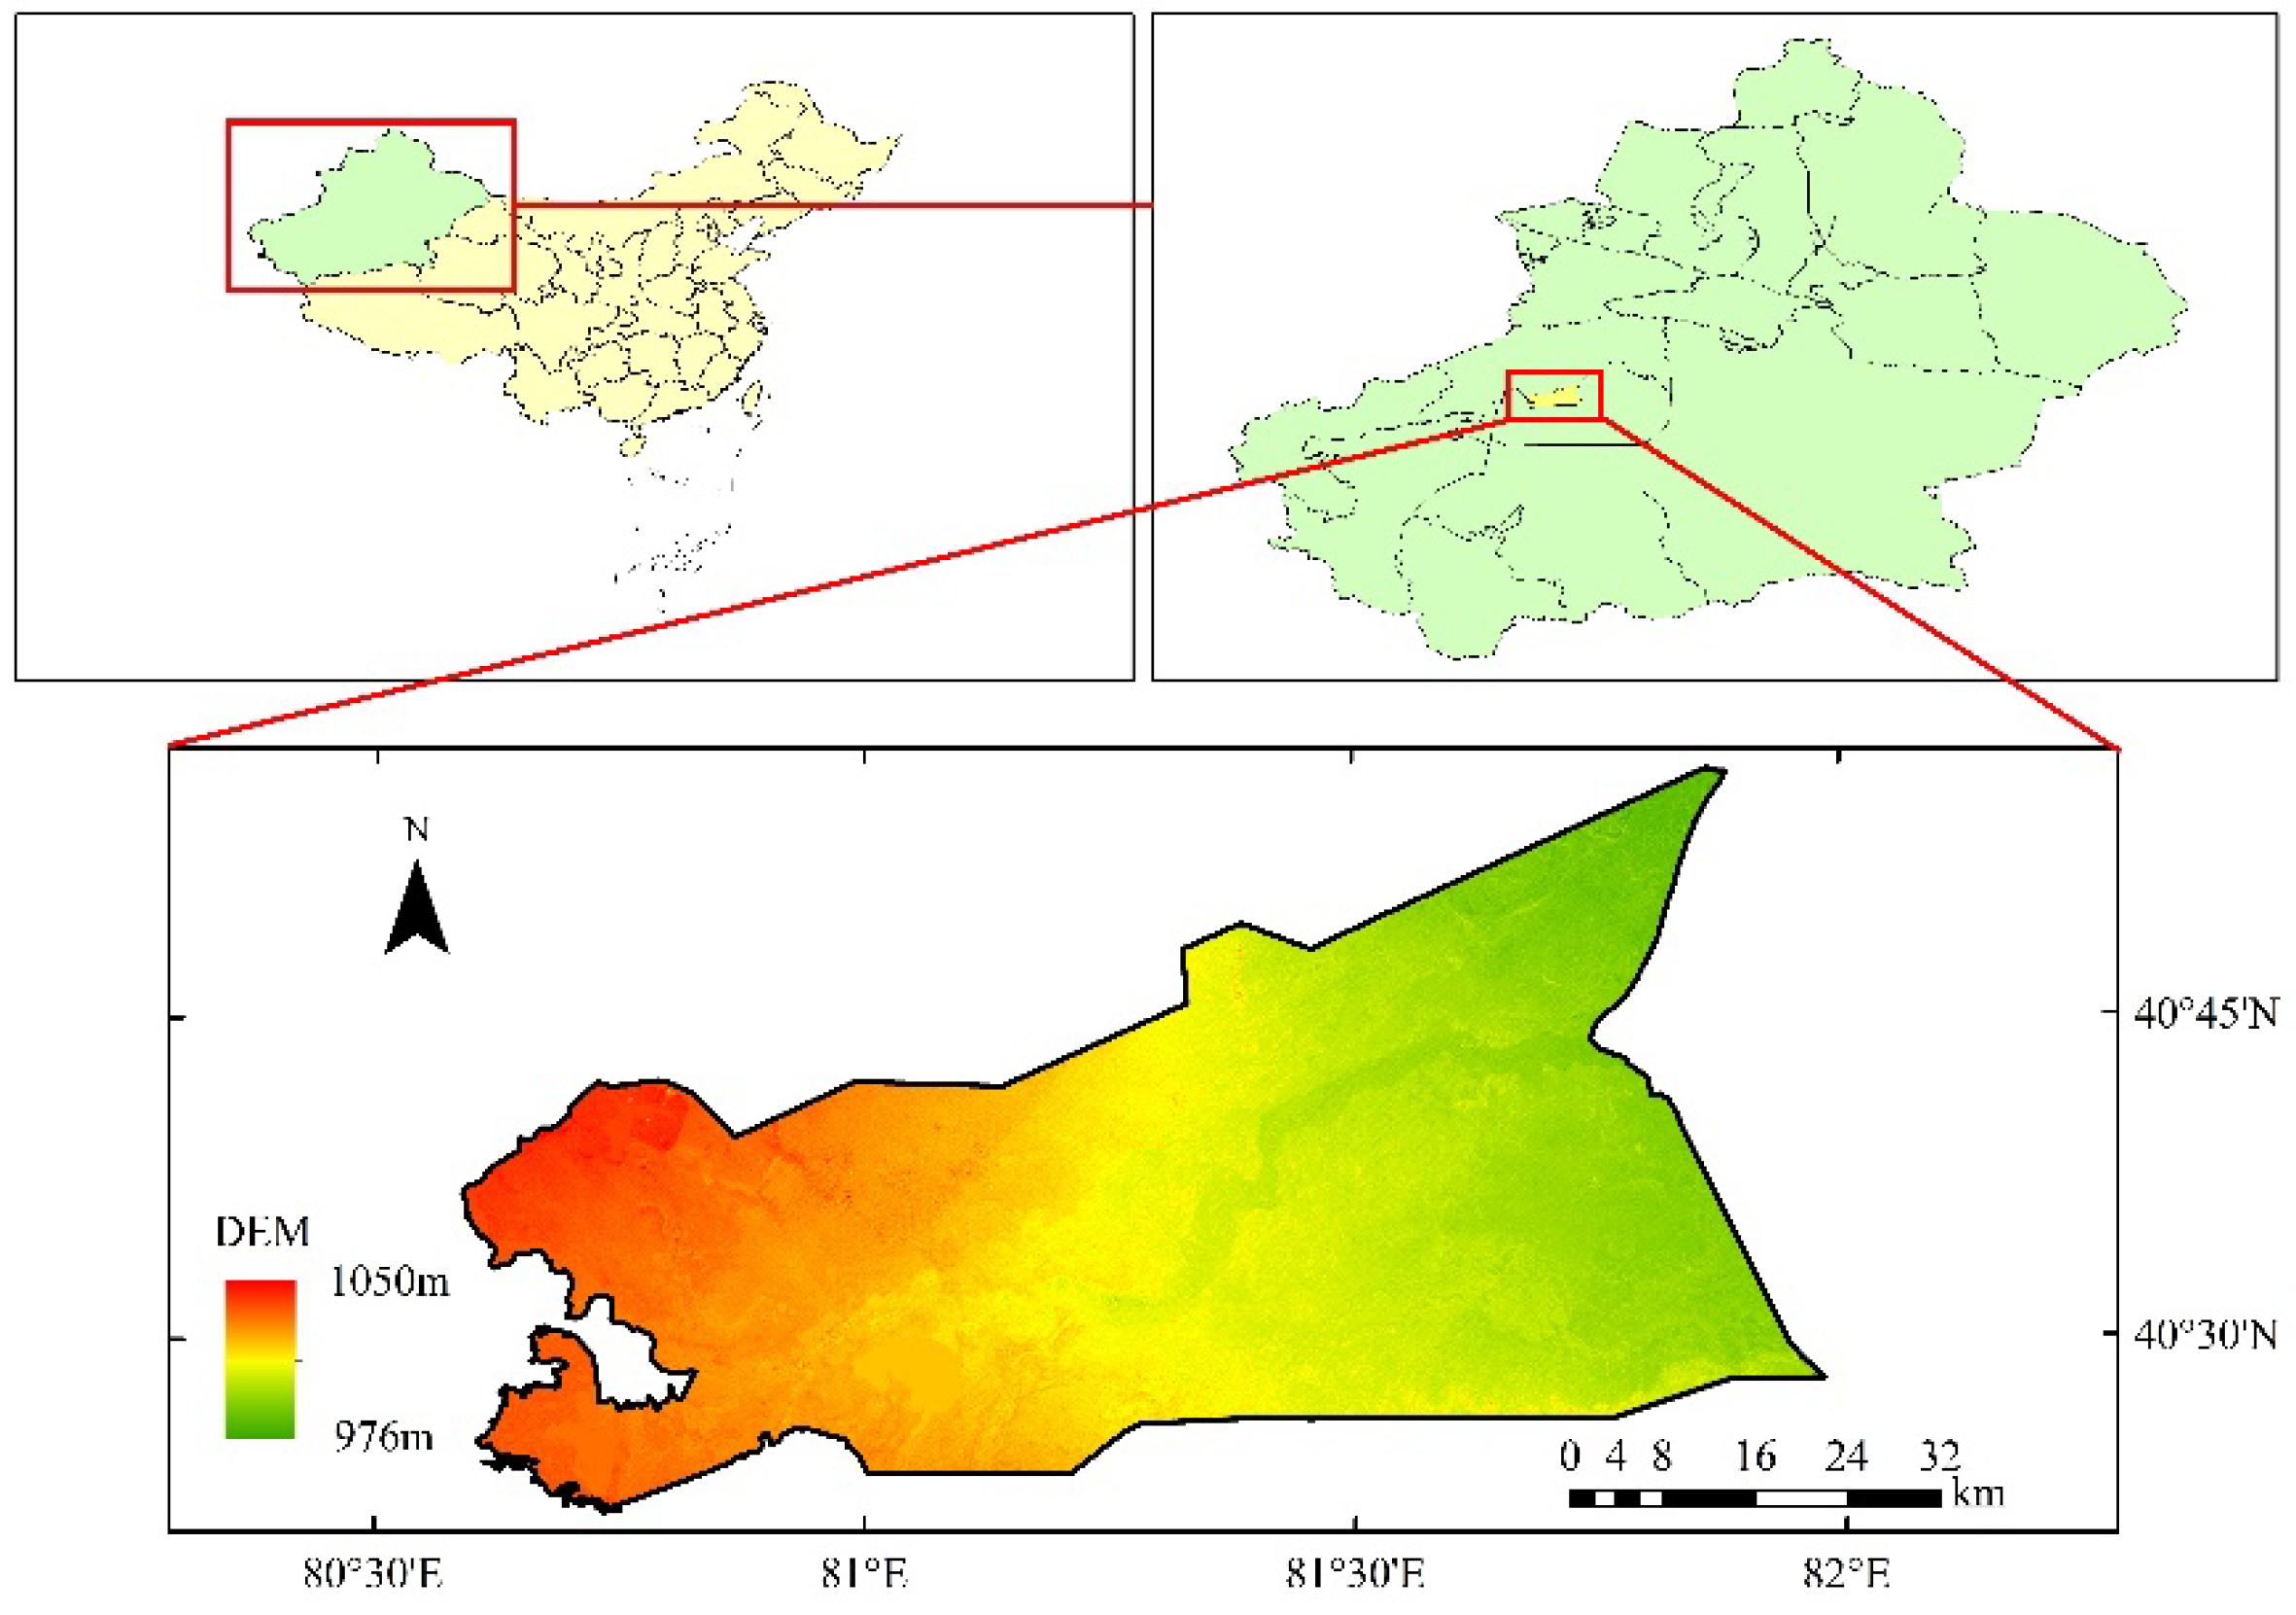
Figure 1. Map of the study area.
Agronomy 13 00804 g001
Figure 2. Profile distribution characteristics of soil SOC (a) and SIC (b) contents in cotton fields with different years of continuous cropping. Note: Different capital letters indicate significant differences between different soil depths in the same continuous cropping years, and different lowercase letters indicate significant differences between different continuous cropping years at the same soil depth; S indicates the main effect of different continuous cropping years, T indicates the main effect of different soil layers, and S*T indicates the interaction effect of different continuous cropping years and different soil layers; ** indicates a highly significant correlation (p < 0.01), and * indicates a significant correlation (p < 0.05).
Agronomy 13 00804 g002
Figure 3. Profile distribution characteristics of stable carbon isotope characteristic values (δ13C) of SIC (a) and CO2 (b) in cotton field soils with different continuous cropping years. Note: Different capital letters indicate significant differences between different soil depths in the same succession year, and different lowercase letters indicate significant differences between different continuous cropping years at the same soil depth; S indicates the main effect of different continuous cropping years, T indicates the main effect of different soil layers, and S*T indicates the interaction effect of different continuous cropping years and different soil layers; ** indicates a highly significant correlation (p < 0.01), and * indicates a significant correlation (p < 0.05).
Agronomy 13 00804 g003
Figure 4. Stable carbon isotope characteristics of soil pedogenic carbonate (a) in cotton fields with different continuous crop years and its proportion (b) and content (c).
Agronomy 13 00804 g004
Figure 5. Sources of CO2 fixed by soil SIC and its carbon change/g·kg−1. (a) is the amount of CO2 from soil respiration, (b) the amount of CO2 from atmospheric fixation, and (c) the amount of CO2 from oxidative decomposition of SOC. Note: Different capital letters indicate significant differences between different soil depths for the same succession year, and different lowercase letters indicate significant differences between different continuous cropping years for the same soil depth; S indicates the main effect of different continuous cropping years, T indicates the main effect of different soil layers, and S*T indicates the interaction effect of different continuous cropping years with different soil layers; ** indicates highly significant correlation (p < 0.01), and * indicates significant correlation (p < 0.05).
Agronomy 13 00804 g005
Figure 6. Two-dimensional ranking diagram and correlation coefficient matrix of soil SOC to SIC change. a: δ13C-SIC; b: δ13C-CO2; A: soil water content; B: soil bulk weight; C: pH; D: total salt; E: total nitrogen; F: effective phosphorus; G: fast-acting potassium; H: readily available carbon; I: water-soluble carbon; J: microbial biomass carbon. Note: ** indicates highly significant correlation (p < 0.01), * indicates significant correlation (p < 0.05).
Agronomy 13 00804 g006aAgronomy 13 00804 g006b
Table 1. Significance ranking and significance test results for the explanation of physical and chemical environmental variables.
Physical and Chemical FactorsThe Importance of RankingInterpretation of Quantity/%FP
Soil water content144.318.50.002
Readily available carbon231.516.80.002
Microbial biomass carbon38.85.00.006
Total salt44.52.70.082
Water-soluble carbon52.91.70.184
Effective phosphorus63.32.00.200
Soil bulk weight71.91.20.348
Fast-acting potassium81.10.70.556
Total nitrogen90.90.50.720
pH100.80.50.856
Disclaimer/Publisher’s Note: The statements, opinions and data contained in all publications are solely those of the individual author(s) and contributor(s) and not of MDPI and/or the editor(s). MDPI and/or the editor(s) disclaim responsibility for any injury to people or property resulting from any ideas, methods, instructions or products referred to in the content.